
Exploring Nationwide Oyster Aquaculture Data: An Index to Compare Regulatory, Production, and Economic Attributes of Oyster Aquaculture Among U.S. States and Regions

Abstract
1. Introduction
2. Methods
2.1. Study Area
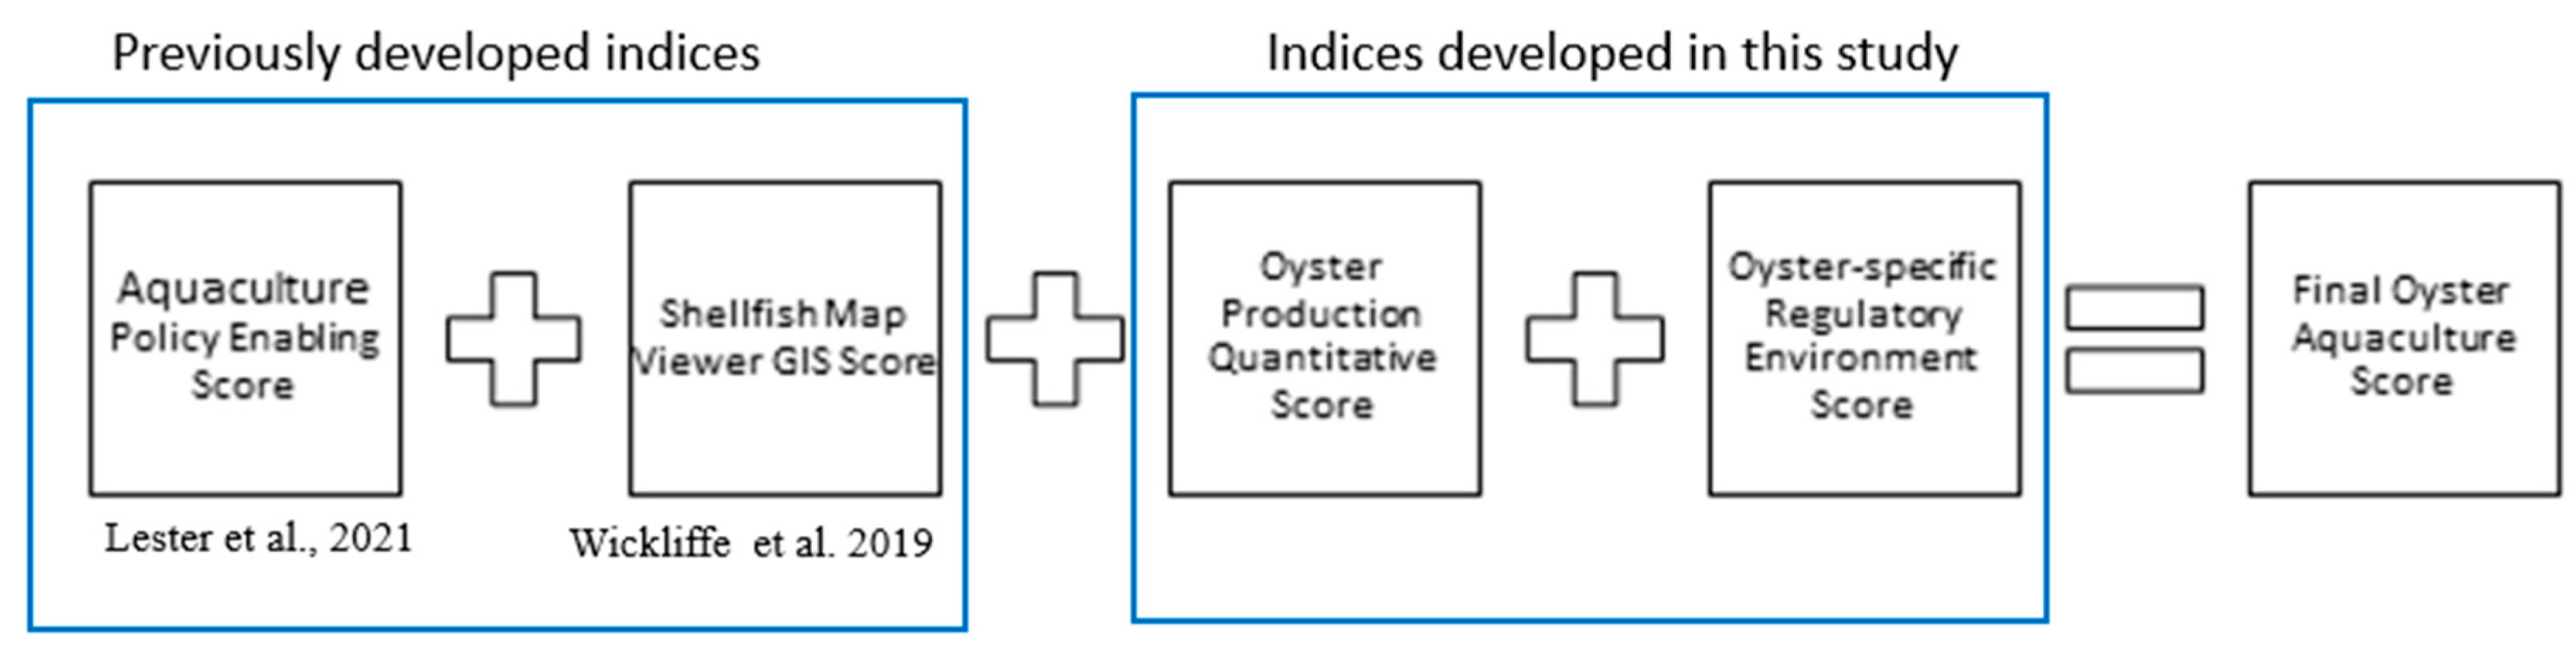
2.2. Index Development
2.3. Existing Indices
2.4. Indices Created for This Study
2.5. Data Synthesis
3. Results
3.1. Results of Oyster Production Quantitative Score
3.2. Results of Oyster-Specific Regulatory Score
3.3. Results and Scoring of Final Oyster Aquaculture Score
4. Discussion
4.1. Regional Comparisons
4.2. Regional Differences in Fishery Management
4.3. Limitations of an Index-Based Approach and Data Management
5. Conclusions
Funding
Institutional Review Board Statement
Informed Consent Statement
Data Availability Statement
Acknowledgments
Conflicts of Interest
References
- Wilberg, M.J.; Livings, M.E.; Barkman, J.S.; Morris, B.T.; Robinson, J.M. Overfishing, Disease, Habitat Loss, and Potential Extirpation of Oysters in Upper Chesapeake Bay. Mar. Ecol. Prog. Ser. 2011, 436, 131–144. [Google Scholar] [CrossRef]
- Beck, M.W.; Brumbaugh, R.D.; Airoldi, L.; Carranza, A.; Coen, L.D.; Crawford, C.; Defeo, O.; Edgar, G.J.; Hancock, B.; Kay, M.C.; et al. Oyster Reefs at Risk and Recommendations for Conservation, Restoration, and Management. BioScience 2011, 61, 107–116. [Google Scholar] [CrossRef]
- Parker, M.; Bricker, S. Sustainable Oyster Aquaculture, Water Quality Improvement, and Ecosystem Service Value Potential in Maryland Chesapeake Bay. J. Shellfish. Res. 2020, 39, 269–281. [Google Scholar] [CrossRef]
- Bricker, S.B.; Grizzle, R.E.; Trowbridge, P.; Rose, J.M.; Ferreira, J.G.; Wellman, K.; Zhu, C.; Galimany, E.; Wikfors, G.H.; Saurel, C.; et al. Bioextractive Removal of Nitrogen by Oysters in Great Bay Piscataqua River Estuary, New Hampshire, USA. Estuaries Coasts 2020, 43, 23–38. [Google Scholar] [CrossRef]
- Lima, A.R.; Pollack, J.; Fox, J.M.; Ferreira, J.G.; Cubillo, A.M.; Reisinger, A.; Bricker, S. Developing Nitrogen Bioextraction Economic Value via Off-Bottom Oyster Aquaculture in the Northwestern Gulf of Mexico. Mar. Pollut. Bull. 2025, 211, 117396. [Google Scholar] [CrossRef]
- Luckenbach, M.W.; Mann, R.; Wesson, J.A. Oyster Reef Habitat Restoration: A Synopsis and Synthesis of Approaches. In Proceedings of the Symposium, Williamsburg, VA, USA, April 1995. [Google Scholar] [CrossRef]
- Peterson, C.H.; Grabowski, J.H.; Powers, S.P. Estimated Enhancement of Fish Production Resulting from Restoring Oyster Reef Habitat: Quantitative Valuation. Mar. Ecol. Prog. Ser. 2003, 264, 249–264. [Google Scholar] [CrossRef]
- Fisheries, N. National Shellfish Initiative|NOAA Fisheries. Available online: https://www.fisheries.noaa.gov/national/aquaculture/national-shellfish-initiative (accessed on 14 March 2025).
- Naylor, R.L.; Hardy, R.W.; Bureau, D.P.; Chiu, A.; Elliott, M.; Farrell, A.P.; Forster, I.; Gatlin, D.M.; Goldburg, R.J.; Hua, K.; et al. Feeding Aquaculture in an Era of Finite Resources. Proc. Natl. Acad. Sci. USA 2009, 106, 15103–15110. [Google Scholar] [CrossRef]
- Barrett, L.T.; Theuerkauf, S.J.; Rose, J.M.; Alleway, H.K.; Bricker, S.B.; Parker, M.; Petrolia, D.R.; Jones, R.C. Sustainable Growth of Non-Fed Aquaculture Can Generate Valuable Ecosystem Benefits. Ecosyst. Serv. 2022, 53, 101396. [Google Scholar] [CrossRef]
- Nelson, K.A.; Leonard, L.A.; Posey, M.H.; Alphin, T.D.; Mallin, M.A. Using Transplanted Oyster (Crassostrea virginica) Beds to Improve Water Quality in Small Tidal Creeks: A Pilot Study. J. Exp. Mar. Biol. Ecol. 2004, 298, 347–368. [Google Scholar] [CrossRef]
- Jones, A.B.; Preston, N.P. Sydney Rock Oyster, (Iredale & Roughley), Filtration of Shrimp Farm Effluent: The Effects on Water Quality. Aquac. Res. 1999, 30, 51–57. [Google Scholar] [CrossRef]
- Grabowski, J.H.; Peterson, C.H. Restoring Oyster Reefs to Recover Ecosystem Services. Theor. Ecol. Ser. 2007, 4, 281–298. [Google Scholar]
- FAO. The State of World Fisheries and Aquaculture 2024; FAO: Rome, Italy, 2024; ISBN 978-92-5-138763-4.
- National Marine Fisheries Service. 2020 Fisheries of the United States. 2022. Available online: https://s3.amazonaws.com/media.fisheries.noaa.gov/2025-01/FUS-2022-final3.pdf (accessed on 14 March 2025).
- USDA. 2012–2013 Census of Aquaculture–AgCensus. Available online: https://agcensus.library.cornell.edu/census_parts/2012-2013-census-of-aquaculture/ (accessed on 14 March 2025).
- USDA. 2018 Census of Aquaculture. Available online: https://www.nass.usda.gov/Publications/AgCensus/2017/Online_Resources/Aquaculture/index.php (accessed on 14 March 2025).
- USDA. 2023 Census of Aquaculture. Available online: https://www.nass.usda.gov/Publications/AgCensus/2022/Online_Resources/Aquaculture/index.php (accessed on 14 March 2025).
- Clyde, L.M. History of Oystering in the United States and Canada, Featuring the Eight Greatest Oyster Estuaries. Mar. Fish. Rev. 1996, 58, 1–79. [Google Scholar]
- Lavoie, R.E. Oyster Culture in North America: History, Present and Future 2009. Available online: https://worldoyster.org/wp/wp-content/uploads/2019/04/news_17e.pdf (accessed on 14 March 2025).
- Botta, R.; Asche, F.; Borsum, J.S.; Camp, E.V. A Review of Global Oyster Aquaculture Production and Consumption. Mar. Policy 2020, 117, 103952. [Google Scholar] [CrossRef]
- Izraelov, M.; Silber, J. An Assessment of the Global Food Security Index. Food Sec. 2019, 11, 1135–1152. [Google Scholar] [CrossRef]
- Valizadeh, N.; Hayati, D. Development and Validation of an Index to Measure Agricultural Sustainability. J. Clean. Prod. 2021, 280, 123797. [Google Scholar] [CrossRef]
- Movilla-Pateiro, L.; Mahou-Lago, X.M.; Doval, M.I.; Simal-Gandara, J. Toward a Sustainable Metric and Indicators for the Goal of Sustainability in Agricultural and Food Production. Crit. Rev. Food Sci. Nutr. 2021, 61, 1108–1129. [Google Scholar] [CrossRef]
- Fishery Health Index Progress Score–Food Systems Dashboard. Available online: https://www.foodsystemsdashboard.org/indicators/outcomes/environmental-impacts/fishery-health-index-progress-score (accessed on 13 March 2025).
- NMFS. Report-State-by-State-Summary-of-Shellfish-Aquaculture-Leasing-Permitting-Requirements-2021. Available online: https://www.fisheries.noaa.gov/s3//2021-09/Report-State-by-State-Summary-of-Shellfish-Aquaculture-Leasing-Permitting-Requirements-2021.pdf (accessed on 14 March 2025).
- Lester, S.E.; Gentry, R.R.; Lemoine, H.R.; Froehlich, H.E.; Gardner, L.D.; Rennick, M.; Ruff, E.O.; Thompson, K.D. Diverse State-Level Marine Aquaculture Policy in the United States: Opportunities and Barriers for Industry Development. Rev. Aquac. 2022, 14, 890–906. [Google Scholar] [CrossRef]
- Wickliffe, L.C.; Crothers, V.C.; Theuerkauf, S.J.; Riley, K.L.; Morris, J.A. Shellfish Aquaculture Map Viewers: An Assessment of Design, Data, and Functions to Inform Planning and Siting in the United States. J. Shellfish. Res. 2019, 38, 209–221. [Google Scholar] [CrossRef]
- Silva, C.; Ferreira, J.G.; Bricker, S.B.; DelValls, T.A.; Martín-Díaz, M.L.; Yáñez, E. Site Selection for Shellfish Aquaculture by Means of GIS and Farm-Scale Models, with an Emphasis on Data-Poor Environments. Aquaculture 2011, 318, 444–457. [Google Scholar] [CrossRef]
- Bricker, S.B.; Getchis, T.L.; Chadwick, C.B.; Rose, C.M.; Rose, J.M. Integration of Ecosystem-Based Models into an Existing Interactive Web-Based Tool for Improved Aquaculture Decision-Making. Aquaculture 2016, 453, 135–146. [Google Scholar] [CrossRef]
- Saurel, C.; Taylor, D.P.; Tetrault, K. Bivalve Gardening. In Goods And Services of Marine Bivalves; Springer: Cham, Switzerland, 2019; ISBN 978-3-319-96776-9. [Google Scholar]
- Walton, W.C.; Swann, L. Role of Sea Grant in Establishing Commercial Oyster Aquaculture through Applied Research and Extension. J. Contemp. Water Res. Educ. 2021, 174, 171–179. [Google Scholar] [CrossRef]
- Fisheries One Stop Shop (FOSS)|NOAA Fisheries|Landings. Available online: https://www.fisheries.noaa.gov/foss/f?p=215:200:::::: (accessed on 14 March 2025).
- Rice, M.A. A Brief History of Oyster Aquaculture in Rhode Island. Rhode Island Coastal Resources Management Council. Aquac. Rhode Isl. 2006, 24–38. Available online: http://www.crmc.ri.gov/aquaculture/aquareport06.pdf (accessed on 13 March 2025).
- Torres-Soto, E. A Comparative Analysis of Maryland’s Public Participation Framework in Commercial Shellfish Aquaculture Leasing: Standing to Present Protests. Sea Grant L. Pol’y J. 2021, 11, 101–132. [Google Scholar]
- A Technical Efficiency Analysis of Hawaii’s Aquaculture Industry–Arita–2014–Journal of the World Aquaculture Society–Wiley Online Library. Available online: https://onlinelibrary.wiley.com/doi/abs/10.1111/jwas.12124 (accessed on 13 March 2025).
- Chen, J.Q.; Haws, M.C.; Fong, Q.S.W.; Leung, P. Economic Feasibility of Producing Oysters Using a Small-Scale Hawaiian Fishpond Model. Aquac. Rep. 2017, 5, 41–51. [Google Scholar] [CrossRef]
- Flannery, W.; Healy, N.; Luna, M. Exclusion and Non-Participation in Marine Spatial Planning. Mar. Policy 2018, 88, 32–40. [Google Scholar] [CrossRef]
- Bendell, L.I.; Wan, P.C.Y. Application of Aerial Photography in Combination with GIS for Coastal Management at Small Spatial Scales: A Case Study of Shellfish Aquaculture. J. Coast. Conserv. 2011, 15, 417–431. [Google Scholar] [CrossRef]
- Development of a Siting Tool for Sustainable Oyster Aquaculture in Texas. Available online: https://coastalscience.noaa.gov/project/development-of-a-siting-tool-for-sustainable-oyster-aquaculture-in-texas/ (accessed on 14 March 2025).
- Alaska Department of Fish and Game ArcGIS Web Application. Available online: https://adfg.maps.arcgis.com/apps/webappviewer/index.html?id=f3ca95493c1042b39e42a3ecb5dcad6a&_ga=2.262224652.1637086420.1691677984-320870341.1691677984 (accessed on 13 March 2025).
- Florida Department of Agriculture and Consumer Services. Shellfish Harvesting Area and Aquaculture Lease Map/Aquaculture/Agriculture Industry/Home–Florida Department of Agriculture & Consumer Services. Available online: https://www.fdacs.gov/Agriculture-Industry/Aquaculture/Shellfish-Harvesting-Area-and-Aquaculture-Lease-Map (accessed on 14 March 2025).
- Temby, O.; Sandall, J.; Cooksey, R.; Hickey, G.M. Examining the Role of Trust and Informal Communication on Mutual Learning in Government: The Case of Climate Change Policy in New York. Organ. Environ. 2017, 30, 71–97. [Google Scholar] [CrossRef]
- Lima, A.; Kim, D.; Song, A.M.; Hickey, G.M.; Temby, O. Trust and Influence in the Gulf of Mexico’s Fishery Public Management Network. Sustainability 2019, 11, 6090. [Google Scholar] [CrossRef]
- Hickey, G.M.; Roozee, E.; Voogd, R.; de Vries, J.R.; Sohns, A.; Kim, D.; Temby, O. On the Architecture of Collaboration in Inter-Organizational Natural Resource Management Networks. J. Environ. Manag. 2023, 328, 116994. [Google Scholar] [CrossRef]
- Katznelson, D.; Sohns, A.; Kim, D.; Roozee, E.; Donner, W.R.; Song, A.M.; de Vries, J.R.; Temby, O.; Hickey, G.M. Examining the Presence and Effects of Coherence and Fragmentation in the Gulf of Maine Fishery Management Network. Reg. Environ. Change 2024, 25, 3. [Google Scholar] [CrossRef]
- Temby, O.; Rastogi, A.; Sandall, J.; Cooksey, R.; Hickey, G.M. Interagency Trust and Communication in the Transboundary Governance of Pacific Salmon Fisheries. Rev. Policy Res. 2015, 32, 79–99. [Google Scholar] [CrossRef]
- Reeder-Myers, L.; Braje, T.J.; Hofman, C.A.; Elliott Smith, E.A.; Garland, C.J.; Grone, M.; Hadden, C.S.; Hatch, M.; Hunt, T.; Kelley, A.; et al. Indigenous Oyster Fisheries Persisted for Millennia and Should Inform Future Management. Nat. Commun. 2022, 13, 2383. [Google Scholar] [CrossRef] [PubMed]
- Darrow, E.S.; Carmichael, R.H.; Andrus, C.F.T.; Jackson, H.E. From Middens to Modern Estuaries, Oyster Shells Sequester Source-Specific Nitrogen. Geochim. Cosmochim. Acta 2017, 202, 39–56. [Google Scholar] [CrossRef]
- Rick, T.C.; Reeder-Myers, L.A.; Carr, M.J.; Hines, A.H. 3000 Years of Human Subsistence and Estuarine Resource Exploitation on the Rhode River Estuary, Chesapeake Bay, Maryland. J. N. Atl. 2017, 10, 113–125. [Google Scholar] [CrossRef]
- Marquardt, W.H. Shell Mounds in the Southeast: Middens, Monuments, Temple Mounds, Rings, or Works? Am. Antiq. 2010, 75, 551–570. [Google Scholar] [CrossRef]
- Kirby, M.X. Fishing down the Coast: Historical Expansion and Collapse of Oyster Fisheries along Continental Margins. Proc. Natl. Acad. Sci. USA 2004, 101, 13096–13099. [Google Scholar] [CrossRef]
- Gutierrez, C.P. The Social and Symbolic Uses of Ethnic/Regional Foodways. In Mardi Gras, Gumbo, and Zydeco: Readings in Louisiana Culture; University Press of Mississippi: Jackson, MS, USA, 2003; ISBN 978-1-57806-530-1. [Google Scholar]
- Mcclain, W.R.; Romaire, R.P. Crawfish Culture: A Louisiana Aquaculture Success Story. World Aquac. 2004, 35, 31–35. [Google Scholar]
- Harrington, R.J. Defining Gastronomic Identity: The Impact of Environment and Culture on Prevailing Components, Texture and Flavors in Wine and Food. J. Culin. Sci. Technol. 2005, 4, 129–152. [Google Scholar] [CrossRef]
- Love, D.C.; Asche, F.; Young, R.; Nussbaumer, E.M.; Anderson, J.L.; Botta, R.; Conrad, Z.; Froehlich, H.E.; Garlock, T.M.; Gephart, J.A.; et al. An Overview of Retail Sales of Seafood in the USA, 2017–2019. Rev. Fish. Sci. Aquac. 2022, 30, 259–270. [Google Scholar] [CrossRef]
- Malmberg, A.; Maskell, P. Towards an Explanation of Regional Specialization and Industry Agglomeration. Eur. Plan. Stud. 1997, 5, 25–41. [Google Scholar] [CrossRef]
- Coşar, A.K.; Fajgelbaum, P.D. Internal Geography, International Trade, and Regional Specialization. Am. Econ. J. Microecon. 2016, 8, 24–56. [Google Scholar] [CrossRef]
- Wirth, F.F.; Minton, T.M. A Review of the Market Structure of the Louisiana Oyster Industry: A Microcosm of the United States Oyster Industry. J. Shellfish Res. 2004, 23, 841–848. [Google Scholar]
- Othman, A.A.E. An International Index for Customer Satisfaction in the Construction Industry. Int. J. Constr. Manag. 2015, 15, 33–58. [Google Scholar] [CrossRef]
- Singh, R.K.; Kumar, P.; Chand, M. Evaluation of Supply Chain Coordination Index in Context to Industry 4.0 Environment. Benchmarking Int. J. 2019, 28, 1622–1637. [Google Scholar] [CrossRef]
- Cross, S.F. Diversification of aquaculture in North America. In Planning for Aquaculture Diversification: The Importance of Climate Change and Other Drivers; FAO: Rome, Italy, 2017. [Google Scholar]
- van Senten, J.; Engle, C.R.; Smith, M.A. Effects of COVID-19 on U.S. Aquaculture Farms. Appl. Econ. Perspect. Policy 2021, 43, 355–367. [Google Scholar] [CrossRef]
- Gladju, J.; Kamalam, B.S.; Kanagaraj, A. Applications of Data Mining and Machine Learning Framework in Aquaculture and Fisheries: A Review. Smart Agric. Technol. 2022, 2, 100061. [Google Scholar] [CrossRef]
- Gangnery, A.; Bacher, C.; Boyd, A.; Liu, H.; You, J.; Strand, Ø. Web-Based Public Decision Support Tool for Integrated Planning and Management in Aquaculture. Ocean Coast. Manag. 2021, 203, 105447. [Google Scholar] [CrossRef]
- Frankic, A.; Hershner, C. Sustainable Aquaculture: Developing the Promise of Aquaculture. Aquac. Int. 2003, 11, 517–530. [Google Scholar] [CrossRef]


| Metric | Point | Maximum Points |
|---|---|---|
| Reported Sales in 2012, 2017, and 2023 1 | One point for each data entry (2012, 2017, 2023). One point if within the top five highest reported sales. | 6 |
| Change in sales from 2012, 2017, and 2023 1 | One point for increase when positive from previous entry. | 2 |
| Reported number of Farms in 2012, 2017, and 2023 1 | One point for each data entry (2012, 2017, 2023). One point if within the five top states with highest numbers of farms. | 6 |
| Change in number of farms from 2012, 2017, and 2023 1 | One point for increase when positive from previous entry. | 2 |
| Average Yearly Shellfish Lease Applications 2 | One point for active shellfish applications. | 1 |
| Total Shellfish leases 2 | One point for data entry. One point if total in top five. | 2 |
| Acreage of shellfish aquaculture (#) 2 | One point for data entry. One point if in top five. | 2 |
| Leaseholders (#) 2 | One point for data entry. | 1 |
| Attribute | Rationale/Definition |
|---|---|
| Oyster Gardening (Personal Consumption) 1 | Oyster gardening is the practice of coastal landowners growing oysters, typically on piers or docks, for personal consumption. This represents an acceptance of aquaculture from the state’s perspective. |
| Aquaculture Parks 1 | Areas predetermined to be leasable for aquaculture, reducing cost and time associated with permitting. |
| State Training or Certification (not HACCP for the DFA) 2 | The state provides mandatory or voluntary training for growers. |
| Insurance Requirement 2 | Mandatory insurance to keep an active lease. |
| Lease Transferability 2 | The ability of a grower to sell, sublease, or other alternatives to complete farm removal. |
| “Use it or lose it” Active Use Criteria 2 | Farms must meet a productivity requirement to continue to hold the lease, usually providing some flexibility for the first years or through unforeseen environmental circumstances. |
| Residency Requirement 2 | The leaseholder must be a resident of the state they are leasing from. Residency requirements may prevent investment from outside of the state. However, residency requirements may ensure that local economies are the focus of aquaculture endeavors, and there is a greater focus on the community and other stakeholders who share the ecosystem. |
| Joint Permit Application (JPA) 2 | States have worked with federal partners to create documentation that serves both entities, typically with the USACE. |
| Applicant Guide 2 | Additional guidance to permitting is provided online or through a .pdf that anyone can easily access at any time. |
| Process Flow Chart 2 | A visual, graphic, or flow chart helps applicants understand other organizations’ timelines and hierarchal requirements. |
| Operational Plan Requirement 2 | An operational plan is required to be issued a lease from the state’s natural resource agency. |
| Financial Plan Requirement 2 | A financial plan is required to be issued a lease from the state’s natural resource agency. |
| Index Component and Source | Rationale | Calculation | Contribution to Final Score |
|---|---|---|---|
| “Policy Enabling Score” [27] | Used to understand the overall acceptance and popularity of aquaculture within a state. | Total “Aquaculture Enabling Policy Score” (0–8) | 25% |
| “Shellfish Map Viewer” GIS Score [28] | State infrastructure and data management are required for decision making and industry longevity. | Total “Number of Data Layers per Category” (0–27) | 25% |
| Oyster Production Quantitative Score | A measure of oyster aquaculture output, such as the number of farms and value of sales. | Point system described in Table 2 (0–22) | 25% |
| Oyster-Specific Regulatory Environment Score | A focused approach to understanding regulations directly aimed at oyster aquaculture production. | Number of oyster-specific attributes that states engage in (0–12) | 25% |
| Region | State | Policy Enabling Score (Lester) | Shellfish Map Viewer Score (Wickliffe) | Oyster Production Quantitative Score | Oyster-Specific Regulatory Environment | Total |
|---|---|---|---|---|---|---|
| North Pacific | AK | 0.81 | 0.00 | 0.45 | 0.58 | 1.85 |
| Pacific | CA | 0.69 | 0.00 | 0.64 | 0.42 | 1.74 |
| OR | 0.44 | 0.00 | 0.50 | 0.58 | 1.52 | |
| WA | 0.81 | 0.78 | 0.77 | 0.67 | 3.03 | |
| Western Pacific | HI | 0.56 | 0.00 | 0.23 | 0.17 | 0.96 |
| New England | CT | 0.63 | 1.00 | 0.59 | 0.58 | 2.80 |
| MA | 0.88 | 0.81 | 0.91 | 0.50 | 3.10 | |
| ME | 0.44 | 0.52 | 0.55 | 0.58 | 2.08 | |
| NH | 0.00 | 0.33 | 0.41 | 0.33 | 1.07 | |
| RI | 0.75 | 0.52 | 0.50 | 0.75 | 2.52 | |
| Mid-Atlantic | DE | 0.81 | 0.11 | 0.23 | 0.58 | 1.73 |
| MD | 0.88 | 0.74 | 0.36 | 0.67 | 2.65 | |
| NJ | 1.00 | 0.96 | 0.50 | 0.50 | 2.96 | |
| NY | 0.50 | 0.26 | 0.50 | 0.83 | 2.09 | |
| VA | 0.50 | 0.74 | 0.77 | 0.75 | 2.76 | |
| South Atlantic | FL | 1.00 | 0.00 | 0.50 | 0.75 | 2.25 |
| GA | 0.56 | 0.52 | 0.09 | 0.58 | 1.75 | |
| NC | 0.69 | 0.78 | 0.64 | 0.58 | 2.68 | |
| SC | 0.44 | 0.15 | 0.36 | 0.58 | 1.53 | |
| Gulf of Mexico | AL | 0.31 | 0.81 | 0.45 | 0.58 | 2.16 |
| FL | 1.00 | 0.00 | 0.50 | 0.75 | 2.25 | |
| LA | 0.56 | 0.00 | 0.64 | 0.33 | 1.53 | |
| TX | 0.19 | 0.30 | 0.18 | 0.33 | 1.00 | |
| MS | 0.44 | 0.00 | 0.05 | 0.67 | 1.15 |
| State | Oyster Gardening | Aquaculture Parks | State Training | Insurance Requirement | Transferable Lease | Active Use Criteria | Residency Requirement |
|---|---|---|---|---|---|---|---|
| AL | Y | Y | Y | N | Y | N | N |
| AK | N | N | Y | Y | Y | Y | N |
| CA | N | N | N | N | Y | Y | N |
| CT | No Info | No Info | Y | N | Y | Y | C |
| DE | Y | Y | Y | N | Y | Y | N |
| FL | Y | Y | Y | N | Y | Y | N |
| GA | No Info | N | Y | Y | Y | Y | N |
| HI | N | N | N | No Info | No Info | No Info | N |
| LA | No Info | N | Y | N | Y | N | Y |
| ME | No Info | N | C | N | Y | Y | N |
| MD | Y | No Info | Y | Y | Y | Y | N |
| MA | Y | Y | N | N | Y | Y | C |
| MS | N | Y | C | Y | Y | Y | Y |
| NH | No Info | N | N | N | Y | N | Y |
| NJ | N | Y | Y | N | Y | N | Y |
| NY | Y | Y | N | N | Y | Y | Y |
| NC | Y | N | Y | N | Y | Y | N |
| OR | N | Y | N | N | Y | Y | N |
| RI | Y | N | Y | Y | Y | Y | N |
| SC | No Info | N | Y | N | N | Y | Y |
| TX | N | N | N | N | N | Y | Y |
| VA | Y | Y | Y | N | Y | Y | Y |
| WA | Y | N | Y | N | Y | Y | N |
| Percent | 43% | 39% | 61% | 22% | 87% | 78% | 35% |
| State | Joint Permit Application (JPA) | Applicant Guide | Process Flow Chart | Operational Plan Requirement | Financial Plan Requirement | Total Attributes per State | Final Oyster-Specific Regulatory Environment Score |
| AL | Y | Y | N | Y | N | 7 | 0.58 |
| AK | N | Y | Y | Y | N | 7 | 0.58 |
| CA | N | Y | Y | Y | N | 5 | 0.42 |
| CT | Y | Y | Y | Y | N | 7 | 0.58 |
| DE | Y | Y | N | C | C | 7 | 0.58 |
| FL | N | Y | Y | Y | Y | 9 | 0.75 |
| GA | N | Y | N | Y | Y | 7 | 0.58 |
| HI | N | Y | N | Y | N | 2 | 0.17 |
| LA | Y | N | N | N | N | 4 | 0.33 |
| ME | Y | Y | Y | Y | Y | 7 | 0.58 |
| MD | Y | Y | N | Y | N | 8 | 0.67 |
| MA | N | Y | N | Y | C | 6 | 0.50 |
| MS | Y | N | N | Y | Y | 8 | 0.67 |
| NH | N | Y | N | Y | N | 4 | 0.33 |
| NJ | N | Y | N | Y | N | 6 | 0.50 |
| NY | Y | Y | Y | Y | Y | 10 | 0.83 |
| NC | N | Y | Y | Y | Y | 7 | 0.58 |
| OR | Y | Y | Y | Y | N | 7 | 0.58 |
| RI | Y | Y | Y | Y | N | 9 | 0.75 |
| SC | Y | N | Y | Y | Y | 7 | 0.58 |
| TX | N | Y | N | Y | N | 4 | 0.33 |
| VA | Y | Y | N | Y | N | 9 | 0.75 |
| WA | Y | Y | Y | Y | N | 8 | 0.67 |
| Percent | 57% | 87% | 48% | 91% | 30% |
| Region | Policy Enabling Score [27] | Shellfish Map Viewer Score [28] | Oyster Production Quantitative Score | Oyster-Specific Regulatory Environment | Regional Average Total |
|---|---|---|---|---|---|
| North Pacific | 0.81 | 0.00 | 0.45 | 0.58 | 1.84 |
| Pacific | 0.65 | 0.26 | 0.64 | 0.56 | 2.10 |
| Western Pacific | 0.56 | 0.00 | 0.23 | 0.17 | 0.96 |
| New England | 0.54 | 0.64 | 0.59 | 0.55 | 2.31 |
| Mid-Atlantic | 0.74 | 0.56 | 0.47 | 0.67 | 2.44 |
| South Atlantic | 0.67 | 0.36 | 0.40 | 0.62 | 2.05 |
| Gulf of Mexico | 0.50 | 0.22 | 0.36 | 0.53 | 1.62 |
Disclaimer/Publisher’s Note: The statements, opinions and data contained in all publications are solely those of the individual author(s) and contributor(s) and not of MDPI and/or the editor(s). MDPI and/or the editor(s) disclaim responsibility for any injury to people or property resulting from any ideas, methods, instructions or products referred to in the content. |
© 2025 by the author. Licensee MDPI, Basel, Switzerland. This article is an open access article distributed under the terms and conditions of the Creative Commons Attribution (CC BY) license (https://creativecommons.org/licenses/by/4.0/).
Share and Cite
Lima, A.R. Exploring Nationwide Oyster Aquaculture Data: An Index to Compare Regulatory, Production, and Economic Attributes of Oyster Aquaculture Among U.S. States and Regions. Fishes 2025, 10, 138. https://doi.org/10.3390/fishes10040138
Lima AR. Exploring Nationwide Oyster Aquaculture Data: An Index to Compare Regulatory, Production, and Economic Attributes of Oyster Aquaculture Among U.S. States and Regions. Fishes. 2025; 10(4):138. https://doi.org/10.3390/fishes10040138
Chicago/Turabian StyleLima, Anthony R. 2025. "Exploring Nationwide Oyster Aquaculture Data: An Index to Compare Regulatory, Production, and Economic Attributes of Oyster Aquaculture Among U.S. States and Regions" Fishes 10, no. 4: 138. https://doi.org/10.3390/fishes10040138
APA StyleLima, A. R. (2025). Exploring Nationwide Oyster Aquaculture Data: An Index to Compare Regulatory, Production, and Economic Attributes of Oyster Aquaculture Among U.S. States and Regions. Fishes, 10(4), 138. https://doi.org/10.3390/fishes10040138