Article

Impact of Dietary Glutamate on Growth Performance and Flesh Quality of Largemouth Bass

by
Bo Zhao
1,†,
Ju Zhao
1,†,
Haifeng Liu
1,
Hailong Zhang
1,
Hongying Shan
1,
Jiali Zong
1,
Quanquan Cao
1,* and
Jun Jiang
1,2,*
1
College of Animal Science and Technology, Sichuan Agricultural University, Chengdu 611130, China
2
Fish Nutrition and Safety Production University Key Laboratory of Sichuan Province, Sichuan Agricultural University, Ya’ an 625014, China
*
Authors to whom correspondence should be addressed.
These authors contributed equally to this work.
Fishes 2025, 10(4), 151; https://doi.org/10.3390/fishes10040151
Submission received: 25 February 2025 / Revised: 28 March 2025 / Accepted: 28 March 2025 / Published: 31 March 2025
(This article belongs to the Section Nutrition and Feeding)

Abstract

:
The influence of dietary glutamate (Glu) was evaluated in a 56-day feeding trial on the growth performance and flesh quality of largemouth bass (Micropterus salmoides). A total of 1170 fish (average body weight 24.05 ± 0.22 g) were randomly allocated into six groups, with three replicates per group. They were fed diets containing Glu in levels of 11.40% (G1), 11.88% (G2), 12.53% (G3), 13.27% (G4), 14.33% (G5), and 15.62% (G6). We found that, over a 56-day feeding period, the final body weight (FBW) of largemouth bass was about 4–5 times the IBW. The FBW, percent weight gain (PWG), specific growth rate (SGR), feed efficiency (FE), and protein efficiency ratio (PER) initially increased and then decreased with elevating dietary Glu levels. Likewise, protein content, lipid content, apparent digestibility coefficient of dry matter (ADCD), and apparent digestibility coefficient of protein (ADCP) followed a similar pattern. Supplementation with Glu significantly improved the hepatosomatic index (HSI), viscerosomatic index (VSI), and relative gut length (RGL). Moreover, dietary Glu augmentation noticeably enhanced flesh composition such as muscle protein, ash, lipid, amino acid contents, and polyunsaturated fatty acids (PUFAs). Furthermore, dietary Glu supplementation enhanced muscle physicochemical quality (such as drip loss and pH), textural properties (adhesiveness and cohesiveness), and biochemical indices such as total protein (TP) and salt-soluble protein, while decreasing muscle cathepsin B (CtsB) and lactate dehydrogenase (LD) contents, thereby improving flesh quality. In conclusion, these findings suggest that Glu plays a crucial role in enhancing both growth performance and muscle quality in largemouth bass. The optimal dietary requirement for juvenile largemouth bass was estimated to be approximately 125.1 g/kg of diet based on SGR analysis.
Key Contribution: This study was conducted to investigate the effects of dietary Glu on the growth performance and flesh quality of largemouth bass. The dietary Glu requirement was determined to be 125.1 g/kg diet by SGR analysis.

1. Introduction

Glutamate (Glu) plays a crucial role in signaling, cell metabolism, and protein synthesis [1]. It is among the most abundant amino acids (AAs) found in both fish feedstuffs and the fish body itself [2]. Previous research has demonstrated significant impacts of Glu on fish growth, protein retention, and gut health [3,4,5]. In grass carp (Ctenopharyngodon Idella) [5], rainbow trout (Oncorhynchus mykiss) [6], and carp (Cyprinus carpio) [7], studies have shown that dietary Glu supplementation enhances growth and nutrient utilization. However, research on Atlantic salmon (Salmo salar) revealed no influence on growth and feed utilization upon adding Glu to the diet [8]. This may be related to factors such as fish size, species, rearing environment, and dietary composition, among other factors. Monosodium glutamate (MSG), the sodium salt of Glu, is widely used as a flavor enhancer due to its umami flavor [9,10]. While Glu is slightly acidic, MSG is more basic. MSG dissociates into L-Glu, acting as an energy substrate that could affect fish growth [11]. The largemouth bass (Micropterus salmoides) holds significant importance in Chinese freshwater aquaculture, contributing substantially to the economy, with its total aquaculture production reaching 702,100 tons in 2021 [12]. With aquaculture playing a significant role in providing high-quality protein for humans, Glu has been identified as one of the key amino acids for metabolism and health in fish tissues. In feed, most amino acids are present in the form of proteins, which are not only the foundation of life activities but also the main energy source for fish [5]. To date, related research has reported that Glu (0.4%) increased the growth performance of largemouth bass (47.81–58.94) [13]. Existing studies have focused on growth rate, but the effect of Glu on key nutrients (such as amino acid and fatty acid content) in largemouth bass muscle has not been fully elucidated.
Fish muscle tissue serves as a vital protein source for humans, and as consumer health awareness grows, there is increasing attention on the nutritional value of fish [14]. The nutritional quality of fish muscle can be evaluated through metrics such as the contents of protein, lipids, amino acids, and fatty acids present in the tissue [15]. Nutrient content, including protein, lipids, moisture, and ash, acts as key indicators of fish muscle’s nutritional quality [16,17]. Amino acids (AAs), the building blocks of proteins, along with the content and ratio of essential amino acids, are crucial determinants of muscle nutritional value [17]. Additionally, the composition of free amino acids (FAAs) significantly influences fish flavor, with specific amino acids such as glycine (Gly), alanine (Ala), Glu, and aspartic acid (Asp) contributing to flavor enhancement [18,19]. The first two have sweet tastes, while the last two have umami tastes [20]. The previous study demonstrated that Glu supplementation enhanced total essential amino acid and flavor amino acid concentrations in Jian carp (Cyprinus carpio var. Jian) [21] and triploid crucian carp [22]. The types and distribution levels of fatty acids (FAs) are critical for assessing the nutritional value of fats and are crucial precursors to meat flavor [23], with omega-3 fatty acids such as docosahexaenoic acid (DHA) and eicosapentaenoic acid (EPA) playing significant roles in human health [24]. Research on Jian carp has indicated that Glu supplementation can enhance the muscle content of DHA and EPA [21], suggesting a potential impact of Glu on flesh quality by modulating amino acid and fatty acid profiles, though further elucidation is necessary.
Fish flesh quality is influenced not only by amino and fatty acids but also by physicochemical, textural, and biochemical factors, directly impacting consumer sensory acceptance [25,26]. Limited studies have shown that Glu can increase pH value (6.62) and decrease cooking loss (15.47) in Jian carp [21] and increase muscle springiness in triploid crucian carp [22]. Additionally, key biochemical indices (CtsB, CtsL, lactic acid (LD), total protein (TP), and water-salt-soluble proteins) critically influence flesh quality, with studies suggesting dietary modulation of these factors can enhance muscle quality in hybrid bagrid catfish (Pelteobagrus vachelli♀ × Leiocassis longirostris♂) [27]. It remains to be seen whether dietary Glu can similarly improve largemouth bass flesh quality by influencing physicochemical qualities, textural properties, and biochemical indices.
Glu serves as one of the important flavor amino acids; Glu can act synergistically with inosine monophosphate (IMP) and guanylic acid (GMP) to produce a multiplicative umami effect. The largemouth bass has tender and delicious flesh with few bones and high nutritional value, and it is highly popular in the market. Its flesh is rich in amino acids, especially umami-enhancing amino acids and essential amino acids, making the largemouth bass a high-quality edible fish. However, the impact of Glu on the production performance and flesh quality in largemouth bass has not been investigated. Hence, the primary objective of this study is to examine the effects of dietary Glu addition in largemouth bass feed on production performance and flesh quality. This study aims to determine the optimal dietary Glu level for improving growth performance and flesh quality in largemouth bass. The results may guide future nutritional strategies in aquaculture.

2. Materials and Methods

2.1. Diet Formulation

Formulations and chemical compositions of the diets are detailed in Table 1. Primary protein sources in all diets included fish meal, chicken powder, extruded soybean meal, Clostridium autoethanogenum protein, and soy protein concentrate. Soybean oil and soy lecithin oil powder were chosen as the main lipid sources, while strong flour and cassava starch served as the primary starch sources. Glu was obtained from Suzhou Hexing Food Co., Ltd. (Jiangsu, China), with a purity of ≥99%. The 6 isoenergetic diets were supplemented with Glu (0%, 0.6%, 1.2%, 1.8%, 2.4%, and 3.0%) to provide Glu at the concentrations of 11.40% (G1), 11.88% (G2), 12.53% (G3), 13.27% (G4), 14.33% (G5), and 15.62% (G6) in the diets. Increased Glu levels were compensated by decreasing equal levels of microcrystalline cellulose. Differences in the amino acid composition of diets were negligible, as shown in Table 2. The diets were extruded with a twin-screw expander equipped with a 4 mm die. Subsequently, the diets were coated with oil using a vacuum coater. All diets were air-dried in a shaded area and kept at 4 °C until utilized.

2.2. Feeding Trial

The feeding experiment was conducted at the Ya’an Experiment Station (Sichuan, China). Fish were sourced from the Chongzhou Lishuiwan Ecological Agriculture Co., Ltd. (Chongzhou, Sichuan, China). The fish were fed a commercial diet (crude protein, 51%; crude lipid, 12%) for 4 weeks prior to the formal feeding experiment. Prior to the trial, fish were not fed for 24 h. A total of 1170 juvenile largemouth bass of similar sizes (24.05 ± 0.22 g) were randomly distributed into 18 concrete tanks (2.0 × 1.0 × 1.05 m3) at 65 fish per tank. Over the eight-week study period, fish were fed their specific diets to apparent fullness twice daily (at 8:00 and 18:00) in alignment with natural light–dark cycles. Any uneaten feed was collected 40 min after each feeding session and subsequently dried in an oven at 65 °C to determine the feed intake (FI). Water quality parameters including dissolved oxygen, temperature, pH, nitrite, and ammonia levels were consistently detected (25 ± 2 °C, 5 mg/L, 7.0 ± 0.3, <0.05 mg/L, <0.5 mg/L). Each tank had a wide stretch of water with a pump operating at a rate of 1.2 L/min.

2.3. Fish Sampling

At the beginning of the feeding trial, six largemouth bass were randomly selected and frozen at negative 20 degrees for initial composition analysis. At the trial’s conclusion, after a 24-h fasting period, the fish were anesthetized with a tricaine methanesulfonate (MS-222; 1%, Sigma, Saint Louis, MI, United States) solution, and fish in each tank were counted and weighed. For final composition analysis, three fish from each tank were preserved at −20 °C. Additionally, 15 fish from each tank were randomly chosen and anesthetized in a tub [27]. Body weight and length measurements were taken for all fish in each net tank, and fish were then dissected to record visceral weight and remove muscle tissue. For muscle composition analysis, amino acid profile, and fatty acid analysis, muscle samples were collected from the left side of 9 randomly selected fish per tank. These samples were immediately frozen at −20 °C to preserve their integrity and prevent degradation prior to analysis. For biochemical studies, muscle samples from the right side of the same 9 fish were stored at −80 °C. This lower temperature is more suitable for maintaining the stability of biochemical components. When it came to texture parameters and physicochemical qualities’ determination, muscle samples from the right sides of the same 6 fish were cut into 1 cm × 1 cm × 1 cm muscle blocks using a mold. These samples were handled with care to ensure their quality was maintained during the transition from collection to analysis. For histological analysis, muscle samples from the right sides of another 3 fish were used. [28,29].

2.4. Growth, Feed Utilization, and Biological Indices

The following equations were used to calculate the growth, feed utilization, and biological indices [30]:
Survival rate = 100 × final number of fish/initial number of fish, (SR, %);
Percent weight gain = 100 × (final body weight − initial body weight)/Initial body weight (PWG, %);
Specific growth rates = 100 × [ln (final body weight) − ln (initial body weight)]/days, (SGR, %/d);
Feed intake = (feed offered in dry basis − uneaten feed in dry basis)/amount of fish, (FI, g/fish);
Feed efficiency = 100 × (final body weight − initial body weight)/Feed intake, (FE, %);
Protein efficiency ratio = [(final weight − initial weight]/total feed protein consumed, (PER);
Viscerosomatic index = 100 × wet viscera weight/wet body weight, (VSI, %);
Hepatosomatic index = 100 × wet liver weight/wet body weight, (HSI, %);
Intestosomatic index = 100 × wet intestine weight/wet body weight, (ISI, %);
Relative gut length = 100 × intestine length/body length, (RGL, %).

2.5. Proximate Composition and Apparent Digestibility of Nutrients Analysis

The crude protein, crude lipid, moisture, and ash contents in diets and muscle were analyzed following the procedures outlined by the AOAC-2005. Muscle moisture was determined by oven-drying at 105 °C for 15 h, crude protein content was assessed using the Kjeldahl method, and crude lipid content was determined through Soxhlet extraction [23,31]. Upon completing the feeding study, each group received a test diet including the Cr2O3 marker to assess digestive efficiency. The in vivo ADCs for dry matter and protein were computed based on formulas recommended by NCR [32]. Crude protein levels in feed and feces were analyzed using the Kjeldahl technique, while Cr2O3 levels were measured through wet ashing quantitative analysis.
The apparent digestibility coefficient of dry matter (ADCD) was calculated as follows: ADCD = [1 − B/B’] × 100.
The apparent digestibility coefficient of protein (ADCP) was calculated as follows: ADCP = [1 − (A’/A × B/B’)] × 100.
A and A’ are the crude protein content in feed and manure, respectively. B and B’ are the Cr2O3 content in feed and manure, respectively.

2.6. Physicochemical Quality and Textural Properties of Muscle

Muscle pH levels were recorded at 45 min and 24 h post-sampling using a calibrated pH probe. Cooking loss was determined by immersing 4.0 g muscle samples (M0) in a boiling water bath (100 °C) for 5 min followed by weighing (M1). Additionally, a 10.0 g muscle sample (W0) was placed in a plastic jar, stored at 4 °C for 24 h, dried, and then weighed to measure cooking loss (W1). Shear force, chewiness, gumminess, springiness, cohesiveness, adhesiveness, and hardness were measured using a specialized texture apparatus for aquatic products (AMETEK Brookfield) after the cooking loss sample [27].
Cooking loss (%) = 100 × (M0 − M1)/M0.
Drip loss (%) = 100 × (W0 − W1)/W0.

2.7. Determination of Flesh Amino Acid, Free Amino Acid, and Fatty Acid

The automated amino acid analyzer (L-8900) was employed to determine the amino acid content in diets and flesh after acid hydrolysis, following previously reported methods [23,33]. A minor modification was made to the procedure for analyzing the free amino acid composition [31]. Wet flesh samples (0.2 g) were cut with scissors, homogenized with 1 mL of ultra-pure water for 1 min, and then centrifuged at 10,000 rpm for 10 min. Subsequently, 400 μL of the supernatant was transferred to a 2 mL centrifuge tube. After adding 800 μL of salicylic acid, the mixture was stirred thoroughly, left at ambient temperature for 30 min, and centrifuged again at 10,000 rpm for 5 min. One milliliter of the supernatant was filtered through a 0.22 μm membrane filter and analyzed using an automated amino acid analyzer (LA-8080). Fatty acid profiles were analyzed via gas chromatography. First, 200 mg samples were put into a 2:1 chloroform–methanol mixture. The extracted fat was treated with 2 mL of 0.5 mol/L KOH-CH3OH, then water-bathed at 95 °C for 10 min. After cooling, a 14% BF3-CH3OH solution was added and water-bathed at 85 °C for 20 min with continuous shaking. Hexane and saturated NaCl were added, and the mixture was centrifuged. The resulting esters were analyzed on a Shimadzu GC-2010 plus. Column conditions were as follows: 100 m×0.25 mm×0.20 μm with FID. Specific temperature programs were set. The inlet temp was 250 °C, the injection volume was 1 μL, and N2 was the carrier gas at 1.8 mL/min. A 37-component FAME mix was the external standard, and results were in the form of percentage of total fatty acids. [23,33].

2.8. Muscle Biochemical Parameters Analysis

The concentrations of cathepsin B (CtsB) and cathepsin L (CtsL) were quantified using ELISA kits [27,34]. Water-salt-soluble protein contents were determined using the technique outlined in [35]. Muscle specimens were processed using either phosphate buffer alone or KCl [36]. Levels of lactic acid (LD) and total protein (TP) were quantified using commercial assay kits provided by the Jiancheng Bioengineering Institute, Nanjing, Jiangsu.

2.9. Statistical Analysis

The data underwent one-way ANOVA analysis of variance using the SPSS statistical software (Version 25.0 for Windows, SPSS Inc., Michigan Avenue, Chicago, IL, USA). All data were tested for homogeneity of variance before analysis and were then subjected to one-way analysis of variance (ANOVA). Treatment differences were evaluated through Duncan’s multiple-range test. Orthogonal polynomial contrasts were applied to assess the linear and quadratic impacts of dietary Glu inclusion levels. Results were expressed as the mean ± SE, and p < 0.05 was considered statistically significant.

3. Results

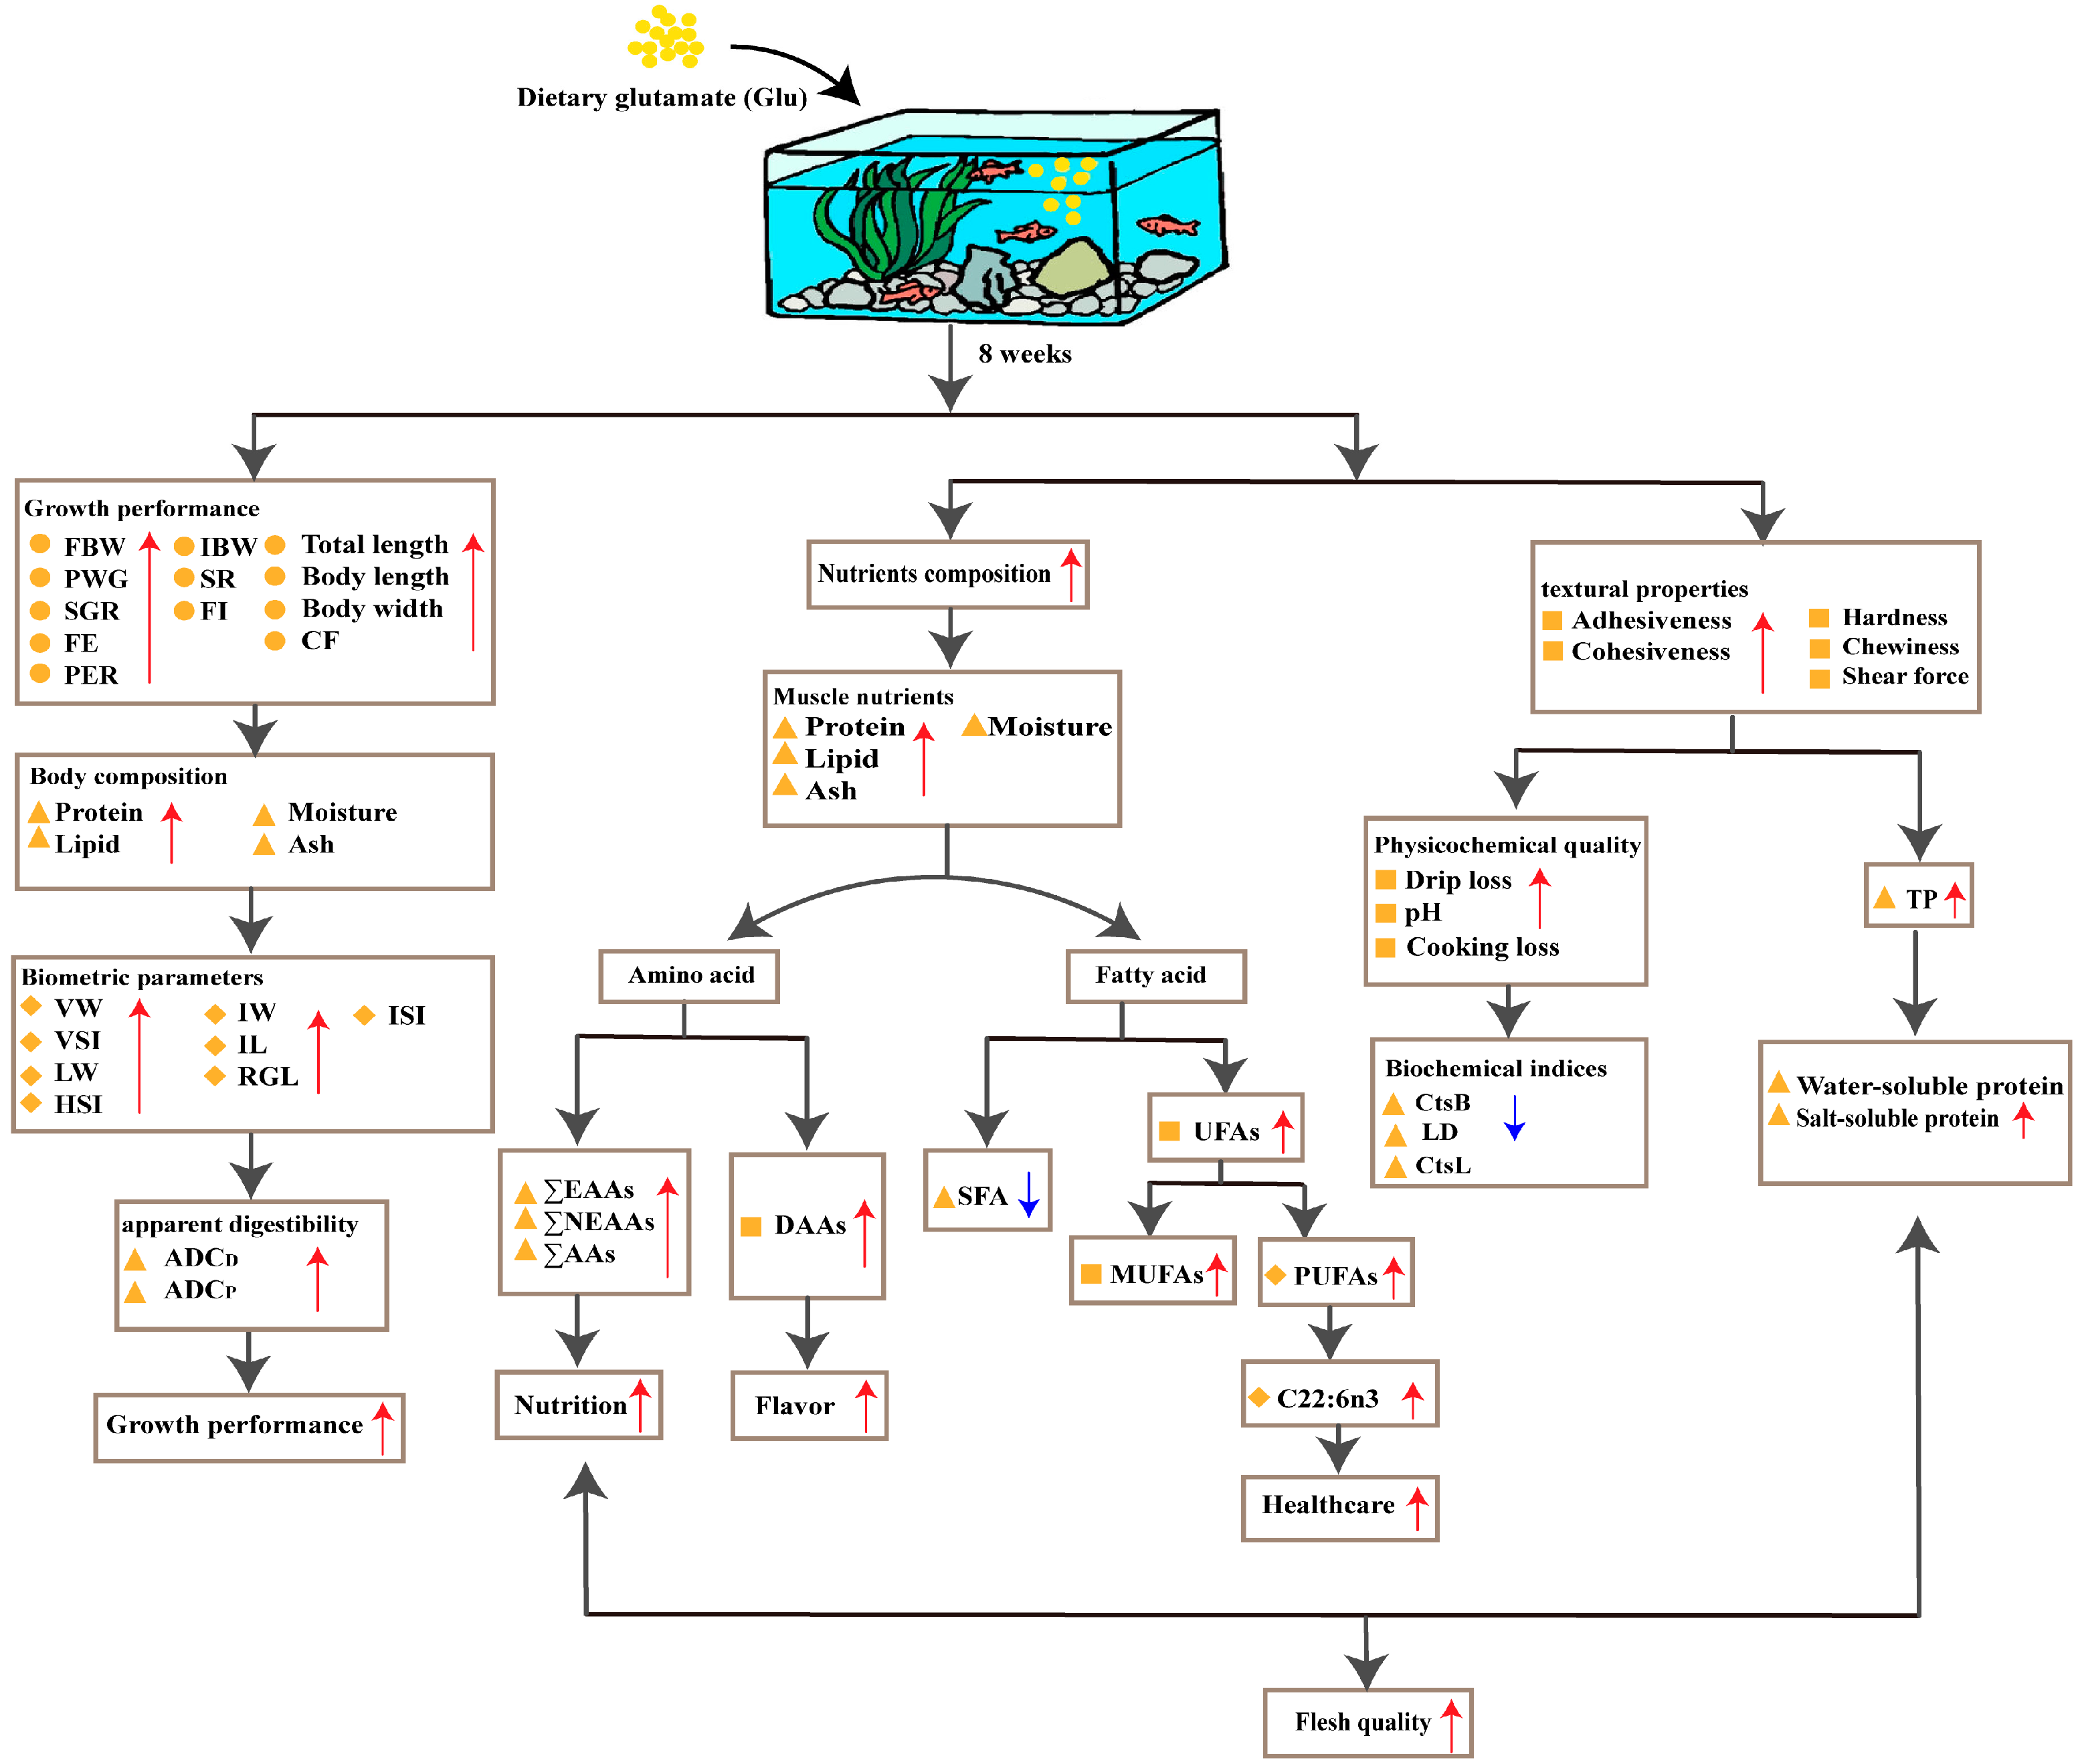
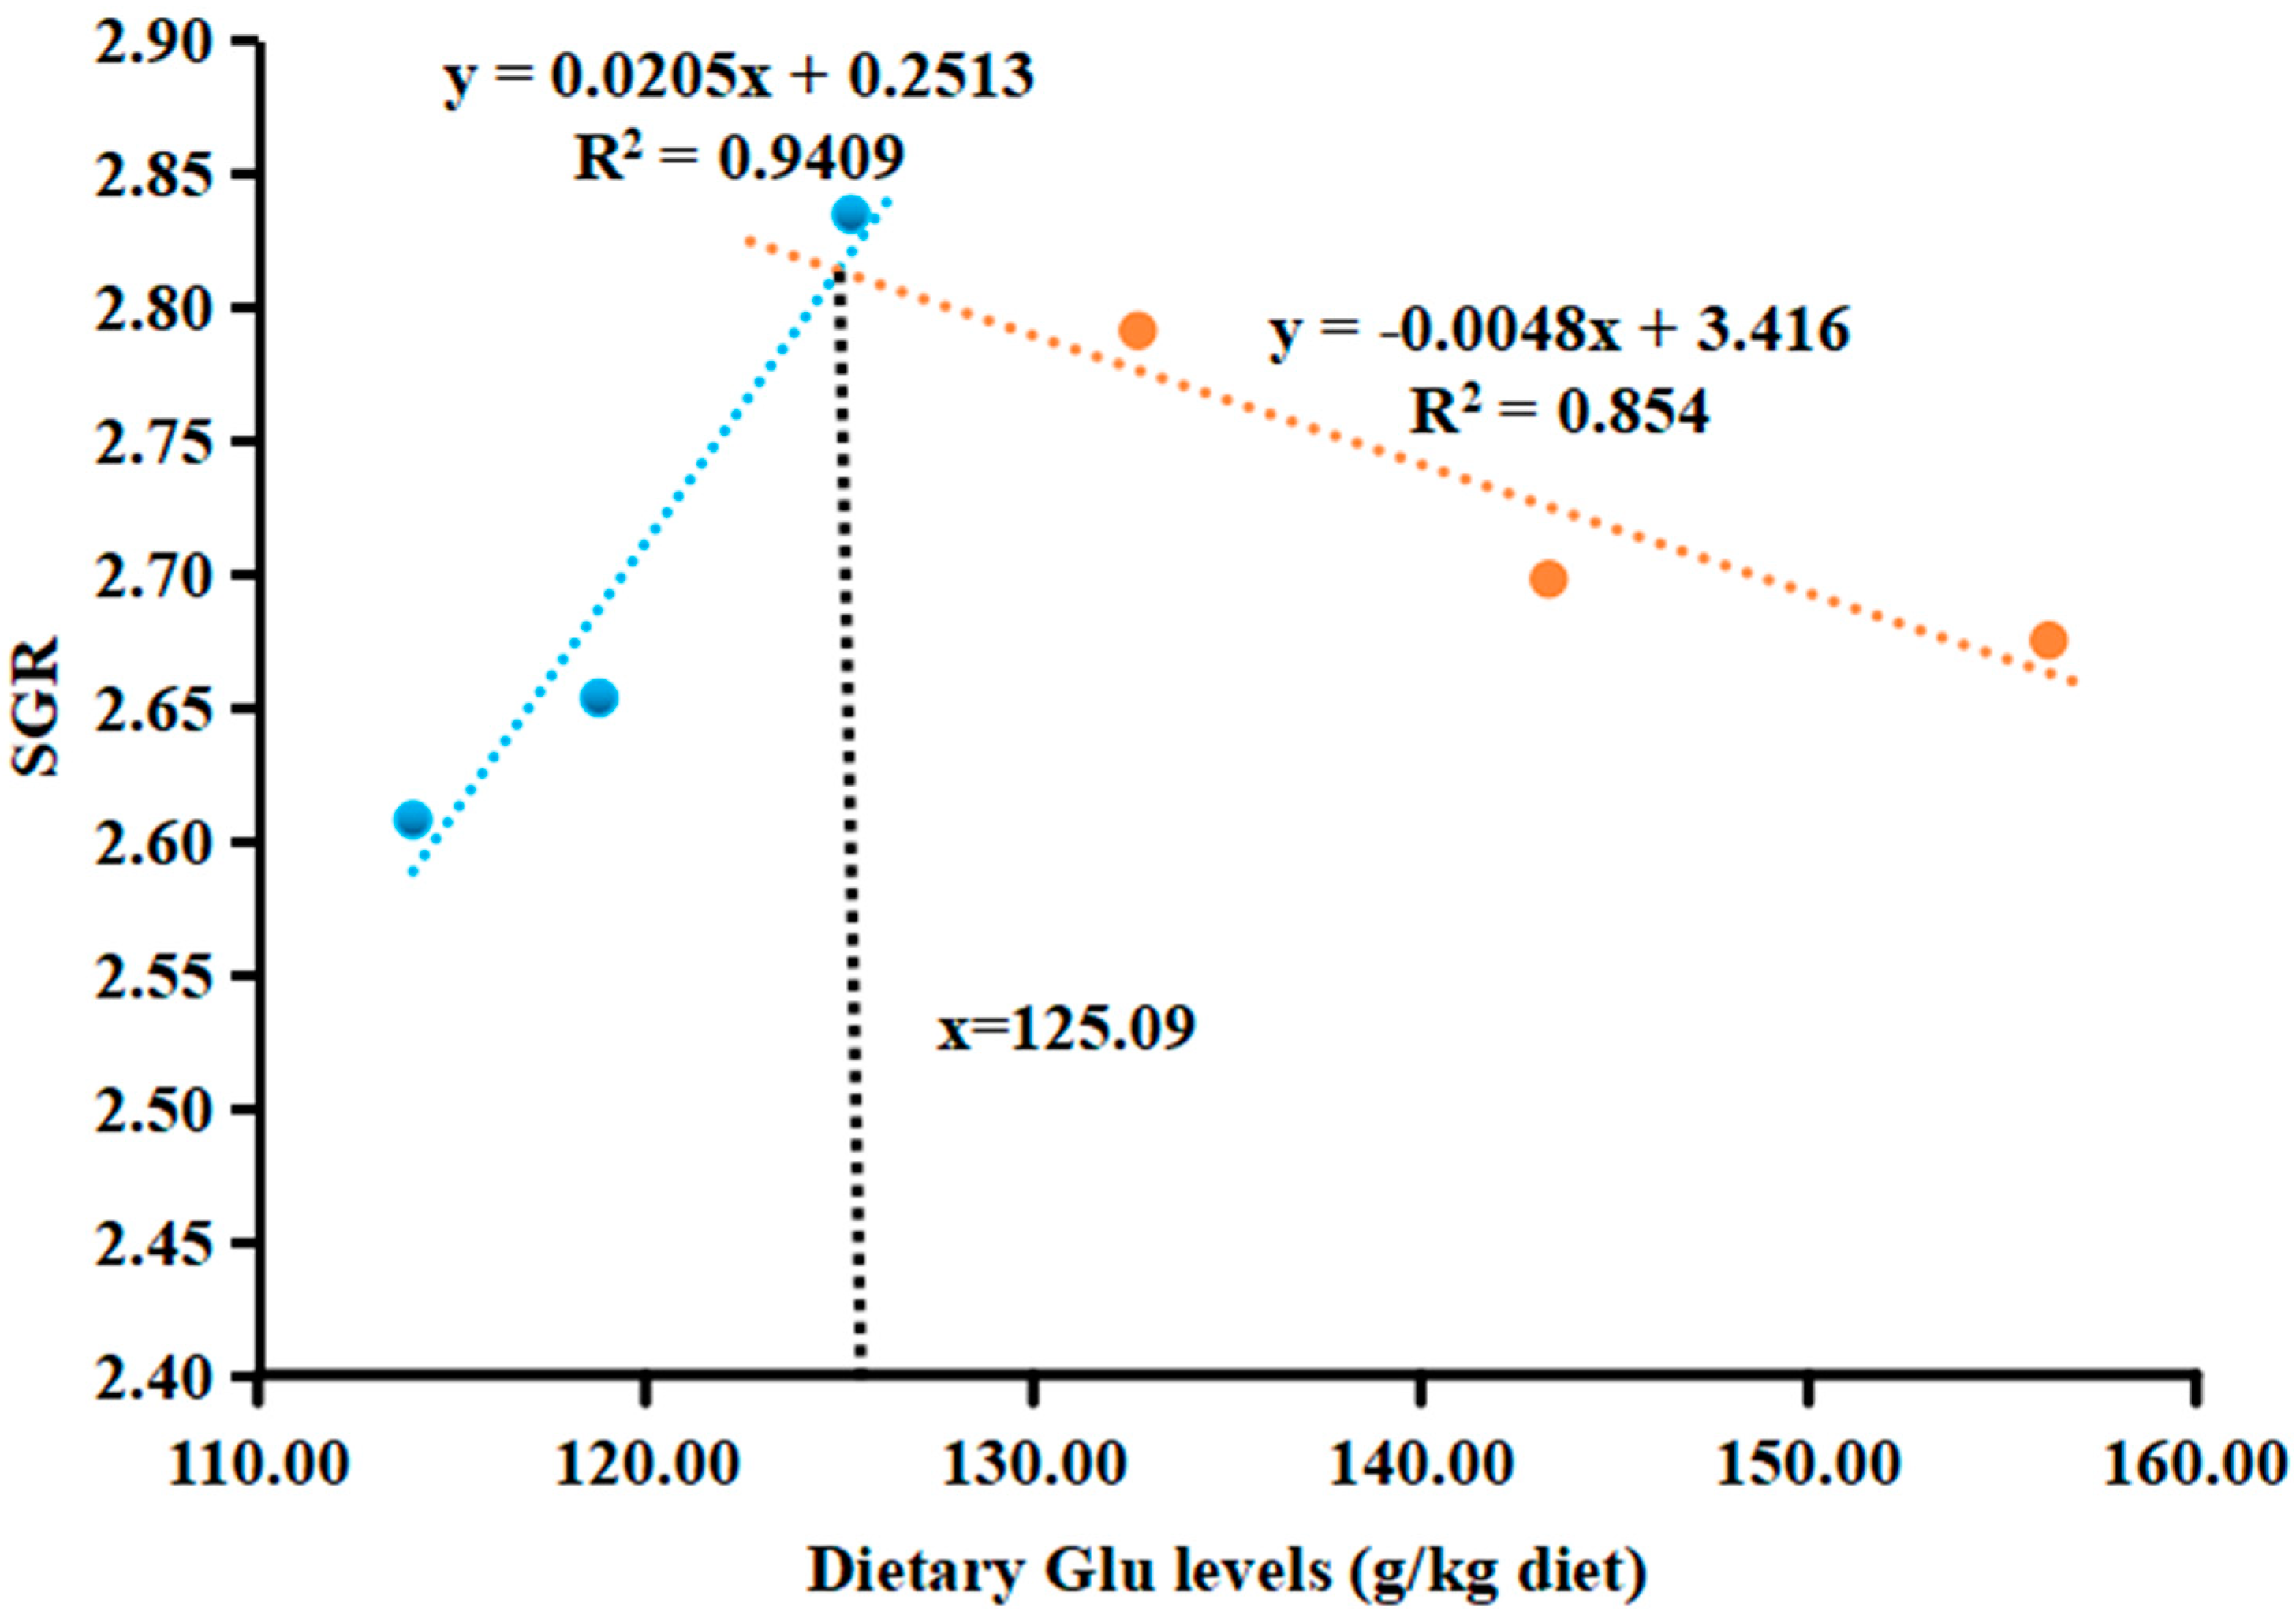
3.1. Growth Performance

Table 3 presents the growth performance of fish consuming diets with various Glu concentrations. Over the 56-day feeding period, the FBW of largemouth bass increased by about 4–5 times; the FBW, PWG, SGR, and FE initially increased and then decreased as dietary Glu levels rose, showing significant changes (p < 0.05). Compared to the G1 group, the G3 group exhibited notable enhancement in PER. No notable differences were observed in SR or FI across the groups (p > 0.05). The optimum dietary Glu level for maximizing SGR in largemouth bass, as per the broken-line model, was determined to be the G3 diet (Figure 1). Collectively, these results underscore that an appropriate level of Glu is beneficial to the growth performance of largemouth bass.

3.2. Body Proximate Compositions, Biometric Parameters and Nutrients Apparent Digestibility

Table 4 and Table 5 display the body proximate compositions, nutrient apparent digestibility, and biometric parameters for fish fed diets with varying levels of Glu. A dietary inclusion of Glu at the G4 level significantly boosted whole-body lipid content compared with the G6 group (p < 0.05). In the G3 group, the whole-body crude protein level was notably higher compared to G1 group (p < 0.05). Moisture and ash contents in the whole body showed no significant changes across different treatments (p > 0.05). Largemouth bass fed a diet containing the G4 level of Glu demonstrated increased viscera weight (VW), intestinal length (IL), intestinal weight (IW), and relative gut length (RGL) compared to those fed other diets (p < 0.05). Although the viscerosomatic index (VSI) was the lowest in the control group, differences across all groups were not significant (p > 0.05). The G3 diet group saw significantly increased liver weight (LW) and hepatosomatic index (HSI) compared with the G1 group (p < 0.05). No significant differences were found in the ISI (p > 0.05). With the increase of the Glu level, the ADCD and ADCP showed a trend of first increasing and then decreasing (p < 0.05). This underscores that the appropriate level of Glu was beneficial to the nutrient deposition of largemouth bass.

3.3. Muscle Nutritional Components, Amino Acid and Fatty Acid Profiles

Table 6 outlines the muscle nutritional components in fish fed diets with different Glu levels. The muscle protein content was the highest in the G1 group and the lowest in the G6 group (p < 0.05). The muscle lipid content peaked at the Glu level of the G2 diet (p < 0.05). Muscle moisture content remained consistent across all treatment groups (p > 0.05).
Table 7 reveals that compared with the control group, the Met content was significantly decreased in the G6 group (p < 0.05). At the Glu level of the G3 diet, the contents of Lys, Thr, Glu, Pro, ∑EAAs, ∑NEAAs, and ∑AAs were the highest (p < 0.05). The highest Gly content was found at the Glu level of the G6 diet (p < 0.05).
Table 8 reports that 17 FAAs were identified in largemouth bass. The content of Asp was the highest in the group with the Glu level of the G6 diet (p < 0.05). At the Glu level of the G3 diet, the contents of Cys, Met, Lys, and Arg reached their maximums (p < 0.05). The highest contents of Ile and Leu were observed in the group with a Glu level of G4 (p < 0.05). Gly and Pro were more abundant in the G3 group, while Ala peaked in the G4 group (p < 0.05). The supplementation of Glu did not influence the levels of Thr, Ser, Glu, Val, His, or EAAs in muscle significantly (p > 0.05), but total amino acids saw significant increases and then decreases with Glu supplementation (p < 0.05). The G6 group also showed particularly high Gly content (p < 0.05).
Regarding the effects of Glu on muscle fatty acid composition detailed in Table 9, polyunsaturated fatty acids (PUFAs) were the most abundant, making up 40–45% of fatty acids, followed by monounsaturated (MUFAs, 27–31%) and saturated fatty acids (SFAs, 25–29%). Glu supplementation did not significantly affect the levels of most fatty acids, including C6:0, C15:0, C16:0, C17:0, C18:0, C20:0, C16:1, C18:1n9t, C18:1n9c, C20:1n9, C22:1n9, MUFAs, C18:2n6c, C18:3n6, C18:3n3, C20:2, C20:3n6, C22:2, C20:5n3, PUFAs, EFAs, n-6PUFA, and the n-3/n-6 ratio in flesh (p > 0.05). However, the C14:0 content was notably higher in the G4 group. The G1 group exhibited the highest levels of C23:0 and C24:1n9. Fish that were fed a G3 diet demonstrated elevated levels of UFAs, C22:6n3, and n-3PUFA. Moreover, the G3 group recorded the lowest SFA content. These results indicated that Glu improved muscle nutritional components of largemouth bass by affecting amino acid and fatty acid content.

3.4. Physicochemical Quality and Textural Properties of Muscle

Table 10 presents the physicochemical quality and texture characteristics of fish muscle in relation to various dietary Glu levels. Cooking loss was consistent across all groups (p > 0.05). When Glu levels ranged from G1–G5, drip loss gradually decreased (p < 0.05). The highest immediate muscle pH (pH 45 min) was observed in fish on the G4 diet, while the lowest was seen in those on the G6 diet (p < 0.05). The pH after 24 h (pH 24) is similar for all groups except G4. Differences in muscle hardness, springiness, chewiness, and shear force were not significant across Glu levels (p > 0.05). Fish on a G5 Glu regimen had the highest adhesiveness (p < 0.05). Collectively, these data suggested that Glu improved the muscle quality of largemouth bass by affecting the physicochemical quality and textural properties of muscle.

3.5. Flesh Biochemical Indices

The biochemical indices of the muscle of fish fed diets with graded levels of Glu are shown in Table 11. When the supplementary level of Glu is between G3 and G4, the activity of CtsB is significantly reduced (p < 0.05). No significant impacts on CtsL and water-soluble protein were detected across different levels of dietary Glu (p > 0.05). The concentration of salt-soluble protein increased significantly in fish consuming the G4 Glu diet (p < 0.05). The content of lactate dehydrogenase (LD) increased significantly when fish were fed a G6 Glu diet (p < 0.05). The total protein (TP) content displayed a pattern of initial increase up to the G3 diet, followed by a decrease (p < 0.05). These findings imply that Glu has a positive impact on the muscle quality of largemouth bass through its influence on the biochemical indices of the flesh.
Figure 2. Glu improves growth performance and muscle quality.
Fishes 10 00151 g002

4. Discussion

4.1. Dietary Glu Effects on the Growth Performance, Body Compositions, and Apparent Digestibility

A wealth of research has demonstrated that the addition of Glu to the diets of fish leads to enhanced growth performance and improved feed utilization efficiency across a diverse range of fish species [7,37]. In this study, dietary Glu levels (G3) increased parameters such as FBW, PWG, SGR, and FE, consistent with findings in Atlantic salmon [6], Grass carp [5], and Jian carp [38]. Glu, derived from monosodium glutamate (MSG), serves as an energy substrate impacting fish growth [11], as observed in previous studies on rainbow trout [39] and common carp [40]. The positive impacts on protein were ascribed to two main factors: the unique functional attributes of Glu and the metabolic alterations it induces. These metabolic changes come about when Glu, through the mediation of diverse cell signaling pathways, regulates glycolysis and lipogenesis, thereby influencing the overall physiological processes related to protein in the organism, as demonstrated in gilthead seabream (Sparus aurata) [3]. In this study, fish fed a diet containing a G3 level of Glu exhibited enhanced growth in comparison to those fed a diet with a Glu level of G1. Nevertheless, when compared to the group fed the G3 Glu diet, fish fed the G5 and G6 Glu diets demonstrated reduced PWG and inferior FE. This outcome is likely attributed to the fact that an excess of Glu leads to unbalanced amino acid utilization, thereby exerting negative impacts on growth performance. When fish are fed excessive amounts of amino acids, lower weight gain and suboptimal feed conversion are likely to ensue [41]. Based on SGR, the optimal Glu requirement for largemouth bass was determined to be 125.1 g/kg diet, corroborating earlier studies in Jian carp [38]. However, variations in requirements could be attributed to species and growth stages [42,43]. Fish of different species may possess different digestive enzyme profiles. Some species may have higher levels of specific proteases that are more efficient in breaking down Glu-containing proteins, allowing them to utilize Glu more effectively. This could mean that they require lower dietary Glu levels to meet their metabolic needs. The increase in fish weight is attributed to the accumulation of protein and fat, as shown in previous research [44]. Glu enhanced the protein content and protein retention within the muscle of triploid crucian carp by activating the AMPK/TOR signaling pathway and regulating the mRNA expression of genes involved in protein metabolism [22]. This current study further reveals that Glu supplementation significantly increases protein and lipid levels in largemouth bass. Moreover, dietary Glu enhances liver growth and development, as reflected by the HSI, in largemouth bass. This is in line with previous studies on dietary Glu supplementation in gilthead seabream juveniles [3]. Previous studies have shown that supplementing Glu in the diet enhances the crude protein and lipid contents in triploid crucian carp and gilthead seabream, respectively, suggesting that optimal levels of dietary Glu can improve growth performance, partially by increasing overall protein and lipid contents in the body. The digestion and absorption of nutrients are fundamental to nutrient deposition and are closely linked to the growth and development of digestive organs [45]. Liver growth and development, reflected by the HSI, were elevated with optimal Glu dosage in largemouth bass, suggesting enhanced liver growth and development [46]. This aligns with similar increases observed in gilthead seabream juveniles with Glu supplementation [3,4,5]. Intestinal growth and development, reflected by RGL, may increase with dietary Glu, although there were no significant differences in ISI. This agrees with studies reporting improved RGL in grass carp and Jian carp with Glu supplementation [5,38]. Regarding the ADCD and ADCp, increased values were found in fish fed the G3 and G4 Glu diets. This could be indicative of a protein-sparing effect derived from appropriate level of added Glu. The growth performance was similar to the obtained trends of the apparent digestibility coefficient. One shortcoming of this study is that the Glu content in feces was not detected. The above results show that an appropriate level Glu can improve the digestion and utilization efficiency of nutrients in the feed, enhance the growth and development of the intestine and liver, and thus increase the deposition efficiency of nutrients in fish bodies, promoting the growth of largemouth bass. Supplementation with glutamate has been shown to be beneficial in improving fish growth performance and feed efficiency, thereby reducing feed costs. However, further research is still needed on the impacts of Glu on aspects such as fish response to environmental stress, disease resistance, and the optimal supplementation levels at different developmental stages. In addition, one limitation of this experiment is that no leaching test was conducted on the Glu in the feed. When considering the effects of Glu in the feed on fish, it is of vital importance to know whether the Glu remains in the feed particles for the fish to consume or leaches into the water. These factors were not fully explored in our study. Therefore, conducting a Glu leaching test will be essential in future research.

4.2. Effects of Dietary Glu Levels on the Proximate Composition, Amino Acid, and Fatty Acid Profiles in Muscle

The nutritional composition of muscle is determined by its components [17], such as protein, lipids, moisture, and ash, which serve as indicators of fish nutritional value [27]. Typically, fish muscle is predominantly water, with the moisture content ranging from 70% to 85% [47,48]. In this study, the moisture content was observed to be 76% to 77%, consistent with findings in triploid crucian carp [22]. Fish receiving optimal Glu levels showed improved muscle nutrient profiles, with increased protein levels, consistent with previous research on triploid crucian carp [22]. This was further corroborated by studies in Jian carp in our lab, where Glu significantly boosted muscle protein content [21].
Amino acid profiles in diets and muscle total amino acids were analyzed, revealing marginally higher levels of lysine (Lys), threonine (Thr), glycine (Gly), and proline (Pro) in the G3 or G4 diets compared to the G1 group, potentially explaining the observed increase in these amino acids in muscle tissue. This is similar to the research findings regarding Jian carp [21]. The EAAs in fish protein closely match human nutritional requirements, offering high nutritional value. Seventeen amino acids were quantified in largemouth bass muscle in this research. The ratios of ∑EAA to ∑AA and ∑EAA to ∑NEAA in muscle were found to be between 48% and 50%, and 91% to 99%, respectively, surpassing the ideal FAO/WHO model ratios of approximately 40% for ∑EAA/∑AA and over 60% for ∑EAA/∑NEAA [29]. The palatability of fish fillets is largely influenced by the types and levels of dicarboxylic amino acids. Key DAAs encompass Glu, Asp, Ala, and Gly, with Glu and Asp recognized for their umami properties, particularly Glu, which is noted for its strong umami flavor [31,47]. Currently, there are no research findings available on how dietary Glu affects the free amino acids (FAAs) in the flesh of largemouth bass. Interestingly, in this study, dietary Glu significantly increased the Gly, Ala, FAA, and DAA contents in muscle. Adding Glu to the diet significantly increased the Glu content, but there were no significant differences in Glu content among all groups. A similar result was observed in triploid crucian carp, where dietary Glu increased the Glu, Asp, Gly, and DAA contents [22]. This may be related to the synthesis of NEAAs in animals. Asp and Ala can also be synthesized directly or indirectly from Glu through various transamination reactions [49]. Consequently, increasing Glu in the diet may provide more substrate for these pathways, resulting in elevated levels of Asp, Gly, and Ala in the muscle tissue. Muscle fat content plays a crucial role in determining flesh quality. In this study, the G1 concentration of Glu led to increased muscle fat content. The nutritional value of lipids depends on fatty acid variety and quantity, especially unsaturated fatty acids (UFAs) [50]. Research suggests reducing saturated fatty acid (SFA) intake benefits heart health [51,52]. Our study found that appropriate Glu levels reduced total SFA content, potentially enhancing fish muscle health benefits. UFAs, including monounsaturated fatty acids (MUFAs) and polyunsaturated fatty acids (PUFAs) [50], are critical for human health and for flavor [31]. Notably, docosahexaenoic acid (DHA) and eicosapentaenoic acid (EPA) in fish and fish oils offer cardiovascular benefits [53]. Glu supplementation enhanced muscle C22:6n3 and n-3PUFA, while MUFA and PUFA levels showed no significant differences across groups [21]. Consistent with the research findings on Jian carp [21], this indicates that largemouth bass can meet their nutritional needs by regulating fatty acid metabolism. These findings may suggest that the appropriate addition of Glu can improve the muscle’s nutritional composition and amino acid and fatty acid profiles. In practical feed formulations, the optimal Glu dosage used in the experiment can be used as a reference to enhance the nutritional value of the cultured species and the flavor of its muscles.

4.3. Effects of Dietary Glu Levels on the Muscle Textural Properties, Physicochemical Quality, and Biochemical Indices

Muscle texture metrics indicate muscle quality [16]. Characteristics such as hardness, springiness, chewiness, and shear strength determine flesh quality [54]. Hardness serves as a fundamental textural index reflecting the muscle’s intrinsic binding force [55]. Increased flesh hardness often leads consumers to avoid tougher fillets. Chewiness, determined by factors such as firmness, cohesion, springiness, and resilience [27,56], represents the energy required for chewing. Our results indicate that Glu supplementation increased adhesiveness, cohesiveness, and gumminess in fish muscle, positively impacting muscle quality. However, measurements such as hardness, springiness, chewiness, and shear force showed no significant differences across Glu variations. This contrasts with reports suggesting that dietary Glu decreased muscle hardness and increased springiness in triploid crucian carp [22], possibly due to species and size differences, necessitating further exploration. Overall, these outcomes underscore that Glu enhances meat quality through its influence on muscle textural properties.
Enhanced fillet moisture correlates with reduced cooking loss [27], indicating superior flesh quality in fish [25]. Cooking loss was not affected by dietary treatments according to statistical analysis. This aligns with findings in Jian carp [21]. In fish, water is present in three states: bound, immobile, and free [57]. Drip loss primarily stems from the displacement of immobile water within muscle structures due to protein denaturation, modification, and structural alterations [58]. Glu supplementation significantly decreased drip loss in largemouth bass muscle. Interestingly, dietary Glu reduced CtsB activity in largemouth bass muscle. The pH level significantly affects meat quality, with a rapid pH drop often leading to muscle denaturation [59]. Post-slaughter flesh pH typically declines due to lactic acid buildup [60]. In our research, the G4 concentration of Glu elevated the pH45min and pH24h values. Suitable dietary Glu decreased LD content in fish muscle, mirroring outcomes observed in Jian carp [21]. These findings indicate that dietary Glu enhances flesh quality through physicochemical improvements.
Evaluation of fish muscle quality includes analyzing both water-soluble and salt-soluble proteins [61,62]. Sarcoplasmic proteins constitute the bulk of water-soluble proteins, while myofibrillar proteins dominate the salt-soluble fraction [63]. Increased levels of salt-soluble protein correlate with reduced muscle fluid loss [62]. In our study, groups supplemented with G2, G3, G4, G5, and G6 dietary Glu exhibited significantly increased salt-soluble protein content compared to the control, indicating reduced muscle fluid loss and potentially easier food processing. These findings collectively suggest that dietary Glu may positively affect flesh quality by modifying muscle biochemical markers. For other aquaculture species, species differences need to be considered, as different species may respond differently to Glu. Largemouth bass meat is delicious and in high demand in the market. Glu, as an important umami amino acid, can significantly improve the meat quality and flavor and enhance the nutritional value when added to feed. This will increase its market competitiveness, leading to higher economic benefits. In conclusion, Glu additives have significant economic potential in largemouth bass aquaculture. However, further research is needed to verify its dose-dependency, cost-effectiveness, and actual impact on product quality and market potential. This study focuses on short-term effects of adding Glu to largemouth bass feed, including growth, feed efficiency, nutrients, and muscle quality. As this research is short-term, long-term impacts on fish health, disease resistance, and reproduction need exploring. Long-term, Glu supplementation can benefit aquaculture sustainability by improving growth and efficiency, reducing feed use and costs and environmental impacts. But Glu accumulation poses challenges, and the effect of excessive Glu on bass growth is unclear. So, Glu addition in feed must be carefully controlled to ensure positive breeding results and avoid risks.

5. Conclusions

In summary, dietary Glu supplementation for 8 weeks positively impacted production performance. Appropriate Glu levels (G3) improved the proximate compositions of whole-body and biometric parameters, as well as the apparent digestibility of largemouth bass. Enhanced muscle quality may be attributed to improved nutrient compositions. Glu increased muscle protein and lipid content through enhanced ∑EAAs, ∑NEAAs, ∑AAs, DAAs, and UFAs (including MUFAs and PUFAs). In addition, Glu improves texture properties by increasing muscle drip loss, pH, TP, and salt-soluble protein, and decreasing CtsB and LD contents (Figure 2). Based on the broken-line model of SGR, the estimated Glu requirements for largemouth bass diets were 125.1 g/kg of the diet. These data offer valuable insights into the mechanism underlying the positive effects induced by Glu. Our study on largemouth bass reveals Glu’s role in aquaculture. Supplementation can enhance growth, improve muscle amino acid content, boost meat quality, and increase economic benefits. However, dose-dependent effects and cost-effectiveness need verification. Species-specific Glu needs vary, and understanding these is crucial for maximizing Glu’s benefits across fish species. In addition, our short-term study has limitations; long-term impacts on fish health, disease resistance, and reproduction require further exploration. Excess Glu harms largemouth bass growth, yet its mechanism remains unclear. Thus, careful control of Glu addition in fish feed is essential for optimal breeding results.

Author Contributions

B.Z. and J.Z. (Ju Zhao): Investigation, Methodology, Data curation, and Writing—original draft. H.L.: Investigation, Methodology, and Data curation. H.Z.: Investigation, Methodology, and Data curation. H.S.: Investigation and Methodology. J.Z. (Jiali Zong): Investigation and Methodology. Q.C.: Conceptualization, Supervision, and Funding acquisition. J.J.: Conceptualization, Supervision, Funding acquisition, and Writing—review and editing. All authors have read and agreed to the published version of the manuscript.

Funding

This research has received funding from the National Natural Science Foundation of China (grant number: 32172987).

Institutional Review Board Statement

All experimental procedures used were conducted with the approval of the Animal Care Advisory Committee of Sichuan Agricultural University (under permit No. DKY-S2023516; approval date:16 May 2023).

Informed Consent Statement

Not applicable.

Data Availability Statement

The authors confirm that the data supporting the findings of this study are available within the manuscript, tables, and figures.

Conflicts of Interest

The authors declare that no conflicts of interest exist.

References

  1. Brosnan, J.T.; Brosnan, M.E. Glutamate: A truly functional amino acid. Amino Acids 2013, 45, 413–418. [Google Scholar] [CrossRef] [PubMed]
  2. Li, X.; Zheng, S.; Wu, G. Nutrition and metabolism of glutamate and glutamine in fish. Amino Acids 2020, 52, 671–691. [Google Scholar] [CrossRef] [PubMed]
  3. Caballero-Solares, A.; Viegas, I.; Salgado, M.C.; Siles, A.M.; Sáez, A.; Metón, I.; Baanante, I.V.; Fernández, F. Diets supplemented with glutamate or glutamine improve protein retention and modulate gene expression of key enzymes of hepatic metabolism in gilthead seabream (Sparus aurata) juveniles. Aquaculture 2015, 444, 79–87. [Google Scholar] [CrossRef]
  4. Yoshida, C.; Maekawa, M.; Bannai, M.; Yamamoto, T. Glutamate promotes nucleotide synthesis in the gut and improves availability of soybean meal feed in rainbow trout (Oncorhynchus mykiss). Springerplus 2016, 5, 1021. [Google Scholar] [CrossRef]
  5. Zhao, Y.; Hu, Y.; Zhou, X.Q.; Zeng, X.Y.; Feng, L.; Liu, Y.; Jiang, W.D.; Li, S.H.; Li, D.B.; Wu, X.Q.; et al. Effects of dietary glutamate supplementation on growth performance, digestive enzyme activities and antioxidant capacity in intestine of grass carp (Ctenopharyngodon idella). Aquac. Nutr. 2015, 21, 935–941. [Google Scholar] [CrossRef]
  6. Belghit, I.; Philip, A.J.P.; Maas, R.M.; Lock, E.; Eding, E.H.; Espe, M.; Schrama, J.W. Impact of dietary glutamate and glycine on growth and nutrient utilization in rainbow trout (Oncorhynchus mykiss). Aquaculture 2023, 568, 739311. [Google Scholar] [CrossRef]
  7. Subandiyono, S.; Hastuti, S. Growth performances, feed utilization and hematological parameters of the carp (Cyprinus carpio), according to the dietary glutamate. Aquac. Aquar. Conserv. Legis. 2022, 15, 830–839. [Google Scholar]
  8. Larsson, T.; Koppang, E.O.; Espe, M.; Terjesen, B.F.; Krasnov, A.; Moreno, H.M.; Rørvik, K.; Thomassen, M.; Mørkøre, T. Fillet quality and health of Atlantic salmon (Salmo salar L.) fed a diet supplemented with glutamate. Aquaculture 2014, 426–427, 288–295. [Google Scholar] [CrossRef]
  9. Nursten, H.E. Umami: A basic taste-physiology, biochemistry, nutrition, food science. Biochem. Soc. Trans. 1987, 16, 1095–1096. [Google Scholar] [CrossRef]
  10. Rogers, P.J.; Blundell, J.E. Umami and appetite: Effects of monosodium glutamate on hunger and food intake in human subjects. Physiol. Behav. 1990, 48, 801–804. [Google Scholar] [CrossRef]
  11. Ladeira, A.L.F.; Rusth, R.C.T.; Carneiro, C.L.D.S.; Campelo, D.A.V.; Morante, V.H.P.; Luz, R.K.; Carneiro, A.P.S.; Salaro, A.L. Dietary monosodium glutamate supplementation during the feed training of pacamã (Lophiosilurus alexandri): Growth performance and intestinal histomorphometry. Aquac. Res. 2021, 52, 356–363. [Google Scholar] [CrossRef]
  12. Chen, L.; Zhong, J.; Shi, M.; Liu, Y.; Qu, K.; Tan, B.; Yang, H.; Xie, S. Effects of replacing fishmeal with different proportions of mixed protein source in the diet of largemouth bass (Micropterus salmoides). Comp. Biochem. Physiol. Part D Genom. Proteom. 2024, 49, 101181. [Google Scholar] [CrossRef]
  13. Jiang, F.; Huang, W.; Zhou, M.; Gao, H.; Lu, X.; Yu, Z.; Sun, M.; Huang, Y. Effects of dietary L-glutamic acid on the growth performance, gene expression associated with muscle growth-related gene expression, and intestinal health of juvenile largemouth bass (Micropterus salmoides). Fishes 2024, 9, 312. [Google Scholar] [CrossRef]
  14. Sarma, D.; Akhtar, M.S.; Das, P.; Das, P.; Shahi, N.; Ciji, A.; Mahanta, P.C.; Yengkokpam, S.; Debnath, D. Nutritional quality in terms of amino acid and fatty acid of five coldwater fish species: Implications to human health. Natl. Acad. Sci. Lett. 2013, 36, 385–391. [Google Scholar] [CrossRef]
  15. Cai, L.; Tong, F.; Tang, T.; Ao, Z.; Wei, Z.; Yang, F.; Shu, Y.; Liu, S.; Mai, K. Comparative evaluation of nutritional value and flavor quality of muscle in triploid and diploid common carp: Application of genetic improvement in fish quality. Aquaculture 2021, 541, 736780. [Google Scholar] [CrossRef]
  16. Yang, H.; Li, X.; Rahman, M.M.; Leng, X. Dietary supplementation of leucine improved the flesh quality of largemouth bass, Micropterus salmoides through TOR, FoxO3a and MRFs regulation. Aquaculture 2023, 566, 739237. [Google Scholar] [CrossRef]
  17. Liu, X.; Feng, L.; Jiang, W.; Wu, P.; Jiang, J.; Yang, D.; Tang, L.; Kuang, S.; Shi, H.; Zhou, X.; et al. (2-Carboxyethyl)dimethylsulfonium Bromide (Br-DMPT) improves muscle flesh quality and antioxidant status of on-growing grass carp (Ctenopharyngodon idella) fed non-fish meal diets. Aquaculture 2020, 521, 735065. [Google Scholar] [CrossRef]
  18. Ruiz-Capillas, C.; Moral, A. Free amino acids in muscle of Norway lobster (Nephrops novergicus (L.)) in controlled and modified atmospheres during chilled storage. Food Chem. 2004, 86, 85–91. [Google Scholar] [CrossRef]
  19. Cheng, J.H.; Sun, D.W.; Han, Z.; Zeng, X.A. Texture and structure measurements and analyses for evaluation of fish and fillet freshness quality: A review. Compr. Rev. Food Sci. F 2014, 13, 52–61. [Google Scholar] [CrossRef]
  20. Yamanaka, H.; Shimada, R. Post-mortem biochemical changes in the muscle of japanese spiny lobster during storage. Fish. Sci. 1996, 62, 821–824. [Google Scholar] [CrossRef]
  21. Zhao, Y.; Li, J.; Yin, L.; Feng, L.; Liu, Y.; Jiang, W.; Wu, P.; Zhao, J.; Chen, D.; Zhou, X.; et al. Effects of dietary glutamate supplementation on flesh quality, antioxidant defense and gene expression related to lipid metabolism and myogenic regulation in Jian carp (Cyprinus carpio var. Jian). Aquaculture 2019, 502, 212–222. [Google Scholar] [CrossRef]
  22. Dong, B.; Wu, L.; Wang, Y.; Han, D.; Liu, H.; Zhu, X.; Yang, Y.; Xie, S.; Liu, Z.; Jin, J. Glutamate improves flesh quality and muscle growth of triploid crucian carp. Aquac. Rep. 2023, 33, 101832. [Google Scholar] [CrossRef]
  23. Wen, M.; Wu, P.; Jiang, W.; Liu, Y.; Wu, C.; Zhong, C.; Li, S.; Tang, L.; Feng, L.; Zhou, X. Dietary threonine improves muscle nutritional value and muscle hardness associated with collagen synthesis in grass carp (Ctenopharyngodon idella). Food Chem. 2023, 422, 136223. [Google Scholar] [CrossRef] [PubMed]
  24. Tie, H.; Wu, P.; Jiang, W.; Liu, Y.; Kuang, S.; Zeng, Y.; Jiang, J.; Tang, L.; Zhou, X.; Feng, L. Dietary nucleotides supplementation affect the physicochemical properties, amino acid and fatty acid constituents, apoptosis and antioxidant mechanisms in grass carp (Ctenopharyngodon idellus) muscle. Aquaculture 2019, 502, 312–325. [Google Scholar] [CrossRef]
  25. Wang, B.; Liu, Y.; Feng, L.; Jiang, W.; Kuang, S.; Jiang, J.; Li, S.; Tang, L.; Zhou, X. Effects of dietary arginine supplementation on growth performance, flesh quality, muscle antioxidant capacity and antioxidant-related signalling molecule expression in young grass carp (Ctenopharyngodon idella). Food Chem. 2015, 167, 91–99. [Google Scholar] [CrossRef]
  26. Wei, Y.; Chen, H.; Jia, M.; Zhou, H.; Zhang, Y.; Xu, W.; Zhang, W.; Mai, K. Effects of dietary Antarctic krill Euphausia superba meal on growth performance and muscle quality of triploid rainbow trout Oncorhynchus mykiss farmed in sea water. Aquaculture 2019, 509, 72–84. [Google Scholar] [CrossRef]
  27. Jiang, Q.; Yan, M.; Zhao, Y.; Zhou, X.; Yin, L.; Feng, L.; Liu, Y.; Jiang, W.; Wu, P.; Wang, Y.; et al. Dietary isoleucine improved flesh quality, muscle antioxidant capacity, and muscle growth associated with AKT/TOR/S6K1 and AKT/FOXO3a signaling in hybrid bagrid catfish (Pelteobagrus vachelli ♀ × Leiocassis longirostris ♂). J. Anim. Sci. Biotechnol. 2021, 12, 53. [Google Scholar] [CrossRef]
  28. Zhao, Y.; Yang, C.; Zhu, X.; Feng, L.; Liu, Y.; Jiang, W.; Wu, P.; Huang, X.; Chen, D.; Yang, S.; et al. Dietary methionine hydroxy analogue supplementation benefits on growth, intestinal antioxidant status and microbiota in juvenile largemouth bass Micropterus salmoides. Aquaculture 2022, 556, 738279. [Google Scholar] [CrossRef]
  29. Hu, Z.; Li, H.; Liu, S.; Xue, R.; Sun, J.; Ji, H. Assessment of black soldier fly (Hermetia illucens) larvae meal as a potential substitute for soybean meal on growth performance and flesh quality of grass carp Ctenopharyngodon idellus. Anim. Nutr. 2023, 14, 425–449. [Google Scholar] [CrossRef]
  30. Cao, Q.; Zhang, Z.; Zhao, J.; Feng, L.; Jiang, W.; Wu, P.; Zhao, J.; Liu, H.; Jiang, J. Evaluation of glycyrrhetinic acid in attenuating adverse effects of a high-fat diet in largemouth bass (Micropterus salmoides). Anim. Nutr. 2024, 19, 248–260. [Google Scholar] [CrossRef]
  31. Xu, X.; Yang, H.; Zhang, C.; Bian, Y.; Yao, W.; Xu, Z.; Wang, Y.; Li, X.; Leng, X. Effects of replacing fishmeal with cottonseed protein concentrate on growth performance, flesh quality and gossypol deposition of largemouth bass (Micropterus salmoides). Aquaculture 2022, 548, 737551. [Google Scholar] [CrossRef]
  32. NRC. Nutrient Requirements of Fish and Shrimp; The National Academies Press: Washington, DC, USA, 2011. [Google Scholar] [CrossRef]
  33. Zhao, Y.; Dong, X.; Guo, C.; Feng, L.; Liu, Y.; Jiang, W.; Wu, P.; Luo, W.; Huang, X.; Chen, D.; et al. Dietary isoleucine affects muscle fatty acid and amino acid profiles through regulating lipid metabolism and autophagy in hybrid catfish (Pelteobagrus vachelli ♀ × Leiocassis longirostris ♂). Anim. Nutr. 2022, 11, 369–380. [Google Scholar] [CrossRef] [PubMed]
  34. Xiao, L.; Jiang, W.; Wu, P.; Liu, Y.; Ren, H.; Tang, L.; Li, S.; Zhong, C.; Zhang, R.; Feng, L.; et al. Improvement of flesh quality, muscle growth and protein deposition in adult grass carp (Ctenopharyngodon idella): The role of tryptophan. Aquaculture 2023, 577, 740005. [Google Scholar] [CrossRef]
  35. Sigholt, T.; Erikson, U.; Rustad, T.; Johansen, S.; Seland, A. Handling stress and storage temperature affect meat quality of farmed-raised atlantic salmon (Salmo Salar). J. Food Sci. 2006, 62, 898–905. [Google Scholar]
  36. Wei, Z.; Ma, J.; Pan, X.; Mu, H.; Li, J.; Shentu, J.; Zhang, W.; Mai, K. Dietary hydroxyproline improves the growth and muscle quality of large yellow croaker Larimichthys crocea. Aquaculture 2016, 464, 497–504. [Google Scholar] [CrossRef]
  37. Palomino Ramos, A.R.; Campelo, D.A.V.; Carneiro, C.L.D.S.; Zuanon, J.A.S.; Da Matta, S.L.P.; Furuya, W.M.; Salaro, A.L. Optimal dietary L-glutamine level improves growth performance and intestinal histomorphometry of juvenile giant trahira (Hoplias lacerdae), a Neotropical carnivorous fish species. Aquaculture 2022, 547, 737469. [Google Scholar] [CrossRef]
  38. Zhao, Y.; Zhang, T.; Li, Q.; Feng, L.; Liu, Y.; Jiang, W.; Wu, P.; Zhao, J.; Zhou, X.; Jiang, J. Effect of dietary L-glutamate levels on growth, digestive and absorptive capability, and intestinal physical barrier function in Jian carp (Cyprinus carpio var. Jian). Anim. Nutr. 2020, 6, 198–209. [Google Scholar] [CrossRef]
  39. Zhelyazkov, G.; Stratev, D. Effect of monosodium glutamate on growth performance and blood biochemical parameters of rainbow trout (Oncorhynchus mykiss W.). Vet. World 2019, 12, 1008–1012. [Google Scholar] [CrossRef]
  40. Zhelyazkov, G. Effect of monosodium glutamate dietary supplementation on some productive traits of common carp (Cyprinus carpio L.), cultivated in net cages. Agric. Sci. Technol. 2018, 10, 204–207. [Google Scholar]
  41. Li, P.; Mai, K.; Trushenski, J.; Wu, G. New developments in fish amino acid nutrition: Towards functional and environmentally oriented aquafeeds. Amino Acids 2009, 37, 43–53. [Google Scholar]
  42. Hamza, N.L.; Mhetli, M.; Khemis, I.B.; Cahu, C.; Kestemont, P. Effect of dietary phospholipid levels on performance, enzyme activities and fatty acid composition of pikeperch (Sander lucioperca) larvae. Aquaculture 2008, 275, 274–282. [Google Scholar] [CrossRef]
  43. Saleh, N.E.; Wassef, E.A.; Kamel, M.A.; El-Haroun, E.R.; El-Tahan, R.A. Beneficial effects of soybean lecithin and vitamin C combination in fingerlings gilthead seabream (Sparus aurata) diets on; fish performance, oxidation status and genes expression responses. Aquaculture 2022, 546, 737345. [Google Scholar] [CrossRef]
  44. Buentello, J.A.; Gatlin, D.M. Preliminary observations on the effects of water hardness on free taurine and other amino acids in plasma and muscle of channel catfish (Ictalurus punctatus). N. Am. J. Aquac. 2002, 64, 95–102. [Google Scholar] [CrossRef]
  45. Pedersen, H.E.; Sissons, J.W. Effect of antigenic soybean protein on the physiology and morphology of the gut in the preruminant calf. Can. J. Anim. Sci. 1984, 64, 183–184. [Google Scholar] [CrossRef]
  46. Dawood, M.A.O.; Koshio, S.; Ishikawa, M.; Yokoyama, S.; El Basuini, M.F.; Hossain, M.S.; Nhu, T.H.; Moss, A.S.; Dossou, S.; Wei, H. Dietary supplementation of β-glucan improves growth performance, the innate immune response and stress resistance of red sea bream, Pagrus major. Aquac. Nutr. 2017, 23, 148–159. [Google Scholar] [CrossRef]
  47. Li, S.; Yang, X.; Fan, S.; Zhou, Z.; Zhou, R.; Wu, C.; Gong, D.; Wen, M.; Wang, Y.; Tao, M.; et al. Comparative analysis of muscle nutrient in two types of hybrid bream and native bream. Reprod. Breed. 2022, 2, 71–77. [Google Scholar] [CrossRef]
  48. Su, Q.; Yang, J.; Yang, Z.; Kong, Q.; Xiao, G.; Liu, D.; Tang, H. Toxicology of aspartame to largemouth bass (Micropterus salmoides) on the basis of antioxidant capacity, liver histology and the intestinal microbiota. Anim. Feed Sci. Technol. 2025, 320, 116225. [Google Scholar] [CrossRef]
  49. Wu, G. Amino acids: Metabolism, functions, and nutrition. Amino Acids 2009, 37, 1–17. [Google Scholar]
  50. Jiang, W.; Wu, P.; Tang, R.; Liu, Y.; Kuang, S.; Jiang, J.; Tang, L.; Tang, W.; Zhang, Y.; Zhou, X.; et al. Nutritive values, flavor amino acids, healthcare fatty acids and flesh quality improved by manganese referring to up-regulating the antioxidant capacity and signaling molecules TOR and Nrf2 in the muscle of fish. Food Res. Int. 2016, 89, 670–678. [Google Scholar] [CrossRef]
  51. Michelle, B.; Kristina, P.; Penny, K.E. Saturated fatty acids and cardiovascular disease: Replacements for saturated fat to reduce cardiovascular risk. Healthcare 2017, 5, 29. [Google Scholar] [CrossRef]
  52. Astrup, A.; Dyerberg, J.; Elwood, P.; Hermansen, K.; Hu, F.B.; Jakobsen, M.U.; Kok, F.J.; Krauss, R.M.; Lecerf, J.M.; Legrand, P. The role of reducing intakes of saturated fat in the prevention of cardiovascular disease: Where does the evidence stand in 2010? Am. J. Clin. Nutr. 2011, 93, 684–688. [Google Scholar]
  53. Bhaskar, N.; Miyashita, K. Physiological effects of eicosapentaenoic acid (EPA) and docosahexaenoic acid (DHA)-A review. Food Rev. Int. 2007, 22, 291–307. [Google Scholar]
  54. de Huidobro, F.R.; Miguel, E.; Blázquez, B.; Onega, E. A comparison between two methods (Warner–Bratzler and texture profile analysis) for testing either raw meat or cooked meat. Meat Sci. 2005, 69, 527–536. [Google Scholar] [CrossRef] [PubMed]
  55. Li, H.; Pan, Y.; Liu, L.; Li, Y.; Huang, X.; Zhong, Y.; Tang, T.; Zhang, J.; Chu, W.; Shen, Y. Effects of high-fat diet on muscle textural properties, antioxidant status and autophagy of Chinese soft-shelled turtle (Pelodiscus sinensis). Aquaculture 2019, 511, 734228. [Google Scholar] [CrossRef]
  56. Song, D.; Yun, Y.; Mi, J.; Luo, J.; Zhou, Q. Effects of faba bean on growth performance and fillet texture of Yellow River carp, Cyprinus carpio haematopterus. Aquac. Rep. 2020, 17, 100379. [Google Scholar]
  57. Xu, X.; Li, X.; Xu, Z.; Yang, H.; Lin, X.; Leng, X. Replacing fishmeal with cottonseed protein concentrate in practical diet of largemouth bass (Micropterus salmoides): Growth, flesh quality and metabolomics. Aquaculture 2024, 579, 740164. [Google Scholar] [CrossRef]
  58. Huff-Lonergan, E.; Lonergan, S.M. Mechanisms of water-holding capacity of meat: The role of postmortem biochemical and structural changes. Meat Sci. 2005, 71, 194–204. [Google Scholar] [CrossRef]
  59. Lerfall, J.; Roth, B.; Skare, E.F.; Henriksen, A.; Betten, T.; Dziatkowiak-Stefaniak, M.A.; Rotabakk, B.T. Pre-mortem stress and the subsequent effect on flesh quality of pre-rigor filleted Atlantic salmon (Salmo salar L.) during ice storage. Food Chem. 2015, 175, 157–165. [Google Scholar] [CrossRef]
  60. Li, T.; Hu, W.; Li, J.; Zhang, X.; Zhu, J.; Li, X. Coating effects of tea polyphenol and rosemary extract combined with chitosan on the storage quality of large yellow croaker (Pseudosciaena crocea). Food Control 2012, 25, 101–106. [Google Scholar]
  61. Einen, O.; Mørkøre, T.; Rørå, A.M.B.; Thomassen, M.S. Feed ration prior to slaughter-a potential tool for managing product quality of Atlantic salmon (Salmo salar). Aquaculture 1999, 178, 149–169. [Google Scholar] [CrossRef]
  62. Morkore, T.; Rodbotten, M.; Vogt, G.; Fjaera, S.O.; Kristiansen, I.O.; Manseth, E. Relevance of season and nucleotide catabolism on changes in fillet quality during chilled storage of raw Atlantic salmon (Salmo salar L.). Food Chem. 2010, 119, 1417–1425. [Google Scholar] [CrossRef]
  63. Haard, N.F. Control of chemical composition and food quality attributes of cultured fish. Food Res. Int. 1992, 25, 289–307. [Google Scholar] [CrossRef]
Figure 1. SGR broken-line analysis of largemouth bass fed diets with the graded Glu levels for 8 weeks.
Fishes 10 00151 g001
Table 1. Formulation and proximate composition of the experimental diets (%).
IngredientsG1G2G3G4G5G6
Fish meal21.0021.0021.0021.0021.0021.00
Chicken powder15.0015.0015.0015.0015.0015.00
Extruded soybean meal5.005.005.005.005.005.00
Clostridium autoethanogenum protein25.0025.0025.0025.0025.0025.00
Monosodium glutamate 10.000.601.201.802.403.00
Soy protein concentrate7.507.507.507.507.507.50
High gluten wheat flour6.006.006.006.006.006.00
Cassava starch5.005.005.005.005.005.00
Soya bean oil4.724.724.724.724.724.72
Soy lecithin oil powder3.003.003.003.003.003.00
Lysine0.280.280.280.280.280.28
DL-methionine0.100.100.100.100.100.10
Calcium phosphate1.501.501.501.501.501.50
Microcrystalline cellulose3.002.401.801.200.600.00
Choline chloride0.400.400.400.400.400.40
Premix 22.502.502.502.502.502.50
Total100.00100.00100.00100.00100.00100.00
Nutrient content (%) (analyzed, % dry matter) 3
Crude protein50.3451.2151.9251.6052.2452.26
Crude lipid10.5411.0210.3411.2310.5111.08
Ash11.0911.0910.8710.1510.9810.64
Measured Glu value11.4011.8812.5313.2714.3315.62
Fish meal (contains 68 % protein and 13.75 % lipid (Tianbao Grain and Feed Trading Co., Ltd. Peru), chicken powder (Sichuan Xinrui Feed Technology Co., Ltd. China), extruded soybean meal (Yihai Lianyungang grain and oil Industry Co., Ltd.), soya bean oil (Dongguan Yihai Jiali Cerui Starch Co., Ltd. China). 1 Monosodium glutamate (Suzhou Hexing Food Co., Ltd., China). 2 Premix provided the following minerals (mg/kg) and vitamins (IU or mg/kg): FeSO4.H2O, 100.00; MgSO4.H2O, 625.00; CuSO4.5H2O, 20; ZnSO4.H2O, 115.94; MnSO4.H2O, 37.74; CoCl2.6H2O, 81.97; Ca(IO3)2, 61.35; Na2SeO3, 200; KCl, 95.60; NaCl, 76.26; Vitamin D3, 2.40; Folic acid, 2.00; Biotin, 50.00; Vitamin A, 133.33; Vitamin E, 220.00; Vitamin B12, 100.00; Inositol, 408.16; Vitamin B1, 21.00; Vitamin B2, 43.75; Vitamin B6, 22.00; VK3, 23.23; acid regurgitation, 37.76; Vitamin C, 157.89. 3 These values measured included crude protein, crude lipid, moisture, and crude ash, as indicated in Section 2.5.
Table 2. Amino acid composition of the diets (% dry weight) 1.
ParametersG1G2G3G4G5G6
Essential amino acids (EAAs)
Methionine1.131.121.241.181.201.14
Lysine3.453.433.383.813.663.59
Threonine1.471.441.571.471.551.50
Isoleucine1.901.932.112.162.082.14
Histidine0.990.880.950.880.921.00
Valine2.132.062.222.072.182.28
Leucine3.173.033.283.053.233.28
Arginine2.542.332.542.692.482.52
Phenylalanine1.781.661.811.681.771.65
Non-essential amino acids (NEAAs)
Aspartic acid4.204.083.783.794.034.37
Serine1.851.781.941.791.891.70
Glutamic acid11.4011.8812.5313.2714.3315.62
Glycine2.502.402.542.352.492.43
Alanine2.482.392.562.372.502.28
Cysteine0.310.290.310.300.300.33
Proline1.981.882.031.601.691.80
Tyrosine1.471.441.571.471.551.57
∑AAs44.7243.9846.3345.8947.8149.16
Methionine: Met; Lysine: Lys; Threonine: Thr; Isoleucine: Ile; Histidine: His; Valine: Val; Leucine: Leu; Arginine: Arg; Phenylalanine: Phe; Aspartic acid: Asp; Serine: Ser; Glutamic acid: Glu; Glycine: Gly; Alanine: Ala; Cysteine: Cys; Proline: Pro; Tyrosine: Tyr. ∑AAs: total amino acids. 1 Values are reported as the mean values of duplicated analyses, as indicated in Section 2.7.
Table 3. Growth performance and somatic parameters of fish fed different diets for 56 days.
Items 1G1G2G3G4G5G6
FBW103.30 ± 2.95 c106.45 ± 2.93 bc118.54 ± 4.84 a115.41 ± 4.91 ab108.19 ± 4.99 abc107.70 ± 7.02 abc
PWG 3331.07 ± 16.75 c342.02 ± 10.83 bc389.27 ± 15.55 a377.76 ± 21.69 ab353.38 ± 17.58 abc348.02 ± 26.67 abc
SGR 42.61 ± 0.07 c2.65 ± 0.04 bc2.83 ± 0.06 a2.79 ± 0.08 ab2.70 ± 0.07 abc2.67 ± 0.10 abc
FI 573.19 ± 4.1572.85 ± 1.6470.68 ± 2.8274.00 ± 2.1371.07 ± 1.2569.48 ± 0.61
FE 6108.54 ± 3.95 b113.06 ± 2.25 b133.61 ± 7.63 a123.43 ± 8.21 ab118.58 ± 4.79 ab120.36 ± 8.99 ab
PER 72.16 ± 0.08 b2.21 ± 0.04 b2.57 ± 0.15 a2.39 ± 0.16 ab2.27 ± 0.09 b2.30 ± 0.17 ab
CF 81.90 ± 0.15 bc1.94 ± 0.16 abc2.05 ± 0.13 ab2.06 ± 0.15 a1.89 ± 0.16 c1.92 ± 0.09 abc
1 Values are mean ± SE. of three replicate groups, while quadratic regression was run with the triplicate data points. Mean values with different superscripts in the same row are significantly different (p < 0.05).
Table 4. Whole-body composition and apparent digestibility of largemouth bass fed different diets for 56 days (% dry matter basis) 1.
ItemsG1G2G3G4G5G6
Moisture67.85 ± 0.4169.25 ± 2.2668.75 ± 0.4767.25 ± 0.7567.70 ± 0.5269.28 ± 0.39
Protein17.17 ± 0.35 b17.32 ± 0.95 ab18.43 ± 0.33 a18.31 ± 0.24 ab17.92 ± 0.35 ab17.44 ± 0.40 ab
Lipid7.53 ± 0.25 ab7.39 ± 0.60 ab7.37 ± 0.15 ab8.01 ± 0.20 a7.83 ± 0.12 ab7.26 ± 0.21 b
Ash3.92 ± 0.173.82 ± 0.243.94 ± 0.033.78 ± 0.133.98 ± 0.083.97 ± 0.08
ADCD 266.78 ± 0.12 b66.28 ± 0.29 b69.30 ± 1.01 a70.66 ± 0.28 a66.77 ± 0.91 b66.09 ± 2.38 b
ADCP 393.74 ± 0.09 b93.84 ± 0.19 ab94.32 ± 0.36 a94.39 ± 0.17 a93.88 ± 0.14 ab93.72 ± 0.36 b
1 Values are mean ± SE of three replicate groups, with 6 fish per tank. Mean values with different superscripts in the same row are significantly different (p < 0.05). 2 Apparent digestibility coefficient of dry matter (ADCD). 3 Apparent digestibility coefficient of protein (ADCP).
Table 5. Biometric parameters of largemouth bass fed different diets for 56 days.
Items 1G1G2G3G4G5G6
VW6.94 ± 0.58 c8.43 ± 0.43 b8.65 ± 1.07 b9.63 ± 0.80 a8.07 ± 0.57 b6.85 ± 0.43 c
VSI 26.50 ± 0.506.52 ± 0.386.60 ± 0.486.92 ± 0.476.92 ± 0.556.93 ± 0.46
LW1.75 ± 0.11 c2.17 ± 0.17 ab2.40 ± 0.38 a2.26 ± 0.29 ab2.07 ± 0.24 b1.77 ± 0.12 c
HIS 31.65 ± 0.09 bc1.68 ± 0.14 abc1.84 ± 0.23 a1.61 ± 0.10 c1.77 ± 0.18 abc1.78 ± 0.12 ab
IW0.69 ± 0.05 b0.80 ± 0.04 a0.85 ± 0.06 a0.86 ± 0.15 a0.68 ± 0.04 b0.62 ± 0.06 b
ISI 40.65 ± 0.050.63 ± 0.030.65 ± 0.050.61 ± 0.100.60 ± 0.040.63 ± 0.07
IL13.24 ± 1.02 cd14.24 ± 0.77 abc14.72 ± 1.04 ab15.05 ± 1.84 a13.70 ± 0.57 bc12.25 ± 0.61 d
RGL 574.67 ± 5.85 ab75.46 ± 4.20 ab79.42 ± 5.58 a79.72 ± 10.90 a74.57 ± 4.10 ab70.79 ± 3.01 b
1 VW = viscera weight; LW = liver weight; IW = intestinal weight; IL = intestinal length; Viscerosomatic index (VSI, %) = 100 × wet viscera weight/wet body weight; and Hepatosomatic index (HSI, %) = 100 × wet liver weight/wet body weight. Relative gut length (RGL, %) = 100 × intestinal length/body length. Intestosomatic index (ISI, %) = 100 × wet intestine weight/wet body weight. Values are mean ± SE of three replicate groups, with 6 fish per tank. Mean values with different superscripts in the same row are significantly different (p < 0.05).
Table 6. Effects of different dietary Glu levels on muscle nutrients of largemouth bass (% dry matter basis).
ItemsG1G2G3G4G5G6
Moisture77.28 ± 0.0176.70 ± 0.0076.55 ± 0.0177.04 ± 0.0076.45 ± 0.0077.38 ± 0.00
Protein18.71 ± 0.02 d19.19 ± 0.03 c19.74 ± 0.01 a19.21 ± 0.01 c19.57 ± 0.04 b18.62 ± 0.02 e
Lipid3.49 ± 0.03 bc3.62 ± 0.04 a3.53 ± 0.00 b3.46 ± 0.02 bcd3.39 ± 0.02 d3.41 ± 0.00 cd
Ash1.23 ± 0.031.28 ± 0.001.26 ± 0.021.33 ± 0.051.27 ± 0.021.27 ± 0.02
1 Values are mean ± SE of three replicate groups, with 9 fish per tank. Mean values with different superscripts in the same row are significantly different (p < 0.05).
Table 7. Effects of different dietary Glu levels on amino acid composition of muscle of largemouth bass (DM basis, g/kg) 1.
ParametersG1G2G3G4G5G6
EAA
Met2.27 ± 0.25 a2.30 ± 0.03 a2.34 ± 0.11 a1.98 ± 0.01 b1.71 ± 0.13 bc1.56 ± 0.07 c
Lys6.53 ± 0.32 b6.67 ± 0.34 b7.70 ± 0.21 a6.14 ± 0.08 b5.89 ± 0.13 b5.80 ± 0.87 b
Thr3.13 ± 0.08 b3.52 ± 0.03 ab3.84 ± 0.02 a3.35 ± 0.41 ab3.30 ± 0.48 ab3.44 ± 0.14 ab
Ile3.27 ± 0.183.19 ± 0.203.38 ± 0.383.16 ± 0.123.48 ± 0.363.43 ± 0.26
His1.44 ± 0.281.72 ± 0.111.92 ± 0.031.69 ± 0.171.66 ± 0.281.46 ± 0.22
Val3.52 ± 0.223.42 ± 0.203.78 ± 0.163.40 ± 0.153.31 ± 0.393.58 ± 0.19
Leu5.68 ± 0.195.52 ± 0.305.89 ± 0.485.82 ± 0.575.91 ± 0.795.24 ± 0.70
Arg4.11 ± 0.084.36 ± 0.244.57 ± 0.224.31 ± 0.444.47 ± 0.164.58 ± 0.30
Phe3.12 ± 0.173.06 ± 0.232.93 ± 0.163.04 ± 0.153.05 ± 0.292.69 ± 0.25
NEAA
Asp7.17 ± 0.157.27 ± 0.367.85 ± 0.547.93 ± 0.707.27 ± 0.147.64 ± 0.01
Ser2.73 ± 0.083.13 ± 0.013.20 ± 0.472.97 ± 0.412.99 ± 0.493.36 ± 0.23
Glu10.61 ± 0.25 b11.03 ± 0.42 b12.26 ± 0.25 a11.26 ± 0.52 b11.12 ± 0.32 b10.46 ± 0.03 b
Gly3.31 ± 0.12 b3.68 ± 0.25 ab4.04 ± 0.04 ab3.65 ± 0.44 b3.44 ± 0.53 b4.46 ± 0.39 a
Ala4.17 ± 0.094.44 ± 0.264.42 ± 0.414.42 ± 0.434.11 ± 0.213.98 ± 0.55
Cys0.34 ± 0.130.37 ± 0.140.25 ± 0.050.33 ± 0.150.25 ± 0.110.22 ± 0.09
Pro2.50 ± 0.35 ab2.70 ± 0.05 ab2.76 ± 0.12 a2.44 ± 0.32 ab2.74 ± 0.15 a2.01 ± 0.54 b
Tyr2.58 ± 0.192.53 ± 0.142.48 ± 0.162.50 ± 0.162.62 ± 0.302.67 ± 0.21
∑EAAs33.08 ± 1.12 ab33.77 ± 1.12 ab36.36 ± 0.41 a32.90 ± 2.03 b32.78 ± 1.65 b31.76 ± 1.83 b
∑NEAAs33.40 ± 0.87 b35.14 ± 1.15 ab37.26 ± 1.61 a35.51 ± 2.72 ab34.54 ± 1.42 ab34.79 ± 0.48 ab
∑EAAs:∑NEAAs0.99 ± 0.02 a0.96 ± 0.02 ab0.98 ± 0.03 ab0.93 ± 0.03 ab0.95 ± 0.01 ab0.91 ± 0.04 b
∑EAAs:∑AAs0.50 ± 0.01 a0.49 ± 0.01 ab0.49 ± 0.01 ab0.48 ± 0.01 ab0.49 ± 0.00 ab0.48 ± 0.01 b
∑AAs66.48 ± 1.85 b68.90 ± 2.17 ab73.62 ± 1.96 a68.41 ± 4.67 ab67.32 ± 3.06 ab66.55 ± 2.31 b
EAAs: essential amino acids; NEAAs: non-essential amino acids; ∑EAAs: total essential amino acids; ∑NEAAs: total non-essential amino acids. 1 Values are means ± SEM. Three replicates were selected, with 9 fish per replicate. Values within the same rows with different superscripts are significantly different (p < 0.05).
Table 8. Effects of different dietary Glu levels on free amino acid composition of muscle of largemouth bass (wet weight, mg/kg) 1.
ParametersG1G2G3G4G5G6
Asp0.10 ± 0.02 b0.15 ± 0.02 ab0.16 ± 0.02 a0.13 ± 0.01 ab0.15 ± 0.02 ab0.16 ± 0.03 a
Thr0.92 ± 0.061.34 ± 0.391.39 ± 0.341.43 ± 0.181.33 ± 0.210.98 ± 0.10
Ser0.31 ± 0.020.57 ± 0.270.44 ± 0.150.50 ± 0.120.60 ± 0.190.51 ± 0.10
Glu0.45 ± 0.160.48 ± 0.370.59 ± 0.330.72 ± 0.430.51 ± 0.230.37 ± 0.12
Gly7.12 ± 1.27 b9.17 ± 2.41 ab11.67 ± 0.93 a11.00 ± 1.73 ab8.72 ± 0.69 ab9.34 ± 2.89 ab
Ala2.03 ± 0.50 b2.77 ± 0.24 ab2.67 ± 0.45 ab2.69 ± 0.42 ab3.18 ± 0.19 a2.49 ± 0.53 ab
Val0.19 ± 0.020.27 ± 0.060.25 ± 0.030.28 ± 0.040.29 ± 0.030.18 ± 0.11
Cys0.15 ± 0.05 b0.23 ± 0.01 a0.25 ± 0.04 a0.21 ± 0.00 a0.24 ± 0.01 a0.22 ± 0.03 a
Met0.12 ± 0.02 c0.16 ± 0.01 ab0.17 ± 0.01 a0.16 ± 0.00 ab0.15 ± 0.01 abc0.14 ± 0.01 bc
Ile0.11 ± 0.04 b0.15 ± 0.01 ab0.16 ± 0.03 ab0.18 ± 0.02 a0.16 ± 0.01 ab0.13 ± 0.03 ab
Leu0.20 ± 0.05 b0.27 ± 0.05 ab0.28 ± 0.02 ab0.33 ± 0.04 a0.30 ± 0.02 ab0.25 ± 0.05 ab
Tyr0.07 ± 0.01 c0.10 ± 0.02 bc0.11 ± 0.01 ab0.13 ± 0.01 a0.09 ± 0.01 bc0.10 ± 0.00 bc
Phe0.09 ± 0.010.11 ± 0.030.11 ± 0.020.11 ± 0.010.11 ± 0.020.10 ± 0.01
Lys0.81 ± 0.39 b1.13 ± 0.28 ab1.48 ± 0.37 a1.30 ± 0.18 ab1.07 ± 0.11 ab0.96 ± 0.12 ab
His4.09 ± 0.814.44 ± 0.784.54 ± 0.964.46 ± 0.544.01 ± 1.033.66 ± 1.20
Arg0.04 ± 0.00 b0.06 ± 0.01 ab0.09 ± 0.04 a0.05 ± 0.01 ab0.07 ± 0.02 ab0.06 ± 0.00 ab
Pro0.47 ± 0.20 b0.71 ± 0.28 ab1.20 ± 0.20 a0.62 ± 0.34 ab0.24 ± 0.02 b0.25 ± 0.01 b
∑AAs17.27 ± 0.75 d22.08 ± 2.39 bc25.56 ± 0.45 a24.32 ± 1.32 ab21.12 ± 0.35 bc19.82 ± 2.12 cd
EAAs6.57 ± 1.347.91 ± 0.568.47 ± 0.978.31 ± 0.277.48 ± 0.896.44 ± 1.43
DAAs9.71 ± 0.87 b12.57 ± 2.63 ab15.09 ± 1.33 a14.55 ± 1.50 a12.55 ± 1.02 ab12.37 ± 2.67 ab
DAAs: Delicious amino acids; FAAs: Free amino acids; ∑AAs: total amino acids. 1 Values are means ± SEM. Three replicates were selected, with 9 fish per replicate. Values within the same rows with different superscripts are significantly different (p < 0.05).
Table 9. Effects of different dietary Glu levels on muscle fatty acid content (% of total fatty acid) of largemouth bass 1.
Items 1G1G2G3G4G5G6
C6:00.24 ± 0.010.23 ± 0.010.21 ± 0.010.25 ± 0.040.24 ± 0.010.19 ± 0.06
C14:00.98 ± 0.08 bc0.96 ± 0.03 c1.07 ± 0.10 bc1.28 ± 0.06 a1.14 ± 0.06 ab1.10 ± 0.10 abc
C15:00.21 ± 0.130.11 ± 0.010.12 ± 0.030.13 ± 0.030.11 ± 0.010.12 ± 0.02
C16:020.72 ± 1.0120.93 ± 1.1019.56 ± 0.3920.47 ± 1.6021.44 ± 0.8921.99 ± 1.79
C17:00.27 ± 0.100.18 ± 0.040.23 ± 0.140.26 ± 0.130.28 ± 0.160.27 ± 0.14
C18:04.99 ± 0.445.05 ± 0.264.22 ± 0.394.28 ± 0.184.99 ± 0.245.02 ± 0.51
C20:00.12 ± 0.050.11 ± 0.030.10 ± 0.040.13 ± 0.040.10 ± 0.060.08 ± 0.04
C23:00.56 ± 0.05 a0.51 ± 0.05 ab0.45 ± 0.09 ab0.40 ± 0.02 b0.47 ± 0.04 ab0.51 ± 0.08 ab
SFAs28.08 ± 1.08 ab28.09 ± 1.20 ab25.95 ± 1.01 b27.19 ± 1.44 ab28.79 ± 0.47 ab29.29 ± 2.14 a
C16:13.03 ± 0.603.44 ± 0.623.92 ± 0.834.49 ± 1.183.86 ± 1.213.90 ± 0.80
C18:1n9t0.28 ± 0.040.26 ± 0.050.26 ± 0.040.28 ± 0.030.25 ± 0.030.26 ± 0.03
C18:1n9c23.87 ± 1.7923.93 ± 1.6224.11 ± 0.4326.48 ± 1.1825.78 ± 3.2325.52 ± 2.38
C20:1n90.08 ± 0.000.08 ± 0.010.07 ± 0.010.08 ± 0.010.09 ± 0.010.09 ± 0.01
C22:1n90.09 ± 0.020.09 ± 0.030.05 ± 0.020.06 ± 0.020.07 ± 0.020.07 ± 0.01
C24:1n90.16 ± 0.03 a0.09 ± 0.02 b0.11 ± 0.02 ab0.11 ± 0.01 ab0.13 ± 0.02 ab0.11 ± 0.02 ab
MUFAs27.51 ± 2.3427.90 ± 1.4328.52 ± 1.2231.51 ± 2.3230.18 ± 4.3929.94 ± 3.06
C18:2n6c20.59 ± 0.7620.61 ± 0.8821.94 ± 0.0919.22 ± 3.2420.62 ± 3.9019.23 ± 3.44
C18:3n60.40 ± 0.040.36 ± 0.060.31 ± 0.080.34 ± 0.080.39 ± 0.060.35 ± 0.04
C18:3n31.44 ± 0.141.44 ± 0.271.24 ± 0.331.20 ± 0.141.50 ± 0.291.37 ± 0.31
C20:20.79 ± 0.030.80 ± 0.080.67 ± 0.130.73 ± 0.120.84 ± 0.140.79 ± 0.05
C20:3n60.51 ± 0.040.52 ± 0.040.41 ± 0.020.40 ± 0.050.51 ± 0.070.50 ± 0.01
C22:20.04 ± 0.000.03 ± 0.020.04 ± 0.020.05 ± 0.020.05 ± 0.010.04 ± 0.01
C20:5n31.20 ± 0.231.12 ± 0.061.18 ± 0.091.16 ± 0.151.46 ± 0.151.39 ± 0.22
C22:6n318.14 ± 1.78 a18.84 ± 1.45 a19.27 ± 0.78 a17.70 ± 0.48 ab15.07 ± 0.36 b16.55 ± 1.44 ab
PUFAs43.12 ± 2.7943.72 ± 1.0445.06 ± 0.3740.79 ± 3.4340.43 ± 4.4540.24 ± 4.09
UFAs70.63 ± 0.48 b71.61 ± 1.23 ab73.58 ± 1.20 a72.29 ± 1.24 ab70.61 ± 0.25 b70.18 ± 1.91 b
EFAs22.04 ± 0.8922.06 ± 0.8523.18 ± 0.2820.41 ± 3.3022.12 ± 4.1920.60 ± 3.75
n-3PUFA20.78 ± 2.07 ab21.40 ± 1.63 a21.69 ± 0.39 a20.05 ± 0.63 ab18.03 ± 0.36 b19.31 ± 1.59 ab
n-6PUFA21.51 ± 0.7121.49 ± 0.8022.66 ± 0.1419.96 ± 3.3421.51 ± 4.0220.09 ± 3.44
n-3/n-60.96 ± 0.071.00 ± 0.110.96 ± 0.021.03 ± 0.160.86 ± 0.130.99 ± 0.18
1 FA: fatty acid; SFAs: saturated fatty acids; MUFAs: monounsaturated fatty acids; PUFAs: polyunsaturated fatty acids; n-3 PUFA: sum of n-3 polyunsaturated fatty acids; n-6 PUFA: sum of n-6 polyunsaturated fatty acids; EFAs: essential fatty acids. Values are means ± SEM. Three replicates were selected, with 6 fish per replicate. Values within the same rows with different superscripts are significantly different (p < 0.05).
Table 10. Effects of different dietary Glu levels on physicochemical quality and textural properties of muscle of largemouth bass.
ItemsG1G2G3G4G5G6
Cooking loss (%)22.99 ± 3.8722.49 ± 2.9221.95 ± 3.1521.65 ± 3.4721.91 ± 3.4121.37 ± 4.05
Drip loss (%)9.94 ± 2.50 a9.40 ± 2.67 ab8.05 ± 1.47 abc7.43 ± 1.15 bc6.44 ± 1.78 c6.94 ± 2.36 c
pH 45min6.65 ± 0.13 ab6.61 ± 0.15 abc6.60 ± 0.15 abc6.71 ± 0.12 a6.51 ± 0.19 bc6.47 ± 0.17 c
pH 24h6.29 ± 0.09 b6.28 ± 0.14 b6.39 ± 0.12 b6.53 ± 0.20 a6.32 ± 0.12 b6.29 ± 0.09 b
Hardness (N)3.90 ± 0.404.05 ± 0.573.81 ± 0.753.70 ± 0.823.88 ± 0.643.84 ± 0.73
Adhesiveness (N.mm)0.45 ± 0.12 b0.53 ± 0.13 ab0.58 ± 0.09 ab0.56 ± 0.12 ab0.64 ± 0.13 a0.53 ± 0.22 ab
Cohesiveness (Ratio)0.57 ± 0.07 ab0.52 ± 0.10 b0.63 ± 0.08 a0.56 ± 0.11 ab0.57 ± 0.12 ab0.51 ± 0.07 b
Springiness (mm)9.61 ± 0.979.97 ± 0.039.24 ± 1.099.83 ± 0.269.96 ± 0.269.22 ± 1.42
Gumminess (N)1.49 ± 0.58 b1.89 ± 0.59 ab2.35 ± 0.39 a2.3 ± 0.42 a1.91 ± 0.34 ab1.92 ± 0.52 ab
Chewiness (mj)9.97 ± 1.8910.19 ± 2.0112.13 ± 0.7612.29 ± 2.0512.44 ± 2.5612.48 ± 3.24
Shear force (N)3.76 ± 0.423.86 ± 0.473.89 ± 0.543.80 ± 0.453.55 ± 0.233.60 ± 0.32
Values are means ± SE of three replicate groups, with 9 fish per tank. Mean values with different superscripts in the same row are significantly different (p < 0.05).
Table 11. Effects of different dietary Glu levels on flesh biochemical indices of largemouth bass.
ParametersG1G2G3G4G5G6
CtsB (U/g protein)0.75 ± 0.01 a0.74 ± 0.01 b0.73 ± 0.00 c0.73 ± 0.01 c0.74 ± 0.01 b0.76 ± 0.01 a
CtsL (U/g protein)0.63 ± 0.000.63 ± 0.000.64 ± 0.000.64 ± 0.010.64 ± 0.010.63 ± 0.00
Water-soluble protein2.45 ± 0.462.39 ± 0.112.40 ± 0.052.42 ± 0.102.37 ± 0.302.44 ± 0.14
Salt-soluble protein2.18 ± 0.14 c2.26 ± 0.11 c2.49 ± 0.04 b2.61 ± 0.22 a2.50 ± 0.12 ab2.58 ± 0.09 ab
LD (mmol/g prot)2.34 ± 0.47 ab1.86 ± 0.25 ab1.45 ± 0.34 b1.51 ± 0.17 b1.95 ± 0.41 ab2.45 ± 0.51 a
TP (g/L)6.87 ± 1.17 b7.12 ± 1.07 b8.81 ± 1.34 a8.04 ± 0.92 ab7.20 ± 1.61 b7.07 ± 1.47 b
Cathepsin B: CtsB; Cathepsin L: CtsL; Lactic acid: LD; Total protein: TP.
Disclaimer/Publisher’s Note: The statements, opinions and data contained in all publications are solely those of the individual author(s) and contributor(s) and not of MDPI and/or the editor(s). MDPI and/or the editor(s) disclaim responsibility for any injury to people or property resulting from any ideas, methods, instructions or products referred to in the content.

