
Age, Growth, and Mortality of the Common Pandora (Pagellus erythrinus, L. 1758) in the Central Aegean Sea: Insights into Population Dynamics


Abstract
:
1. Introduction
2. Materials and Methods
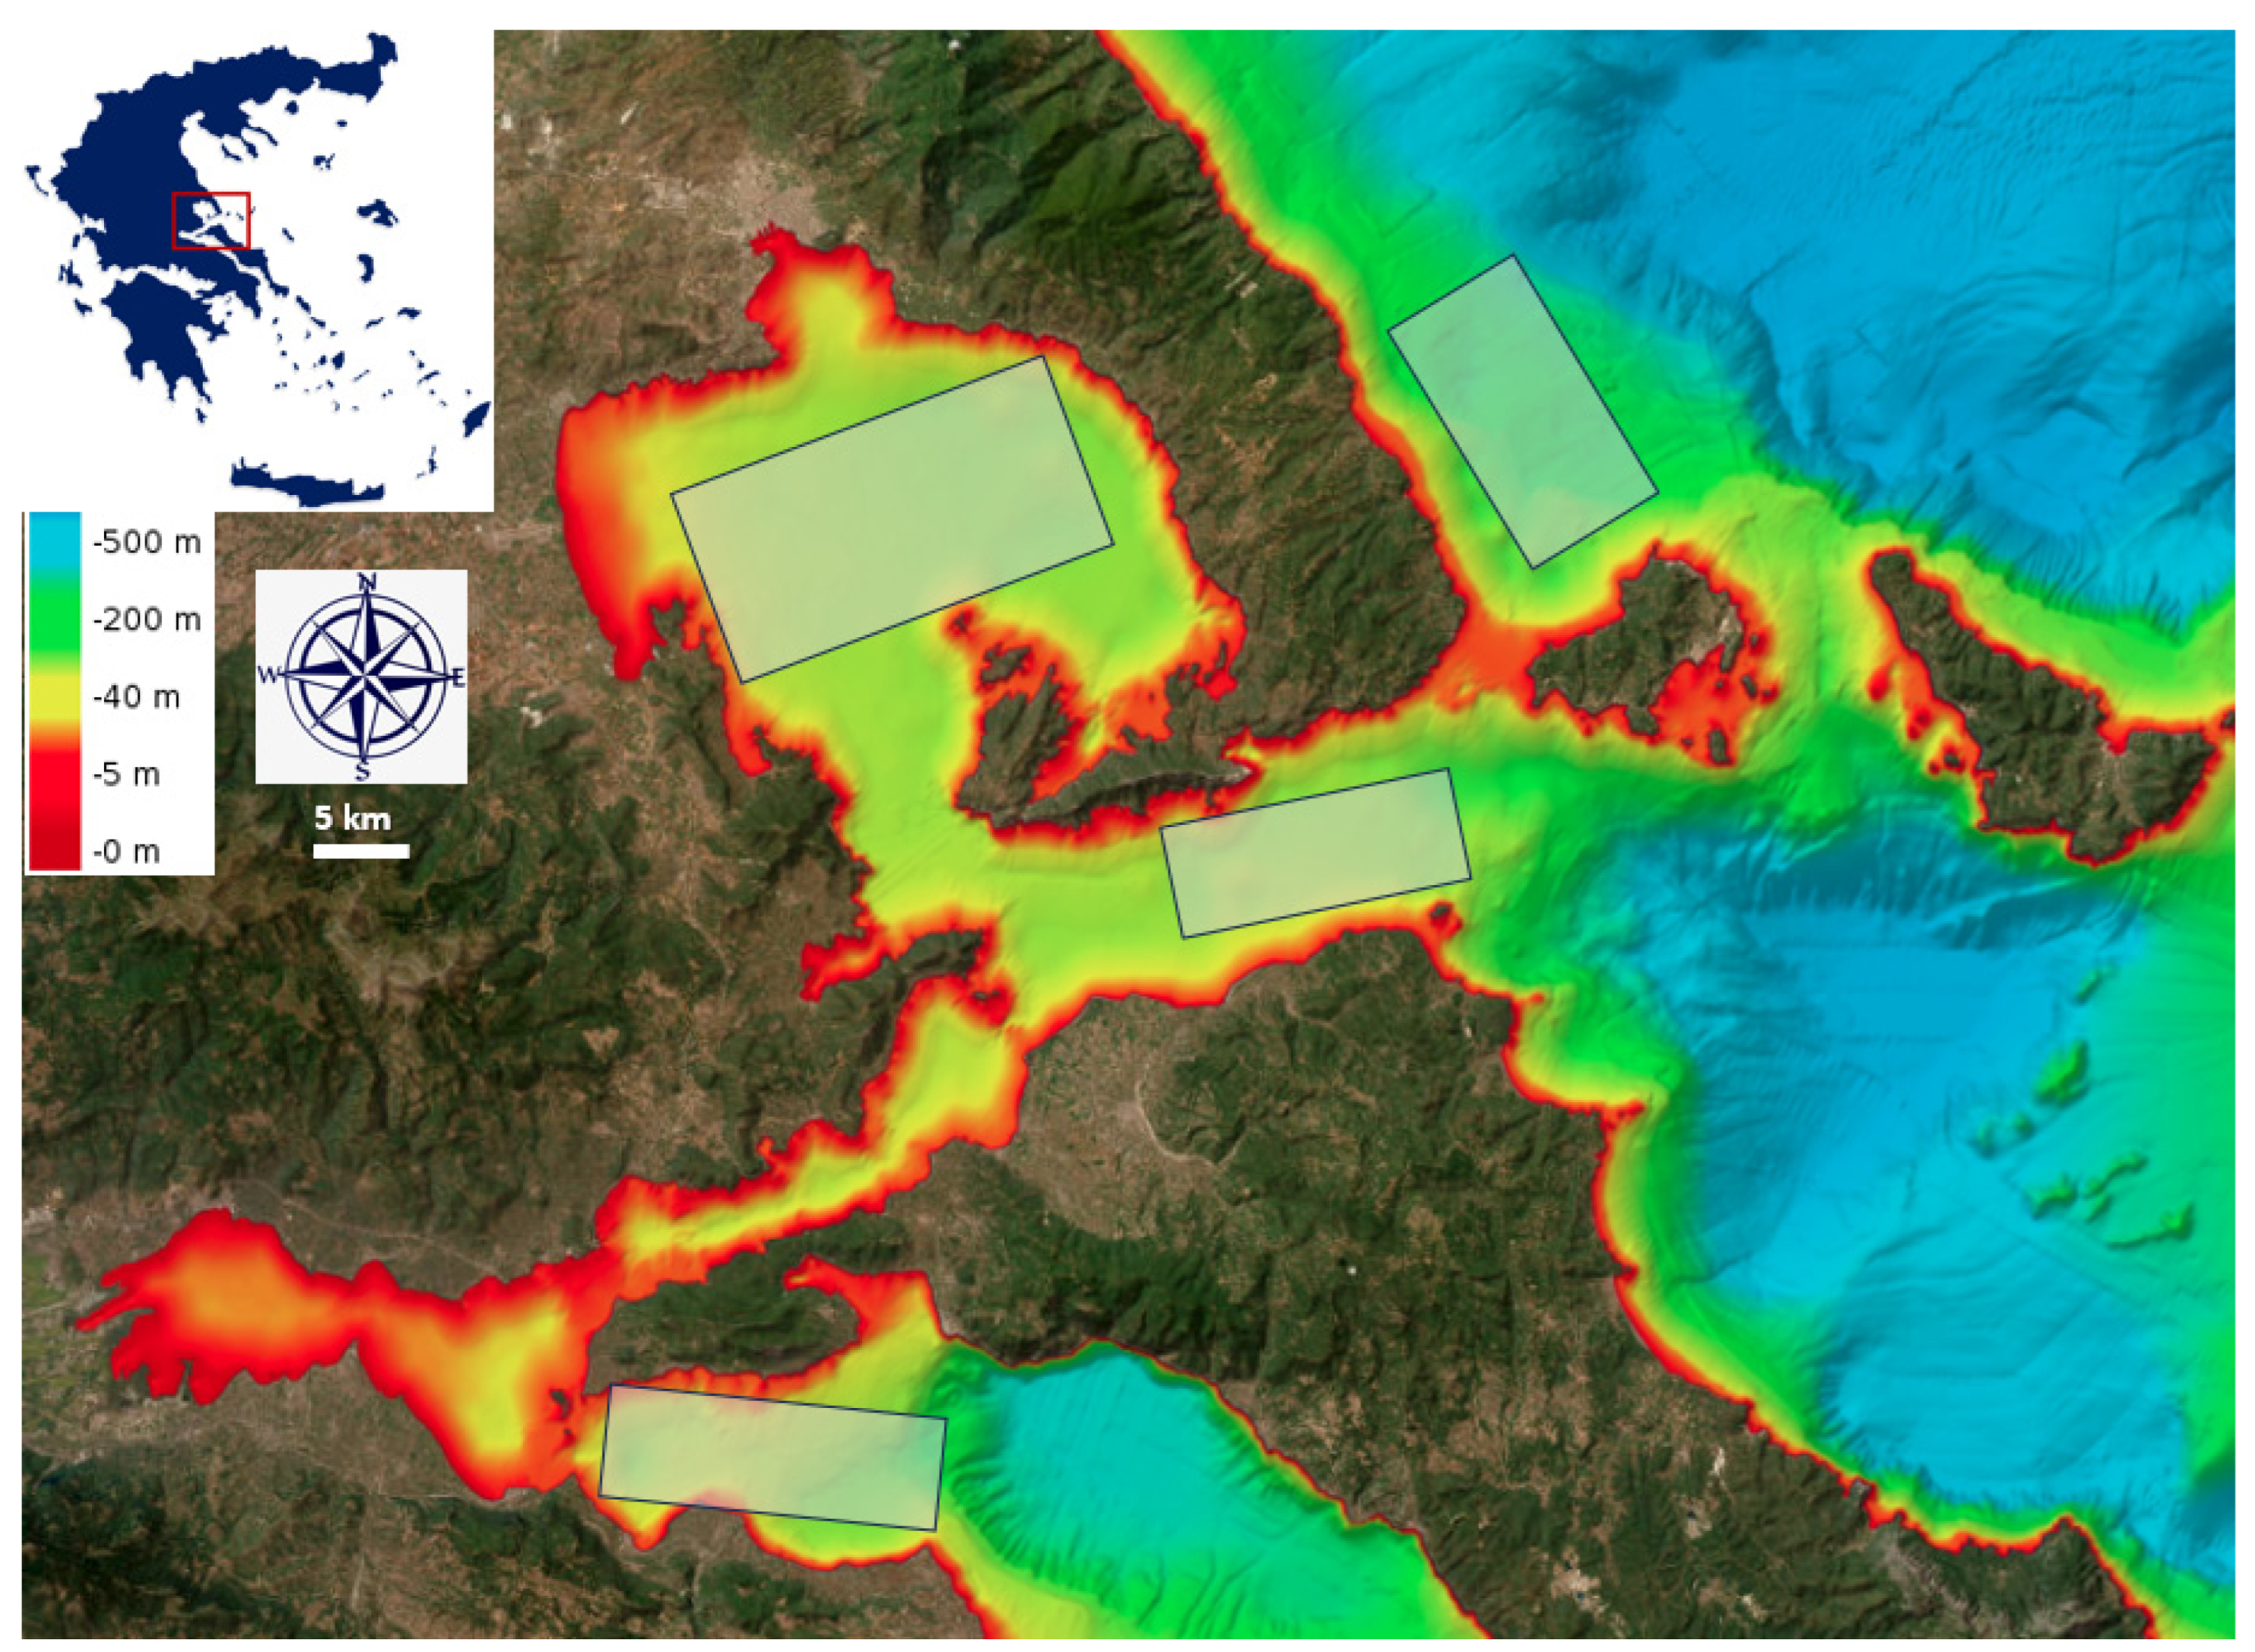
2.1. Study Area and Sampling Methodology
2.2. The Length–Weight Relationship
2.3. Age
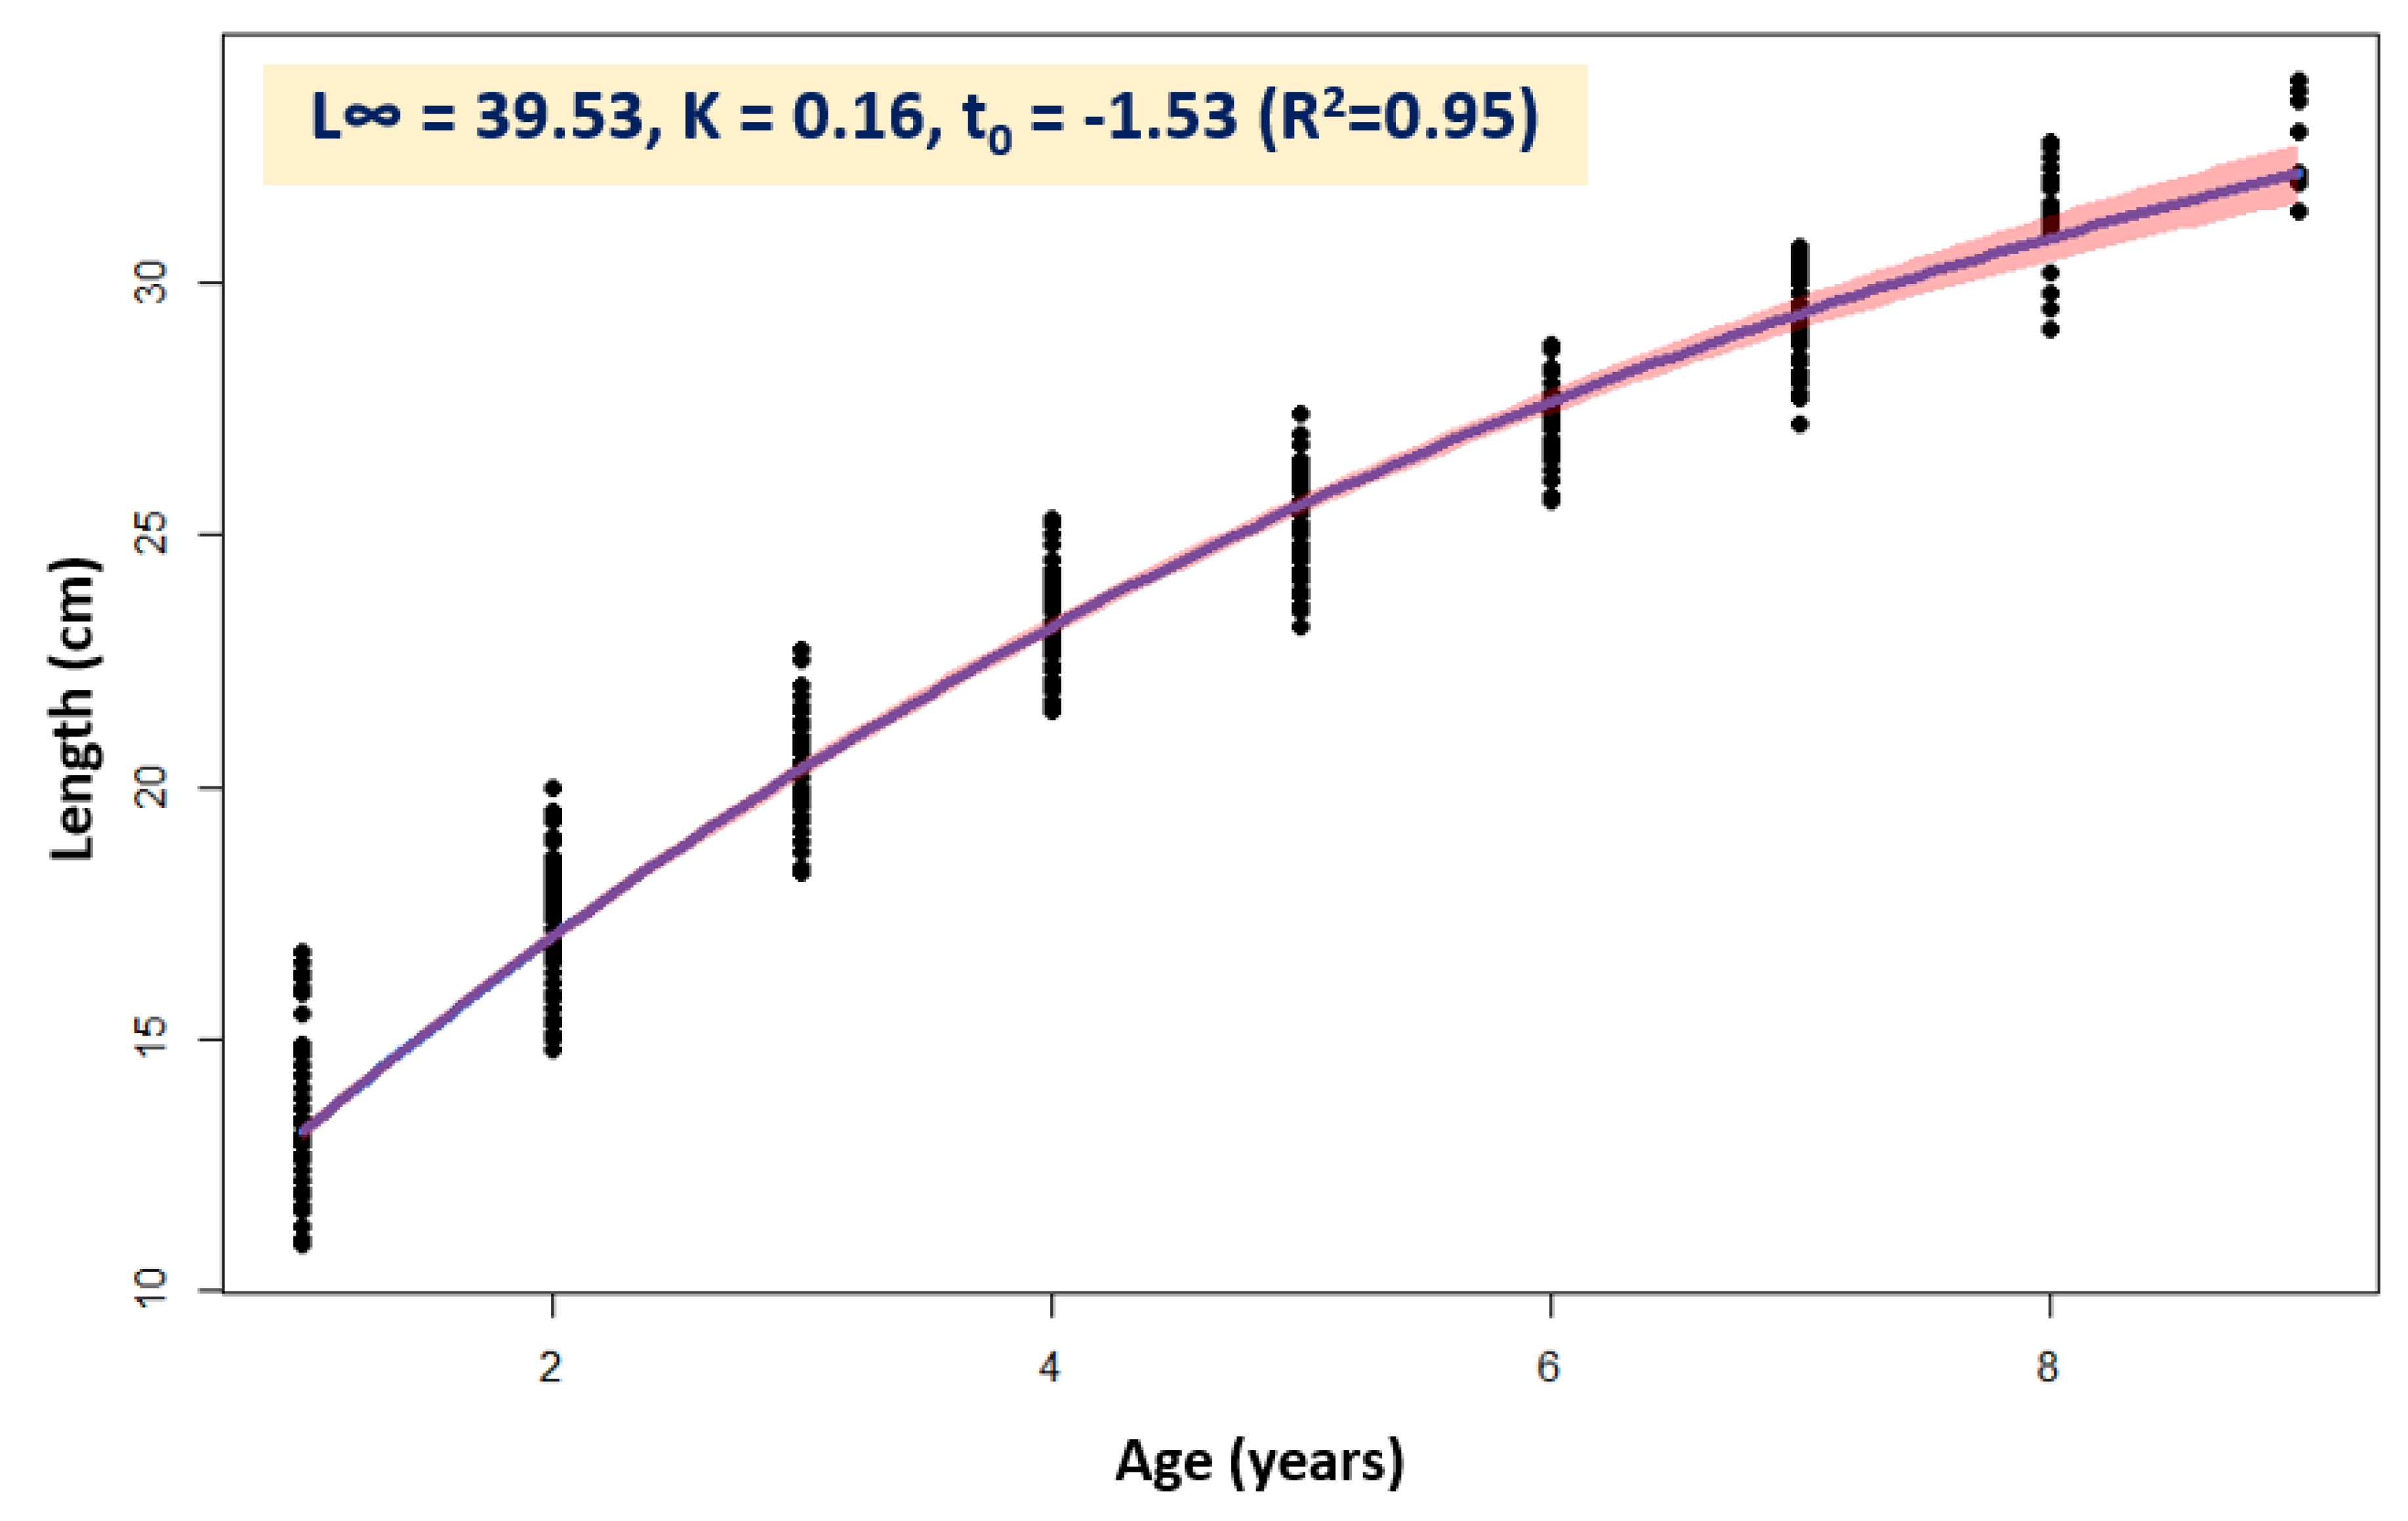
2.4. Growth
2.5. Mortality and Exploitation Rate
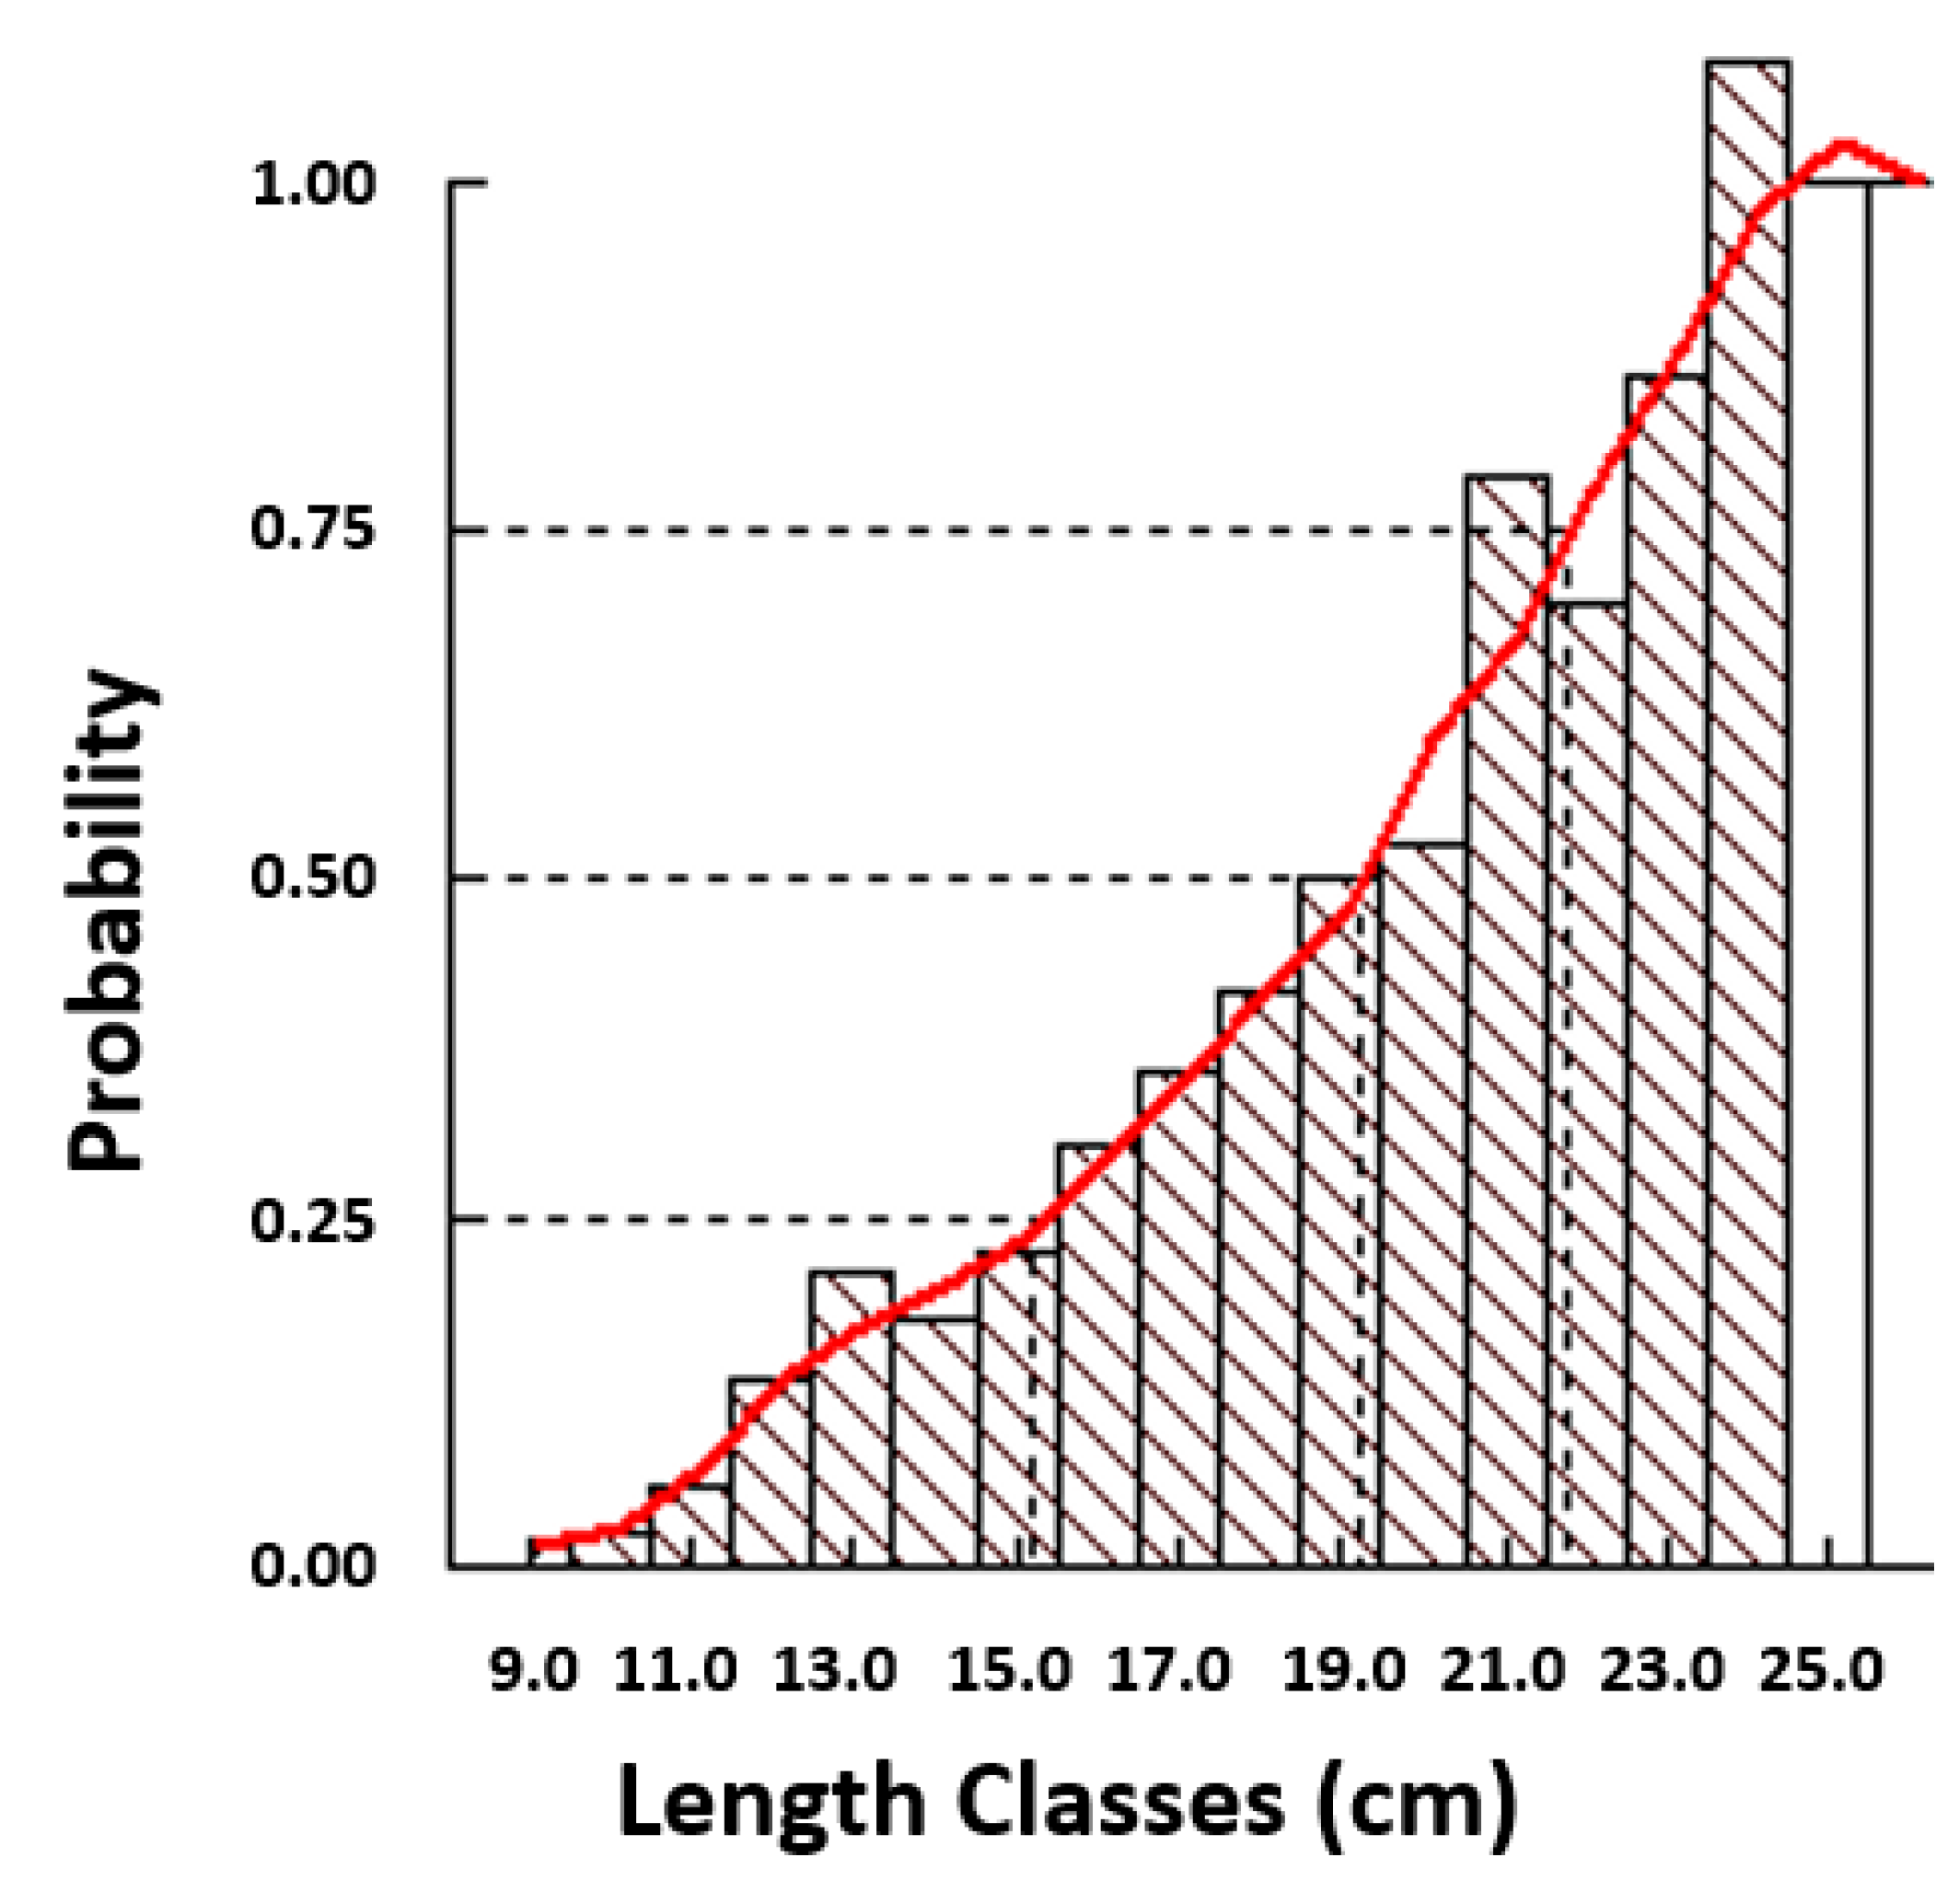
2.6. Relative Y/R and B/R Analysis: Knife-Edge Selection
3. Results
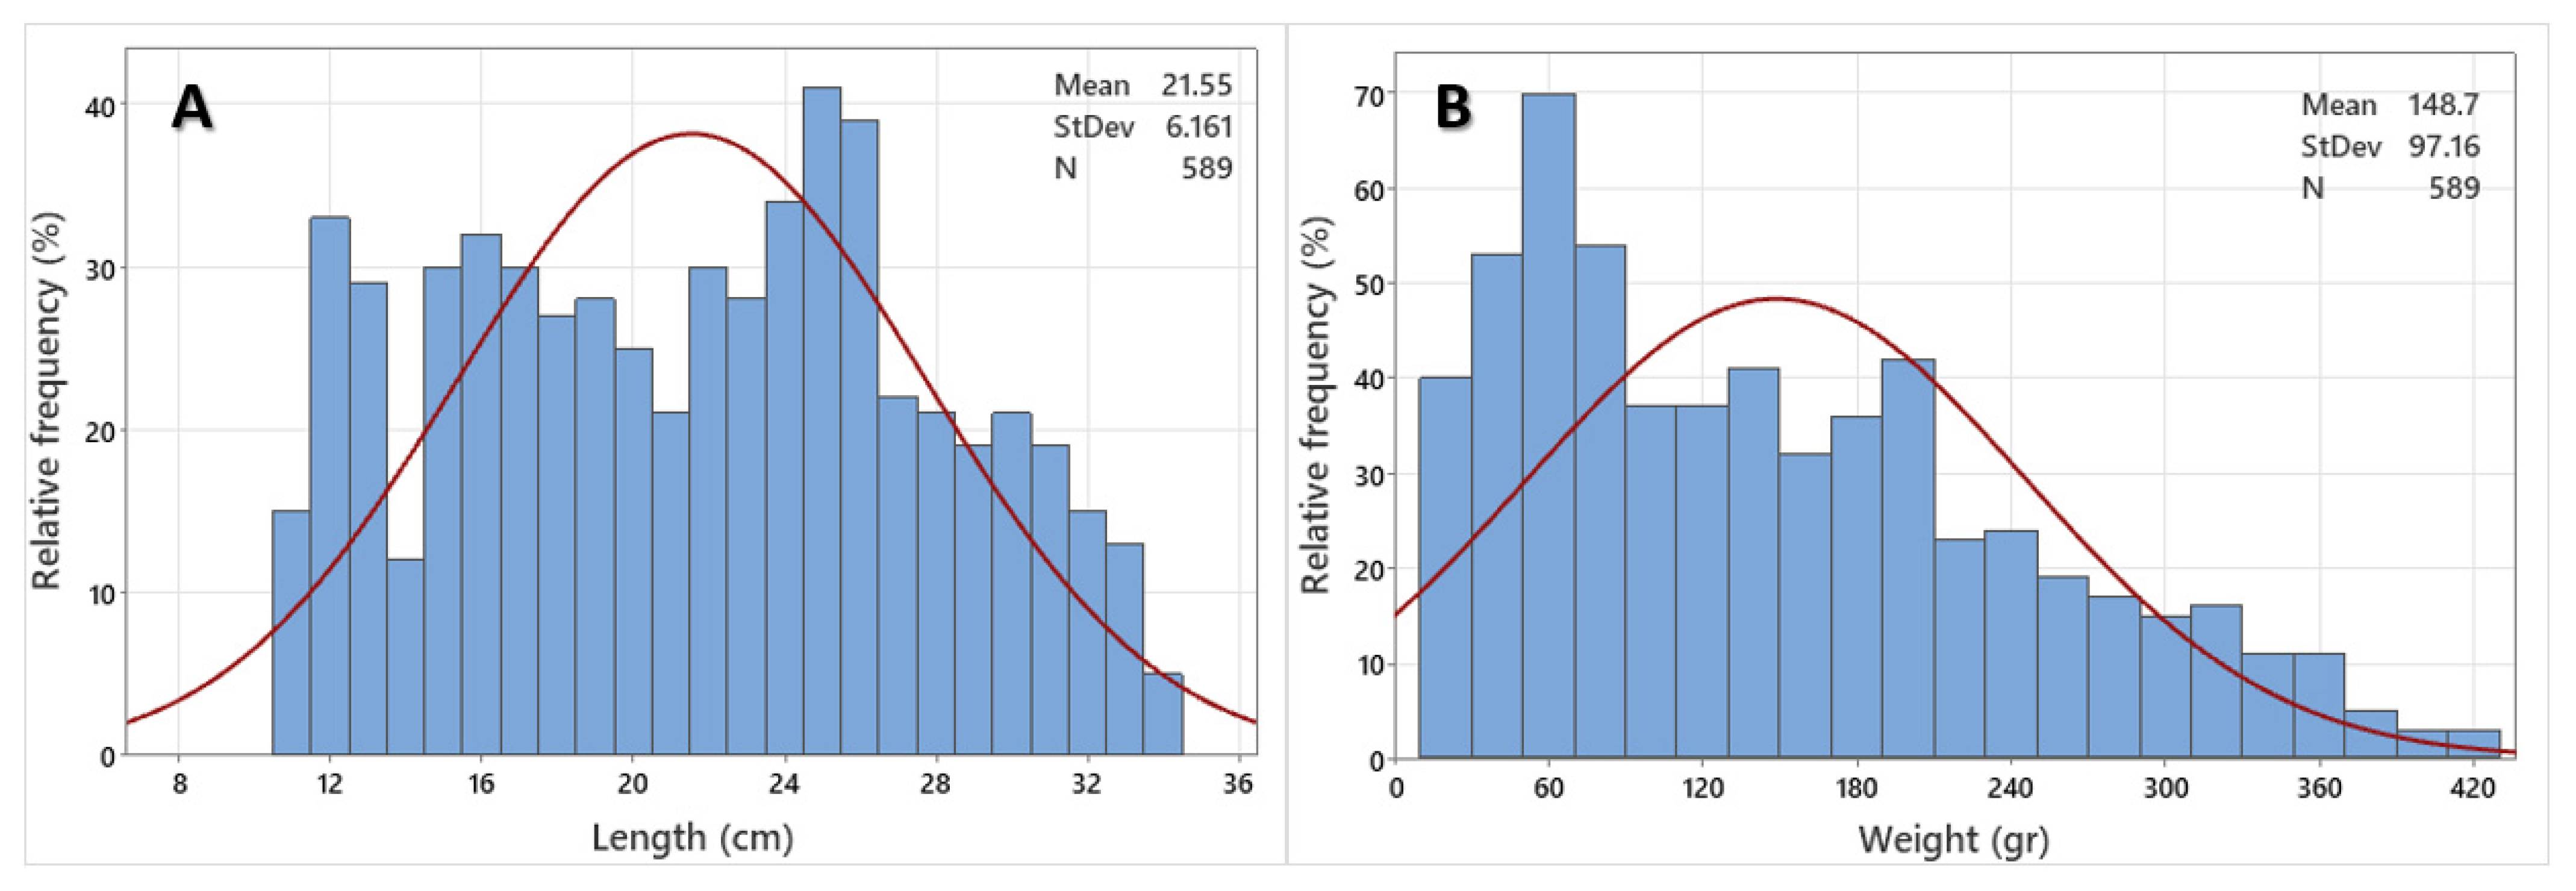
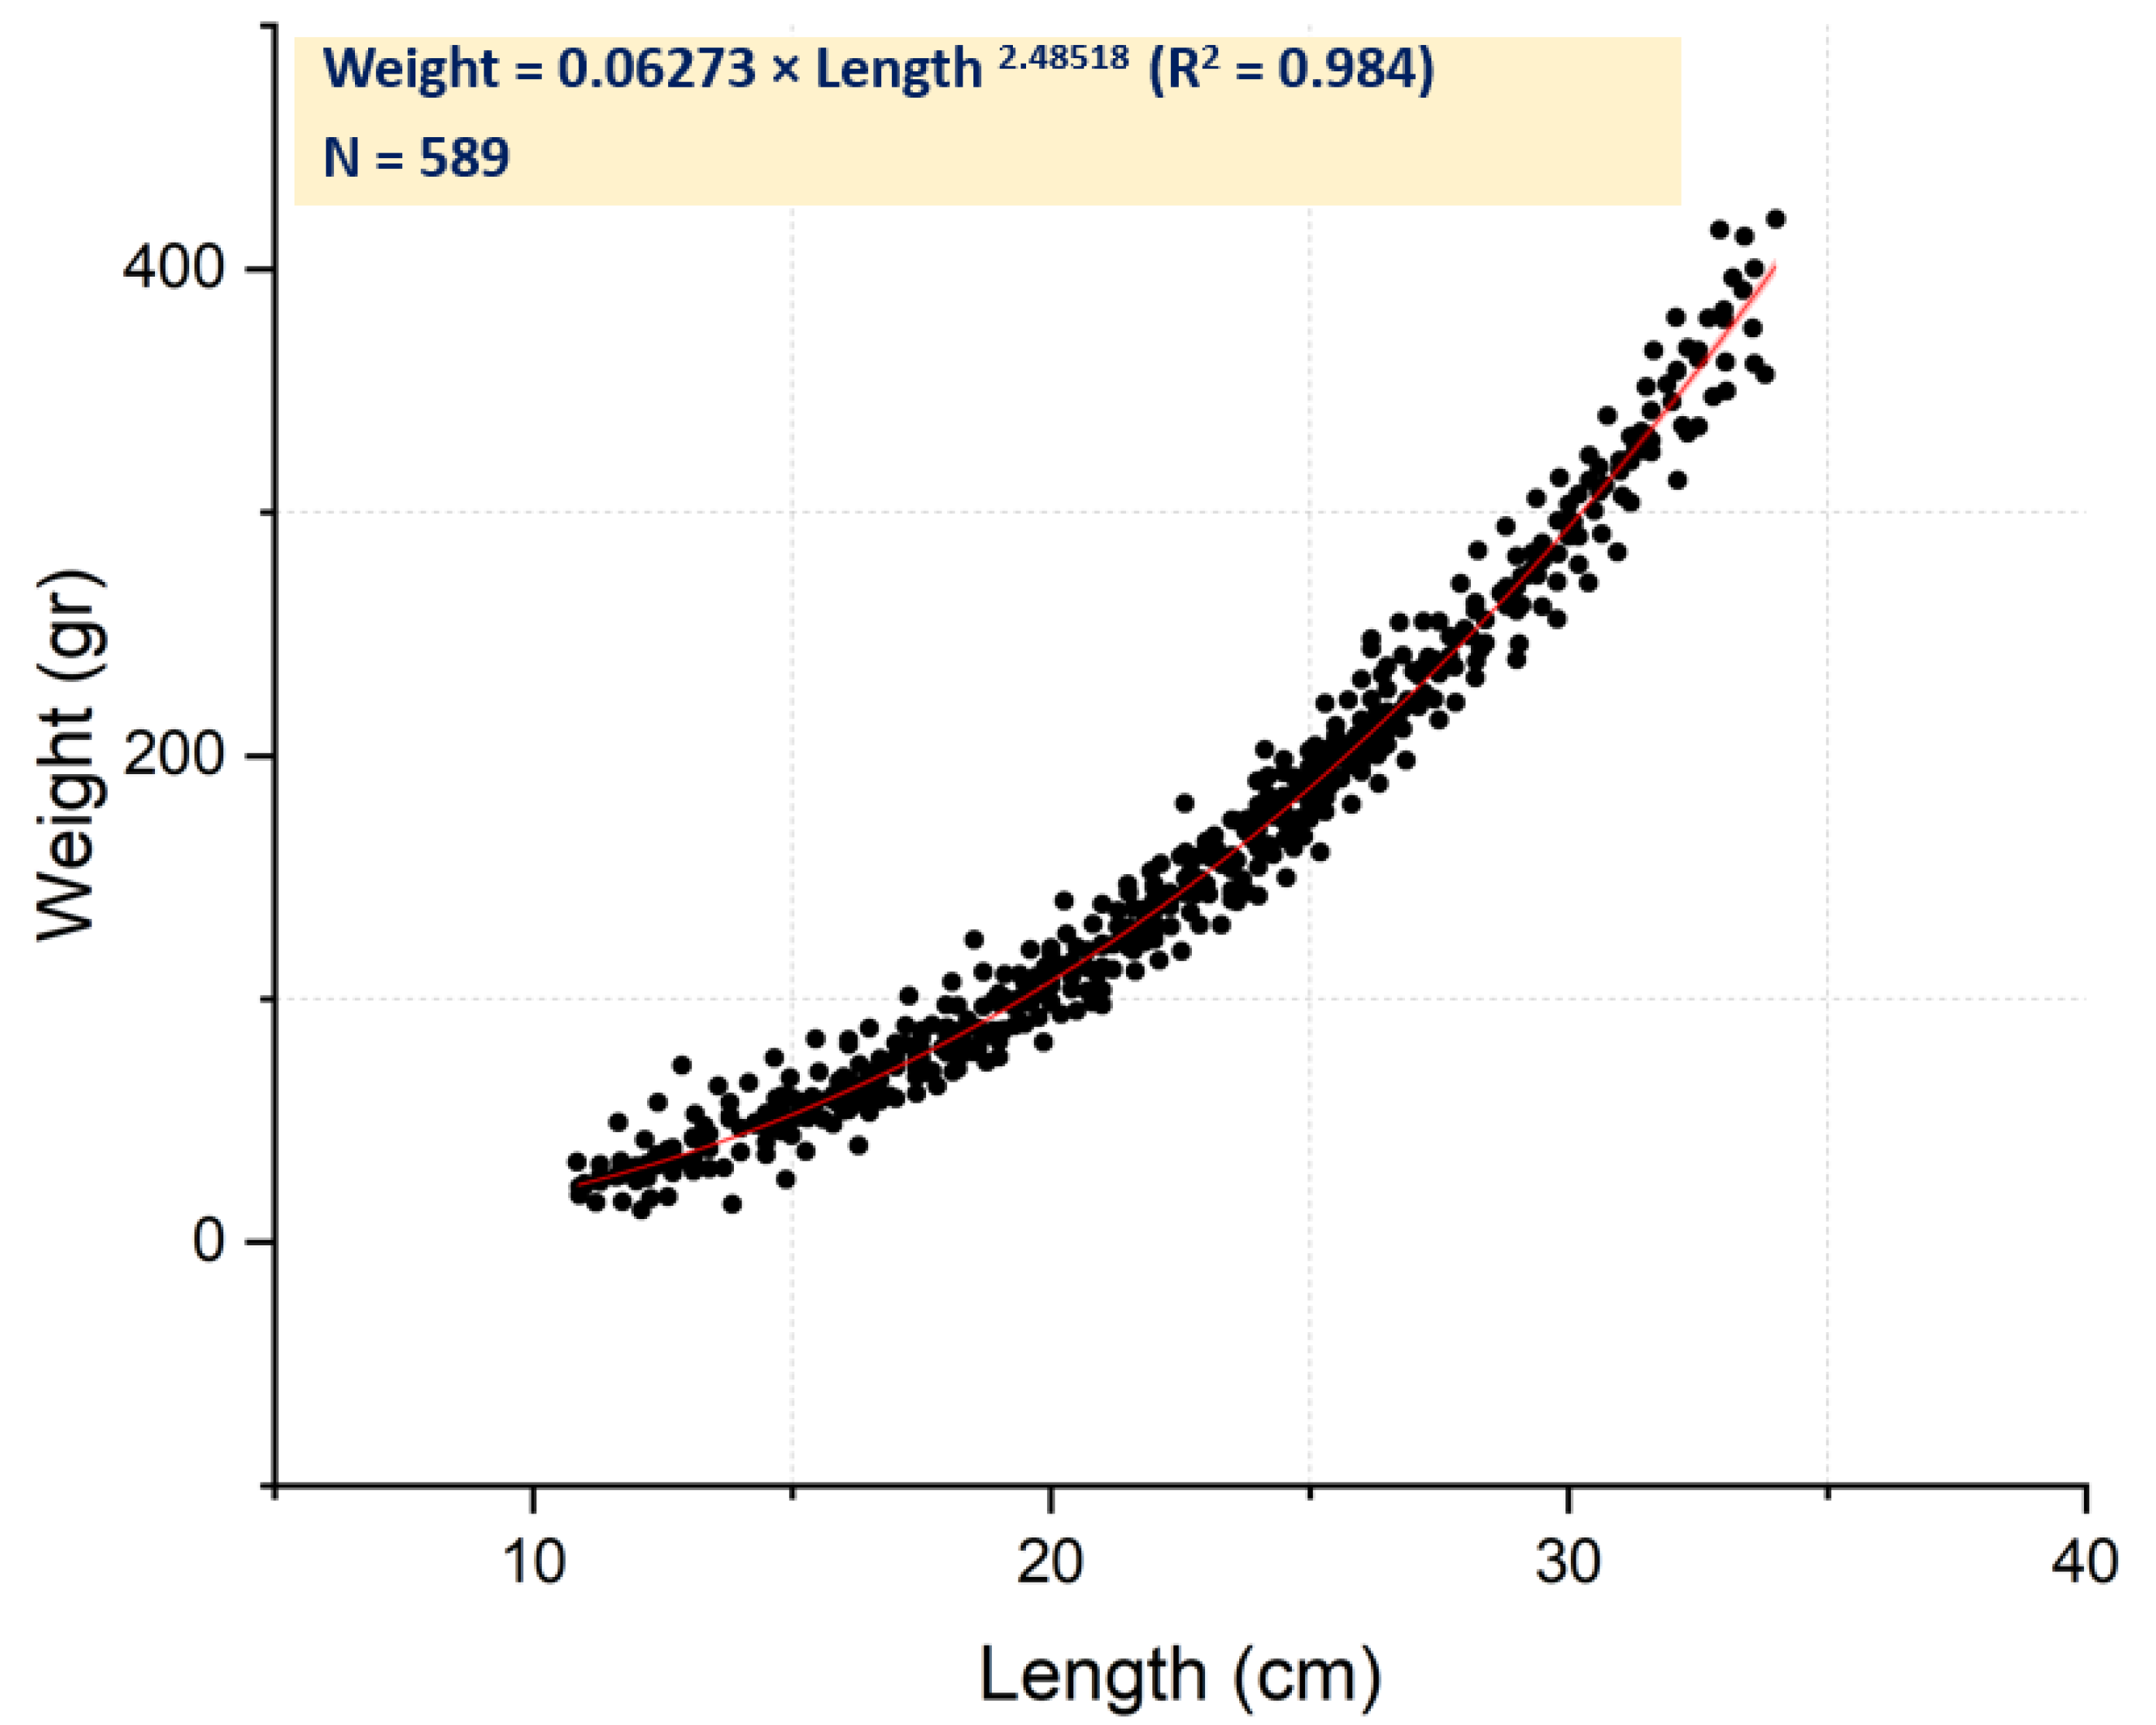
3.1. Population Parameters and Length–Weight Relationship
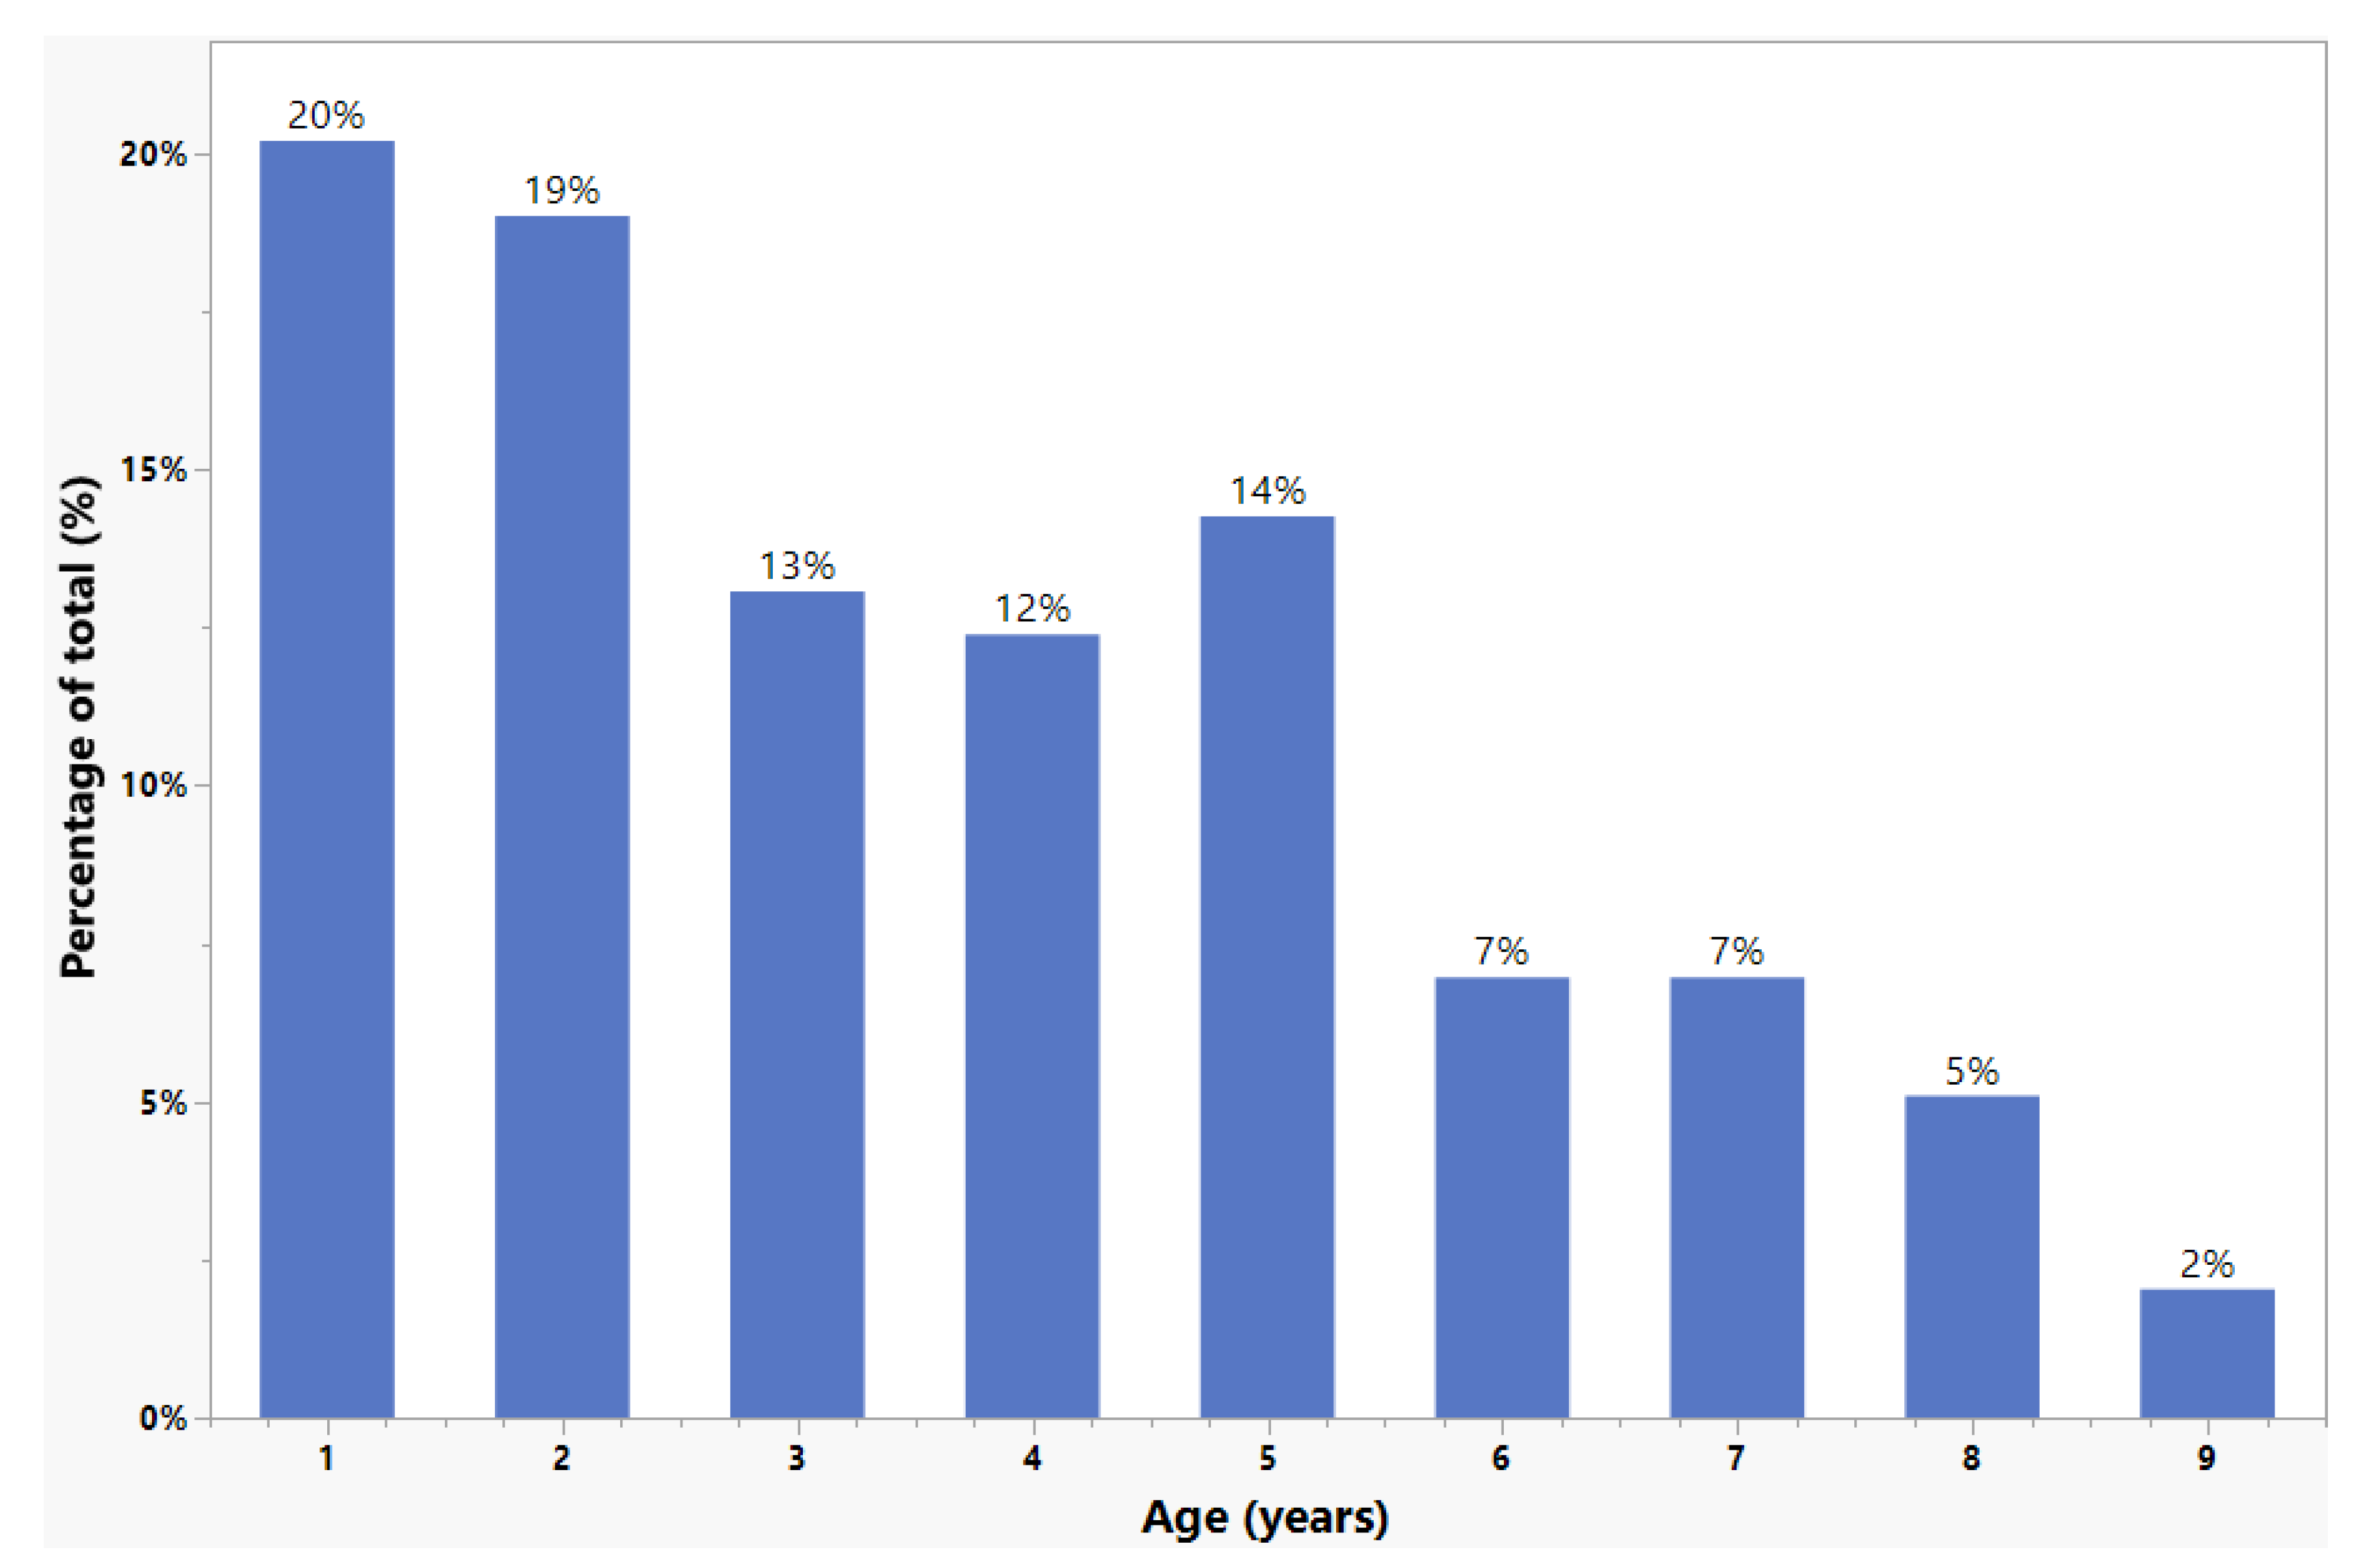
3.2. Age Composition and Growth
3.3. Mortality and Exploitation Rate
4. Discussion
5. Conclusions
Author Contributions
Funding
Institutional Review Board Statement
Informed Consent Statement
Data Availability Statement
Conflicts of Interest
References
- Bauchot, M.; Hureau, J. Fishes of the north-eastern Atlantic and the Mediterranean. In Sparidae; Whitehead, P., Bauchot, M., Hureau, J., Nielsen, J., Tortonese, E., Eds.; UNESCO: Paris, France, 1986; pp. 883–907. [Google Scholar]
- Fischer, W.; Bauchot, M.; Schneider, M. Fiches FAO D’identification Desespèces Pour les Besoins de la Pêche. (Révision 1). Méditerranée et mer Noire. Zone de pêche 37. Volume II. Vertébrés. Publication Préparée Parla FAO, Résultat d’un Accord Entre la FAO et laCommission des Com; FAO: Rome, Italy, 1987. [Google Scholar]
- Bauchot, M.; Fischer, W.; Schneider, M. Vertébrés. In Méditerranée et Mer Noire; FAO: Rome, Italy, 1987; Volume II. [Google Scholar]
- Jukic, S.; Arneri, E. Distribution of hake (Merluccius merluccius L.) striped mullet (Mullus barbatus L.) and pandora (Pagellus erythinus L.) in the Adriatic Sea. FAO Fish. Rep. 1983, 85–91. [Google Scholar]
- Papaconstantinou, C.; Mytilineou, C.; Panos, T. Aspects of the life history and fishery of red pandora, Pagellus erythrinus (Sparidae) off western Greece. Cybium 1988, 12, 267–280. [Google Scholar]
- Rachedi, M.; Dahel, A.T.; Boudjadi, Z.; Bensafia, N. Reproductive dynamic of the common Pandora Pagellus erythrinus (L., 1758) from EL-Kala coastline (Algerian east coast). Appl. Ecol. Environ. Res. 2025, 23, 1621–1633. [Google Scholar] [CrossRef]
- Fanelli, E.; Badalamenti, F.; D’Anna, G.; Pipitone, C.; Riginella, E.; Azzurro, E. Food partitioning and diet temporal variation in two coexisting sparids, Pagellus erythrinus and Pagellus acarne. J. Fish. Biol. 2011, 78, 869–900. [Google Scholar] [CrossRef]
- Šantić, M.; Paladin, A.; Rađa, B. Feeding habits of common pandora Pagellus erythrinus (Sparidae) from eastern central Adriatic Sea. Cybium 2011, 35, 83–90. [Google Scholar]
- Spedicato, M.T.; Greco, S.; Sophronidis, K.; Lembo, G.; Giordano, D.; Argyri, A. Geographical distribution, abundance and some population characteristics of the species of the genus Pagellus (Osteichthyes: Percirformes) in different areas of the Mediterranean. Sci. Mar. 2002, 66, 65–82. [Google Scholar]
- Daskalaki, E.; Koufalis, E.; Dimarchopoulou, D.; Tsikliras, A.C. Scientific progress made towards bridging the knowledge gap in the biology of Mediterranean marine fishes. PLoS ONE 2022, 17, e0277383. [Google Scholar]
- Martín, P.; Maynou, F.; Stelzenmüller, V.; Sacanell, M. A small-scale fishery near a rocky littoral marine reserve in the northwestern Mediterranean (Medes Islands) after two decades of fishing prohibition. Sci. Mar. 2012, 76, 607–618. [Google Scholar]
- Klaoudatos, S.D.; Iakovopoulos, G.; Klaoudatos, D.S. Pagellus erythrinus (Common Pandora): A Promising Candidate Species for Enlarging the Diversity of Aquaculture Production. Aquac. Int. 2004, 12, 299–320. [Google Scholar] [CrossRef]
- Coelho, R.; Bentes, L.; Correia, C.; Gonçalves, J.M.S.; Lino, P.G.; Monteiro, P.; Ribeiro, J.; Erzini, K. Life history of the common pandora, Pagellus erythrinus (Linnaeus, 1758) (Actinopterygii: Sparidae) from southern Portugal. Braz. J. Oceanogr. 2010, 58, 233–245. [Google Scholar] [CrossRef]
- Busalacchi, B.; Bottari, T.; Giordano, D.; Profeta, A.; Rinelli, P. Distribution and biological features of the common pandora, Pagellus erythrinus (Linnaeus, 1758), in the southern Tyrrhenian Sea (Central Mediterranean). Helgol. Mar. Res. 2014, 68, 491–501. [Google Scholar] [CrossRef]
- Lteif, M.; Jemaa, S.; Mouawad, R.; Khalaf, G.; Lelli, S.; Fakhri, M. Population biology of the common pandora, Pagellus erythrinus (Linnaeus, 1758) along the Lebanese coast, Eastern Mediterranean. Egypt. J. Aquat. Res. 2020, 46, 57–62. [Google Scholar] [CrossRef]
- Mehanna, S.F. Age, growth and reproductive dynamics of the common pandora, Pagellus erythrinus from GFCM-GSA 26, Mediterranean Sea, Egypt. Iran. J. Ichthyol. 2022, 9, 32–42. [Google Scholar]
- Mahdi, H.; Bensahla Talet, L.; Boutiba, Z. Reproductive biology of the common pandora Pagellus erythrinus (Linnaeus, 1758) of Oran Bay (Algerian west coasts). Turk. J. Fish. Aquat. Sci. 2018, 18, 1–7. [Google Scholar] [CrossRef]
- Metin, G.; Ilkyaz, A.T.; Soykan, O.; Kinacigil, H.T. Biological characteristics of the common pandora, Pagellus erythrinus (Linnaeus, 1758), in the central Aegean Sea. Turk. J. Zool. 2011, 35, 307–315. [Google Scholar] [CrossRef]
- ELSTAT Hellenic Statistical Authority Sea fisheries. Available online: http://www.statistics.gr/ (accessed on 8 February 2025).
- Britten, G.L.; Dowd, M.; Worm, B. Changing recruitment capacity in global fish stocks. Proc. Natl. Acad. Sci. USA 2016, 113, 134–139. [Google Scholar] [CrossRef] [PubMed]
- Campana, S.E.; Thorrold, S.R. Otoliths, increments, and elements: Keys to a comprehensive understanding of fish populations? Can. J. Fish. Aquat. Sci. 2001, 58, 30–38. [Google Scholar] [CrossRef]
- Hordyk, A.; Ono, K.; Sainsbury, K.; Loneragan, N.; Prince, J. Some explorations of the life history ratios to describe length composition, spawning-per-recruit, and the spawning potential ratio. ICES J. Mar. Sci. 2015, 72, 204–216. [Google Scholar] [CrossRef]
- Kondylatos, G.; Theocharis, A.; Charokopou, M.; Perakis, E.; Mavrouleas, D.; Kalaentzis, K.; Pafras, D.; Klaoudatos, D. Life-History Traits of the Bluespotted Cornetfish Fistularia commersonii Rüppell, 1838 in Rhodes, Greece, with Notes on the Red Cornetfish Fistularia petimba Lacepède, 1803. Hydrobiology 2024, 3, 183–208. [Google Scholar] [CrossRef]
- Kondylatos, G.; Theocharis, A.; Mandalakis, M.; Avgoustinaki, M.; Karagyaurova, T.; Koulocheri, Z.; Vardali, S.; Klaoudatos, D. The Devil Firefish Pterois miles (Bennett, 1828): Life History Traits of a Potential Fishing Resource in Rhodes (Eastern Mediterranean). Hydrobiology 2024, 3, 31–50. [Google Scholar] [CrossRef]
- Somarakis, S.; Machias, A. Age, growth and bathymetric distribution of red pandora (Pagellus erythrinus) on the Cretan shelf (eastern Mediterranean). J. Mar. Biol. Assoc. UK 2002, 82, 149–160. [Google Scholar] [CrossRef]
- Pajuelo, J.G.; Lorenzo, J.M. Population biology of the common pandora Pagellus erythrinus (Pisces: Sparidae) off the Canary Islands. Fish. Res. 1998, 36, 75–86. [Google Scholar] [CrossRef]
- Abecasis, D.; Bentes, L.; Coelho, R.; Correia, C.; Lino, P.G.; Monteiro, P.; Gonçalves, J.M.S.; Ribeiro, J.; Erzini, K. Ageing seabreams: A comparative study between scales and otoliths. Fish. Res. 2008, 89, 37–48. [Google Scholar] [CrossRef]
- Fassatoui, C.; Hmida, L.; Jenhani, A.B.R.; Romdhane, M.S. Length-weight relationship and growth parameters of the commercial fish Pagellus erythrinus (Linnaeus, 1758) (Actinopterygii: Sparidae) from northern and southern Tunisia. Biol. Lett. 2019, 54, 3–11. [Google Scholar] [CrossRef]
- Ayyildiz, H.; Altin, A. Age and growth rates at the early life stages of common pandora (Pagellus erythrinus) based on analysis of otolith microstructure. Fish. Bull. 2018, 116, 183–189. [Google Scholar] [CrossRef]
- Lombarte, A.; Torres, G.J.; Morales-Nin, B. Specific Merluccius otolith growth patterns related to phylogenetics and environmental factors. J. Mar. Biol. Assoc. UK 2003, 83, 277–281. [Google Scholar]
- Bermejo, S. Fish age classification based on length, weight, sex and otolith morphological features. Fish. Res. 2007, 84, 270–274. [Google Scholar] [CrossRef]
- Khan, S.; Khan, M. Importance of age and growth studies in fisheries management. In Proceedings of the Next Generation Sciences: Vision 2020 & Beyond MDU, Rohtak, Indian, 8 March 2014. [Google Scholar]
- Vitale, F.; Worsøe Clausen, L.; Ní Chonchúir, G. Handbook of Fish Age Estimation Protocols and Validation Methods; ICES Cooperative Research Report; International Council for the Exploration of the Sea: Copenhagen, Denmark, 2019. [Google Scholar]
- Pauly, D. Length-converted catch curves: A powerful tool for fisheries research in the tropics (part 2). Fishbyte 1983, 2, 17–19. [Google Scholar]
- Limburg, K.E.; Elfman, M. Patterns and magnitude of Zn:Ca in otoliths support the recent phylogenetic typology of Salmoniformes and their sister groups. Can. J. Fish. Aquat. Sci. 2010, 67, 597–604. [Google Scholar] [CrossRef]
- Beverton, R.; Holt, S. A review of methods for estimating mortality rates in exploited fish populations, with special reference to sources of bias in catch sampling. Rapp. Procès-Verbaux Des RèunI Comm. Int. pour L’exploration Sci. la Mer. Méditerranée 1956, 140, 67–83. [Google Scholar]
- Gurbet, R.; Akyol, O.; Yalcin, E. Catch per Unit Effort and Mortality Rates of Two Sparid Species, Pagellus acarne and Pagellus erythrinus from Bottom Trawl Fishery in Izmir Bay, Aegean Sea. J. Anim. Vet. Adv. 2012, 11, 681–686. [Google Scholar] [CrossRef]
- European Commission. Council Regulation (EC) No 1967/2006 of 21 December 2006 concerning management measures for the sustainable exploitation of fishery resources in the Mediterranean Sea, amending Regulation (EEC) No 2847/93 and repealing Regulation (EC) No 1626/94; European Union: Brussels, Belgium, 2006; pp. 9–86. [Google Scholar]
- Theocharis, A.; Vlachou, M.; Conides, A.; Klaoudatos, D. Population biology of European hake (Merluccius merluccius, Linnaeus, 1758) in Greece. Acad. Biol. 2023, 1. [Google Scholar] [CrossRef]
- Copernicus Marine Environment Monitoring Service (CMEMS). Available online: https://data.marine.copernicus.eu/viewer?view=viewer&crs=epsg%3A4326&t=1742731200000&z=0¢er=0%2C0&zoom=9.840779526590435&layers=H4sIAA0P32cAAyWN0QqCMBRA._U_Z06LCN9WWQmS0nqRiMvY5hQ2J2qgRf_e0eOBczj3N9QSIhAEFmD4pLrkh6c029EU6YWmBUvYMbvGe8pumJ8LJCRAEq59YZX (accessed on 25 February 2025).
- Quinn, T.J.; Deriso, R.B. Quantitative Fish Dynamics; Oxford University Press: Oxford, UK, 1999; ISBN 0195360400. [Google Scholar]
- Ricker, W.E. Handbook of computations for biological statistics of fish populations. Bull. Fish. Res. Board. Can. 1958, 119, 1–300. [Google Scholar]
- Bagenal, T.; Tesch, F. Age and growth. In Methods for Assessment of Fish Production in Fresh Waters, 3rd ed.; IBP Handbook No. 3; Bagenal, T., Tesch, F., Eds.; Blackwell Scientific Publications: Oxford, UK, 1978. [Google Scholar]
- Mejri, M.; Trojette, M.; Jmil, I.; Ben Faleh, A.; Chalh, A.; Quignard, J.-P.; Trabelsi, M. Fluctuating asymmetry in the otolith shape, length, width and area of Pagellus erythrinus collected from the Gulf of Tunis. Cah. De Biol. Mar. 2020, 61, 1–7. [Google Scholar] [CrossRef]
- Carbonara, P.; Follesa, M.C. Handbook on fish age determination: A Mediterranean experience. Gen. Fish. Comm. Mediterr. Stud. Rev. 2019, 98, I-179. [Google Scholar]
- Klaoudatos, D.; Vlachou, M.; Theocharis, A. From Data to Insight: Machine Learning Approaches for Fish Age Prediction in European Hake. J. Mar. Sci. Eng. 2024, 12, 1466. [Google Scholar] [CrossRef]
- D’Iglio, C.; Albano, M.; Famulari, S.; Savoca, S.; Panarello, G.; Di Paola, D.; Perdichizzi, A.; Rinelli, P.; Lanteri, G.; Spanò, N.; et al. Intra- and interspecific variability among congeneric Pagellus otoliths. Sci. Rep. 2021, 11, 16315. [Google Scholar] [CrossRef]
- Beamish, R.J.; Fournier, D.A. A method for comparing the precision of a set of age determinations. Can. J. Fish. Aquat. Sci. 1981, 38, 982–983. [Google Scholar]
- Chang, W.Y.B. A statistical method for evaluating the reproducibility of age determination. Can. J. Fish. Aquat. Sci. 1982, 39, 1208–1210. [Google Scholar]
- Von Bertalanffy, L. A quantitative theory of organic growth (inquiries on growth laws. II). Hum. Biol. 1938, 10, 181–213. [Google Scholar]
- Munro, J.L.; Pauly, D. A simple method for comparing the growth of fishes and invertebrates. Fishbyte 1983, 1, 5–6. [Google Scholar]
- Jobling, M. The thermal growth coefficient (TGC) model of fish growth: A cautionary note. Aquac. Res. 2003, 7, 581–584. [Google Scholar]
- Khan, M.A.; Jafri, A.K.; Chadha, N.K.; Usmani, N. Growth and body composition of rohu (Labeo rohita) fed diets containing oilseed meals: Partial or total replacement of fish meal with soybean meal. Aquac. Nutr. 2003, 9, 391–396. [Google Scholar]
- Froese, R.; Binohlan, C. Empirical relationships to estimate asymptotic length, length at first maturity and length at maximum yield per recruit in fishes, with a simple method to evaluate length frequency data. J. Fish. Biol. 2000, 56, 758–773. [Google Scholar] [CrossRef]
- Ricker, W.E. Growth rates and models. Fish. Physiol. 1979, 8, 677–743. [Google Scholar]
- Then, A.Y.; Hoenig, J.M.; Hall, N.G.; Hewitt, D.A.; Jardim, H. Evaluating the predictive performance of empirical estimators of natural mortality rate using information on over 200 fish species. ICES J. Mar. Sci. 2015, 72, 82–92. [Google Scholar] [CrossRef]
- Beverton, R.; Holt, S. On the Dynamics of Exploited Fish Populations; Springer Science & Business Media: Berlin, Germany, 2012; Volume 11, ISBN 9401121060. [Google Scholar]
- Pauly, D. Some Simple Methods for the Assessment of Tropical Fish Stocks; FAO: Rome, Italy, 1983; ISBN 9251013330. [Google Scholar]
- Sparre, P.; Ursin, A.; Venema, S.C. Introduction to Tropical Fish Stock Assessment-Part 1: Manual; FAO: Rome, Italy, 1989; p. 218. [Google Scholar]
- Hilborn, R.; Walters, C.J. Quantitative Fisheries Stock Assessment: Choice, Dynamics and Uncertainty; Springer Science & Business Media: Berlin/Heidelberg, Germany, 2013; ISBN 1461535980. [Google Scholar]
- Myers, R.A.; Hutchings, J.A.; Barrowman, N.J. Why do fish stocks collapse? The example of cod in Atlantic Canada. Ecol. Appl. 1997, 7, 91–106. [Google Scholar]
- Hoggarth, D. Stock Assessment for Fishery Management: A Framework Guide to the Stock Assessment Tools of the Fisheries Management and Science Programme; Food & Agriculture Organazation: Rome, Italy, 2006; ISBN 9251055033. [Google Scholar]
- Pauly, D. Theory and management of tropical multispecies stocks: A review, with emphasis on the Southeast Asian demersal fisheries. ICLARM Stud. Rev. 1979, 1, 35. [Google Scholar]
- Beverton, R.J.H.; Holt, S.J. On the dynamics of exploited fish populations, fishery investigations series II volume XIX, Ministry of Agriculture. Fish. Food 1957, 22. [Google Scholar]
- Karakulak, F.S.; Erk, H.; Bilgin, B. Length–weight relationships for 47 coastal fish species from the northern Aegean Sea, Turkey. J. Appl. Ichthyol. 2006, 22, 274–278. [Google Scholar]
- Kondylatos, G.; Kallias, I.; Vafidis, D.; Exadactylos, A.; Theocharis, A.; Mavrouleas, D.; Kalaentzis, K.; Avgoustinaki, M.; Conides, A.; Klaoudatos, D. The length-weight relationship of indigenous and non-indigenous fish species from the small-scale fisheries of Rhodes Greece. Int. Aquat. Res. 2024, 16, 169–185. [Google Scholar] [CrossRef]
- Chérif, M.; Zarrad, R.; Gharbi, H.; Jarboui, O. Length-weight relationships for 11 fish species from the Gulf of Tunis (SW Mediterranean Sea, Tunisia). Pan-Am. J. Aquat. Sci. 2008, 3, 1–5. [Google Scholar]
- Karachle, P.K.; Stergiou, K.I. Length–length and length–weight relationships of several fish species from the North Aegean Sea (Greece). J. Biol. Res. 2008, 10, 149–157. [Google Scholar]
- İlkyaz, A.T.; Metin, G.; Soykan, O.; Kinacigil, H.T. Length–weight relationship of 62 fish species from the Central Aegean Sea, Turkey. J. Appl. Ichthyol. 2008, 24, 699–702. [Google Scholar] [CrossRef]
- Ragheb, E. Length-weight relationship and well-being factors of 33 fish species caught by gillnets from the Egyptian Mediterranean waters off Alexandria. Egypt. J. Aquat. Res. 2023, 49, 361–367. [Google Scholar]
- Falsone, F.; Geraci, M.L.; Scannella, D.; Gancitano, V.; Di Maio, F.; Sardo, G.; Quattrocchi, F.; Vitale, S. Length-weight relationships of 52 species from the south of Sicily (Central Mediterranean Sea). Fishes 2022, 7, 92. [Google Scholar] [CrossRef]
- Moutopoulos, D.K.; Ramfos, A.; Mouka, A.; Katselis, G. Length–weight relations of 34 fish species caught by small-scale fishery in Korinthiakos gulf (central Greece). Acta Ichthyol. Piscat. 2013, 43, 57–64. [Google Scholar] [CrossRef]
- Kapiris, K.; Klaoudatos, D. Length-weight relationships for 21 fish species caught in the Argolikos Gulf (central Aegean Sea, eastern Mediterranean). Turk. J. Zool. 2011, 35, 717–723. [Google Scholar] [CrossRef]
- Ghailen, H.; Abdallah, H.; Hassan, A.; Mourad, C.; Abderrahmen, B.; Othman, J. Length-weight relationships for 13 fish species from the Gulf of Gabes (Southern Tunisia, Central Mediterranean). Afr. J. Biotechnol. 2010, 9, 6177–6181. [Google Scholar]
- Mehanna, S.F.; Farouk, A.E. Length-Weight Relationship of 60 Fish Species From the Eastern Mediterranean Sea, Egypt (GFCM-GSA 26). Front. Mar. Sci. 2021, 8, 625422. [Google Scholar] [CrossRef]
- Ceyhan, T.; Akyol, O.; Erdem, M. Length-weight relationships of fishes from Gökova Bay, Turkey (Aegean Sea). Turk. J. Zool. 2009, 33, 69–72. [Google Scholar]
- Moutopoulos, D.K.; Stergiou, K.I. Length–weight and length–length relationships of fish species from the Aegean Sea (Greece). J. Appl. Ichthyol. 2002, 18, 200–203. [Google Scholar]
- Vieira, R.P.; Monteiro, P.; Ribeiro, J.; Bentes, L.; Oliveira, F.; Erzini, K.; Gonçalves, J.M.d.S. Length-weight relationships of six syngnathid species from Ria Formosa, SW Iberian coast. Cah. Biol. Mar. 2014, 55, 9–12. [Google Scholar]
- Kelly, B.; Smokorowski, K.E.; Power, M. Growth, condition and survival of three forage fish species exposed to two different experimental hydropeaking regimes in a regulated river. River Res. Appl. 2017, 33, 50–62. [Google Scholar] [CrossRef]
- Schneider, J.; Laarman, P.; Gowing, H. Length-Weight Relationships. In Manual of Fisheries Survey Methods II with Periodic Updates; Fisheries Special Report 25; Michigan Department of Natural Resources: Ann Arbor, MI, USA, 2000; pp. 1–16. [Google Scholar]
- De Giosa, M.; Czerniejewski, P.; Rybczyk, A. Seasonal changes in condition factor and weight-length relationship of invasive Carassius gibelio (Bloch, 1782) from Leszczynskie Lakeland, Poland. Adv. Zool. 2014, 2014, 678763. [Google Scholar]
- Flura, M.Z.; Rahman, B.S.; Rahman, M.A.; Ashraful, M.; Alam, M.; Pramanik, M.H. Length-weight relationship and GSI of hilsa, Tenualosa ilisha (hamilton, 1822) fishes in Meghna river, Bangladesh. Int. J. Nat. Soc. Sci 2015, 2, 82–88. [Google Scholar]
- Lai, H.; Gallucci, V.; Gunderson, D.; Donnelly, R. Age determination in fisheries: Methods and applications to stock assessment. In Stock Assessment; CRC Press: Boca Raton, FL, USA, 2023; pp. 82–178. [Google Scholar]
- Hoşsucu, B.; Çakır, D.T. Some Parameters about Population Biology of the Common Pandora (Pagellus erythrinus L., 1758)(Sparidae) in the Edremit Bay (Turkey). Ege J. Fish. Aquat. Sci. 2003, 20. [Google Scholar]
- Mehanna, S.F.; Fattouh, S. Fisheries management of the common Pandora Pagellus erythrinus in the Egyptian Mediterranean waters. Egypt. J. Aquat. Res. 2009, 35, 345–354. [Google Scholar]
- Charbonneau, J.A.; Keith, D.M.; Hutchings, J.A. Trends in the size and age structure of marine fishes. ICES J. Mar. Sci. 2019, 76, 938–945. [Google Scholar] [CrossRef]
- Van Denderen, P.D.; Jacobsen, N.; Andersen, K.H.; Blanchard, J.L.; Novaglio, C.; Stock, C.A.; Petrik, C.M. Estimating Fishing Exploitation Rates to Simulate Global Catches and Biomass Changes of Pelagic and Demersal Fish. Earth’s Futur. 2024, 12, e2024EF004604. [Google Scholar] [CrossRef]
- Hassager, T.K. Comparison of three different otolith-based methods for age determination of turbot (Scophthalmus maximus). Dana 1991, 9, 39–43. [Google Scholar]
- Hoenig, J.M.; Morgan, M.J.; Brown, C.A. Analysing differences between two age determination methods by tests of symmetry. Can. J. Fish. Aquat. Sci. 1995, 52, 364–368. [Google Scholar] [CrossRef]
- Gürsoy, Ç.; Tarkan, A.S.; Gaygusuz, Ö.; Acıpınar, H. A Comparison of Ageing Techniques to Improve Precision of Age Estimation from Fish Scales. Ege J. Fish. Aquat. Sci. 2005, 22. [Google Scholar]
- Silva, M.I.; Martins, R.; Sequeira, V.; Silva, D.; Farias, I.; Assis, C.A.; Gordo, L.S.; Vieira, A.R. Struggling with fish age, a comparison of otolith preparation techniques to unravel age and growth of boarfish, Capros aper (Linnaeus, 1758). Sci. Rep. 2024, 14, 20282. [Google Scholar] [CrossRef]
- Jørgensen, C.; Holt, R.E. Natural mortality: Its ecology, how it shapes fish life histories, and why it may be increased by fishing. J. Sea Res. 2013, 75, 8–18. [Google Scholar]
- Cheilari, A.; Rätz, H.-J. The effect of natural mortality on the estimation of stock state parameters and derived references for sustainable fisheries management. In Proceedings of the ICES Annual Science Conference, Copenhagen, Denmark, 21–25 September 2009. ICES CM 2009/N:03. [Google Scholar]
- Erzini, K.; Bentes, L.; Coelho, R.; Correia, C.; Lino, P.G.; Monteiro, P.; Ribeiro, J.; Gonçalves, J.M.S. Fisheries biology and assessment of demersal species (Sparidae) from the South of Portugal. UE-DG 2001, 14, 082. [Google Scholar]
- Abella, A.; Colloca, F.; Sartor, P.; Mannini, A. WG on Stock Assessment of Demersal Species; Stock Assessment Forms; General Fisheries Commission for the Mediterranean (GFCM): Rome, Italy, 2010. [Google Scholar]
- Fiorentino, F.; Knittweis, L.; Gancitano, V.; Mifsud, R.; Gravino, F.; Gristina, M. Report of the 14th of the Working Group on Stock Assessment of Demersal Species; Food & Agriculture Organazation: Rome, Italy, 2012. [Google Scholar]
- Mohdeb, R.; Kahlessenane, S.; Chakour, S.C.; Ladaimia, S.; Harboula, M. Growth, Dynamics and Stock Assessment of the Common Pandera Pagellus erythrinus (Linnaeus, 1785) from the Southwestern Mediterranean. Egypt. J. Aquat. Biol. Fish. 2025, 29, 1989–2005. [Google Scholar]
- Girardin, M.; Quignard, J.P. Croissance de Pagellus erythrinus (Pisces: Téléostéens Sparidae) dans le Golf edu Lion. Cybium 1985, 9, 359–374. [Google Scholar]
- El-Haweet, A.; El-Ganiny, A.; Mahmoud, H. SAC SCSA. In WG on Stock Assessment of Demersal Species; Stock Assessment Forms; Food & Agriculture Organazation: Rome, Italy, 2011. [Google Scholar]
- Larrañeta, M. Crecimiento de Pagellus Erythrinus (L.) de las costas de Castellón. Inv. Pesq. 1965, 3, 185–258. [Google Scholar]
- Morales-Nin, B.; Moranta, J. Life history and fishery of the common dentex (Dentex dentex) in Mallorca (Balearic Islands, western Mediterranean). Fis. Res. 1997, 30, 67–76. [Google Scholar]
- Çiçek, E.; Avşar, D. Karataş Kıyıları (İskenderun Körfezi) İçin Pagellus erythrinus (Linnaeus, 1758) Populasyonuna Ait, Yaş, Büyüme ve Ölüm Parametreleri. Nevşehir Üniversitesi Fen Bilim. Enstitü Derg. 2012, 1, 58–67. [Google Scholar]
- Nolan, C.P. In Proceedings of the International Conference on Integrated Fisheries Monitoring, Sydney, Australia, 1–5 February 1999; p. 378.


| Age | Mean | SE | StDev | Min | Max |
|---|---|---|---|---|---|
| 1 | 13.181 | 0.140 | 1.531 | 10.9 | 16.7 |
| 2 | 17.187 | 0.126 | 1.336 | 14.8 | 20.0 |
| 3 | 20.457 | 0.133 | 1.167 | 18.3 | 22.7 |
| 4 | 23.368 | 0.115 | 0.985 | 21.5 | 25.3 |
| 5 | 25.245 | 0.102 | 0.937 | 23.2 | 27.4 |
| 6 | 27.246 | 0.126 | 0.808 | 25.7 | 28.8 |
| 7 | 29.380 | 0.137 | 0.879 | 27.2 | 30.7 |
| 8 | 31.393 | 0.185 | 1.014 | 29.1 | 32.8 |
| 9 | 32.942 | 0.241 | 0.836 | 31.4 | 34.0 |
| Year | N | Min Length (cm) | Max Length (cm) | Min Weight (g) | Max Weight (g) | Age Range |
|---|---|---|---|---|---|---|
| 2021 | 145 | 11.3 | 34.0 | 25.01 | 420.56 | 1–9 |
| 2022 | 148 | 11.0 | 31.9 | 23.37 | 342.63 | 1–8 |
| 2023 | 144 | 10.9 | 33.8 | 19.32 | 383.21 | 1–9 |
| 2024 | 152 | 11.0 | 33.6 | 23.17 | 379.21 | 1–9 |
Disclaimer/Publisher’s Note: The statements, opinions and data contained in all publications are solely those of the individual author(s) and contributor(s) and not of MDPI and/or the editor(s). MDPI and/or the editor(s) disclaim responsibility for any injury to people or property resulting from any ideas, methods, instructions or products referred to in the content. |
© 2025 by the authors. Licensee MDPI, Basel, Switzerland. This article is an open access article distributed under the terms and conditions of the Creative Commons Attribution (CC BY) license (https://creativecommons.org/licenses/by/4.0/).
Share and Cite
Theocharis, A.; Vardali, S.; Klaoudatos, D. Age, Growth, and Mortality of the Common Pandora (Pagellus erythrinus, L. 1758) in the Central Aegean Sea: Insights into Population Dynamics. Fishes 2025, 10, 160. https://doi.org/10.3390/fishes10040160
Theocharis A, Vardali S, Klaoudatos D. Age, Growth, and Mortality of the Common Pandora (Pagellus erythrinus, L. 1758) in the Central Aegean Sea: Insights into Population Dynamics. Fishes. 2025; 10(4):160. https://doi.org/10.3390/fishes10040160
Chicago/Turabian StyleTheocharis, Alexandros, Sofia Vardali, and Dimitris Klaoudatos. 2025. "Age, Growth, and Mortality of the Common Pandora (Pagellus erythrinus, L. 1758) in the Central Aegean Sea: Insights into Population Dynamics" Fishes 10, no. 4: 160. https://doi.org/10.3390/fishes10040160
APA StyleTheocharis, A., Vardali, S., & Klaoudatos, D. (2025). Age, Growth, and Mortality of the Common Pandora (Pagellus erythrinus, L. 1758) in the Central Aegean Sea: Insights into Population Dynamics. Fishes, 10(4), 160. https://doi.org/10.3390/fishes10040160