Article

Impact of Faba Bean (Vicia faba L.) Diet and Subsequent Withdrawal on GIFT Tilapia (Oreochromis niloticus) Muscle Quality

1
Fisheries Research Institute, Beijing Academy of Agriculture and Forestry Sciences, Beijing 100068, China
2
College of Fisheries, Southwest University, Chongqing 402460, China
*
Authors to whom correspondence should be addressed.
Fishes 2025, 10(4), 170; https://doi.org/10.3390/fishes10040170
Submission received: 3 March 2025 / Revised: 4 April 2025 / Accepted: 7 April 2025 / Published: 11 April 2025
(This article belongs to the Special Issue Growth, Metabolism, and Flesh Quality in Aquaculture Nutrition)

Abstract

:
To systematically evaluate FB’s effects on tilapia muscle quality, two distinct experimental phases are designed, the crispy texture development phase (0–16 weeks) and the crispy texture retention phase (17–24 weeks), which can determine the minimum faba bean (FB) feeding duration required to achieve optimal textural modification and can assess the persistence of improved textural properties following FB withdrawal, respectively. The results demonstrated that a 60% FB inclusion diet administered for 16 weeks did not adversely affect tilapia growth performance. Significant improvements in textural parameters, including hardness, springiness, chewiness, and shear force, were observed in FB-fed tilapia as early as 8 weeks, with these enhancements being maintained throughout the 16-week feeding period. These superior textural characteristics persisted during the subsequent retention phase following FB withdrawal. Microstructural analysis revealed that the 60% FB diet significantly enhanced muscle-fiber density while reducing fiber diameter in tilapia during the 8–16 week feeding period. These microstructural modifications persisted throughout the texture retention phase, maintaining significant differences compared to the control group. Serological analysis demonstrated the FB group elevated Superoxide dismutase (SOD) activity and reduced malondialdehyde (MDA) levels at 4 weeks, though these differences normalized thereafter. qRT-PCR showed the 60% FB clearly increased the expression of mstn at 8 weeks, while col1a-2 and myog expressions also obviously improved at 12 weeks. In summary, dietary 60% FB improved tilapia muscle crispiness by altering texture and microstructure via gene-expression regulation. The minimum duration was 8 weeks to achieve crispiness in tilapia by the 60% FB diet without adverse effects on growth, immunity, and hepatopancreas function. Furthermore, the crispy texture of tilapia fillets was maintained for at least 2 months following withdrawal of the 60% FB diet after 16 weeks of continuous feeding.
Key Contribution: The minimum duration was 8 weeks to achieve crispiness in tilapia by the 60% FB diet without adverse effects on growth, immunity, and hepatopancreas function. Furthermore; the crispy texture of tilapia fillets was maintained for at least 2 months following withdrawal of the 60% FB diet after 16 weeks of continuous feeding.

1. Introduction

Genetically Improved Farmed Tilapia (GIFT, Oreochromis niloticus) has emerged as a prominent aquaculture species in China due to its rapid growth rate, high meat yield, strong disease resistance, and stable genetic characteristics [1,2]. By 2023, China’s tilapia aquaculture production had reached 1,816,800 tons, establishing it as one of the country’s most productive freshwater commercial fish species [3]. Recognized as “white meat salmon”, tilapia is prized for its thick, tender flesh, high protein content, and abundant unsaturated fatty acids [4,5]. However, in recent years, intensive farming practices and environmental stressors have led to a noticeable decline in tilapia meat quality, manifested by softening texture, structural fragility, and diminished taste [6]. Consequently, enhancing meat quality to improve market competitiveness has become a critical focus for the tilapia industry.
Numerous factors influence fillet quality, including nutritional composition, texture characteristics, and processing methods [7]. Among these, texture serves as a crucial quality parameter for fish products as it directly determines consumer sensory experience and product acceptability [8]. The faba bean (FB, Vicia faba), ranking as the world’s third most important grain legume, not only constitutes a valuable nutritional component in human diets but also serves as an alternative protein and energy source in livestock feed. Its utilization helps reduce feed costs while ensuring stable supply [9,10,11,12]. Research has demonstrated that FB supplementation can enhance muscle texture in terrestrial livestock by modifying muscle-fiber structure [13,14]. This texture-modifying effect has been successfully applied in aquaculture, with crispy grass carp (Ctenopharyngodon idellus) representing a particularly successful case. Through FB feeding regimens, producers have significantly improved the fillet texture of grass carp, thereby increasing its market value [15,16,17,18,19,20]. The resulting premium product has become a signature aquatic commodity in Guangdong Province and has gained international recognition, with exports to numerous global markets [21,22].
Building on the success of crispy grass carp, the application of FB supplementation to enhance tilapia fillet quality has gained increasing attention, offering significant potential to elevate the commercial value of farmed tilapia [23,24]. Previous research has demonstrated that dietary inclusion of FB or its aqueous extracts can effectively improve textural properties in tilapia [25,26,27,28]. Notably, Li et al. [25] reported that feeding tilapia with 40–70% FB-supplemented diets for 90 days significantly modified muscle texture, histological characteristics, and amino acid profiles. However, some critical problems in the production process have not been effectively solved, including the minimum duration of FB feeding required to achieve crispiness in tilapia and the post-feeding retention period of crispy meat quality after FB withdrawal. These parameters directly impact farmers’ production cycles and economic returns, as the maintenance of textural properties dictates the optimal selling window for crispy tilapia.
To systematically evaluate FB’s effects on tilapia muscle quality, we established two distinct experimental phases, the crispy texture development phase (0–16 weeks) and the crispy texture retention phase (17–24 weeks), which can determine the minimum FB feeding duration required to achieve optimal textural modification and can assess the persistence of improved textural properties following FB withdrawal, respectively. In addition to comprehensive textural analysis (including hardness, chewiness, and other parameters), we evaluated multiple physiological indices, such as growth performance, serum parameters, microstructure, and gene expression. These integrated analyses will provide insights into establishing science-based feeding protocols and the optimal selling window for crispy tilapia, which will enable farmers to optimize production and marketing strategies for greater profitability.

2. Materials and Methods

2.1. Experimental Diets

Previous studies demonstrated that 60% FB supplementation improves muscle fibers in tilapia without compromising growth [25]. So only 60% FB supplementation was set as the treatment group in this study. Two diets, the control and 60% FB diets, were prepared using fishmeal and wheat gluten as protein sources and lecithin oil as the main lipid source. The 60% FB diet was formulated by complete replacement of wheat middlings and partial replacement of wheat flour and wheat gluten from the control diet (0% FB), ensuring isonitrogenous (360 g/kg crude protein), isolipidic (43 g/kg crude lipid), and isoenergetic (18.0 MJ/kg) conditions while introducing the FB variable. Detailed diet formulations and compositions are provided in Table 1. All ingredients were thoroughly mixed, expanded at 110 °C, and processed into 2.0 mm and 3.0 mm pellets using an extruder (MY56X2A, Mu Yang Group, Yangzhou, China) to suit the fish’s feeding requirements. Diets were air-dried and stored at 4 °C until use.

2.2. Experimental Fish and Husbandry

Healthy tilapia (GIFT, Oreochromis niloticus) were obtained from a commercial fishery in Changping, Beijing, China. Prior to the feeding trial, the fish were acclimated to the experimental conditions by being fed the control diet for two weeks. A total of 180 fish (initial weight 258.09 ± 0.51 g) were randomly assigned to either the control group (0% FB) or the treatment group (60% FB). Each group consisted of three replicate tanks, with 30 fish per tank. The PVC tanks (1.0 m in diameter, 1.0 m in height) were equipped with a circulating system, maintaining water conditions at 5–6 mg/L dissolved oxygen, pH 7.5–8.0, ammonia nitrogen 0.05 ± 0.01 mg/L, nitrite 0.004 ± 0.001 mg/L, and an average temperature of 25.0 ± 3.0 °C.
The feeding trial lasted 24 weeks in Fisheries Research Institute, Beijing Academy of Agriculture and Forestry Sciences, Beijing, China, during which the fish were hand-fed to apparent satiation three times daily at 7:30, 12:30, and 17:30. The amount of feeding is recorded daily based on the 3–5% of fish weight. During the first 16 weeks, tilapias in two groups were fed with a control diet and a 60% FB diet, respectively, while all fish in both groups were fed with the control diet from 17 to 24 weeks.

2.3. Sampling Procedures

During the 24-week feeding trial, samples were collected every 4 weeks, totaling 6 sampling points. At each sampling, six fish were randomly selected from each group, with two fish taken from each replicate. Prior to sampling, the fish were fasted for 24 h and anesthetized using a chloretone solution (0.30 mL/L water). Each fish was individually weighed, and its body length was measured. Serum samples were collected for biochemical analysis, followed by the collection and weighing of the viscera and liver. Muscle samples were taken from the area around the dorsal fin. A portion of the muscle (approximately 3 mm × 3 mm × 3 mm) was preserved in 4% paraformaldehyde for histological analysis, while another portion (1.0 cm × 2.0 cm × 0.5 cm) was used for texture testing. The remaining muscle samples were stored at −80 °C for subsequent mRNA expression analysis.
At the end of the 16-week sampling period, all remaining fish in both groups were weighed and counted. Growth indicators were calculated according to the corresponding formulas described in previous studies [30,31].

2.4. Chemical Analysis

The crude protein, crude lipid, moisture, and ash contents were detected using the Kjeldahl method (Foss, Nordborg, Denmark) and Soxhlet extraction method (Foss, Nordborg, Denmark), at 105 °C until a constant weight was reached and at 550 °C for 16 h in a muffle furnace (CWF1100, Derby, UK), respectively [32]. Amino acids were determined by a high-speed automatic amino acid analyzer (Model 835–50, Hitachi, Tokyo, Japan).

2.5. Muscle Texture Analysis

Texture indices, such as hardness, chewiness, shear force, etc., were detected by a texture analyzer (TMS-PRO, FTC, Wilmington, DE, USA). The detection method is based on the report of Li et al. [7], and some modifications have been made. Texture profile analysis was performed using a cylindrical probe (radius = 37.5 mm) with the following settings: initial force 0.3 N, pre-test speed 1.00 mm/s, test speed 2.00 mm/s, post-test speed 2.00 mm/s, deformation 50% strain, trigger force 5 g, force-sensor range 250 N, surface detection height 30 mm, return distance 15 mm, two consecutive compressions with 3 s interval. A cutter probe with 0.50 mm thickness was used to detect the shear force. The measurement parameters are shown as: initial force 0.3 N, test speed: 1.00 mm/s, and cutting distance: 50% of sample thickness.

2.6. Histological Analysis

Following the method outlined by Yu et al. [21], muscle samples were subjected to H&E staining to analyze histological changes. The stained samples were photographed using an inverted microscope (Nikon CI-S, Tokyo, Japan) and an imaging system (Nikon FI2, Tokyo, Japan).
The diameter and density of muscle fibers in the muscle sections were measured using Image-Pro plus 7.0, as described by Ma et al. [22].

2.7. Non-Specific Immunity and Antioxidant Activity Analysis

Complement 3 (C3) was measured by the commercial kit (Nanjing Jiancheng Bioengineering Institute, Nanjing, China), which included measuring the increase in turbidity and antibody after immune response [33].
Lysozyme (LZM) activity was detected by lysozyme detection kit (Nanjing Jiancheng Bioengineering Institute, Nanjing, China) according to the turbidimetric assay [34]. Briefly, test serum (0.1 mL) was added to 1.9 mL of a suspension of Micrococcus lysodeikticus (0.2 mg/mL) in a 0.05 M sodium phosphate buffer (pH 6.2). The reaction was carried out at 25 °C and the decrease in OD was recorded at 530 nm using a spectrophotometer after 0.5 and 4.5 min. A unit of lysozyme activity was defined as the amount of sample causing a reduction in absorbance of 0.001 min−1.
Superoxide dismutase (SOD), catalase (CAT), myeloperoxidase (MPO), and malondialdehyde (MDA) activities were measured by the commercial kits (Nanjing Jiancheng Bioengineering Institute, Nanjing, China) on the basis of the manufacturer instructions, respectively. The SOD activity was analyzed by an enzymatic assay method [35]. The MDA content was measured by the barbituric-acid reaction chronometry at 532 nm [30]. Similarly, the determination of CAT and MPO activities were based on the methods described by Xu et al. [34] and Kong et al. [36].

2.8. Biochemical Analysis

Alanine aminotransferase (ALT), aspartate aminotransferase (AST), triglyceride (TG), total cholesterol (TC), and high-density lipoprotein cholesterol (HDLC) were detected by an automatic biochemical analyzer HITACHI 7160 (Hitachi, Ltd.) according to a previous study [31].

2.9. RNA Extraction, cDNA Synthesis, and Quantitative Real-Time PCR (qRT-PCR)

Total RNA was extracted and purified using a commercial kit (No. DP424; Tiangen Biotech Co., Ltd., Beijing, China) and verified by 1.5% agarose gel electrophoresis, following methods described in previous studies [30,37]. cDNA was synthesized from 1 μg of total RNA using reverse transcriptase and a commercial kit (No. RR047B; TaKaRa, Osaka, Japan), according to the manufacturer’s instructions.
The expression of genes involved in skeletal muscle growth and type I collagen synthesis, including collagen type I alpha 1 (col1a-1), collagen type I alpha 2 (col1a-2), insulin-like growth factor 1 (igf-1), myostain (mstn), myogenin (myog), and glyceraldehyde-3-phosphate dehydrogenase (gapdh), was determined by qRT-PCR. The gapdh gene was used as the housekeeping gene. The qRT-PCR was performed in a 20 μL reaction system with specific primers (Table 2). The thermal cycle was set as 95 °C for 30 s, followed by 40 cycles of 95 °C for 5 s, 60 °C for 40 s. Relative gene-expression levels were calculated using established methods from prior studies [38].

2.10. Statistical Analysis

All data are presented as mean ± standard error of mean and was run by SPSS for Windows (SPSS Inc., 23.0, Chicago, IL, USA) to test for normality (Shapiro–Wilk test) and homogeneity (Levene’s test) of variance. Differences between the two groups (0% FB vs. 60% FB) were analyzed by an independent t test. p < 0.05 was regarded as indicating significant differences.

3. Results

3.1. Growth Performances

The effects of dietary FB on the growth performance and body indices of tilapia were presented in Table 3. There were no significant differences in the growth and body indices of tilapia between the control (0% FB) and 60% FB groups after the 16-week feeding period (p > 0.05).

3.2. Texture Analysis

The textural parameters in the muscle of tilapia were analyzed for two groups from 4 to 24 weeks. There were no significant differences in all textural parameters in fish between the 0% and 60% groups at 4 weeks (p > 0.05) (Table 4). From 8 to 24 weeks, hardness, springiness, chewiness, and shear force in the muscle of tilapia from the 60% FB group began to improve significantly. Compared with the control diet, hardness, springiness, chewiness, and shear force of muscle in tilapia from 60% FB group were increased by 19.2–20.1%, 13.5–26%, 32–48% and 58.4–69.9% at 8, 12, and 16 weeks, respectively (p < 0.05). From 17 to 24 weeks, all fish in both groups were fed with the control diet at the period of muscle recovery. Interestingly, hardness, springiness, chewiness, and shear force of muscle in the 60% FB group fish were also significantly higher than those in the control group, even the fish were not fed FB diets during the texture retention period (p < 0.05). At 24 weeks, the 60% FB group tilapia showed nearly 7% and 10% lower increases in muscle hardness and shear force, respectively, compared to the increases observed at 8 weeks. No significant differences were found in the adhesiveness, cohesiveness, and gumminess of muscles in all groups of fish at 6 sampling time points (p > 0.05).

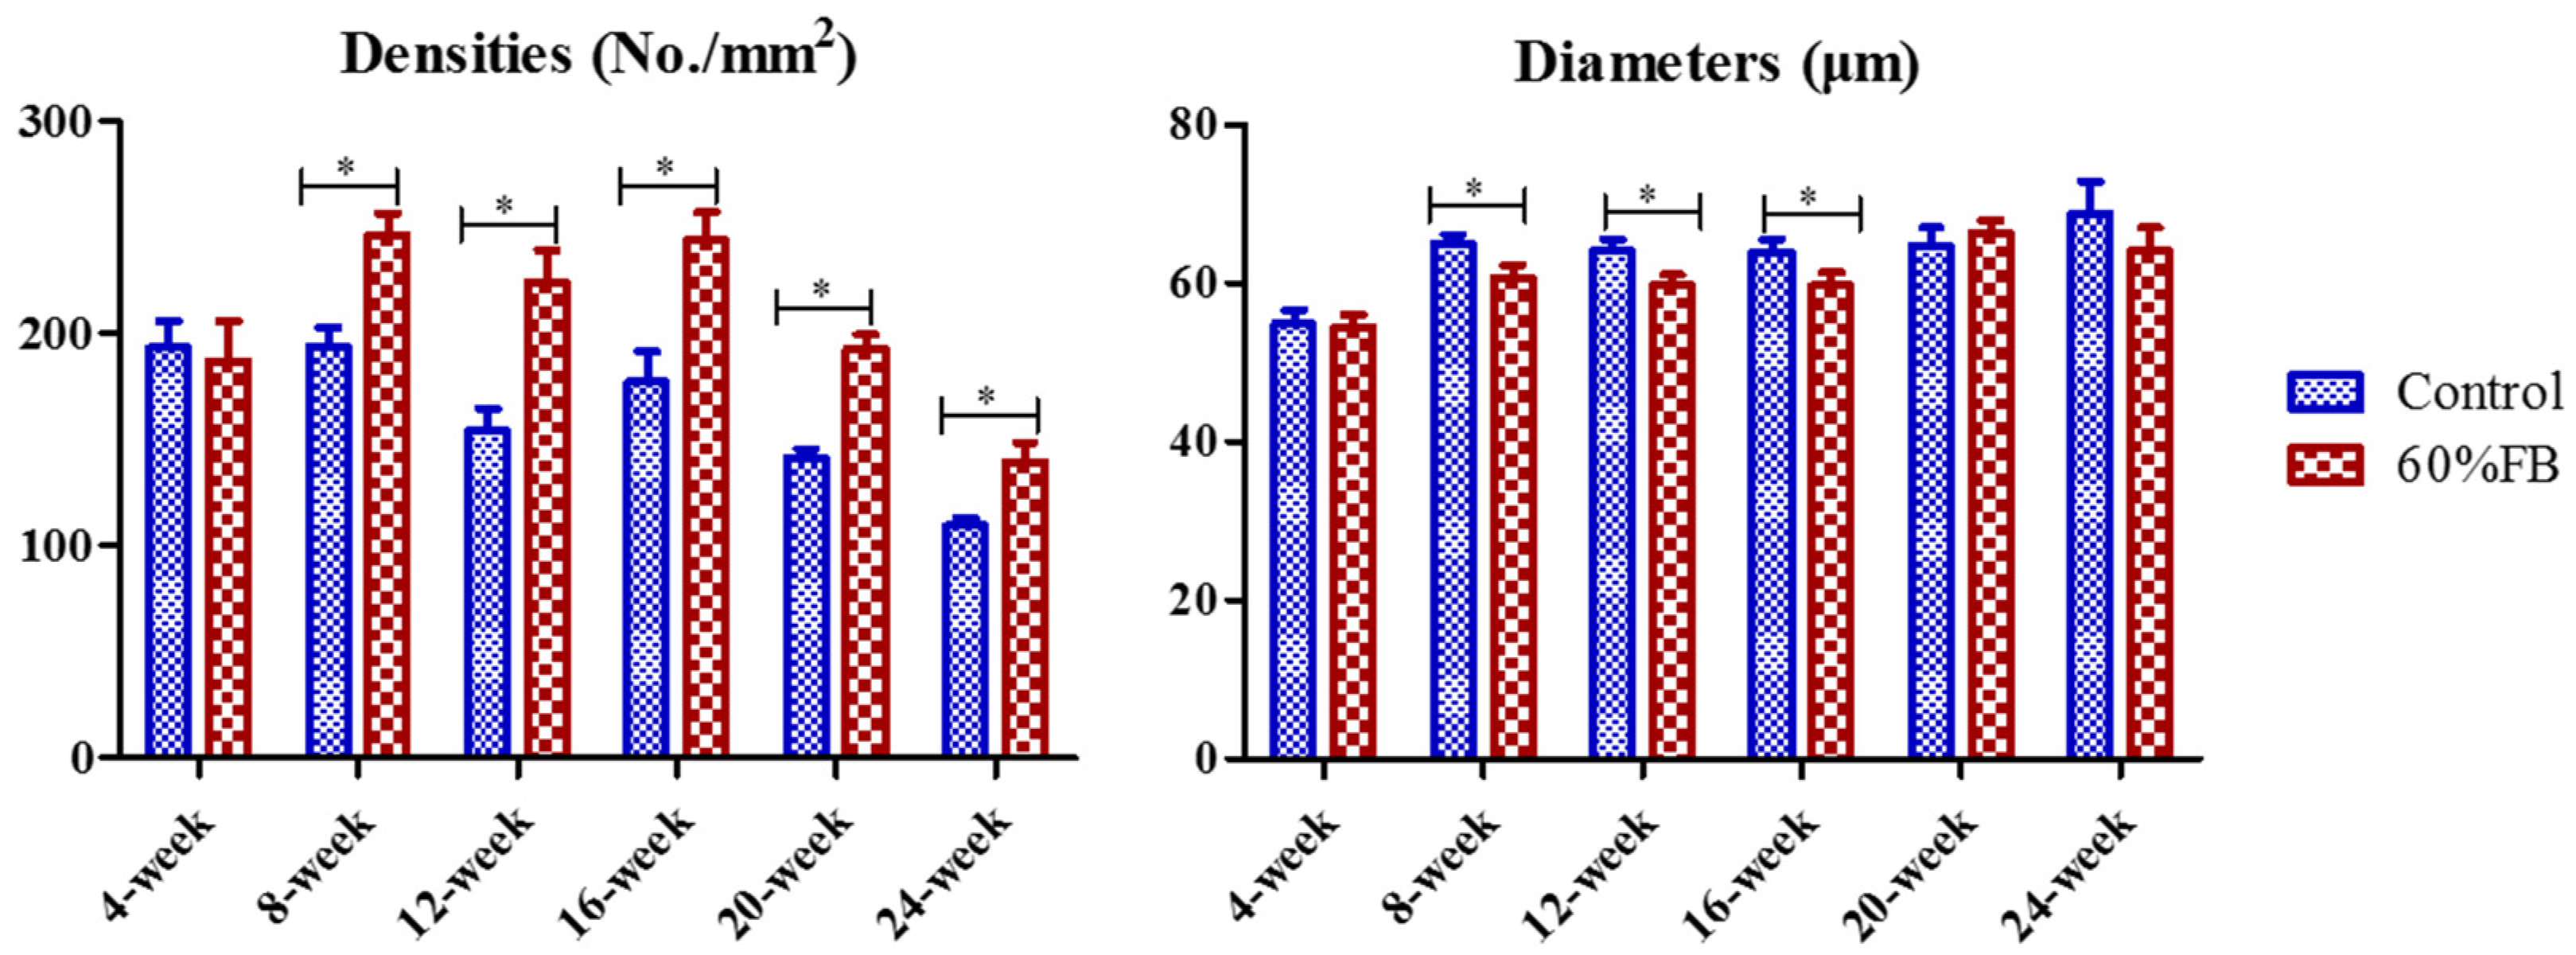
3.3. Histology Analysis

The transverse microstructure of the muscle of tilapia is shown in Figure 1. Compared with the control, the matrix between muscle fibers of tilapia (mmf) was obviously decreased in the 60% FB group, especially between 8 and 24 weeks. A statistical analysis showed that the muscle-fiber densities and diameters of tilapia have no significant differences between the control and 60% FB groups at 4 weeks (p > 0.05; Figure 2). The muscle-fiber densities of fish were clearly increased when they fed with 60% FB diet at 8 to 16 weeks, whereas the muscle-fiber diameters of fish were significantly decreased (p < 0.05, Figure 2). Compared with the control diet, muscle-fiber densities in tilapia from the 60% FB group were increased by 26.9%, 45.38% and 37.80% at 8, 12, and 16 weeks, respectively. Conversely, the muscle-fiber diameters of 60% FB group were decreased by 6.46%, 6.74%, and 6.64% than that of the control group. At 20 and 24 weeks, muscle-fiber densities of fish in the 60% FB group were higher than that of the control group (p < 0.05, Figure 2), but muscle-fiber diameters were no statistical differences between the 60% FB and control groups (p > 0.05, Figure 2). In the 60% FB group, the increase in tilapia muscle-fiber density reached 27% by 24 weeks—a rate comparable to that at 8 weeks.

3.4. Non-Specific Immunity and Antioxidant Activity

The effect of dietary 60% FB on non-specific immunity and antioxidant activity in serum of tilapia is displayed in Table 5. Compared with control group, the SOD activity of fish in the 60% FB group was clearly increased, while MDA level was significantly decreased at 4 weeks (p < 0.05). The significant difference between these two parameters disappeared at 8 to 24 weeks (p > 0.05). No obvious differences were found in other parameters of non-specific immunity and antioxidant activity between the control and 60% FB groups at 8 to 24 weeks (p > 0.05).

3.5. Serum Biochemical Parameters

From 4 to 16 weeks, no significant differences were observed in serum AST, ALT, TG, TC, or HDL-C levels between the control and 60% FB groups of tilapia, despite the fish being fed different diets during the texture development period (p > 0.05, Table 6). Likewise, there were also no statistical differences in these biochemical parameters in the serum of tilapias between the two groups during the texture retention period (p > 0.05, Table 6).

3.6. Gene Expression

The expression of mstn was significantly reduced by 62% in the 60% FB group at 8 weeks compared to the control group (p < 0.05, Figure 3). However, this significant difference between the two groups disappeared from 12 to 24 weeks (p > 0.05). At 12 weeks, the expression of col1a-2 and myog in the 60% FB group increased by 102% and 55.55%, respectively, compared to the control group (p < 0.05). During the texture development period (4 and 16 weeks), no significant differences were observed in col1a-1, col1a-2, mstn, or myog expression between the control and 60% FB groups (p > 0.05). Similarly, no differential expression of these genes was detected in tilapia muscles between the two groups during the texture retention period (20 and 24 weeks).

4. Discussion

The presence of anti-nutritional factors in FB, including total phenolics, tannins, saponins, and phytic acid, may adversely affect fish by reducing appetite, impairing nutrient absorption, and inducing intestinal inflammation [24,39,40,41,42]. Many studies have shown that feeding the high level of FB directly can inhibit the growth of fish, and even cause their death [43,44,45,46,47,48]. In this study, the 60% FB diet has no adverse effect on tilapia growth performance. The contradictory results in this work might be likely due to improvements in feed expansion processing. Enhanced processing technology reduced both the content and anti-nutritional effects of FB compounds [49]. A similar result was observed in the expanded pellet diet containing FB water extract, which had no negative effect on the growth of grass carp [26]. A previous study showed that the inactivation rate of the trypsin inhibitor in FB could reach 90% after 5 min of high-pressure curing [50]. Jose et al. [51] found that feeding the FB diet with 90% high-pressure curing treatment could improve the growth performance and reduce the feed consumption of chicks. Certainly, feed nutrition is a key factor affecting the growth and health of fish [52]. However, as a single diet source, FB cannot meet the growth needs of fish due to its unbalanced nutrition. So, the balanced nutrition in the feed formula was taken into account when the feed was prepared [49]. Consistent with the findings of Li et al. [53], high-dose dietary FB water extract had no impact on the growth-related parameters of grass carp when supplemented alongside vitamin K3. Based on these findings, we propose that the balanced nutrition (particularly amino acid composition) and the optimized feed expansion processing could counteract FB-induced growth inhibition in tilapia.
Texture is an important quality indicator to evaluate the flesh quality of fish products [22,54]. Hardness, chewiness, cohesiveness, springiness, adhesiveness, gumminess, and shear force are detected by a texture analyzer to simulate the sensory experience of the human mouth on fish meat [55]. As a result, hardness and chewiness are the most important criteria for judging fillet brittleness [49], and poor hardness will lead to the decline of meat value in secondary processing [56]. Li et al. [7] reported significantly increased hardness, chewiness, and shear force in tilapia muscle after 90 days of feeding with 60% or 70% FB diets. Similarly, texture parameters were markedly enhanced in Yellow River carp (Cyprinus carpio haematopterus) fed immersed faba bean pieces for 90 days [48]. Crisp grass carp (Ctenopharyngodon idellus C. et V), as a representative carp variety, improved textural characteristics after being fed solely FB for 90–120 days [15]. This study determined that an 8-week feeding period with the 60% FB diet was sufficient to significantly improve tilapia muscle texture, as evidenced by increased hardness, springiness, chewiness, and shear force. These results indicate that FB induced textural modifications approximately 30 days faster than previously reported [7,15,48,57]. The observed time difference may be attributed to variations in experimental parameters including initial fish size, feeding duration, and sampling intervals, as smaller fish typically exhibit faster muscle growth rates than larger specimens [58]. Importantly, this accelerated texture enhancement could optimize aquaculture production efficiency and improve economic outcomes for producers. Notably, the crispy texture of tilapia fillets persisted for a minimum of two months post cessation of the 60% FB diet following 16 weeks of continuous feeding. This finding provides valuable insights for commercial operations, demonstrating that crispy tilapia can be temporarily maintained on conventional feed without quality deterioration, thereby extending the optimal marketing window when immediate sales are not feasible.
In general, the muscles of fish grow through hyperplasia (increased number of muscle fibers) and hypertrophy (enhanced diameter of muscle fibers), which affects the taste and quality of the fish [59,60]. It means that the changes in muscle structure, such as the density and diameter of muscle fiber, closely affect fillet texture. The results of this work suppose that a diet of FB for as short as 8 weeks improved the meat quality of tilapia by promoting muscle hyperplasia, as evidenced by increased muscle-fiber densities and decreased the muscle-fiber diameters [59,60]. Muscle-fiber hyperplasia cannot be reversed for at least 8 weeks, because the differences in muscle-fiber densities in both groups have always existed at the texture retention period. The current H&E results were consistent with the texture results above, which reconfirmed that fish with firmer fillet had a rather smaller fiber size [61,62]. Yu et al. [21] also verified that FB feed turned the meat of grass carp crispy, which was due to an increase in muscle-fiber numbers and a decrease in muscle-fiber diameters. We speculate that the above results may be caused by the fact that FB diet can affect the muscle texture of fish by improving the expression of related genes and the interaction of related proteins [21,49,63]. Interestingly, this was also confirmed by the qRT-PCR results in this study.
The ideal feed of crispy muscle is to promote the quality of the meat for tilapia while maintaining the health of the fish, which is the objective of this study. Serum indices are the most direct and important parameters to reflect fish health, which include antioxidant ability, nonspecific immunity, hepatic function, and so on. Studies have shown that pyrimidine riboside and levodopa in FB will combine with glucose-6-phosphate dehydrogenase (G6PD) to reduce the synthesis of glutathione (GSH) after the ingestion of FB by fish, which will further cause ROS unable to be cleared in time, resulting in oxidative stress in the body [49,64]. In order to maintain balance in the body, fish can produce an antioxidant defense mechanism, such as the enzymatic and non-enzymatic systems, to neutralize the harmful effects of ROS [65]. The above description was consistent with our results that the rapid 4-week response, marked by increased SOD activity and decreased MDA levels, demonstrates tilapia’s capacity to upregulate antioxidant defenses when challenged with FB-induced oxidative stress. The FB diet has also been found to increase oxidative capacity in Nibea coibor [28] and Cyprinus carpio [66]. With the increase in feeding time, there was no significant difference in the antioxidant capacity of fish between the FB and control groups, which meant that tilapia have adapted to the 60% FB diet. This was again confirmed by the results of liver function and blood lipids, because no significant difference was found in serum AST, ALT, TG, TC, HDLC of fish in both groups at 4 to 24 weeks. While some studies have reported that prolonged FB consumption can adversely affect the liver and intestinal health of fish [24], these manifestations appear contingent upon interspecies variations, husbandry duration, and feed-processing methods. Future research priorities should encompass both product quality and fundamental health assessments in tilapia.
Muscle fiber is the basic structural unit of muscle tissue, and its amount and size determine the quality of muscle. Certainly, the growth and development of muscle fibers is a complex and precise process that regulated by various myogenic regulatory factor genes [67]. As a negative regulator of skeletal muscle growth, MSTN is to interfere with the proliferation, protein synthesis, and protein decomposition of muscle fibers [68]. On the contrary, MyoG is a myogenic regulatory factor, inhibited by MSTN to mainly control muscle differentiation and promote the proliferation of muscle fibers [69,70]. In addition, many studies have shown that type I collagen is the main collagen in fish, and its content is positively correlated with muscle hardness [21,71,72]. The col1a-1 and col1a-2 are two coding genes that control the synthesis of type I collagen [73]. So, detecting for the expressions of col1a-1 and col1a-2 is also a common method of reflecting changes in muscle quality. The results of this study illustrated that FB diet could promote the differentiation and proliferation of muscle fibers by first reducing the expression of the muscle-growth negative regulator and subsequently enhancing the expression of the muscle-growth positive regulator, as evidenced by decreased the mstn expression at 8 weeks and the increased expressions of myog and col1a-2 at 12 weeks. This was consistent with the muscle texture and microstructure results at 8 weeks. At the same time, this also indicated that MyoG was indeed regulated by the inhibition of MSNT. Xu et al. [74] also found that an FB diet could increase the muscle hardness of grass carp by regulating the expression of myog, because it may play the more important role than type I collagen and type II collagen in the muscle-hardening of crispy grass carp. The expression of col1a-1 and col1a-2 in the muscle was increased by grass carp fed with the FB feed [75]. To date, the precise mechanisms of FB-induced crispy muscle in tilapia remain poorly understood. Several studies of grass carp implicate the possibility of a mechanism including ROS-mediated autophagy [76], collagen deposition, and myofibril reconstruction (via TGF-β signaling, LPS- and ROS-related pathways) [16,77,78]. Future work should integrate multi-omics to resolve the question of regulatory mechanism.

5. Conclusions

In summary, the minimum duration was 8 weeks to achieve crispiness in tilapia through the 60% FB diet without affecting growth, immunity, and hepatopancreas function. This result indicates that FB induced textural modifications approximately 30 days faster than previously reported. In addition, the crispy fillet quality of tilapia could be maintained for at least 2 months, even if the 60% FB diet was withdrawn after 16 weeks of continuous feeding. These results will provide insights into production cycles and the optimal selling window for crispy tilapia, enabling farmers to optimize production and marketing strategies for greater profitability. Certainly, further studies are needed to explore the regulatory mechanism of FB-induced crispy tilapia and determine whether the FB-induced crispy muscle phenotype is reversible.

Author Contributions

Conceptualization, L.L. and H.Y.; methodology, L.L., H.Y. and G.X.; software, W.X., Y.Z. and T.S.; validation, W.X., S.W. and T.L.; formal analysis, S.W. and G.X.; investigation, T.L. and Y.Z.; resources, L.L.; data curation, S.W. and G.X.; writing—original draft preparation, G.X.; writing—review and editing, H.Y. and L.L.; visualization, G.X.; supervision, H.Y.; project administration, L.L.; funding acquisition, L.L. and H.Y. All authors have read and agreed to the published version of the manuscript.

Funding

This work was financially supported by the National Engineering Research Center for Freshwaters (Beijing) and Beijing Academy of Agriculture and Forestry Sciences Innovation Capability Project (KJCX20230215).

Institutional Review Board Statement

This study on Oreochromis niloticus culture and management adhered to the Management Rule of Laboratory Animals (Chinese Order No. 676 of the State Council, revised 1 March 2017). All necessary measures were taken to minimize animal suffering. The Beijing Academy of Agriculture and Forestry Sciences Fisheries Research Institute Ethics Committee approved the research protocols (identification code: 2021-7 and approved in 10 July 2021).

Informed Consent Statement

Not applicable.

Data Availability Statement

Data are contained within the article.

Acknowledgments

We thank Chuan He and Sen Li from Beijing Aquaculture Technology Extension Station for their experimental assistance.

Conflicts of Interest

The authors declare no conflicts of interest.

References

  1. Zhang, J.; Chen, J.; Liang, H.; Li, M.; Zhou, W.H.; Yang, Y.L.; Zhang, Z.; Ding, Q.W.; Ran, C.; Zhou, Z.G. Effect of crowding stress on liver health, gut permeability and gut microbiota of genetically improved farmed tilapia (GIFT, Oreochromis niloticus). Aquaculture 2025, 594, 741448. [Google Scholar] [CrossRef]
  2. Du, Z.Y.; Nie, P.; Liu, J. Genetic improvement for aquaculture species: A promising approach for aquaculture challenges and development. Rev. Aquac. 2021, 13, 1756–1757. [Google Scholar] [CrossRef]
  3. Wang, D.; Gao, H.; Song, D.; Wu, F. China Fishery Statistical Yearbook; China Agriculture Press: Beijing, China, 2024. [Google Scholar]
  4. Wu, Q.Q.; Huang, H.; Hao, S.X.; Cen, J.W.; Wei, Y.; Xiang, H.; Hu, X.; Zhao, Y.Q. Effect of hanging pulp on quality improvement and protein stability of prepared tilapia fillets. South China Fish. Sci. 2024, 4, 11–23. [Google Scholar]
  5. Qi, W.Y.; Wen, Y.; Wang, H.H.; Yue, L.; Chen, Z.J.; Yan, W.Q.; Zheng, Q.; Bao, Y.Z.; Zhang, Y.Y.; Kong, Q.L. Effects of electronic beams irradiation sterilization on cold storage life and sensory quality of tilapia fillets. J. Northwest A F Univ. (Nat. Sci. Ed.) 2020, 5, 138–145. [Google Scholar]
  6. Yilmaz, S. Effects of dietary caffeic acid supplement on antioxidant, immunological and liver gene expression responses, and resistance of Nile tilapia, Oreochromis niloticus to Aeromonas veronii. Fish Shellfish Immunol. 2019, 86, 384–392. [Google Scholar] [CrossRef]
  7. Li, Q.Q.; Huang, Y.; Zhang, X.Q.; Zou, C.Y.; Lin, L. Improvement of muscle quality in tilapia (Oreochromis niloticus) with dietary faba bean (Vicia faba L.). Front. Nutr. 2023, 10, 1153323. [Google Scholar] [CrossRef]
  8. Chen, L.J.; Kaneko, G.; Li, Y.C.; Xie, J.; Wang, G.J.; Li, Z.F.; Tian, J.J.; Zhang, K.; Gong, W.B.; Xia, Y.; et al. Reactive oxygen species (ROS)-mediated regulation of muscle texture in grass carp fed with dietary oxidants. Aquaculture 2021, 544, 737150. [Google Scholar] [CrossRef]
  9. Etemadi, F.; Barker, A.V.; Hashemi, M.; Zandvakili, O.R.; Park, Y. Nutrient accumulation in faba bean varieties. Commun. Soil Sci. Plant Anal. 2018, 49, 2064–2073. [Google Scholar] [CrossRef]
  10. Etemadi, F.; Hashemi, M.; Barker, A.V.; Zandvakili, O.R.; Liu, X.B. Agronomy, nutritional value, and medicinal application of faba bean (Vicia faba L.). Hortic. Plant J. 2019, 5, 170–182. [Google Scholar] [CrossRef]
  11. Gu, B.; Masli, M.D.P.; Ganjyal, G.M. Whole faba bean flour exhibits unique expansion characteristics relative to the whole flours of lima, pinto, and red kidney beans during extrusion. J. Food Sci. 2020, 85, 404–413. [Google Scholar] [CrossRef]
  12. Meng, Z.; Liu, Q.Q.; Zhang, Y.; Chen, J.H.; Sun, Z.P.; Ren, C.H.; Zhang, Z.J.; Cheng, X.; Huang, Y.F. Nutritive value of faba bean (Vicia faba L.) as a feedstuff resource in livestock nutrition: A review. Food Sci. Nutr. 2021, 9, 5244–5262. [Google Scholar] [CrossRef]
  13. Cutrignelli, M.I.; Calabrò, S.; Bovera, F.; Tudisco, R.; D’Urso, S.; Marchiello, M.; Piccolo, V.; Infascelli, F. Effects of two protein sources and energy level of diet on the performance of young Marchigiana bulls. 2. Meat quality. Ital. J. Anim. Sci. 2008, 7, 271–285. [Google Scholar] [CrossRef]
  14. Lanza, M.; Priolo, A.; Biondi, L.; Bella, M.; Ben Salem, H. Replacement of cereal grains by orange pulp and carob pulp in faba bean-based diets fed to lambs: Effects on growth performance and meat quality. Anim. Res. 2001, 50, 21–30. [Google Scholar] [CrossRef]
  15. Chen, L.J.; Liu, J.; Kaneko, G.; Xie, J.; Wang, G.J.; Yu, D.G.; Li, Z.F.; Ma, L.L.; Qi, D.; Tian, J.J.; et al. Quantitative phosphoproteomic analysis of soft and firm grass carp muscle. Food Chem. 2020, 303, 125367. [Google Scholar] [CrossRef] [PubMed]
  16. Yu, K.; Wang, C.N.; Huang, K.; Yang, X.H.; Luo, Y.X.; Huang, J.; Wang, D.D.; Li, J.M.; Jie, B.F.; Tang, Z.Y.; et al. Exploring the muscle-hardening mechanisms via the muscle-gut axis in tilapia (Oreochromis niloticus) fed with faba bean (Vicia faba L.) supplementary diets. Aquac. Rep. 2024, 37, 102268. [Google Scholar] [CrossRef]
  17. Hao, M.L.; Yi, L.L.; Cheng, W.J.; Zhu, J.H.; Zhao, S.M. Lipidomics analysis reveals new insights into crisp grass carp associated with meat texture. Heliyon 2024, 10, e32179. [Google Scholar] [CrossRef] [PubMed]
  18. Hao, M.L.; Cheng, W.J.; Xie, Y.X.; Li, C.T.; Zhu, J.H.; Yi, L.L.; Zhao, S.M. Identification of hub genes in meat quality of grass carp (Ctenopharyngodon idellus) fed with faba bean by muscle tissue transcriptomic analysis. Ital. J. Anim. Sci. 2024, 23, 594–606. [Google Scholar] [CrossRef]
  19. Zhou, L.; Lin, K.T.; Gan, L.; Sun, J.J.; Guo, C.J.; Liu, L.; Huang, X.D. Intestinal microbiota of grass carp fed faba beans: Acomparative study. Microorganisms 2019, 7, 465. [Google Scholar] [CrossRef]
  20. Lin, W.L.; Zeng, Q.X.; Zhu, Z.W. Different changes in mastication between crisp grass carp (Ctenopharyngodon idellus C. et V) and grass carp (Ctenopharyngodon idellus) after heating: The relationship between texture and ultrastructure in muscle tissue. Food Res. Int. 2009, 42, 271–278. [Google Scholar] [CrossRef]
  21. Yu, E.M.; Zhang, H.F.; Li, Z.F.; Wang, G.J.; Wu, H.K.; Xie, J.; Yu, D.G.; Xia, Y.; Zhang, K.; Gong, W.B. Proteomic signature of muscle fibre hyperplasia in response to faba bean intake in grass carp. Sci. Rep. 2017, 7, 45950. [Google Scholar] [CrossRef]
  22. Ma, L.L.; Kaneko, G.; Wang, X.J.; Xie, J.; Tian, J.J.; Zhang, K.; Wang, G.J.; Yu, D.G.; Li, Z.F.; Gong, W.B.; et al. Effects of four faba bean extracts on growth parameters, textural quality, oxidative responses, and gut characteristics in grass carp. Aquaculture 2020, 516, 734620. [Google Scholar] [CrossRef]
  23. Yang, J.Q.; Peng, K.; Liang, Q.C.; Cao, J.M.; Huang, W.; Hu, J.R.; Zhao, H.X.; Cai, J.; Zhang, S.F.; Chen, B. Effects of high level of faba bean supplementation on growth performance, muscle nutritional composition and fishy smell substances of genetic improvement of farmed tilapia (Oreochromis niloticus). Chin. J. Anim. Nutr. 2024, 36, 7236–7249. [Google Scholar]
  24. Chen, M.Y.; Li, Q.Q.; Yang, L.; Lin, W.Q.; Qin, Z.D.; Liang, S.W.; Lin, L.; Xie, X. Effects of diet containing germinated faba bean (Vicia faba L.) on the intestinal health and gut microbial communities of Nile tilapia (Oreochromis niloticus). Aquac. Rep. 2024, 36, 102053. [Google Scholar] [CrossRef]
  25. Li, Q.Q.; Huang, Y.; Zhang, X.Q.; Qin, Z.D.; Zou, C.Y.; Tan, X.H.; Xie, X.; Liang, S.W.; Lin, L. Effects of faba beans (Vicia faba L.) on growth performance, textural quality and physiological indices of tilapia (Oreochromis niloticus). Aquaculture 2023, 574, 739640. [Google Scholar] [CrossRef]
  26. Li, Y.C.; Zhang, J.M.; Fu, B.; Xie, J.; Wang, G.J.; Tian, J.J.; Xia, Y.; Yu, E.M. Textural quality, growth parameters and oxidative responses in Nile tilapia (Oreochromis niloticus) fed faba bean water extract diet. Peer J. 2022, 10, e13048. [Google Scholar] [CrossRef] [PubMed]
  27. Fu, B.; Peng, K.; Chen, B.; Huang, W.; Cao, J.M.; Liang, Q.C.; Che, N.Q.; Peng, Z.; Lao, C.Y. Effect of faba bean and its active substances on growth performance, blood indexes, muscle antioxidant capacity and muscle quality of tilapia (Oreochromis niloticus). Chin. J. Anim. Nutr. 2023, 35, 6574–6586. [Google Scholar]
  28. Guo, H.J.; Liu, G.Q.; Tian, M.D.; Liu, C.S.; Zhang, H.R.; Wang, S.Q.; Wen, X.B.; Lin, F. Effect of faba bean Vicia faba L. water/alcohol extract on growth performance, antioxidant capacity, textural properties, and collagen deposition in the swim bladder of juvenile Nibea coibor. Fish Physiol. Biochem. 2024, 50, 1157–1169. [Google Scholar] [CrossRef]
  29. Huang, D.Y.; Zhu, J.; Zhang, L.; Ge, X.P.; Ren, M.C.; Liang, H. Dietary supplementation with Eucommia ulmoides leaf extract improved the intestinal antioxidant capacity, immune response, and disease resistance against Streptococcus agalactiae in genetically improved farmed tilapia (GIFT; Oreochromis niloticus). Antioxidants 2022, 11, 1800. [Google Scholar] [CrossRef]
  30. Xu, G.L.; Xing, W.; Yu, H.H.; Jiang, N.; Ma, Z.H.; Luo, L.; Li, T.L. Evaluation of Chlorogenic acid supplementation in koi (Cyprinus carpio) diet: Growth performance, body color, antioxidant activity, serum biochemical parameters, and immune response. Aquac. Nutr. 2022, 2022, 2717003. [Google Scholar] [CrossRef]
  31. Xu, G.L.; Xing, W.; Li, T.L.; Yu, H.H.; Wei, S.B.; Jiang, N.; Ma, Z.H.; Luo, L. Dietary grape seed proanthocyanidins improved growth, immunity, antioxidant, digestive enzymes activities, and intestinal microbiota of juvenile hybrid sturgeon (Acipenser baeri Brandt ♀ × A. schrenckii Brandt ♂). Aquac. Nutr. 2021, 27, 1983–1995. [Google Scholar] [CrossRef]
  32. Li, Y.; Li, W.T.; Luo, L.; Ren, Y.Y.; Xing, W.; Xu, G.L.; Li, T.L.; Xue, M.; Yu, H.H.; Wu, Z.L. Dietary lipid levels affect growth performance, lipid metabolism, antioxidant and immune status of Amur sturgeon, Acipenser schrenckii. Aquac. Rep. 2023, 33, 101796. [Google Scholar] [CrossRef]
  33. Sun, Y.Z.; Yang, H.L.; Ma, R.L.; Lin, W.Y. Probiotic applications of two dominant gut Bacillus strains with antagonistic activity improved the growth performance and immune responses of grouper Epinephelus coioides. Fish Shellfish Immunol. 2010, 29, 803–809. [Google Scholar] [CrossRef] [PubMed]
  34. Xu, G.L.; Xing, W.; Li, T.L.; Ma, Z.H.; Liu, C.X.; Jiang, N.; Luo, L. Effects of dietary raffinose on growth, non-specific immunity, intestinal morphology and microbiome of juvenile hybrid sturgeon (Acipenser baeri Brandt ♀ × A. schrenckii Brandt ♂). Fish Shellfish Immunol. 2018, 72, 237–246. [Google Scholar] [CrossRef]
  35. Zhou, C.P.; Lin, H.Z.; Ge, X.P.; Niu, J.; Wang, J.; Yang, Y.; Chen, L.X.; Huang, Z.; Yu, W.; Tan, X.H. Effects of dietary soybean isoflavones on growth, innate immune responses, hepatic antioxidant abilities and disease resistance of juvenile golden pompano Trachinotus ovatus. Fish Shellfish Immunol. 2025, 43, 158–166. [Google Scholar] [CrossRef] [PubMed]
  36. Kong, Y.Q.; Ding, Z.L.; Zhang, Y.X.; Zhou, P.X.; Wu, C.B.; Zhu, M.H.; Ye, J.Y. Types of carbohydrate in feed affect the growth performance, antioxidant capacity, immunity, and activity of digestive and carbohydrate metabolism enzymes in juvenile Macrobrachium nipponense. Aquaculture 2019, 512, 734282. [Google Scholar] [CrossRef]
  37. Ren, Z.L.; Wang, S.F.; Cai, Y.; Wu, Y.; Tian, L.J.; Liao, J.Q.; Wang, S.Q.; Jiang, L.; Guo, W.L.; Zhou, Y.C. Antioxidant capacity, non-specific immunity, histopathological analysis and immune-related genes expression in Nile tilapia Oreochromis niloticus infected with Aeromonas schubertii. Aquaculture 2020, 529, 735642. [Google Scholar] [CrossRef]
  38. Livak, K.J.; Schmittgen, T.D. Analysis of relative gene expression data using real-time quantitative PCR and the 2−ΔΔCt Method. Methods 2001, 25, 402–408. [Google Scholar] [CrossRef]
  39. Crépon, K.; Marget, P.; Peyronnet, C.; Carrouee, B.; Arese, P.; Duc, G. Nutritional value of faba bean (Vicia faba L.) seeds for feed and food. Field Crops Res. 2010, 115, 329–339. [Google Scholar] [CrossRef]
  40. Sharan, S.; Zanghelini, G.; Zotzel, J.; Bonerz, D.; Aschoff, A.; Saint-Eve, A.; Maillard, M.N. Fava bean (Vicia faba L.) for food applications: From seed to ingredient processing and its effect on functional properties, antinutritional factors, flavor, and color. Compr. Rev. Food Sci. Food Saf. 2021, 20, 401–428. [Google Scholar] [CrossRef]
  41. Li, Z.F.; Yu, E.M.; Wang, G.J.; Yu, D.G.; Zhang, K.; Gong, W.B.; Xie, J. Broad Bean (Vicia faba L.) induces intestinal inflammation in grass carp (Ctenopharyngodon idellus C. et V) by increasing relative abundances of intestinal gram-negative and flagellated bacteria. Front. Microbiol. 2018, 9, 1913. [Google Scholar] [CrossRef]
  42. Chassaing, B.; Van de Wiele, T.; De Bodt, J.; Marzorati, M.; Gewirtz, A.T. Dietary emulsifiers directly alter human microbiota composition and gene expression ex vivo potentiating intestinal inflammation. Gut 2017, 66, 1414–1427. [Google Scholar] [CrossRef]
  43. Jiang, W.B.; Li, X.Q.; Ji, D.; Leng, X.J. Comparative study on effects of germinated broad bean and germinated pea on growth and flesh quality of grass carp, Ctenopharyngodon idella. J. Shanghai Ocean Univ. 2021, 30, 83–93. [Google Scholar]
  44. Lun, F.; Leng, X.J.; Meng, X.L.; Liu, X.M. Effect of feeding broad bean on muscle quality of tilapia. J. Shanghai Ocean Univ. 2017, 16, 83–86. [Google Scholar]
  45. Gan, L.; Li, X.X.; Pan, Q.; Wu, S.L.; Feng, T.; Ye, H. Effects of replacing soybean meal with faba bean meal on growth, feed utilization and antioxidant status of juvenile grass carp, Ctenopharyngodon idella. Aquac. Nutr. 2017, 23, 192–200. [Google Scholar] [CrossRef]
  46. Ouraji, H.; Zaretabar, A.; Rahmani, H. Performance of rainbow trout (Oncorhynchus mykiss) fingerlings fed diets containing different levels of faba bean (Vicia faba) meal. Aquaculture 2013, 416–417, 161–165. [Google Scholar] [CrossRef]
  47. Singh, A.; Bharati, R.C.; Manibhushan, N.; Pedpati, A. An assessment of faba bean (Vicia faba L.) current status and future prospect. Afr. J. Agric. Res. 2013, 8, 6634–6641. [Google Scholar]
  48. Song, D.Y.; Yun, Y.H.; Mi, J.L.; Luo, J.X.; Jin, M.; Nie, G.X.; Zhou, Q.C. Effects of faba bean on growth performance and fillet texture of Yellow River carp, Cyprinus carpio haematopterus. Aquac. Rep. 2020, 17, 100379. [Google Scholar] [CrossRef]
  49. Fu, B.; Peng, K.; Zhao, H.X.; Chen, B.; Wang, G.X.; Cao, J.M.; Huang, W. Research progress on the mechanism of fish embrittlement. Feed Res. 2023, 3, 140–143. [Google Scholar]
  50. Luo, X.M.; Shi, B.B. Influence of raw material fermentation on broad beans nutrients and anti-nutritional factors. Cereals Oils 2012, 8, 29–31. [Google Scholar]
  51. Jose, I.; Castanon, R.; Ronald, R. Effect of enzyme addition, autoclave treatment and fermenting on the nutritive value of field beans (Vicia faba L.). Anim. Feed Sci. Technol. 1989, 26, 71–79. [Google Scholar]
  52. National Research Council (NRC). Nutrient Requirements of Fish and Shrimp; National Academies Press: Washington, DC, USA, 2011.
  53. Li, Y.C.; Chen, B.; Zhang, J.M.; Wang, G.J.; Gong, W.B.; Tian, J.J.; Li, H.Y.; Zhang, K.; Xia, Y.; Li, Z.F.; et al. Combined effects of dietary faba bean water extract and vitamin K3 on growth performance, textural quality, intestinal characteristics, oxidative and immune responses in grass carp. Peer J. 2023, 11, e15733. [Google Scholar] [CrossRef] [PubMed]
  54. Valente, L.M.P.; Araœjo, M.; Batista, S.; Peixoto, M.J.; Sousa-Pinto, I.; Brotas, V.; Cunha, L.M.; Rema, P. Carotenoid deposition, flesh quality and immunological response of Nile tilapia fed increasing levels of IMTA-cultivated Ulva spp. J. Appl. Phycol. 2016, 28, 691–701. [Google Scholar] [CrossRef]
  55. López-Albors, O.; Abdel, I.; Periago, M.J.; Ayala, D.; García Alcázar, A.; Martínez Graciá, C.; Nathanailides, C.; Vázquez, J.M. Temperature influence on the white muscle growth dynamics of the sea bass Dicentrarchus labrax, L. Flesh quality implications at commercial size. Aquaculture 2008, 277, 39–51. [Google Scholar] [CrossRef]
  56. Johnston, I.A.; Li, X.J.; Vieira, V.L.A.; Nickell, D.; Dingwall, A.; Alderson, R.; Campbell, P.; Bickerdike, R. Muscle and flesh quality traits in wild and farmed Atlantic salmon. Aquaculture 2016, 256, 323–336. [Google Scholar] [CrossRef]
  57. Xu, J.H.; Wang, Y.; Zeng, X.X.; Yang, G.; Wu, X.; Zhu, G.X.; Wang, H.H.; Bai, D.Q. Effects of muscle quality improved feed on the growth performance, muscle quality and antioxidant ability of Ictalurus punctatus Rafinesque. China Feed 2020, 21, 79–86. [Google Scholar]
  58. Joyce, W. Muscle growth and plasticity in teleost fish: The significance of evolutionarily diverse sarcomeric proteins. Rev. Fish Biol. Fisheries 2023, 33, 1311–1327. [Google Scholar] [CrossRef]
  59. Koganti, P.; Yao, J.B.; Cleveland, B.M. Molecular mechanisms regulating muscle plasticity in fish. Animals 2021, 7, 61. [Google Scholar] [CrossRef]
  60. Rowlerson, A.; Radaelli, G.; Mascarello, F.; Veggetti, A. Regeneration of skeletal muscle in two teleost fish: Sparus aurata and Brachydanio rerio. Cell Tissue Res. 1997, 289, 311–322. [Google Scholar] [CrossRef]
  61. Hurling, R.; Rodell, J.B.; Hunt, H.D. Fiber diameter and fish texture. J. Texture Stud. 1996, 27, 679–685. [Google Scholar] [CrossRef]
  62. Johnston, I.A.; Manthri, S.; Bickerdike, R.; Dingwall, A.; Luijkx, R.; Campbell, P.; Nickell, D.; Alderson, R. Growth performance, muscle structure and flesh quality in out-of-season atlantic salmon (Salmo salar) smolts reared under two different photoperiod regimes. Aquaculture 2004, 237, 281–300. [Google Scholar] [CrossRef]
  63. Li, Y.C.; Fu, B.; Zhang, J.M.; Wang, G.J.; Tian, J.J.; Li, H.Y.; Xia, Y.; Xie, J.; Yu, E.M. Comparative genome-wide methylation analysis reveals epigenetic regulation of muscle development in grass carp (Ctenopharyngodon idellus) fed with whole faba bean. Peer J. 2022, 10, e14403. [Google Scholar] [CrossRef]
  64. Randhir, R.; Vattem, D.; Shetty, K. Antioxidant enzyme response studies in H2O2-stressed porcine muscle tissue following treatment with oregano phenolic extracts. Process Biochem. 2005, 40, 2123–2134. [Google Scholar] [CrossRef]
  65. Chen, X.M.; Wang, Q.J.; Guo, Z.X.; Zhao, Y.L.; Gao, Y.Q.; Yu, T.; Chen, Y.K.; Zhang, D.M.; Wang, G.Q. Effects of dietary oxidized fish oil on growth performance and antioxidant defense mechanism of juvenile Rhynchocypris lagowski Dybowski. Aquaculture 2019, 512, 734368. [Google Scholar] [CrossRef]
  66. Song, D.Y.; Yun, Y.H.; He, Z.J.; Mi, J.L.; Luo, J.X.; Jin, M.; Zhou, Q.C.; Nie, G.X. Effects of faba bean (Vicia faba L.) on fillet quality of Yellow River carp (Cyprinus carpio) via the oxidative stress response. Food Chem. 2022, 388, 132953. [Google Scholar] [CrossRef] [PubMed]
  67. Alami-Durante, H.; Bazin, D.; Cluzeaud, M.; Fontagne-Dicharry, S.; Kaushik, S.; Geurden, I. Effect of dietary methionine level on muscle growth mechanisms in juvenile rainbow trout (Oncorhynchus mykiss). Aquaculture 2018, 483, 273–285. [Google Scholar] [CrossRef]
  68. Kenta, K.; Youhei, W.; Yasutoshi, Y.; Toyoda, A.; Ueno, T.; Fukuyama, H.; Kato, K.; Kinoshita, M. Production of a breed of red sea bream Pagrus major with an increase of skeletal muscle muss and reduced body length by genome editing with CRISPYR/Cas9. Aquaculture 2018, 495, 415–427. [Google Scholar]
  69. Michelato, M.; Furuya, W.M.; Gatlin, D.M. Metabolic responses of Nile tilapia Oreochromis niloticus to methionine and taurine supplementation. Aquaculture 2018, 485, 66–72. [Google Scholar] [CrossRef]
  70. Wu, G.; Zhang, J.; Wang, L.; Xu, S.; Zhou, J.; Xiang, A.; Yang, C. Sex- and age-dependent expression of Pax7, myf 5, MyoG, and myostatin in yak skeletal muscles. Genet. Mol. Res. 2016, 15, 7–9. [Google Scholar] [CrossRef]
  71. Bower, N.I.; Johnston, I.A. Discovery and characterization of nutritionally regulated genes associated with muscle growth in atlantic salmon. Physiol. Genomics 2010, 42A, 114–130. [Google Scholar]
  72. Yu, E.M.; Xie, J.; Wang, G.J.; Yu, D.G.; Gong, W.B.; Li, Z.F.; Wang, H.Y.; Xia, Y.; Wei, N. Gene expression profiling of grass carp (Ctenopharyngodon idellus) and crispy grass carp. Int. J. Genom. 2014, 2014, 639687. [Google Scholar]
  73. Shioya, I.; Takemura, S.; Ishizuka, R.; Yamaguchi, T. Variations in the proximate composition of muscle in cultured yellowtail Seriola quinqueradiata at different anatomical portions. Fish. Sci. 2012, 7, 725–733. [Google Scholar] [CrossRef]
  74. Xu, W.H.; Guo, H.H.; Chen, S.J.; Wang, Y.Z.; Lin, Z.H.; Huang, X.D.; Tang, H.J.; He, Y.H.; Sun, J.J.; Gan, L. Transcriptome analysis revealed changes of multiple genes involved in muscle hardness in grass carp (Ctenopharyngodon idellus) fed with faba bean meal. Food Chem. 2020, 314, 126205. [Google Scholar] [CrossRef] [PubMed]
  75. Yu, E.M.; Ma, L.L.; Ji, H.; Li, Z.F.; Wang, G.J.; Xie, J.; Yu, D.G.; Kaneko, G.; Tian, J.J.; Zhang, K.; et al. Smad4-dependent regulation of type I collagen expression in the muscle of grass carp fed with faba bean. Gene 2019, 685, 32–41. [Google Scholar] [CrossRef] [PubMed]
  76. Yu, E.M.; Fu, B.; Wang, G.J.; Li, Z.F.; Ye, D.W.; Jiang, Y.; Ji, H.; Wang, X.; Yu, D.G.; Ehsan, H.; et al. Proteomic and metabolomic basis for improved textural quality in crisp grass carp (Ctenopharyngodon idellus C.et V) fed with a natural dietary pro-oxidant. Food Chem. 2020, 325, 126906. [Google Scholar] [CrossRef]
  77. Li, Z.M.; Leng, X.J.; Li, X.Q.; Zhu, R.J.; Guang, L.; Li, N.S. Analysis on growth performance, muscle quality, serum biochemical indexes and digestive enzyme activities of crispy grass carp. Jiangsu Agric. Sci. 2012, 40, 186–189. [Google Scholar]
  78. Liu, B.H.; Wang, G.J.; Yu, E.M.; Xie, J.; Yu, D.W.; Wang, H.Y.; Gong, W.B. Comparison and evaluation of nutrition composition in muscle of grass carp Ctenopharyngodon idellus fed with broad bean and common compound feed. South China Fish. Sci. 2011, 7, 58–65. [Google Scholar]
Figure 1. The microstructure of the muscle’s transverse section in tilapia (n = 6 per treatment). Crispy texture development period: from 0 to 16 weeks, tilapias were fed with the control diet (0% FB) and 60% FB diet, respectively. Crispy texture retention period: from 17 to 24 weeks, all fish in both groups were fed with the control diet. (a,c,e,g,i,k) represented the muscle microstructure of tilapias in the control group at 4 to 24 weeks, respectively. (b,d,f,h,j,l) represented the muscle microstructure of tilapias in the control group at 4 to 24 weeks, respectively. Hematoxylin and eosin staining (H&E) were performed, and microstructure observations were using light microscopy (bar = 100 μm). mf, muscle fiber; mmf, matrix between muscle fibers.
Fishes 10 00170 g001
Figure 2. The muscle-fiber densities and diameters of tilapia. The first 16 weeks was the crispy texture development period, and tilapias in the two groups were fed a control diet and a 60% FB diet, respectively. Weeks 17 to 24 were the crispy texture retention period, and the fish in both groups were fed control diets. Data are expressed as means ± standard error (n = 6 per treatment). Muscle-fiber densities of tilapia from the 60% FB group were clearly increased at 8 to 24 weeks, whereas muscle-fiber diameters of fish were significantly decreased at 8 to 16 weeks. “*” indicates a significant difference between both groups (p < 0.05).
Fishes 10 00170 g002
Figure 3. The gene expression in the muscle of tilapia. The first 16 weeks was the crispy texture development period, and tilapias in the two groups were fed a control diet and a 60% FB diet, respectively. Weeks 17 to 24 were the crispy texture retention period, and the fish in both groups were fed control diets. Data are expressed as means ± standard error (n = 6 per treatment). “*” indicates a significant difference between both groups (p < 0.05).
Fishes 10 00170 g003
Table 1. Ingredient composition, proximate composition, and amino acid profile of experimental diets 1.
Ingredient (g/kg Diet) a0% FB (Control Diet)60% FB
Lecithin oil22
Choline chloride0.20.2
Monocalcium phosphate1.81.8
Wheat flour2910
Wheat middling290
GIFT premix11
Fish meal1515
Wheat gluten2210
Faba bean060
Total100100
Proximate composition
Crude protein35.7736.01
Crude lipid4.254.53
Ash4.424.77
Moisture10.2611.31
Gross energy (MJ/kg)18.1617.99
Amino acid (% crude protein)
Aspartic acid12.1210.87
Threonine4.444.12
Serine5.855.62
Glutamic acid22.3926.94
Glycine4.605.13
Alanine4.654.97
Cysteine0.740.87
Valine3.933.69
Methionine1.871.47
Isoleucine3.843.33
Leucine8.748.07
Tyrosine3.512.78
Phenylalanine5.614.58
Histidine4.624.19
Lysine6.426.37
Arginine6.697.03
a Fish meal was produced in Peru and supplied by the International Fish Meal and Fish Oil Organization (IFFO, Hertfordshire, UK); lecithin oil was supplied by YiHai Kerry Investment Company Limited, Shandong, China; wheat flour was supplied by Guchuan Group, Beijing, China; faba beans were supplied by Shaanxi Jinkangtai Biotechnology Co., Ltd., Xi’an, China; GIFT premix included a vitamin–mineral premix and was described in [29]. 1 All diets were produced at the national aquafeed safety evaluation station, Beijing, China, as extruded pellets.
Table 2. Sequences of primers used in this study.
Gene NameGeneBank No.Sequences of Primers (5′ to 3′)Tm (°C)Amplification Size/bp
col1a-1NM_001279444.1F: GGACGCCATCAAGGTCTACT60175
R: GCCCTCACTGCCATACTCG
col1a-2NM_001282897.1F: AGCACCGAGAACAAGAAGCA60185
R: TCCATGTAGGCAACGCTGT
igf-1AY979869.1F: GTGCGATGTGCTGTATCTCCT60178
R: CCATAGCCTGTTGGTTTATTGA
mstnXM_003458832.5F: GTAATGATGGCAACTGAACCTG60219
R: CAAGGAGCGGATTCGTATGT
myogNM_001279526.1F: CCAGAGTGTCGTCGTCAAGC60158
R: GGTCAAGGCCCGCATG
gapdhXM_005455438.3F: ATCACTGCCACCCAGAAGAC60207
R: CAGACGGACTGTCAGGTCAA
Note: col1a-1, collagen type I alpha 1; col1a-2, collagen type I alpha 2; igf-1, insulin-like growth factor 1; mstn, myostain; myog, myogenin; and gapdh, glyceraldehyde-3-phosphate dehydrogenase.
Table 3. The growth performance and body indices of tilapia fed the experimental diets after the 16-week feeding period.
0% FB (Control)60% FBp Value
IBW (g/fish)258.44 ± 0.15258.00 ± 0.420.37
FBW (g/fish)562.63 ± 15.88615.87 ± 21.340.12
WGR (%)117.70 ± 6.19138.73 ± 8.560.12
SGR (%/day)0.69 ± 0.0260.77 ± 0.0310.11
FCR1.59 ± 0.0621.43 ± 0.0830.18
SR (%)98.89 ± 1.1196.67 ± 1.920.37
HSI (%)1.74 ± 0.232.16 ± 0.210.20
VSI (%)7.36 ± 0.197.71 ± 0.360.42
CF (%)3.35 ± 0.0333.50 ± 0.0890.12
Note: Data are expressed as means ± standard error (n = 3 per treatment). IBW, initial body weight; FBW, final body weight; WGR, weight gain rate; SGR, specific growth rate; FCR, feed conversion ratio; SR, survival rate; HSI, hepatosomatic index; VSI, viscerosomatic index; CF, condition factor.
Table 4. Textural parameters in muscle of tilapia fed the experimental diets.
Sampling TimeTextural Parameters0% FB (Control)60% FBp Value
Crispy texture development period 14-weekHardness34.47 ± 6.0436.64 ± 8.990.86
Adhesiveness0.18 ± 0.0420.24 ± 0.0680.51
Cohesiveness0.37 ± 0.0160.38 ± 0.0300.78
Springiness1.56 ± 0.121.56 ± 0.0960.99
Gumminess12.83 ± 2.3413.00 ± 2.260.81
Chewiness21.16 ± 4.9120.82 ± 4.230.54
Shear force25.56 ± 6.1326.08 ± 2.900.66
8-weekHardness56.28 ± 1.2767.36 ± 2.42 *0.010
Adhesiveness0.22 ± 0.0530.20 ± 0.0310.72
Cohesiveness0.30 ± 0.0120.34 ± 0.0210.19
Springiness1.53 ± 0.131.93 ± 0.074 *0.018
Gumminess20.14 ± 0.8622.96 ± 1.040.56
Chewiness27.24 ± 0.3236.08 ± 1.50 *0.029
Shear force28.16 ± 3.2147.84 ± 3.20 *0.008
12-weekHardness63.17 ± 2.7875.90 ± 1.30 *0.016
Adhesiveness0.18 ± 0.0040.21 ± 0.0170.19
Cohesiveness0.32 ± 0.0200.32 ± 0.0260.93
Springiness1.92 ± 0.0292.18 ± 0.055 *0.002
Gumminess23.81 ± 2.7924.74 ± 3.080.83
Chewiness32.60 ± 3.0746.85 ± 2.02 *0.008
Shear force32.66 ± 1.5452.78 ± 2.98 *0.000
16-weekHardness67.71 ± 1.6180.69 ± 1.73 *0.002
Adhesiveness0.17 ± 0.00580.22 ± 0.0350.89
Cohesiveness0.27 ± 0.00980.30 ± 0.00880.054
Springiness1.69 ± 0.0281.95 ± 0.090 *0.000
Gumminess20.37 ± 1.5926.01 ± 1.690.13
Chewiness34.34 ± 2.8550.82 ± 4.22 *0.005
Shear force35.52 ± 0.9856.26 ± 2.84 *0.000
Crispy texture retention period 220-weekHardness72.74 ± 1.33103.41 ± 1.56 *0.000
Adhesiveness0.28 ± 0.0250.21 ± 0.0140.099
Cohesiveness0.28 ± 0.0160.30 ± 0.0120.37
Springiness1.76 ± 0.0402.37 ± 0.038 *0.000
Gumminess18.43 ± 0.5823.14 ± 1.930.18
Chewiness35.06 ± 1.9959.80 ± 5.31 *0.038
Shear force44.58 ± 0.8354.31 ± 1.76 *0.000
24-weekHardness89.71 ± 3.60100.94 ± 1.04 *0.024
Adhesiveness0.28 ± 0.0970.33 ± 0.0630.66
Cohesiveness0.22 ± 0.00860.23 ± 0.00810.54
Springiness2.04 ± 0.0362.34 ± 0.015 *0.000
Gumminess19.87 ± 1.3922.28 ± 1.080.22
Chewiness40.41 ± 2.3852.18 ± 2.37 *0.013
Shear force56.67 ± 3.8084.14 ± 5.98 *0.017
Note: Data are expressed as means ± standard error (n = 6 per treatment). “*” means a significant difference between 0% FB and 60% FB groups (p < 0.05). 1 Crispy texture development period: during the first 16 weeks of the feeding trial, tilapias in the control and FB groups were fed with control diet (0% FB) and 60% FB diet, respectively. 2 Crispy texture retention period: from 17 to 24 weeks, all fish in both groups were fed with the control diet (0% FB).
Table 5. Non-specific immunity and antioxidant activity in the serum of tilapia fed the experimental diets.
Sampling TimeParameters0% FB (Control)60% FBp Value
Crispy texture development period 14-weekSOD (U/mL)49.04 ± 1.3154.36 ± 0.82 *0.014
MDA (nmol/mL)2.28 ± 0.31 *1.46 ± 0.190.047
CAT (U/mL)2.26 ± 0.351.80 ± 0.270.092
MPO (U/L)29.66 ± 4.3231.46 ± 4.510.78
C3 (μg/mL)273.79 ± 6.58248.12 ± 18.870.23
LZM (U/L)1.81 ± 0.092.03 ± 0.240.40
8-weekSOD (U/mL)52.78 ± 1.0953.64 ± 0.890.58
MDA (nmol/mL)2.42 ± 0.231.96 ± 0.140.12
CAT (U/mL)2.82 ± 0.722.97 ± 0.550.87
MPO (U/L)29.00 ± 3.9824.91 ± 2.830.42
C3 (μg/mL)294.19 ± 13.05290.72 ± 20.540.89
LZM (U/L)2.25 ± 0.182.49 ± 0.200.38
12-weekSOD (U/mL)51.90 ± 2.0955.33 ± 1.770.28
MDA (nmol/mL)1.83 ± 0.191.74 ± 0.260.79
CAT (U/mL)2.52 ± 0.372.01 ± 0.160.23
MPO (U/L)21.63 ± 3.2916.06 ± 1.520.15
C3 (μg/mL)255.34 ± 11.52219.52 ± 13.120.067
LZM (U/L)1.81 ± 0.092.03 ± 0.240.15
16-weekSOD (U/mL)53.73 ± 0.2655.72 ± 3.590.59
MDA (nmol/mL)2.17 ± 0.241.62 ± 0.230.13
CAT (U/mL)2.38 ± 0.272.22 ± 0.230.67
MPO (U/L)19.50 ± 1.9421.30 ± 2.350.57
C3 (μg/mL)280.77 ± 15.50285.64 ± 17.960.84
LZM (U/L)1.84 ± 0.0682.02 ± 0.0610.092
Crispy texture retention period 220-weekSOD (U/mL)59.58 ± 7.9253.22 ± 0.890.46
MDA (nmol/mL)2.56 ± 0.212.63 ± 0.210.83
CAT (U/mL)2.20 ± 0.142.63 ± 0.450.39
MPO (U/L)18.93 ± 2.7324.58 ± 4.700.34
C3 (μg/mL)434.83 ± 32.33401.49 ± 10.870.37
LZM (U/L)2.26 ± 0.222.34 ± 0.180.79
24-weekSOD (U/mL)51.54 ± 0.3953.15 ± 1.000.18
MDA (nmol/mL)2.52 ± 0.102.16 ± 0.230.21
CAT (U/mL)1.42 ± 0.221.96 ± 0.150.087
MPO (U/L)20.24 ± 1.3423.43 ± 1.670.19
C3 (μg/mL)430.67 ± 29.79387.37 ± 42.040.21
LZM (U/L)2.26 ± 0.222.21 ± 0.140.84
Note: Data are expressed as means ± standard error (n = 6 per treatment). “*” means a significant difference between 0% FB and 60% FB groups (p < 0.05). 1 Crispy texture development period: during the first 16 weeks of the feeding trial, tilapias in the control and FB groups were fed with the control diet (0% FB) and 60% FB diet, respectively. 2 Crispy texture retention period: from 17 to 24 weeks, all fish in both groups were fed with the control diet (0% FB).
Table 6. Serum biochemical parameters of tilapia fed the experimental diets.
Sampling TimeParameters0% FB (Control)60% FBp Value
Crispy texture development period 14-weekAST (U/L)4.74 ± 0.444.34 ± 0.370.50
ALT (U/L)1.71 ± 0.232.16 ± 0.390.33
TG (mmol/L)1.23 ± 0.220.98 ± 0.110.33
TC (mmol/L)2.69 ± 0.222.49 ± 0.190.51
HDLC (mmol/L)0.37 ± 0.0370.42 ± 0.0200.21
8-weekAST (U/L)4.11 ± 0.383.53 ± 0.350.29
ALT (U/L)1.43 ± 0.152.37 ± 0.460.078
TG (mmol/L)0.69 ± 0.0760.72 ± 0.0730.75
TC (mmol/L)2.47 ± 0.0942.95 ± 0.200.054
HDLC (mmol/L)0.42 ± 0.0570.31 ± 0.0440.17
12-weekAST (U/L)3.43 ± 0.303.31 ± 0.100.27
ALT (U/L)2.11 ± 0.172.45 ± 0.230.71
TG (mmol/L)0.83 ± 0.150.67 ± 0.0830.38
TC (mmol/L)2.66 ± 0.282.26 ± 0.140.23
HDLC (mmol/L)0.42 ± 0.0150.43 ± 0.0130.59
16-weekAST (U/L)3.19 ± 0.243.65 ± 0.170.20
ALT (U/L)1.73 ± 0.282.67 ± 0.380.075
TG (mmol/L)0.87 ± 0.0900.75 ± 0.0700.44
TC (mmol/L)2.44 ± 0.102.76 ± 0.150.22
HDLC (mmol/L)0.32 ± 0.0260.39 ± 0.0250.083
Crispy texture retention period 220-weekAST (U/L)3.58 ± 0.0883.60 ± 0.870.98
ALT (U/L)1.95 ± 0.182.38 ± 0.270.23
TG (mmol/L)1.30 ± 0.181.45 ± 0.0890.47
TC (mmol/L)4.35 ± 0.333.73 ± 0.0870.12
HDLC (mmol/L)0.44 ± 0.0760.48 ± 0.0860.74
24-weekAST (U/L)3.65 ± 0.0523.52 ± 0.170.45
ALT (U/L)1.94 ± 0.291.87 ± 0.300.87
TG (mmol/L)0.82 ± 0.0841.11 ± 0.210.26
TC (mmol/L)4.23 ± 0.283.73 ± 0.150.18
HDLC (mmol/L)0.57 ± 0.0500.51 ± 0.0480.39
Note: Data are expressed as means ± standard error (n = 6 per treatment). 1 Crispy texture development period: During the first 16 weeks of the feeding trial, tilapias in the control and FB groups were fed with a control diet (0% FB) and a 60% FB diet, respectively. 2 Crispy texture retention period: from 17 to 24 weeks, all fish in both groups were fed with the control diet (0% FB).
Disclaimer/Publisher’s Note: The statements, opinions and data contained in all publications are solely those of the individual author(s) and contributor(s) and not of MDPI and/or the editor(s). MDPI and/or the editor(s) disclaim responsibility for any injury to people or property resulting from any ideas, methods, instructions or products referred to in the content.

