Article

Sub-Lethal Effects of Predators in Aquaculture: Assessment of Chronic Exposure to Conspecific Alarm Substance on Feeding and Growth Performances of Nile Tilapia

by
Rafaela Torres Pereira
1,
Alexandre Luiz Arvigo
2,
Caio Akira Miyai
2,
Augusto Rysevas Silveira
1,
Percília Cardoso Giaquinto
1,3,
Helton Carlos Delicio
1,
Leonardo José Gil Barcellos
4 and
Rodrigo Egydio Barreto
1,3,*
1
Department of Structural and Functional Biology, Institute of Biosciences of Botucatu, São Paulo State University, UNESP, R. Prof. Dr. Antônio Celso Wagner Zanin, 250—Distrito de Rubião Junior, Botucatu 18618-689, SP, Brazil
2
Biosciences Institute, Campus of São Vicente, São Paulo State University, UNESP, Praça Infante Dom Henrique, s/n, São Vicente 11330-900, SP, Brazil
3
Aquaculture Center, São Paulo State University, CAUNESP, Jaboticabal 14884-900, SP, Brazil
4
Graduate Program in Pharmacology, University of Passo Fundo, BR 285, São José, Passo Fundo 99052-900, RS, Brazil
*
Author to whom correspondence should be addressed.
Fishes 2025, 10(4), 174; https://doi.org/10.3390/fishes10040174
Submission received: 29 January 2025 / Revised: 4 April 2025 / Accepted: 9 April 2025 / Published: 12 April 2025
(This article belongs to the Special Issue Stress Physiology in Aquatic Animals)

Abstract

:
In aquaculture practices, fish are mostly protected from lethal actions of predators. However, sub-lethal effects can be challenging to prevent, as they may be associated with chemical cues signaling predation risk that easily dissolve and spread in water, serving as potential stressors. These cues originate from predators, stressed or injured prey releasing blood, a conspecific alarm substance (CAS), and/or other bodily fluids. In this study, we simulated a small-scale net cage system and assessed the feeding and growth of Nile tilapia exposed chronically to a CAS. Nile tilapia, an invasive species in many aquatic systems, frequently coexist freely alongside those cultivated in cages. Consequently, caged tilapia may regularly be exposed to a CAS, potentially leading to chronic stress and impacting growth and development. Fish were exposed daily to either a CAS or a control vehicle (distilled water) for 45 days (one fish per cage). Fish in both conditions exhibited similar increases in body mass, weight gain, and length over time and displayed an allometric negative growth profile, indicating that the CAS did not affect the length–weight relationship as well. Specific and relative growth rates, condition factor, body axes, food intake, and feeding conversion efficiency were also unaffected by the CAS over time. This body of evidence suggests that the CAS did not act as a chronic stressor for caged Nile tilapia and a possible explanation is habituation.
Key Contribution: We found that feeding and growth performances were not affected by the conspecific alarm substance in Nile tilapia chronically exposed to that chemical cue. This indicates that this stimulus did not act as a chronic stressor in this species.

1. Introduction

In aquaculture, fish are often extensively shielded from lethal predator attacks. However, the same level of protection cannot be guaranteed against cues indicating predation risk, which can trigger anti-predatory responses. Direct physical attacks from piscivorous predators, including birds and mammals [1], fish [2], copepods (larval fish predators) [3], and cannibalism [4], have been documented in farming systems. The use of physical barriers, such as nets and fences, though not entirely foolproof, is employed to deter such lethal attacks from piscivorous predators with some success [1]. In this scenario, when fish, potential prey, come under attack, they typically engage in defensive maneuvers to evade capture and consumption by predators [5]. However, such instances are extreme, as they occur after the predator has initiated aggression; more commonly, potential prey aim to avoid predator encounters altogether [6]. To achieve this, early predator detection and the execution of anti-predatory maneuvers often take place well in advance of any actual attack (anticipatory defensive responses—Endler, 1986 [7]). Such detection relies on the perception of sensory cues from predators, such as chemical cues [8,9,10,11].
In the context of the prey–predator system, chemical cues serve as indicators, directly or indirectly, of the presence of a predator. Direct signaling occurs through the detection of predator odor [12]. Conversely, indirect signaling can stem from chemical cues released by prey [8].
The indirect chemical cues of predation risk and their effects have been extensively studied across various fish species. Chemical cues released during the attack and capture stages of a predation event result in the release of skin injury chemical cues, signaling active foraging by predators and indicating a more imminent risk of predation [12]. This alarm system is believed to be based on epidermal ‘club’ cells found in Ostariophysi fish, or cells resembling these ‘club’ cells in non-Ostariophysi fish (known as sacchiform cells) [11,13], which likely produce and store a putative conspecific alarm substance (CAS) [6,8,14,15]. Consequently, these cues are released into the water when the skin is mechanically damaged during a successful predator attack, promptly alerting conspecifics. Conspecifics then exhibit alarm reactions characterized by behavioral changes (e.g., escape maneuvers) and physiological responses (e.g., stress response) [6,8,9,10,11,12,16,17]. These responses are usually short-term reactions intended to avoid imminent risk [8,12]. However, in areas with intense predator activity, such release of chemical alarm cues may occur frequently, potentially leading to long-term adjustments.
The potential cost that predators impose on their prey inevitably can disrupt the balance between energy/nutrient acquisition and safety; in other words, prey often must sacrifice short- to medium-term caloric acquisition in the name of survival [18]. One way this occurs is through the displacement of time spent foraging or seeking food to remain vigilant, as described in several studies for different animals [19,20,21,22], thereby impacting feeding activities. In this sense, drastic effects can occur. For example, it has been documented that feeding suppression and a reduction in weight gain occurred in Atlantic salmon Salmo salar [23] and guppies Poecilia reticulata [24] under conditions of increased predation risk. Despite that, other potential changes caused by predator cues may be more relevant in this context. This involves the reallocation of energy and nutrients for other activities (coping with these stressors) and/or plastic changes in fish unrelated to body mass gain. In response to chemical predator cues (Crenicichla alta), guppies do not decrease foraging activity but increase amino acid processing for gluconeogenesis, consequently reducing the mobilization of these nutrients for muscle gain [25]. Another possibility, under continuous exposure to predation risk, is the mobilization of nutrients and energy for morphological changes not linked to muscle gain, for example, eye and eyespot growth in the Ambon damselfish Pomacentrus amboinensis [26], decrease in length and increase in body height in goldfish Carassius auratus [27], or alteration of body shape, such as in crucian carp Carassius carassius [28] and in perch Perca fluviatilis [29].
Based on all presented evidence, in this study, we investigate whether chronic exposure to a conspecific alarm substance (CAS), an indirect indicator of predation risk, can affect feeding and growth in a commonly domesticated and cultivated fish species, the Nile tilapia. This species was chosen due to evidence suggesting its acute responsiveness to the CAS (behavioral/stress responses) [11,17]. However, the long-term stress responses in Nile tilapia continuously exposed to the CAS remain unknown. Nile tilapia plays a significant role in global aquaculture, particularly in human food supply, and its production is on the rise [30,31]. Therefore, understanding the various stressful situations and stress responses in this species becomes crucial.

2. Materials and Methods

2.1. Ethical Approval

This study agreed with Brazilian legislation regulated by the National Council for the Control of Animal Experimentation (CONCEA) and the Ethical Principles in Animal Research formulated by the Brazilian Society of Science in Laboratory Animals and was approved by the Bioscience Institute (UNESP) Ethics Committee on Use of Animals (CEUA 948-2017).

2.2. Fish and Holding Conditions

Alevins of Nile tilapia (Oreochromis niloticus (L.), GIFT strain, sex reverted, all males) held in an indoor masonry 1000 L tank comprised our stock population. Tank water temperature was kept at about 26–27 °C, with continuous aeration, mechanical–biological filtering, and constant flow of dechlorinated water for water renewal, allowing ammonia and nitrite levels to be maintained low. Water pH was about 7.0–7.5. The photoperiod was set up from 06:00 to 18:00 h (12 light:12 dark). Fish were daily hand-fed in excess with tilapia chow (36% protein; Supra Tilapia®; Alisul Alimentos S/A—SUPRA; Rio Claro, Brazil).

2.3. Experimental Design

The experimental schedule is depicted in Figure 1. To conduct our study, 28 tilapias from the stock population (mean ± SD: standard length, 6.8 ± 0.6 cm; body mass, 10.5 ± 2.5 g) were captured and placed into individual net cages for an acclimation period of 7 days. Each net cage held one fish and had a total water volume of 27 L (total recipient volume was 28 L). After the acclimation period, the tilapias were randomly assigned to one of two experimental conditions (n = 14 each): (1) daily exposure to the CAS or (2) distilled water (vehicle control). Each tilapia was exposed to its respective chemical cue condition for 45 consecutive days. A volume of 5 mL of each chemical cue was injected daily onto the water surface of the cage. The cue dissolved in the cage water within a few seconds, and due to constant slow water renewal, the entire volume of water in each cage was replaced once within a 24 h period, preventing any accumulation of CAS, but allowing the exposure to the cue for hours.
During this 45-day experimental period, fish body mass and standard length were measured on days 0 (initial day), 15, 30, and 45. Additionally, fish were photographed on the first and last days for other morphometric measurements to assess changes in body form. Food ingestion was quantified every day throughout this period. Each fish was hand-fed once a day throughout the experiment with an amount of food totaling 3% of the fish’s biomass each day (same fish chow as described above). At each feeding, a known amount of food pellets was provided to each cage, and uneaten food was collected 15 min later. Thus, the daily food ingestion for each individual was calculated by the difference between the number of pellets before and after this procedure [32]. These measurements allowed us to calculate variables of growth and feeding performance, as described below.
Tilapia were tested in isolation from each other to exclude social effects on growth [33,34,35], as pilot observations indicated that grouped tilapia engaged in intense aggressive activities, leading to heterogeneous growth and unbalanced group sizes due to mortality.

2.4. Technical Procedures

2.4.1. Experimental Apparatus

The experimental apparatus (see Supplementary Figure S1) consisted of an open water flow system, devoid of recirculation, but continuously supplied with dechlorinated water at a standardized flow rate of 0.32 mL/s through a drip system, ensuring constant water renewal. This system comprised 28 independent containers, each with a total capacity of 28 L (27 L of total water volume). Each container had a central water outlet to maintain a consistent water level, facilitating gradual water renewal and the removal of excreta and chemical residues to prevent accumulation. The water outlet had a diameter of 20 mm and a height of 16.5 cm. This outlet was inserted into a larger pipe measuring 40 mm in diameter, with air stones (1 stone per cage) positioned within the gaps between them. These air stones were connected to an air pump via non-toxic silicone tubing to ensure constant water oxygenation. The water supplied to the system had no biological odors and was drawn from stock tanks with a capacity of 310 L, maintaining the same physical and chemical standards observed in the stock population tank (as described above). Throughout the experiment, the water temperature remained at 27.2 ± 1.3 °C, pH levels were maintained at 7.01 ± 0.05, and concentrations of nitrite and ammonia were both below 0.005 mg/L. The photoperiod was set from 06:00 to 18:00 h (12 h light:12 h dark), controlled by a timer. To minimize interaction between the fish and the investigator, the shelves of the experimental apparatus were partially covered with an opaque partition.

2.4.2. Conspecific Alarm Substance (CAS) Preparation

The CAS is operationally defined as conspecific skin extracts. Following the procedure outlined by Sanches et al. [17], which demonstrated significant acute biological responses to the CAS (stress responses and defensive behaviors) in Nile tilapia, we prepared the skin extracts as follows. Initially, donor tilapias were sourced from the same stock tank as the test fish and were humanely euthanized by swift severing of the spinal cord, avoiding the use of anesthetics to prevent chemical interference. The skin was carefully removed from both sides of the body using forceps and a scalpel and subsequently rinsed with distilled water to eliminate any traces of blood. Next, the skin fillets were promptly placed into 50 mL of distilled water and homogenized to facilitate the rupture of skin cells. The resulting homogenate was filtered through acrylic wool in a glass funnel to remove any remaining fragments. The final volume was adjusted with distilled water to achieve an approximate final concentration of 2.6 mm2 of skin per mL. The prepared extracts were then stored in 50 mL Falcon tubes and frozen at approximately −20 °C until required for experimentation.

2.4.3. Growth and Feeding Performance Calculations

To assess growth and feeding performance, we utilized both raw values of body mass, standard length, and food intake, as well as classic calculations based on established methodologies [36]. Specific growth rate (SGR) = 100 (lnWf − lnWi) ∆t−1, relative growth rate (RGR) = (Wf − Wi) Wi−1, condition factor (K) = 100 W L−3, percentage of weight gain ((Wf − Wi)/Wi)100, and food conversion efficiency (FCE) = 100 (Wf − Wi) I−1. Moreover, possible effects of CAS on tilapia’s weight–length relationship were evaluated by calculating the ‘b’ length exponent of the L-W equation (W = aLb or log W = log a + b log L) [37,38]. Abbreviations are as follows: ‘W’ is the fish weight (g), with ‘Wf’ being the final and ‘Wi’ the initial weight, ‘L’ is the standard length (cm), ‘I’ is the total dry food consumed (g), and ‘T’ is the time interval (days).

2.4.4. Body Axes

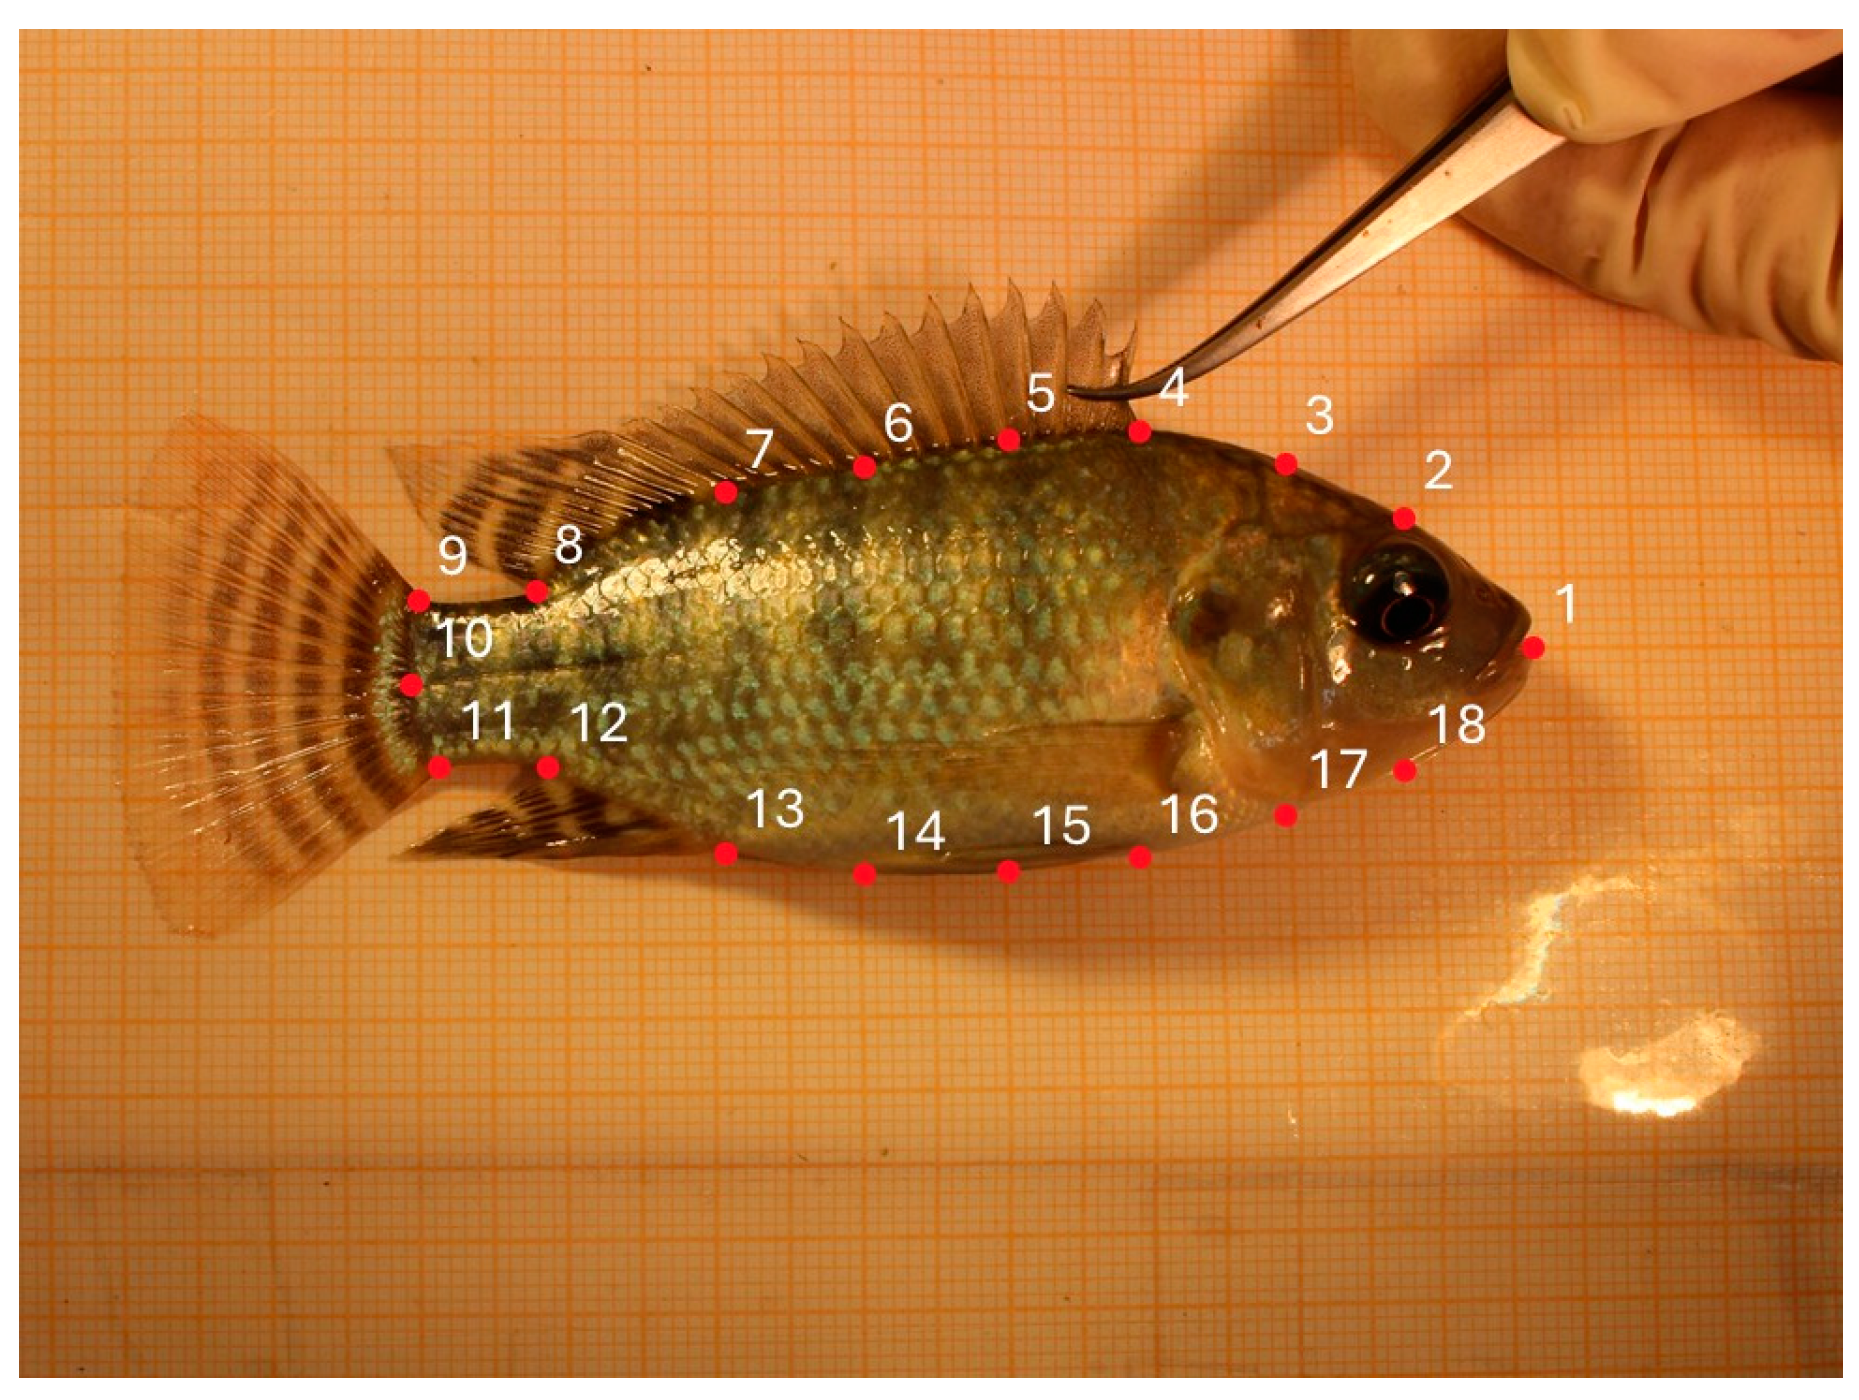
The landmark-based analyses were conducted using TpsUtil v. 1.68 [39] to organize the files, which were then imported into TpsDig2 [40] for landmark placement and coordinate extraction. A total of 18 landmarks were positioned along the animal’s perimeter (Figure 2), following the methodology adapted from Mojeku and Anumudu [41].
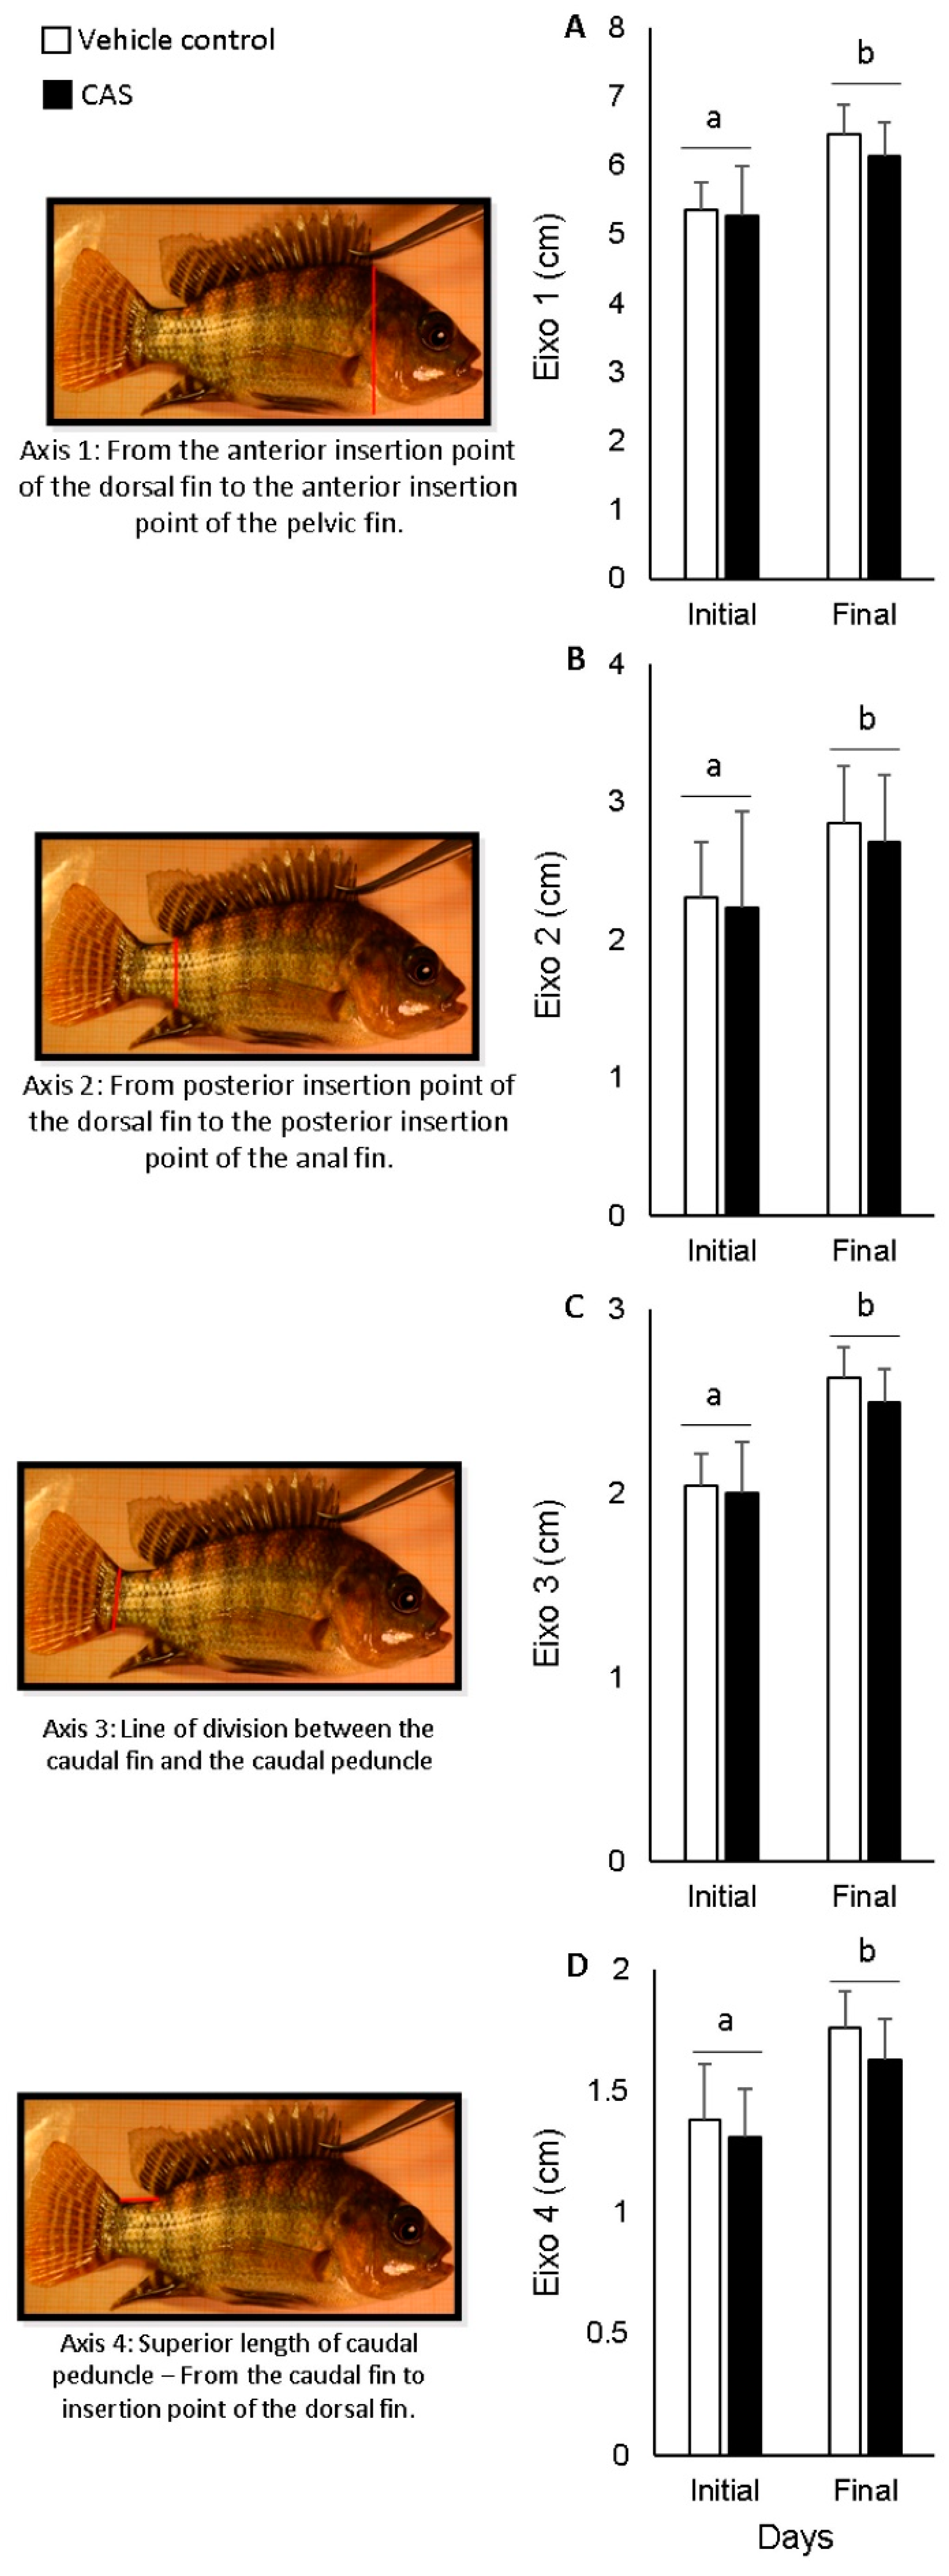
Based on the same procedure described for landmark-based analysis, we elected some body axes with assumed special meaning and conducted linear morphometrics of these specific axes. Axis 1 corresponds to the fish′s height, while the remaining three axes indirectly indicate the size of the caudal musculature. These axes were selected due to their potential advantages for tilapia prey in evading predators. Axis 1 reflects that a taller fish might be more challenging to swallow [27], while axes 2 to 4 relate to the ability of a fish with larger caudal musculature to escape rapidly during evasion maneuvers (e.g., burst swimming [42]).
Images used for linear and geometrical morphometric analyses were captured using a professional camera mounted on a tripod positioned directly above the specimen in a mini-studio setup to minimize external lighting interferences. The distance between the camera lens and the fish (30 cm), zoom level, and animal positioning were standardized for all photographs. Additionally, in each image, the animals were consistently positioned to the right on a graph board.

2.5. Statistical Analyses

The data were analyzed using a mixed ANOVA (one between-subjects categorical predictor and one within-subjects factor (repeated measures)). The independent variable (categorical predictor) was the chemical cue (CAS or vehicle), with the comparisons over time serving as the repeated measures. The Newman–Keuls test was employed, when necessary, as a post hoc test. For conducting this ANOVA, raw values of the variables were utilized, except for the condition factor values, which underwent arcsine transformation to improve normality and homoscedasticity. In the case of body mass, we identified an initial asymmetry in fish size. Fish were randomly selected to form each experimental group (vehicle or CAS). While random group assignments are desirable, they do not entirely eliminate the possibility of the observed asymmetry. Although not significantly different, the initial mass of the control group fish at day 0 was slightly higher. Thus, before conducting the ANOVA, we checked the effect of initial body mass on subsequent measurements of this variable over time. To do so, we performed a generalized estimating equations (GEE) analysis [43]. In the GEE model, initial body mass (day 0) was considered a covariate and was removed as a mass time point to avoid collinearity. Consequently, the initial body mass parameter was represented by the measurement on the 15th day and was not analyzed in isolation from the other time points (30th and 45th days) in the model. Moreover, we analyzed body mass in terms of percentage of weight gain by using an unpaired Student’s t-test. For body axes analysis, the extracted coordinates were normalized and subjected to a Procrustes analysis to remove the effects of translation, rotation, and scale. Subsequently, principal component analysis (PCA) was performed to identify the main axes of shape variation, with principal components 1 and 2 (PC1 and PC2) being the most relevant. To assess the influence of the time (first day or last day) and treatment (CAS or vehicle) on shape variation, a two-way ANOVA was conducted using the principal component scores. Statistical differences were considered significant when p < 0.05.

3. Results

The GEE showed that initial body mass was a factor that had significant effects (Wald = 107.1, p < 0.0001). These effects represent its interaction with time (30th day: Wald = 61.9, p < 0.0001; 45th day: Wald = 221.7, p < 0.0001). The GEE model revealed no interaction between initial body mass and CAS (Wald = 0.64, p = 0.43). Additionally, no interaction was found between initial body mass, time, and CAS together (30th day: Wald = 0.2, p = 0.66; 45th day: Wald = 0.5, p = 0.48). The GEE model indicated that fish grew over time, and the heavier a fish was at the beginning of the experiment, the heavier it tended to be at the end, with no effect of the CAS.
Considering ANOVA results, both body mass (Figure 3A) and length (Figure 3B) increased over time, but there were no discernible isolated effects of the CAS or interactions between the CAS and time. Regarding the condition factor (Figure 3C), we did not observe any effects of the CAS, nor did we detect fluctuations over time. Furthermore, there was no interaction between the CAS and time—the condition factor remained constant throughout the experiment. The weight gain was also undistinguishable between control and CAS conditions (unpaired Student’s t-test—Figure 3D). Considering the relationship between weight and length, animals from both conditions displayed a profile of negative allometric growth (vehicle b = 2.91; CAS b = 2.68), as indicated by calculated ‘b’ values < 3. Consequently, these ‘b’ values suggested that CAS did not influence the weight–length relationship.
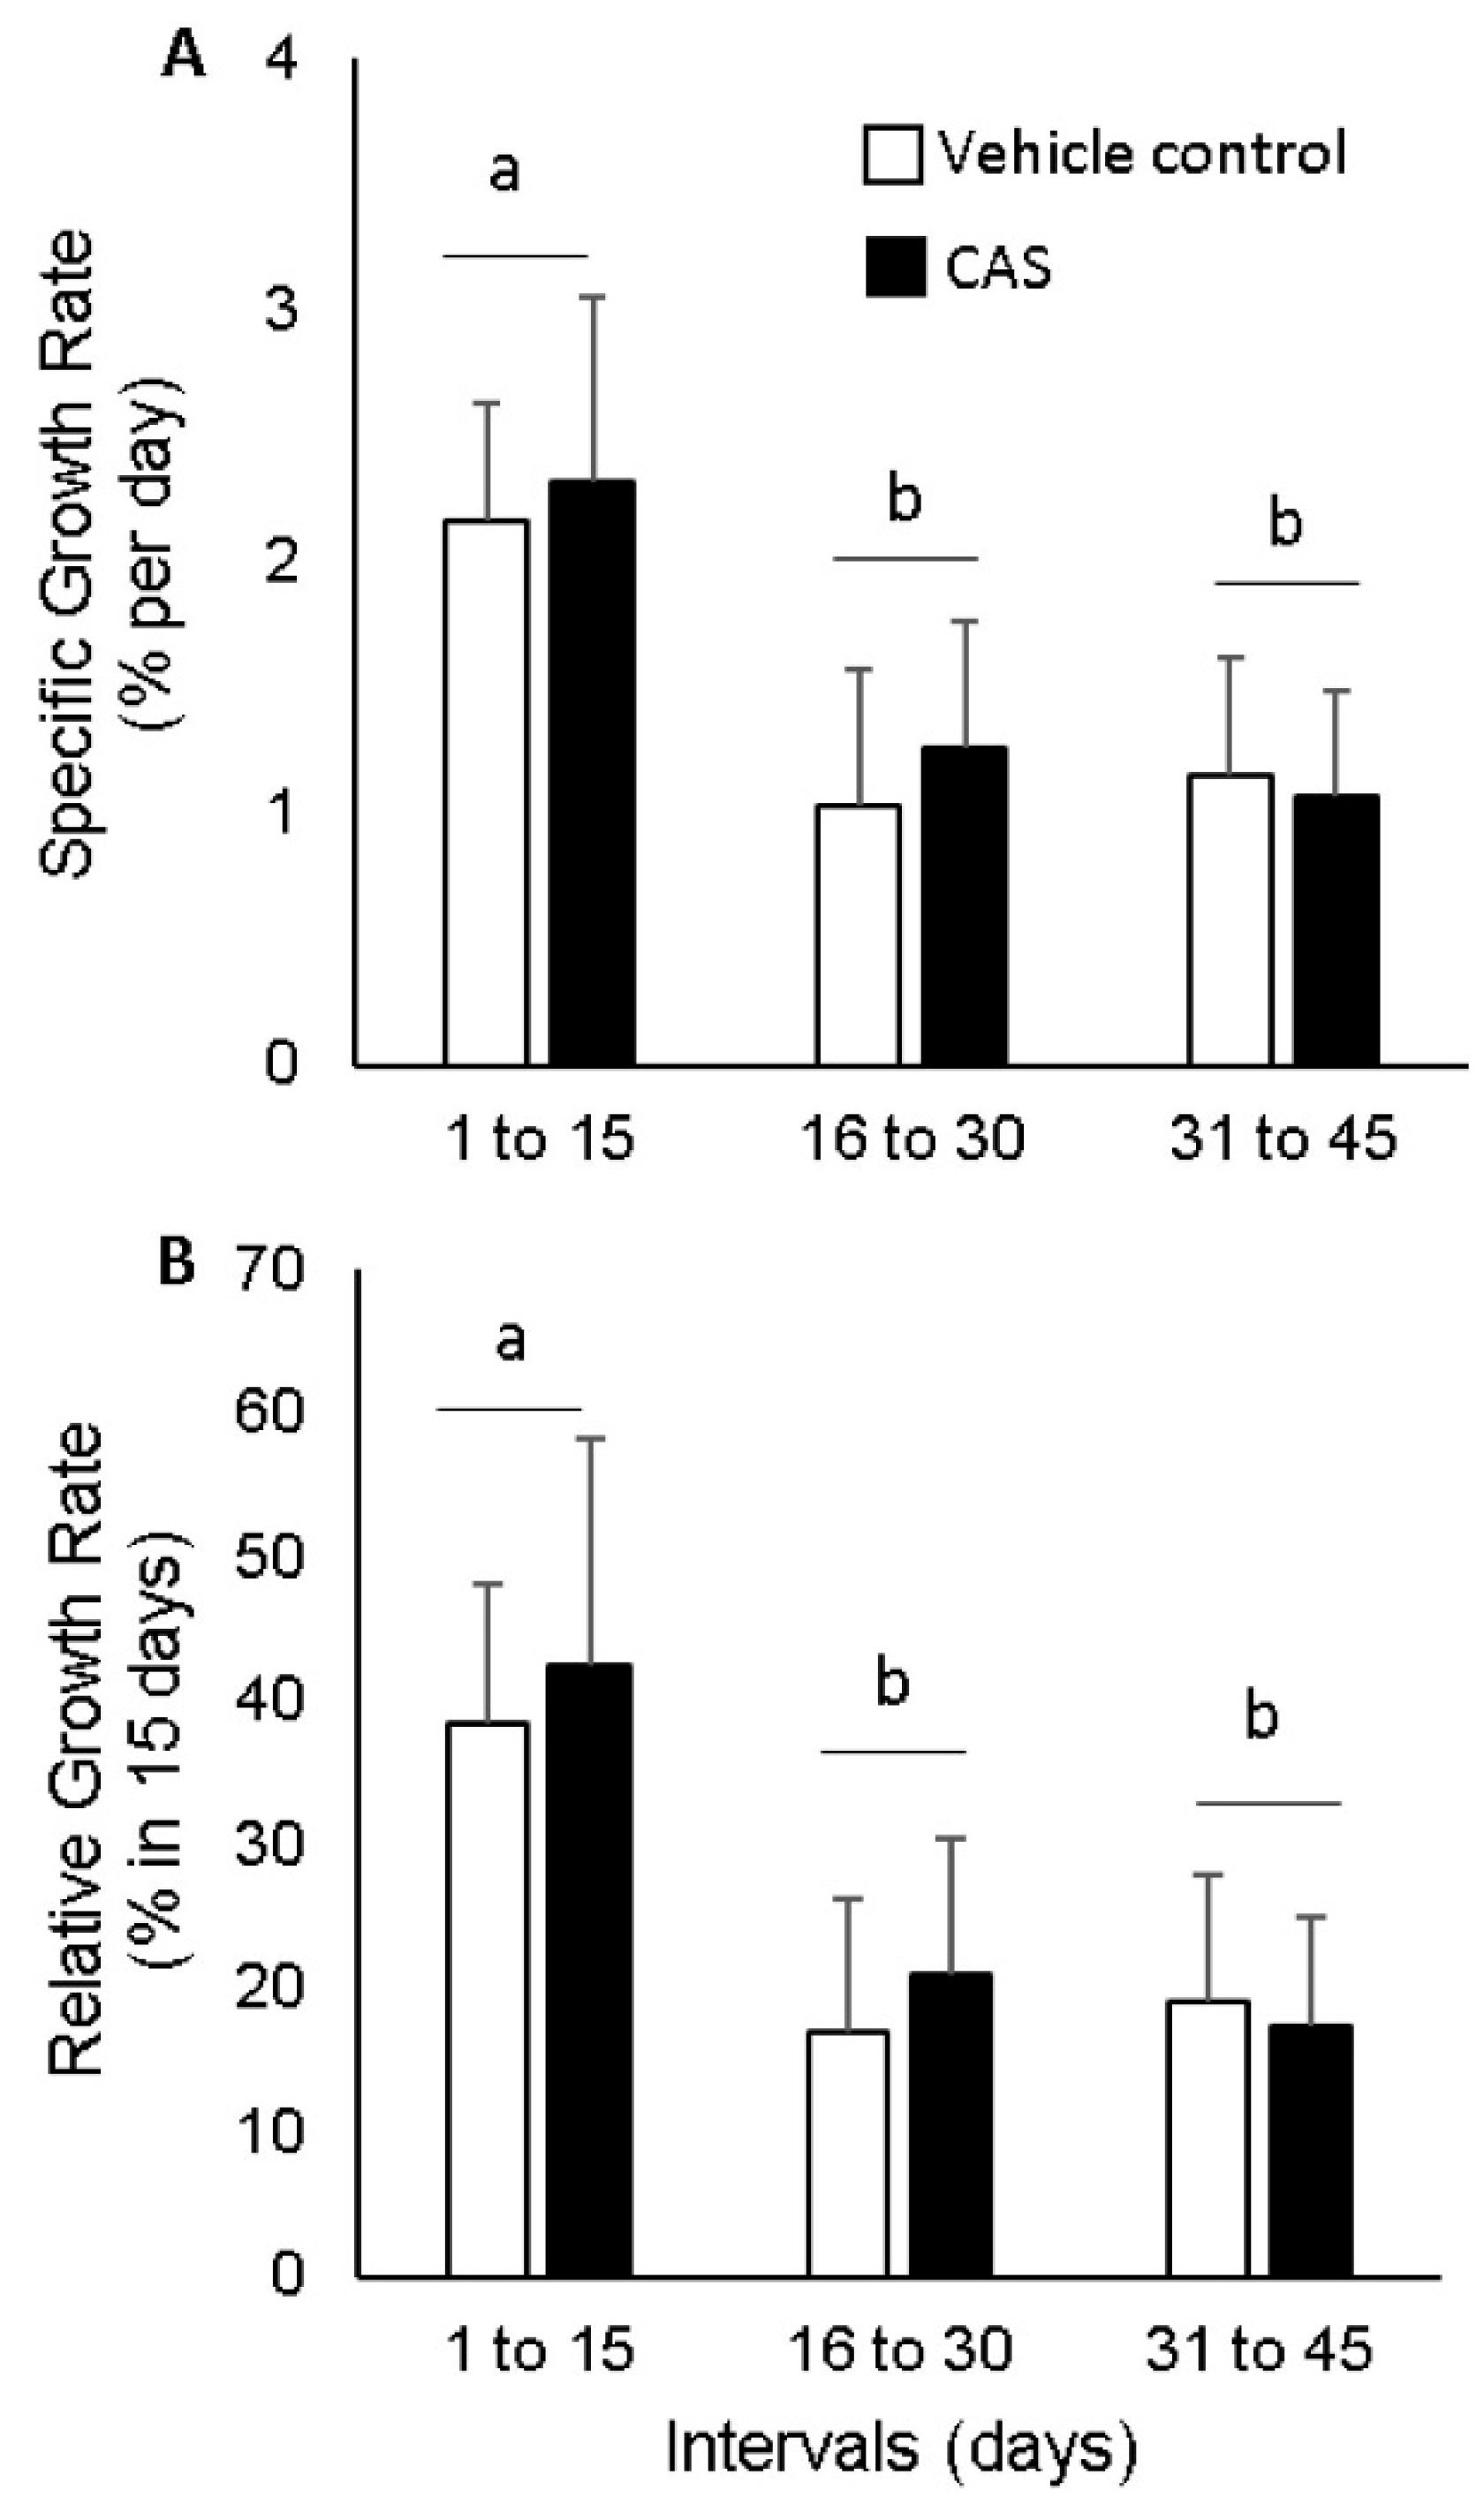
Both the specific growth rate (SGR; Figure 4A) and the relative growth rate (RGR; Figure 4B) exhibited similar profiles. Both the SGR and RGR decreased from the first to the second fortnight, maintaining this level during the third fortnight. These variables were unaffected by the CAS, and no interaction between the CAS and time was observed.
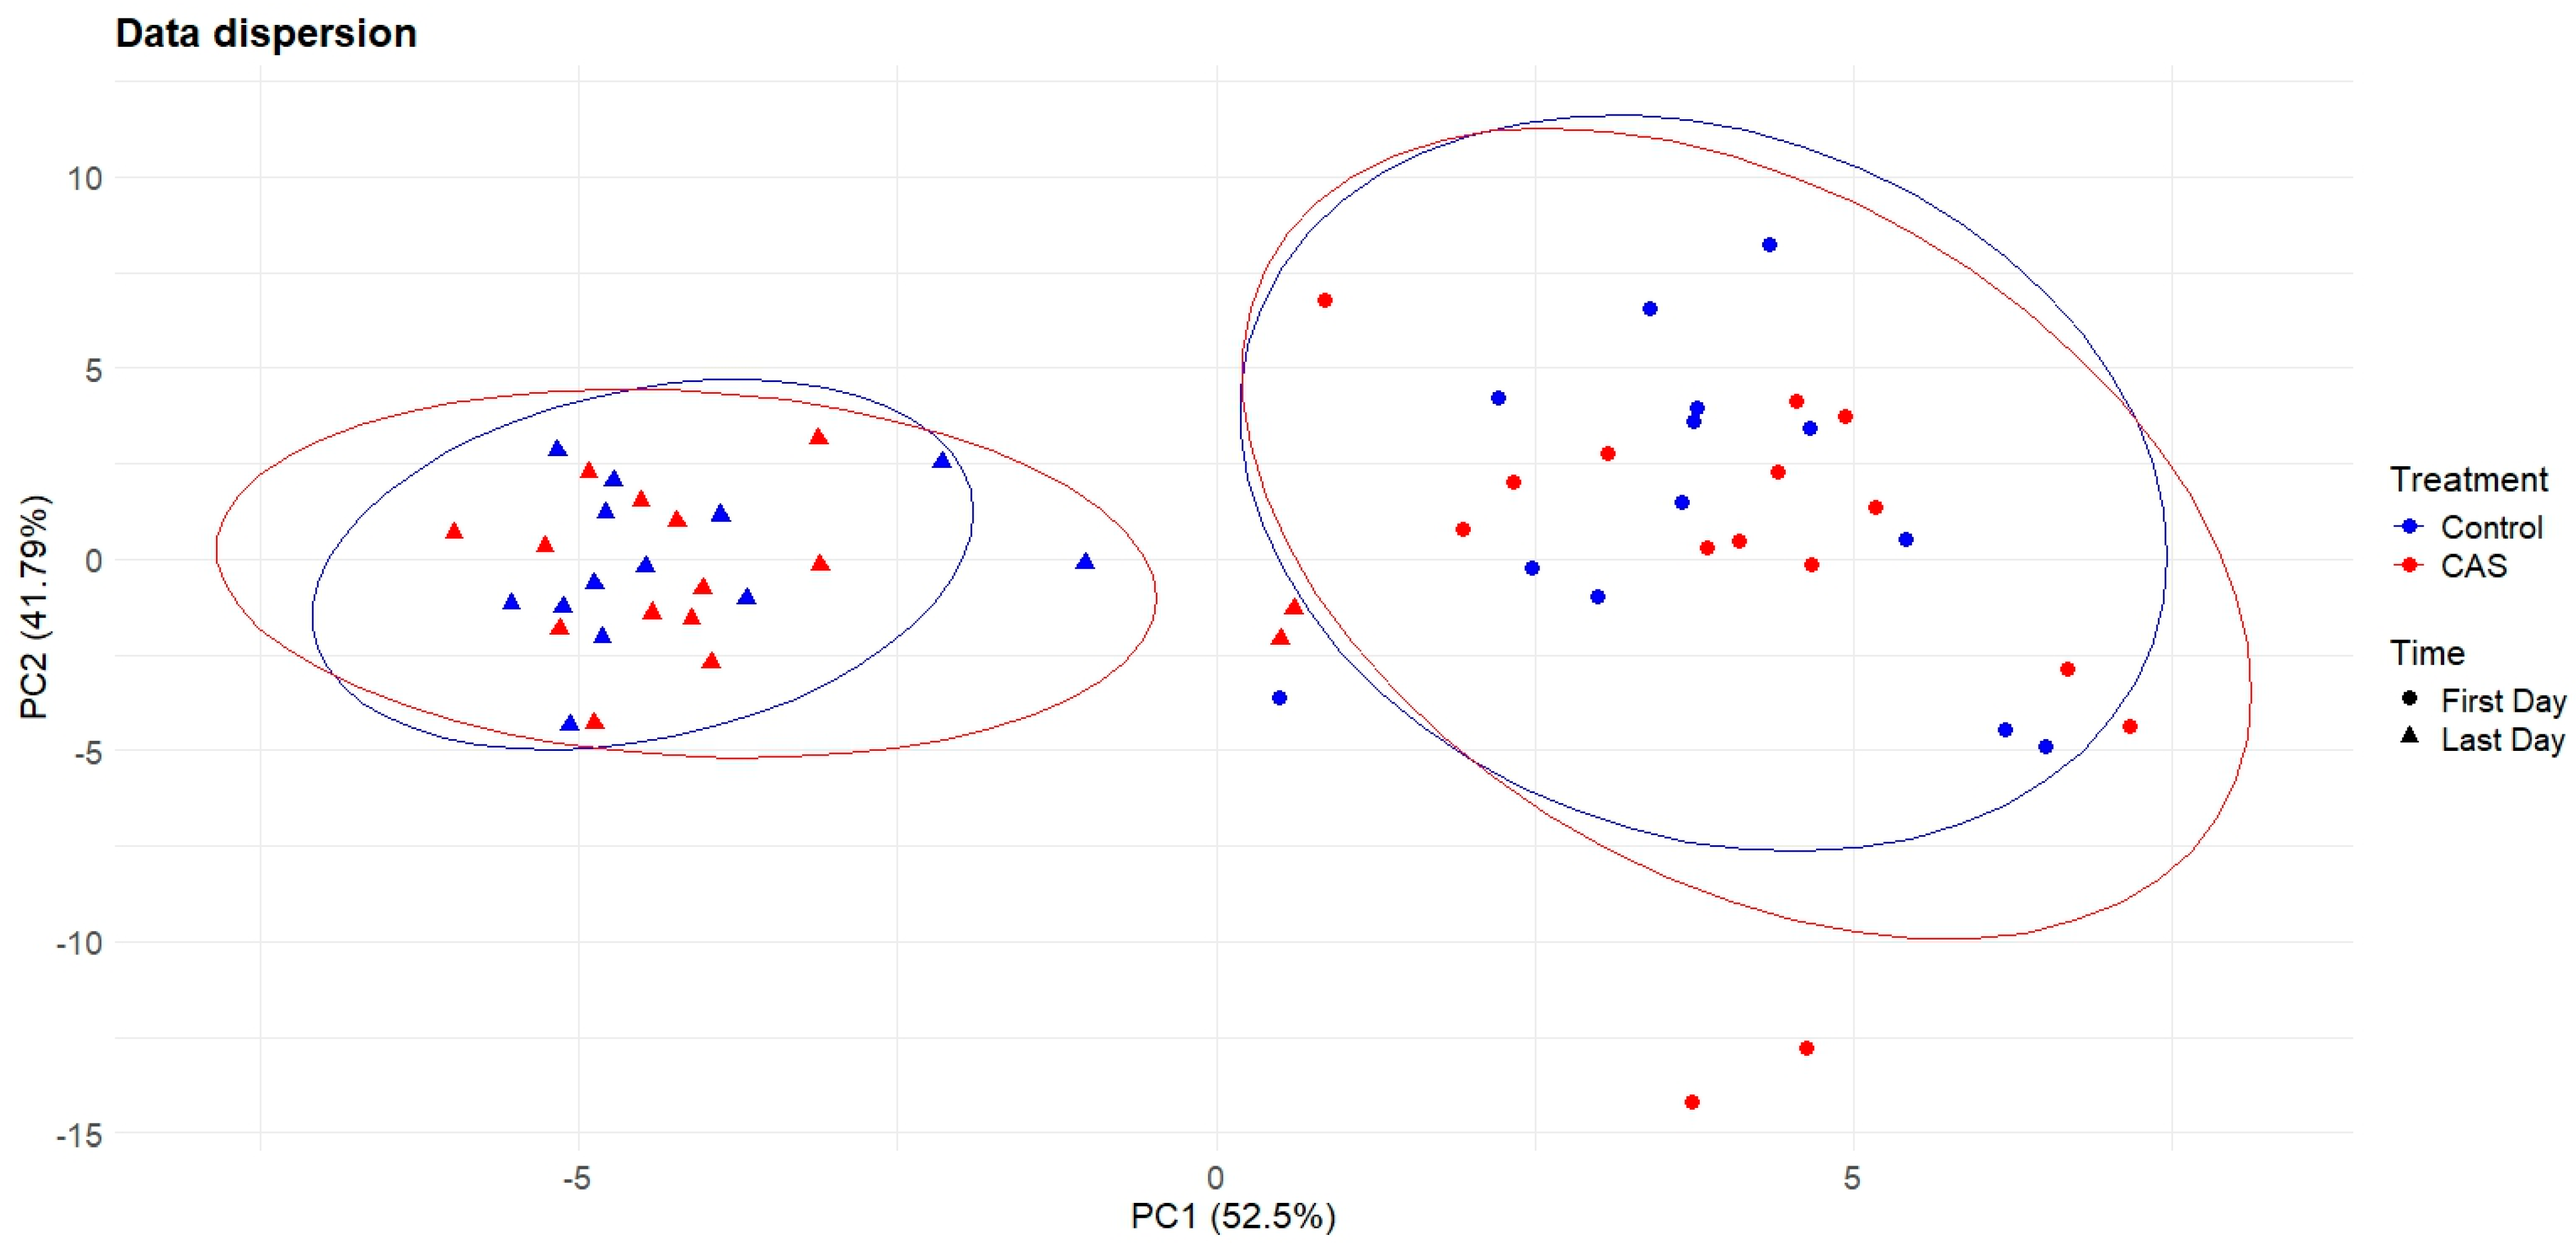
Principal component analysis (PCA) revealed variation in shape among individuals across treatments and sampling times (Figure 5). The first principal component (PC1) accounted for 52.5% of the total variance, while the second principal component (PC2) explained 41.79%. The ellipses represent 95% confidence intervals for each combination of treatment and sampling time. Notably, the ellipses corresponding to the two treatments largely overlapped, indicating no separation between them. However, a clearer distinction was observed between the two sampling times, as the ellipses for the first and last days were more separated along the PC1 axis. This suggested that the primary source of variation in shape was associated with PC1 and time rather than with treatment and PC2.
The ANOVA results for PC1 and PC2 showed a significant effect of time for PC1, while no significant effects were found for the CAS or for the interaction between the CAS and time (Figure 6). This indicated shape variation between the first and last days, regardless of treatment. Additionally, no statistical differences were detected for PC2 in any case (Figure 7).
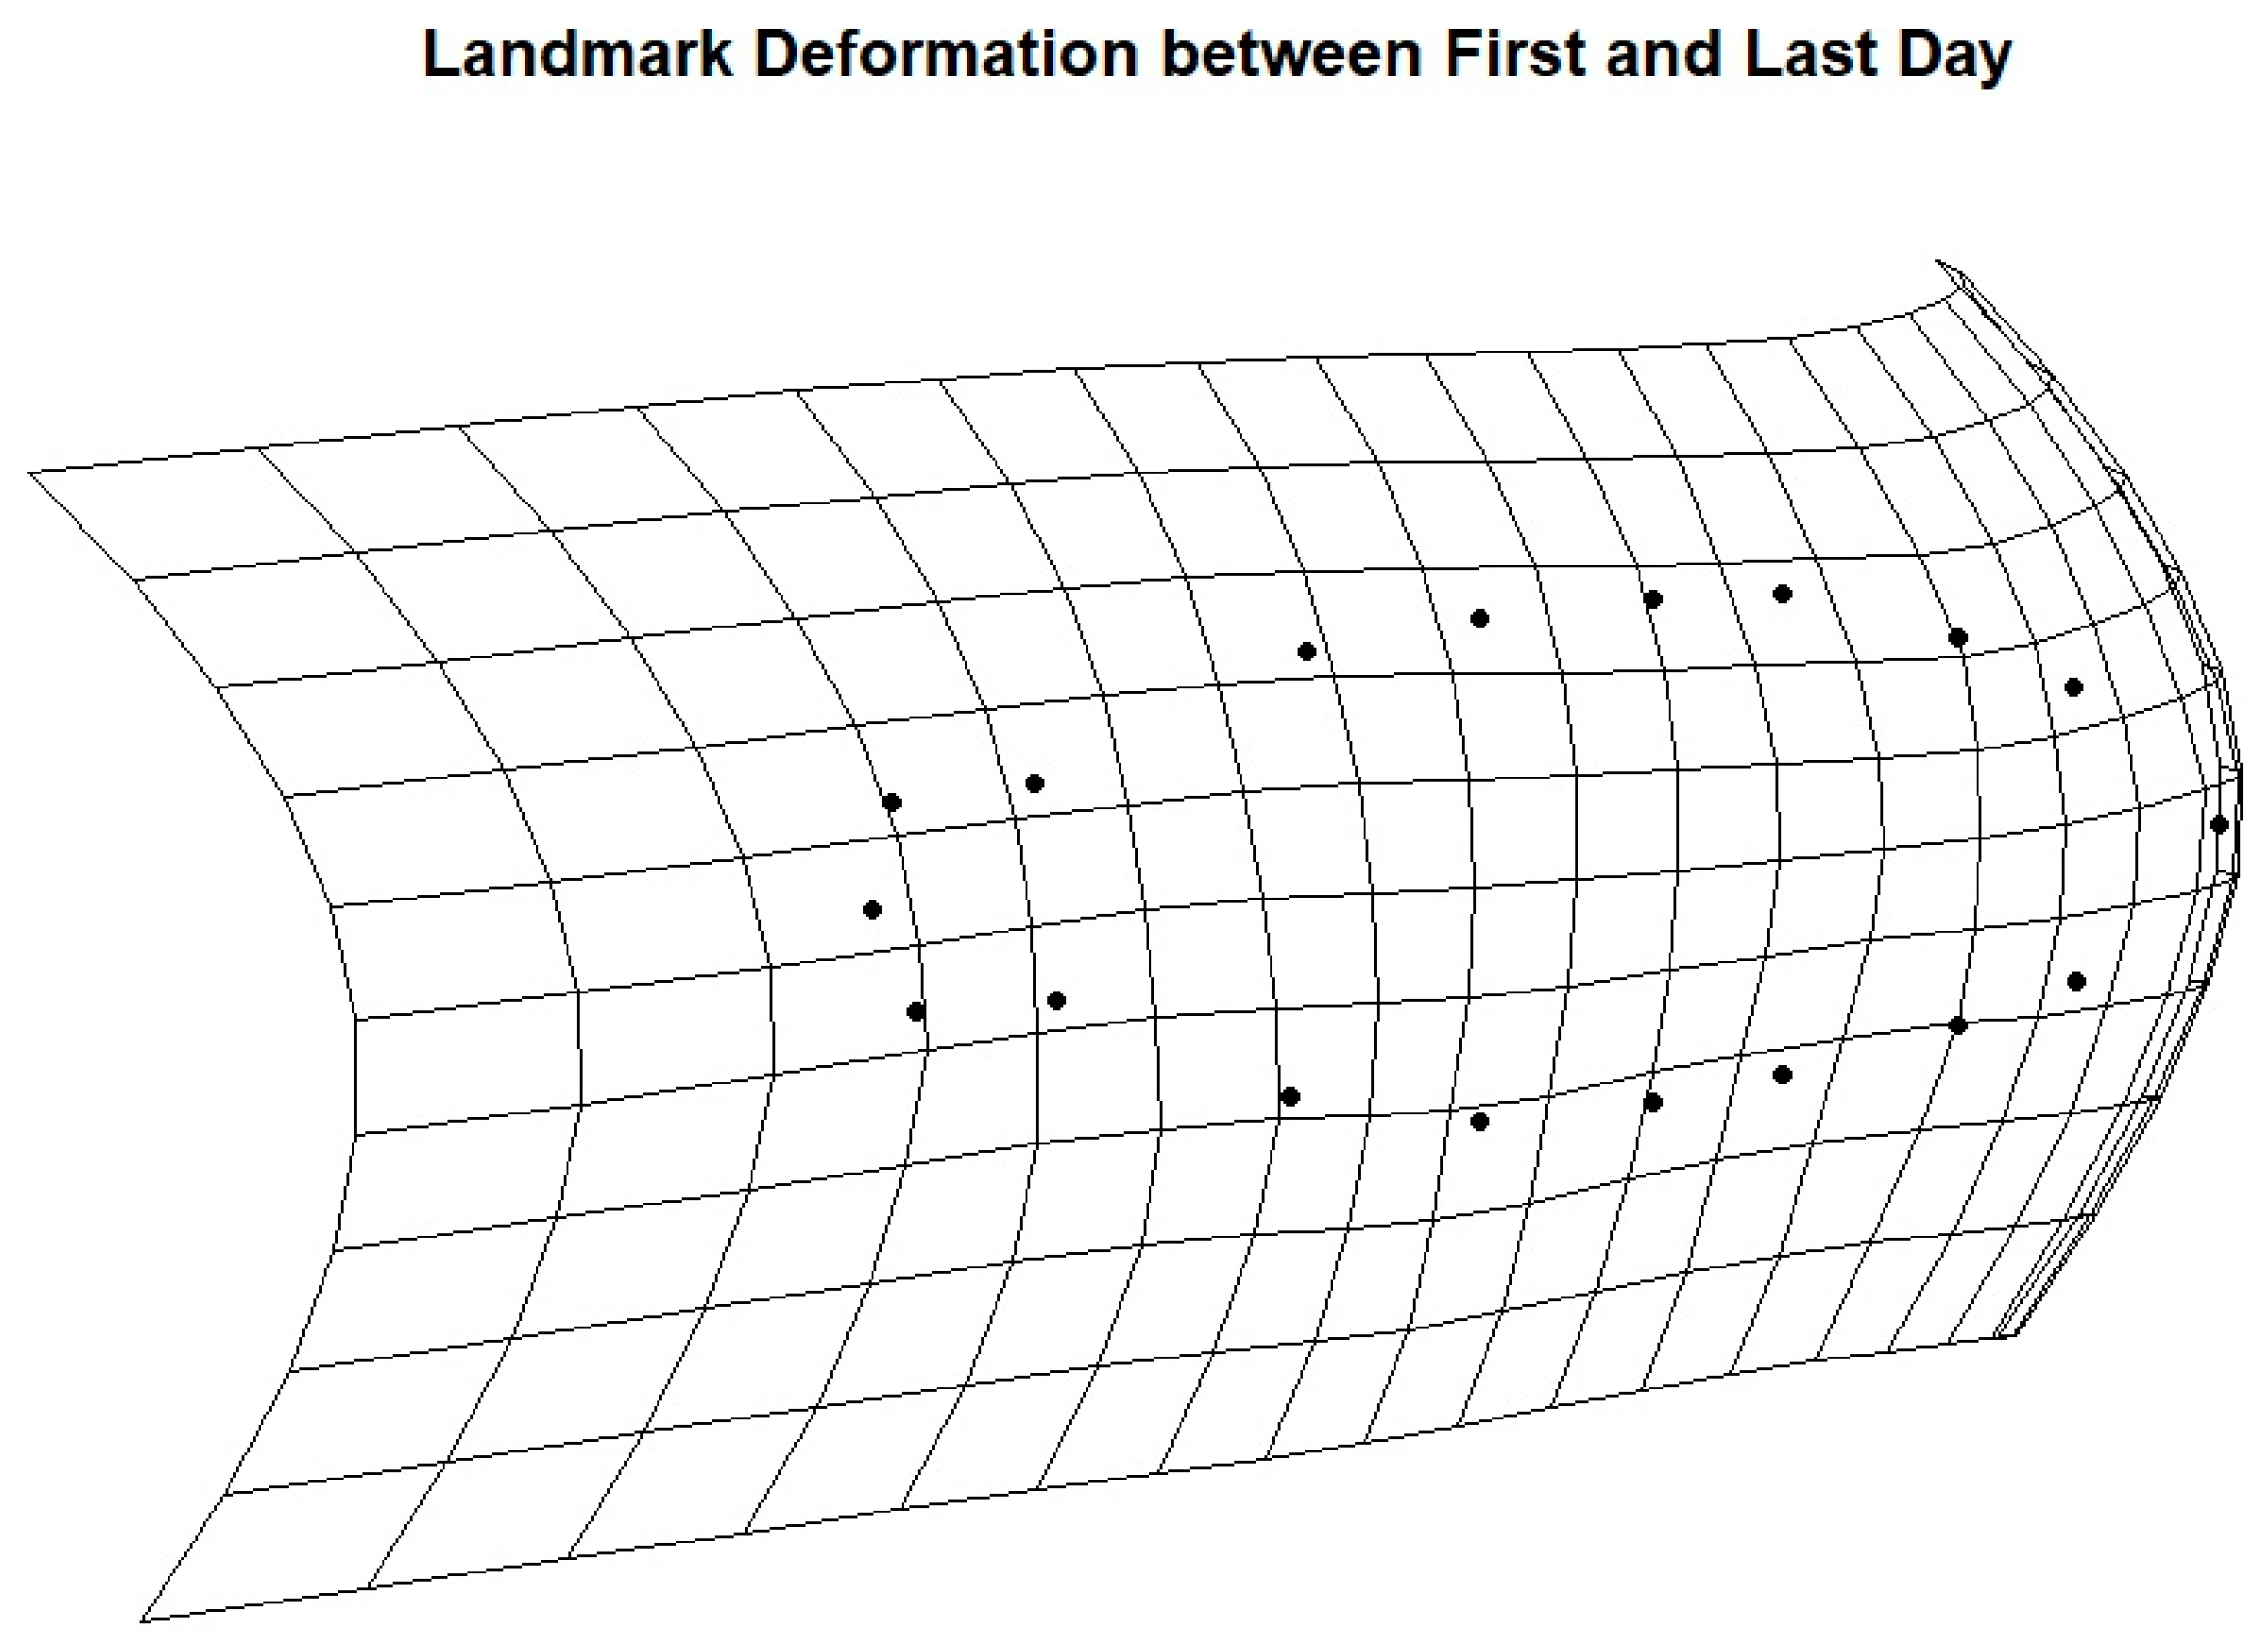
Landmarks’ deformation between the first and last sampling days are illustrated in Figure 8. The mesh deformation revealed a rightward displacement of the landmarks, suggesting a morphological change over time, due to animal growth. This deformation was primarily explained by PC1, which captured significant temporal changes in landmark positioning and reflected horizontal displacement effects.
In addition to the previous measurements, we analyzed morphological axes to assess changes in body shape resulting from CAS exposure (Figure 9A–D). We did not observe significant effects of this chemical cue on the quantified axes. Furthermore, the chemical cue did not interact with time in relation to these axes. However, all axes increased over time, indicating that they followed a pattern of linear growth.
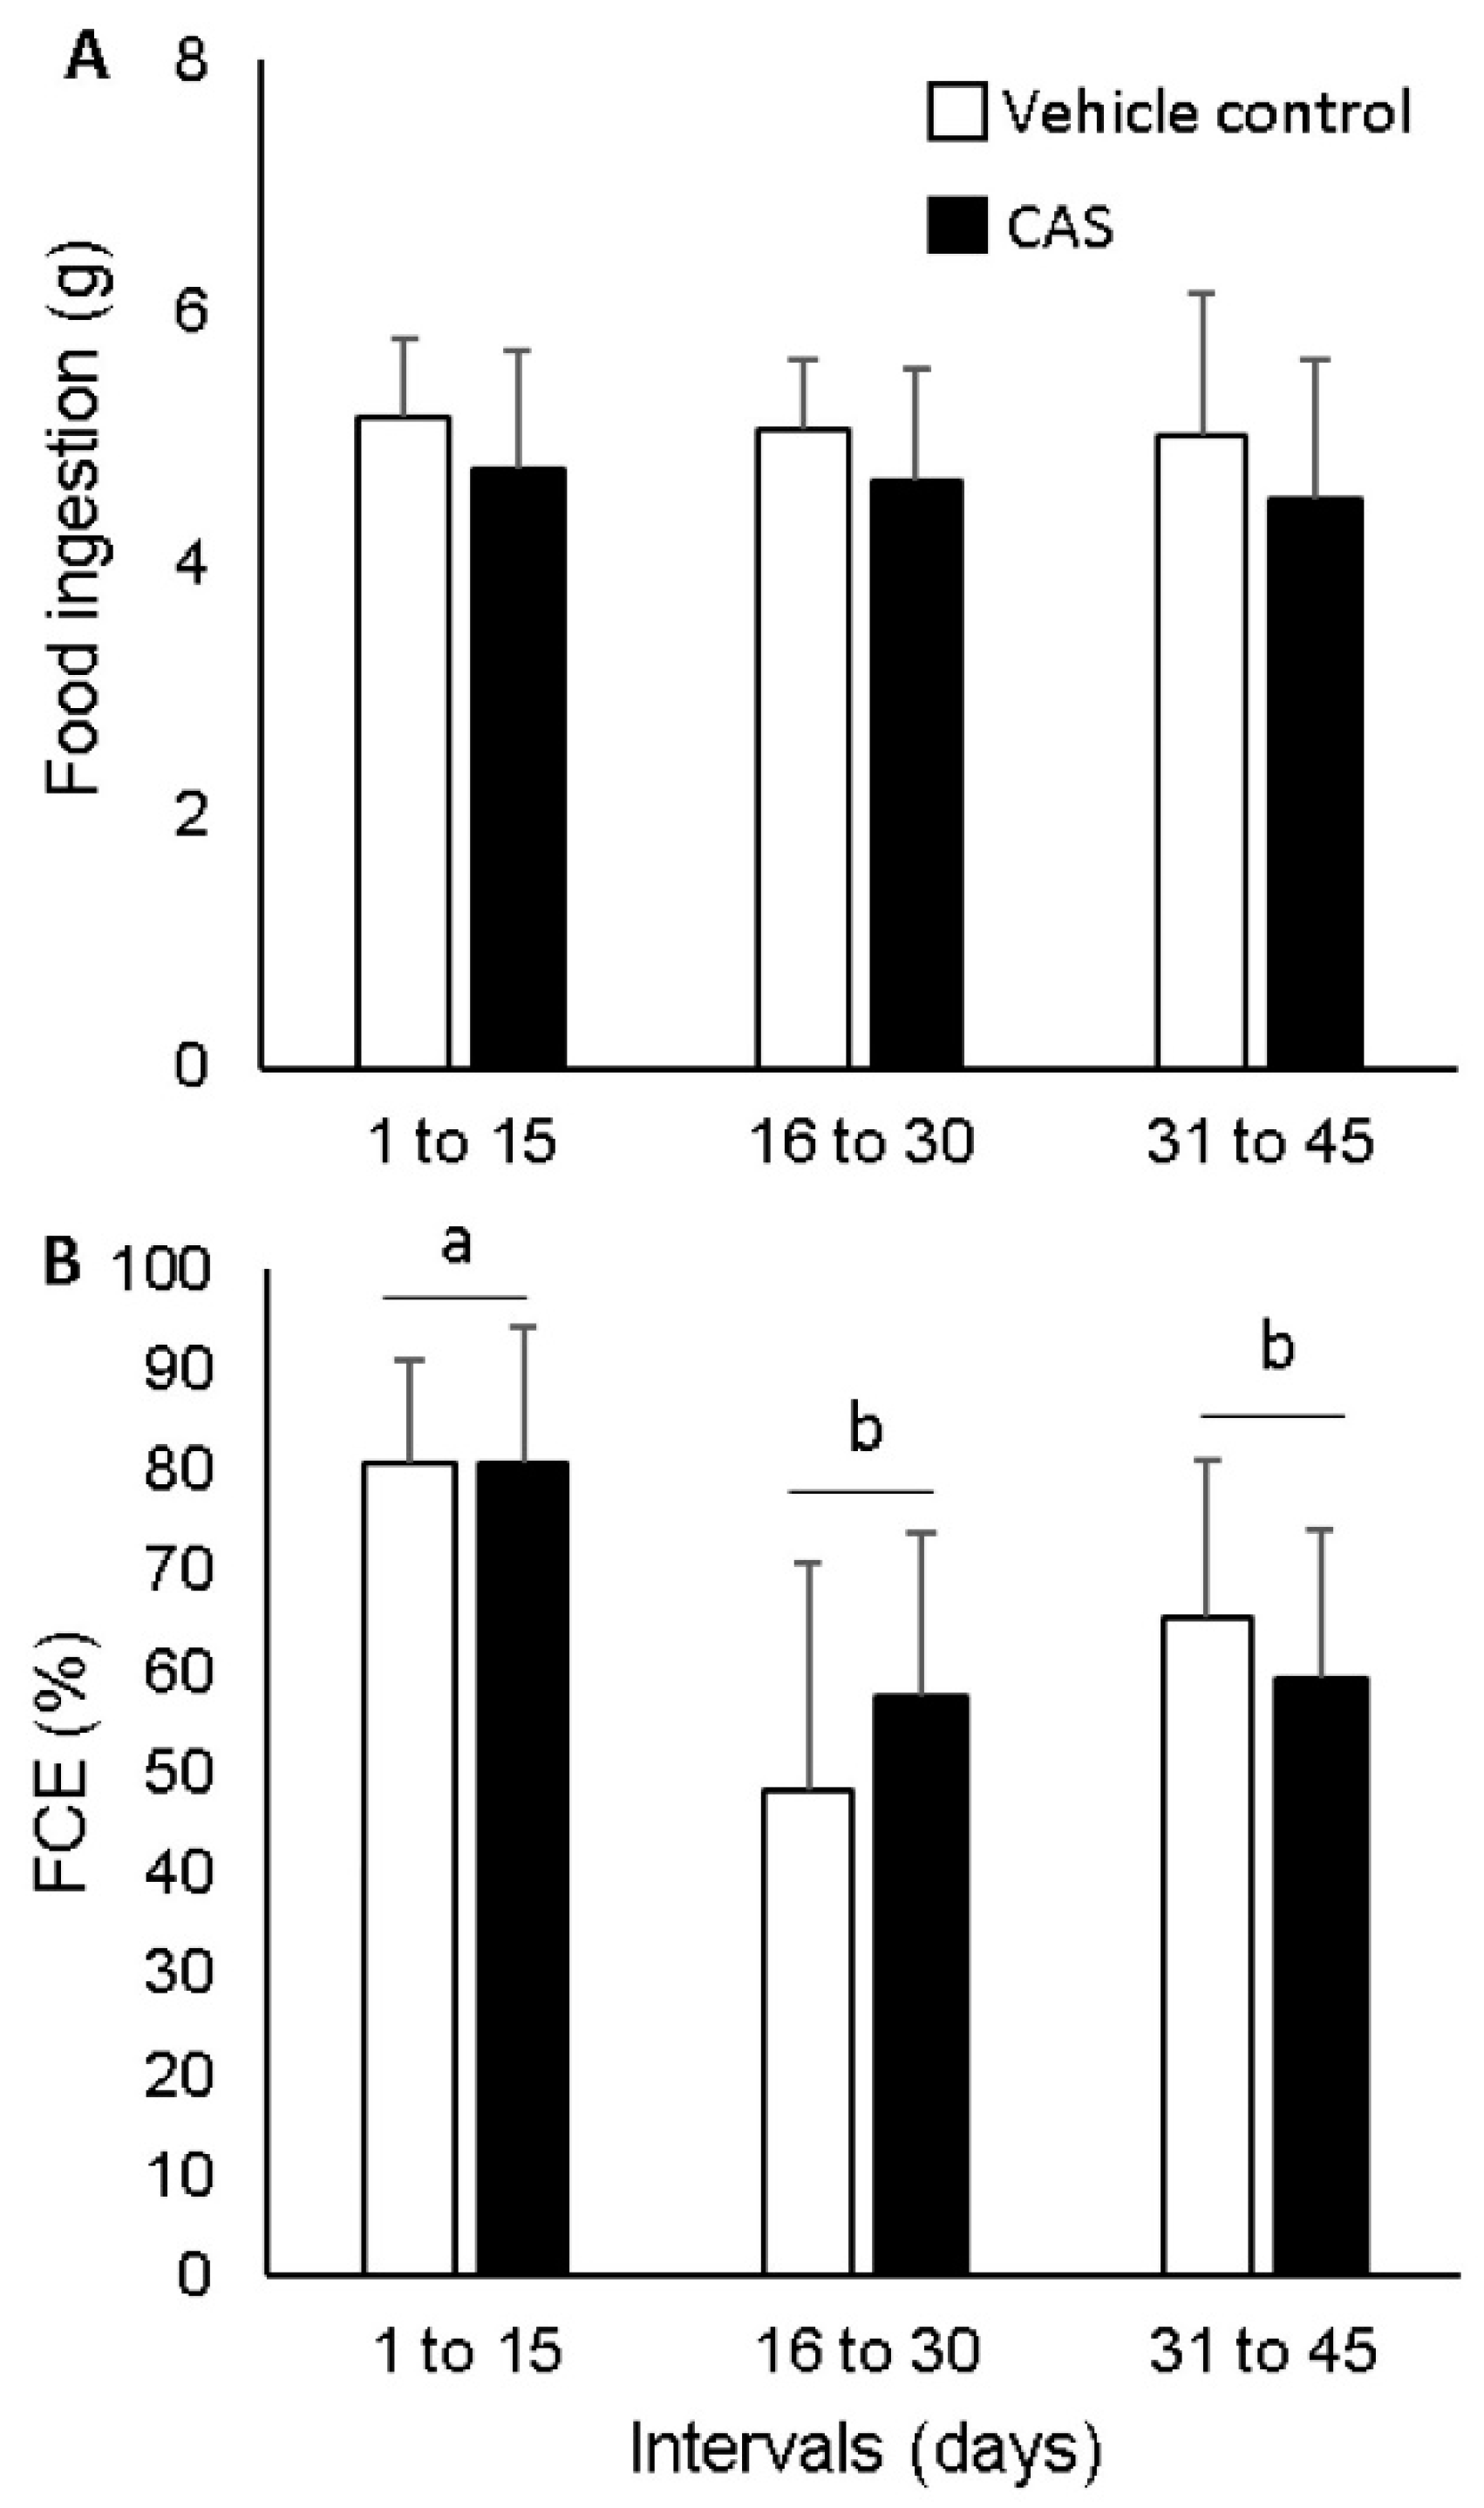
Food intake (Figure 10A) remained unaffected by either the CAS or time, with no interaction observed between these factors, indicating stability in food intake. However, feed conversion efficiency (Figure 10B) decreased over time, without any isolated effect of the CAS or interaction of the CAS with time. Specifically, feed conversion efficiency decreased from the first to the second and third fortnights.

4. Discussion

In this study, we demonstrated that chronic exposure to a conspecific alarm substance (CAS) does not alter feeding performance and growth in Nile tilapia. As previously documented in acute exposure, the CAS induces defensive and stress responses in this species [11,17]. However, as observed in the present study, no changes related to development occurred when the exposure was chronic. This overall conclusion stems from the fact that tilapia exposed to both the CAS and distilled water (the CAS vehicle) increased their body mass and length similarly over time and exhibited a negative allometric weight–length relationship. Furthermore, specific and relative growth rates, condition factor, and body morphology were not affected by the CAS over time. The CAS did not alter food intake and feed conversion efficiency, which would impact growth and development, given the obvious association between these variables. These findings indicate that CAS did not act as a chronic stressor for Nile tilapia.
Growth was initially assessed using raw variables: body mass and standard length. In this context, considering the control values, we observed significant gains in both mass and length over time, including percentage of weight gain. These findings align with previous studies conducted on this species in laboratory and field conditions [32,44,45,46,47], indicating that the conditions of this study were conducive to animal development. Given this, as there was no significant difference between these control values and those obtained from animals chronically exposed to the CAS, we conclude that this chemical cue did not affect tilapia growth. The CAS acts as an acute stressor in Nile tilapia [11,17]. Fish under stress conditions may experience decreased growth, which is a typical response [34,48,49]. The absence of differences between the experimental conditions of the present study for mass and standard-length gain suggests that the CAS did not act as a chronic stressor, as growth/body mass depletion is an indicator of chronic stress in fish [49]. In this line, CAS also did not affect development, because body morphology was not affected by this chemical cue.
In addition to the raw values of body mass gain, estimates of growth were made using classic predictive formulas [36], from which we calculated the specific growth rate (SGR) and relative growth rate (RGR). In this study, our assessment lasted for 45 days, and these variables were estimated biweekly (3 fortnights in total). All estimates indicated SGR and RGR values suitable for Nile tilapia, consistent with previous evidence [44,46]. The trend of these variables was to decrease over time for both conditions (CAS and control), which is considered typical. That is, the capacity for mass gain diminished over time, resulting in this response profile [44,46]. In the case of fasting stress, for example, these variables increased; however, this represents a situation of compensatory growth [50], which is different from this study where the fish were continuously fed. Thus, the decrease in mass gain capacity is in line with expectations, and chronic exposure to the CAS did not modulate this response profile, reinforcing the absence of a chronic stressful effect of the CAS on tilapia.
The relationship between body mass and standard length was collectively assessed by estimating the condition factor (K) and the weight–length relationship [37,38]. The condition factor remained unchanged over time, maintaining values slightly above 3%, which indicates a good overall state of the animals and a favorable context for well-being (K > 1.0) [51]. Regarding the weight–length relationship, animals from both conditions exhibited a profile of negative allometric growth, with ‘b’ values of 2.91 and 2.68 for the control and CAS, respectively (if b < 3, the growth profile is negative allometric) [37,38]. A ‘b’ value of 3 is considered isometric, where there is complete congruence between mass gain and length increase. However, in general, values fluctuate around 3, within the theoretical range of 2.5 to 3.5 among species and within the same species depending on variations in environmental conditions [38]. For tilapia, values between 2.23 and 3.65 have been reported [52]. In this study, the values fell within the expected range and were not altered by the experimental conditions, indicating that the CAS did not affect the weight–length relationship.
We observed earlier that the CAS did not interfere with growth. However, similar growth rates do not necessarily indicate similar feeding behavior. An animal may maintain its growth rate but require greater food intake to maintain similar feed conversion into body mass, as it needs to cope with a stressful situation while also mobilizing energy and nutrients for growth. Along these lines, tilapia exposed to red monochromatic light exhibit increased food intake, but this additional intake does not result in greater growth compared to other colors (blue, green, and yellow) and the full spectrum (white) [32]. In the present study, both food intake and feed conversion did not differ between the CAS-exposed and control groups. We only observed a decrease in the ability to convert ingested mass into body mass gain, which was similar between the conditions, likely due to other physiological demands. Stress in fish typically reduces appetite (motivation to eat), thus affecting food intake [53,54]. Acutely, the CAS acts as a stressor, reducing motivation and food intake temporarily [55]. However, in our study, appetite was not affected, reinforcing the non-stressful chronic nature of the CAS for tilapia, consistent with our earlier findings regarding growth reported herein.
The growth and feeding performance responses indicate that the CAS did not affect them. Thus, we conclude that the CAS does not act chronically as a stressor, as impaired growth [49] and feeding [53] performances suggest a chronically unfavorable context. One possible explanation for this is that repeated exposure to the potentially stressful stimulus (the CAS) resulted in habituation. Although previous studies have shown that the CAS is an acute stressor for tilapia [11,17], and fish can show cumulative responses to repeated stressors [56,57], we did not observe such a consequence of chronic exposure to the CAS in this study. In this regard, rainbow trout juveniles were subjected to brief handling once a day for 10 weeks; at the end of this period, the response to acute handling was measured, and the plasma cortisol response was approximately half of that observed in continuously unexposed fish [58]. These authors interpreted these findings as a desensitization of the HPI axis to repeated disturbances: habituation. Thus, it is plausible to assume such a possibility here.
In the applied instance, although more studies are needed, we speculate that it is positive because repeated exposure of tilapia for a long period to the CAS did not provoke a cumulative effect that reduced tilapia feeding and growth. Such variables are crucial for aquaculture, as they could decrease productivity if the predation risk indicated by the CAS negatively affected growth and feeding over time. Although our research was conducted in laboratory-scale net cages, we speculate that the CAS could not exert a significant stressful effect on Nile tilapia performance on larger scales and, hence, in real-life situations. However, this possibility should be tested in future studies.
Our study used a sample size of 14, which we considered adequate to detect biologically relevant effects within the controlled experimental conditions established [17]. Furthermore, the statistical tests applied were appropriate for assessing the presence of a CAS effect on tilapia growth and physical condition. The p-values close to 0.05, together with data analysis, indicated that the absence of a significant effect was not due to a limitation in statistical power—in other words, it did not constitute a Type II error—but rather to the lack of a biologically relevant difference within the analyzed context. Moreover, we emphasize that, even with an increased sample size, the observed patterns would likely remain consistent due to the inherent characteristics of the data.

5. Conclusions

Our findings indicate that chronic exposure to the conspecific alarm substance does not impact the feeding, growth performance, or development of Nile tilapia. This suggests that this chemical cue does not function as a chronic stressor in this species and that the CAS would likely be a stimulus that does not affect tilapia in aquaculture settings.

Supplementary Materials

The following supporting information can be downloaded at: https://www.mdpi.com/article/10.3390/fishes10040174/s1, Figure S1: Experimental apparatus.

Author Contributions

Conceptualized the methodology, R.E.B., R.T.P., C.A.M. and A.L.A.; idealized and built the experimental apparatus, C.A.M., R.T.P. and A.L.A.; collected the data, R.T.P., A.L.A. and A.R.S.; project administration and funding acquisition, R.E.B.; data analyses—initial analyses, R.E.B. and A.L.A.; writing the first draft of the manuscript, R.E.B. All authors reviewed data analyses and the manuscript to reach the final version. All authors have read and agreed to the published version of the manuscript.

Funding

The present study received financial support from the Fundação de Amparo à Pesquisa do Estado de São Paulo—FAPESP, Brazil (research grant 2016/19518-8). R.E.B. (process number 304288/2021-7), P.C.G. (process number 316528/2021-8), and L.J.G.B. (process number 302167/2022-6) were recipients of a research productivity grant from CNPq (Conselho Nacional de Desenvolvimento Científico e Tecnológico).

Institutional Review Board Statement

This study agreed with Brazilian legislation regulated by the National Council for the Control of Animal Experimentation (CONCEA) and the Ethical Principles in Animal Research formulated by the Brazilian Society of Science in Laboratory Animals and was approved by the Bioscience Institute (UNESP) Ethics Committee on Use of Animals (CEUA; 948-2017).

Data Availability Statement

The data will be made available upon request.

Conflicts of Interest

The authors declare no conflicts of interest.

References

  1. Quick, N.J.; Middlemas, S.J.; Armstrong, J.D. A survey of antipredator controls at marine salmon farms in Scotland. Aquaculture 2004, 230, 169–180. [Google Scholar] [CrossRef]
  2. Sanchez-Jerez, P.; Fernandez-Jover, D.; Bayle-Sempere, J.; Valle, C.; Dempster, T.; Tuya, F.; Juanes, F. Interactions between bluefish Pomatomus saltatrix (L.) and coastal sea-cage farms in the Mediterranean Sea. Aquaculture 2008, 282, 61–67. [Google Scholar] [CrossRef]
  3. Fregadolli, C.H. Laboratory analysis of predation by cyclopoid copepods on first-feeding larvae of cultured Brazilian fishes. Aquaculture 2003, 228, 123–140. [Google Scholar] [CrossRef]
  4. Luz, R.K.; Portella, M.C. Effect of prey concentrations and feed training on production of Hoplias lacerdae juvenile. An. Acad. Bras. Ciências 2015, 87, 1125–1132. [Google Scholar] [CrossRef]
  5. Domenici, P.; Blake, R. The kinematics and performance of fish fast-start swimming. J. Exp. Biol. 1997, 200, 1165–1178. [Google Scholar] [CrossRef]
  6. Pfeiffer, W. Distribution of fright reaction and alarm substance cells in fishes. Copeia 1977, 4, 653–665. [Google Scholar] [CrossRef]
  7. Endler, J.A. Defense against predators. In Predator–Prey Relationships: Perspectives and Approaches From the Study of Lower Vertebrates; Feder, M.E., Lauder, G.V., Eds.; University of Chicago: Chicago, IL, USA, 1986; pp. 109–134. [Google Scholar]
  8. Chivers, D.P.; Smith, R.J.F. Chemical alarm signalling in aquatic predator-prey systems: A review and prospectus. Ecoscience 1998, 5, 338–352. [Google Scholar] [CrossRef]
  9. Giaquinto, P.C.; Volpato, G.L. Hunger suppresses the onset and the freezing component of the antipredator response to conspecific skin extract in pintado catfish. Behaviour 2001, 138, 1205–1214. [Google Scholar] [CrossRef]
  10. Ide, L.M.; Urbinati, E.C.; Hoffmann, A. The role of olfaction in the behavioural and physiological responses to conspecific skin extract in Brycon cephalus. J. Fish Biol. 2003, 63, 332–343. [Google Scholar] [CrossRef]
  11. Barreto, R.E.; Barbosa, A.; Giassi, A.C.C.; Hoffmann, A. The ‘Club’ Cell and Behavioural and Physiological Responses to Chemical Alarm Cues in the Nile Tilapia. Mar. Freshwater Behav. Physiol. 2010, 43, 75–81. [Google Scholar] [CrossRef]
  12. Wisenden, B.D. Olfactory assessment of predation risk in the aquatic environment. Philos. Trans. R. Soc. London B Biol. Sci. 2000, 355, 1205–1208. [Google Scholar] [CrossRef] [PubMed]
  13. Mathis, A. Alarm responses as a defense: Chemical alarm cues in nonostariophysan fishes. In Fish Defenses Vol. 2: Pathogens, Parasites and Predators; Zaccone, G., Perriére, C., Mathis, A., Kapoor, B.G., Eds.; Science Publishers: Enfield, NH, USA, 2009; pp. 323–386. [Google Scholar]
  14. Kristensen, E.A.; Closs, G.P. Anti-predator response of naïve and experienced common bully to chemical alarm cues. J. Fish Biol. 2004, 64, 643–652. [Google Scholar] [CrossRef]
  15. Li, Y.; Yan, Z.; Lin, A.; Li, X.; Li, K. Non-Dose-Dependent Relationship between Antipredator Behavior and Conspecific Alarm Substance in Zebrafish. Fishes 2023, 8, 76. [Google Scholar] [CrossRef]
  16. Mitchell, M.D.; Cowman, P.F.; McCormick, M.I. Chemical alarm cues are conserved within the coral reef fish family pomacentridae. PLoS ONE 2012, 7, e47428. [Google Scholar] [CrossRef]
  17. Sanches, F.H.C.; Miyai, C.A.; Pinho-Neto, C.F.; Barreto, R.E. Stress responses to chemical alarm cues in the Nile tilapia. Physiol. Behav. 2015, 149, 8–13. [Google Scholar] [CrossRef]
  18. Lima, S.L.; Dill, L.M. Behavioral decisions made under the risk of predation: A review and prospectus. Can. J. Zool. 1990, 68, 619–640. [Google Scholar] [CrossRef]
  19. Bartosiewicz, M.; Gliwicz, Z.M. Temporary Intermissions in Capturing Prey (Daphnia) by Planktivorous Fish (Rutilus rutilus): Are They Due to Scramble Competition or the Need for Antipredation Vigilance? Hydrobiologia 2011, 668, 125–136. [Google Scholar] [CrossRef]
  20. Tang, L.; Schwarzkopf, L. Foraging behaviour of the Peaceful Dove (Geopelia striata) in relation to predation risk: Group size and predator cues in a natural environment. Emu 2013, 113, 1–7. [Google Scholar] [CrossRef]
  21. Pascual, J.; Senar, J.C. Antipredator behavioural compensation of proactive personality trait in male Eurasian siskins. Anim. Behav. 2014, 90, 297–303. [Google Scholar] [CrossRef]
  22. Beauchamp, G. Antipredator Vigilance Decreases with Food Density in Staging Flocks of Semipalmated Sandpipers (Calidris pusilla). Can. J. Zool. 2014, 92, 785–788. [Google Scholar] [CrossRef]
  23. Abrahams, M.V.; Sutterlin, A. The Foraging and Antipredator Behaviour of Growth-Enhanced Transgenic Atlantic Salmon. Anim. Behav. 1999, 58, 933–942. [Google Scholar] [CrossRef]
  24. Elvidge, C.K.; Ramnarine, I.; Brown, G.E. Compensatory foraging in Trinidadian guppies: Effects of acute and chronic predation threats. Curr. Zool. 2014, 60, 323–332. [Google Scholar] [CrossRef]
  25. Dalton, C.M.; Flecker, A.S. Metabolic stoichiometry and the ecology of fear in Trinidadian guppies: Consequences for life histories and stream ecosystems. Oecologia 2014, 176, 691–701. [Google Scholar] [CrossRef] [PubMed]
  26. Lönnstedt, O.M.; McCormick, M.I.; Chivers, D.P. Predator-induced changes in the growth of eyes and false eyespots. Sci. Rep. 2013, 3, 2259. [Google Scholar] [CrossRef] [PubMed]
  27. Chivers, D.P.; Zhao, X.; Brown, G.E.; Marchant, T.A.; Ferrari, C.O.M. Predator-induced changes in morphology of a prey fish: The effects of food level and temporal frequency of predation risk. Evol. Ecol. 2008, 22, 561–574. [Google Scholar] [CrossRef]
  28. Brönmark, C.; Miner, J.G. Predator-induced phenotypical change in body morphology in crucian carp. Science 1992, 258, 1348–1350. [Google Scholar] [CrossRef]
  29. Eklöv, P.; Svanbäck, R. Predation risk influences adaptive morphological variation in fish populations. Am. Nat. 2006, 167, 440–452. [Google Scholar] [CrossRef]
  30. Naylor, R.L.; Hardy, R.W.; Buschmann, A.H.; Bush, S.R.; Cao, L.; Klinger, D.H.; Little, D.C.; Lubchenco, J.; Shumway, S.E. A 20-year retrospective review of global aquaculture. Nature 2021, 591, 551–563. [Google Scholar] [CrossRef]
  31. Valenti, W.C.; Barros, H.P.; Moraes-Valenti, P.; Bueno, G.W.; Cavalli, R.O. Aquaculture in Brazil: Past, present and future. Aquac. Rep. 2021, 19, 100611. [Google Scholar] [CrossRef]
  32. Volpato, G.L.; Bovi, T.S.; de Freitas, R.H.A.; da Silva, D.F.; Delicio, H.C.; Giaquinto, P.C.; Barreto, R.E. Red Light Stimulates Feeding Motivation in Fish but Does Not Improve Growth. PLoS ONE 2013, 8, e59134. [Google Scholar] [CrossRef]
  33. Fernandes, M.D.O.; Volpato, G.L. Heterogeneous growth in the Nile tilapia: Social stress and carbohydrate metabolism. Physiol. Behav. 1993, 54, 319–323. [Google Scholar] [CrossRef] [PubMed]
  34. Volpato, G.L.; Fernandes, M.O. Social control of growth in fish. Braz. J. Med. Biol. Res. 1994, 27, 797–810. [Google Scholar]
  35. Corrêa, S.A.; Fernandes, M.O.; Iseki, K.K.; Negrão, J.A. Effect of the establishment of dominance relationships on cortisol and other metabolic parameters in Nile tilapia (Oreochromis niloticus). Braz. J. Med. Biol. Res. 2003, 36, 1725–1731. [Google Scholar] [CrossRef] [PubMed]
  36. Lugert, V.; Thaller, G.; Tetens, J.; Schulz, C.; Krieter, J. A review on fish growth calculation: Multiple functions in fish production and their specific application. Rev. Aquac. 2016, 8, 30–42. [Google Scholar] [CrossRef]
  37. Wootton, R.J. Ecology of Teleost Fishes; Fish Fish. Series 1; Chapman & Hall: London, UK, 1990; p. 404. [Google Scholar] [CrossRef]
  38. Froese, R. Cube law, condition factor and weight-length relationships: History, meta-analysis and recommendations. J. Appl. Ichthyol. 2006, 22, 241–253. [Google Scholar] [CrossRef]
  39. Rohlf, F.J. tpsUtil. Version 1.26; Department of Ecology and Evolution, State University of New York at Stony Brook, Stony Brook: New York, NY, USA, 2004. [Google Scholar]
  40. Rohlf, F.J. TpsDig. Version 2.04; Department of Ecology and Evolution, State University of New York at Stony Brook, Stony Brook: New York, NY, USA, 2005. [Google Scholar]
  41. Mojekwu, T.O.; Anumudu, C.I. Advanced techniques for morphometric analysis in fish. J. Aquac. Res. Dev. 2015, 6, 1–6. [Google Scholar]
  42. Li, G.; Ashraf, I.; François, B.; Kolomenskiy, D.; Lechenault, F.; Thiria, B. Burst-and-coast swimmers optimize gait by adapting unique intrinsic cycle. Commun. Biol. 2021, 4, 40. [Google Scholar] [CrossRef]
  43. Pekár, S.; Brabec, M. Generalized estimating equations: A pragmatic and flexible approach to the marginal GLM modelling of correlated data in the behavioural sciences. Ethology 2018, 124, 86–93. [Google Scholar] [CrossRef]
  44. Saha, S.; Khatun, M. Production performances of monosex Nile tilapia, Oreochromis niloticus in brackishwater ponds. Bangladesh J. Zool. 2014, 42, 261–269. [Google Scholar] [CrossRef]
  45. Castro-Silva, T.S.; Santos, L.D.; Silva, L.C.R.; Michelato, M.; Furuya, V.R.B.; Furuya, W.M. Length-weight relationship and prediction equations of body composition for growing-finishing cage-farmed Nile tilapia. Rev. Bras. Zootecnia 2015, 44, 133–137. [Google Scholar] [CrossRef]
  46. Santos, V.B.; Silva, V.V.; Almeida, M.V.; Mareco, E.A.; Salomão, R.A.S. Performance of Nile tilapia Oreochromis niloticus strains in Brazil: A comparison with Philippine strain. J. Appl. Anim. Res. 2019, 47, 72–78. [Google Scholar] [CrossRef]
  47. Varela, A.C.C.; Soares, S.M.; Fortuna, M.; Costa, V.C.; Barletto, I.P.; Mozatto, M.T.; Siqueira, L.; Barcellos, H.H.A.; Barreto, R.E.; Barcellos, L.J.G. A single exposure to sub-lethal concentrations of a glyphosate-based herbicide or fluoxetine-based agent on growth performance in Nile tilapia. J. Toxicol. Environ. Health Part A 2023, 86, 534–542. [Google Scholar] [CrossRef]
  48. Pickering, A. Growth and stress in fish production. Aquaculture 1993, 111, 51–63. [Google Scholar] [CrossRef]
  49. Van Weerd, J.; Komen, J. The effects of chronic stress on growth in fish: A critical appraisal. Comp. Biochem. Physiol. Part A Mol. Integr. Physiol. 1998, 120, 107–112. [Google Scholar] [CrossRef]
  50. Barreto, R.E.; Gontijo, A.M.M.C.; Delicio, H.C. Correlations Between Pre- and Post-Fasting Growth in Nile Tilapia. J. Appl. Anim. Res. 2008, 34, 113–116. [Google Scholar] [CrossRef]
  51. Babu, S.; Ebeneezar, S.; Ramudu, R.; Pal, M. Compensatory Growth and Production Economics of Silver Pompano, Trachinotus blochii (Lacepede, 1801), Fingerlings Stunted by Feed and Space Deprivation. Front. Mar. Sci. 2023, 10, 1234667. [Google Scholar] [CrossRef]
  52. Ahmed, E.O.; Ali, M.E.; Aziz, A.A. Length-Weight Relationships and Condition Factors of Six Fish Species in Atbara River and Khashm el-Girba Reservoir, Sudan. Int. J. Agric. Sci. 2011, 3, 65–70. [Google Scholar] [CrossRef]
  53. Conde-Sieira, M.; Chivite, M.; Míguez, J.M.; Soengas, J.L. Stress effects on the mechanisms regulating appetite in teleost fish. Front. Endocrinol. 2018, 9, 631. [Google Scholar] [CrossRef]
  54. Miranda, J.P.G.A.; Isaac, A.B.J.; Silva, R.B.; Toledo, L.C.S.; Barcellos, L.J.G.; Delicio, H.C. Acute Effects of Fluoxetine on Stress Responses and Feeding Motivation in Nile Tilapia. Fishes 2023, 8, 348. [Google Scholar] [CrossRef]
  55. Arvigo, A.L.; Miyai, C.A.; Sanches, F.H.; Barreto, R.E.; Costa, T.M. Combined Effects of Predator Odor and Alarm Substance on Behavioral and Physiological Responses of the Pearl Cichlid. Physiol. Behav. 2019, 206, 259–263. [Google Scholar] [CrossRef]
  56. Barton, B.A.; Iwama, G.K. Physiological Changes in Fish from Stress in Aquaculture with Emphasis on the Response and Effects of Corticosteroids. Ann. Rev. Fish Dis. 1991, 1, 3–26. [Google Scholar] [CrossRef]
  57. Barton, B.A. Stress in Fishes: A Diversity of Responses with Particular Reference to Changes in Circulating Corticosteroids. Integr. Comp. Biol. 2002, 42, 517–525. [Google Scholar] [CrossRef] [PubMed]
  58. Barton, B.A.; Schreck, C.; Barton, L. Effects of Chronic Cortisol Administration and Daily Acute Stress on Growth, Physiological Conditions, and Stress Responses in Juvenile Rainbow Trout. Dis. Aquat. Org. 1987, 2, 173–185. [Google Scholar] [CrossRef]
Figure 1. A scheme of the experimental schedule. CAS = conspecific alarm substance (skin extract).
Fishes 10 00174 g001
Figure 2. Illustration of the 18 landmarks positioned along the animal’s body for coordinate extraction.
Fishes 10 00174 g002
Figure 3. Chronic effects of the CAS (conspecific alarm substance—skin extract) on (A) body mass, (B) standard length, condition factor (C), and weight gain (D) in Nile tilapia. Data are expressed as mean ± standard deviation (n = 14 for each condition: distilled water—vehicle control (white bars) or CAS (black bars)). Different letters denote a significant difference over time for both body mass and standard length. The body mass increased over time (ANOVA; F(3;78) = 407.4; p < 0.00001), but no effect of the CAS (ANOVA; F(1;26) = 3.30; p = 0.0810) or interaction between the effects of the CAS and time were found (ANOVA; F(3;78) = 0.62; p = 0.61). The same statistical profile was revealed for standard length (ANOVA effects: CAS—F(1;26) = 3.31, p = 0.0805; time—F(3;78) = 379.8, p < 0.00001; interaction—F(3;78) = 0.21, p = 0.89). No difference was found for condition factor (ANOVA effects: CAS—F(1;26) = 0.01, p = 0.91; time—F(3;78) = 2.54, p = 0.063; interaction—F(3;78) = 0.78, p = 0.51). No difference in weight gain occurred between the CAS and control conditions (unpaired t-test; t = 0.74; p = 0.47).
Fishes 10 00174 g003
Figure 4. Chronic effects of the CAS (conspecific alarm substance—skin extract) on specific (SGR) (A) or relative (RGR) (B) growth rates in Nile tilapia. Data are expressed as mean ± standard deviation (n = 14 each condition: distilled water—vehicle control (white bars) or CAS (black bars)). Different letters denote a significant difference over time for both variables. The SGR decreased over time (ANOVA; F(2;52) = 70.9; p < 0.00001), but no effect of the CAS (ANOVA; F(1;26) = 0.38; p = 0.54) or interaction between the effects of the CAS and time were found (ANOVA; F(2;52) = 1.20; p = 0.309). The same statistical profile was revealed for the RGR (ANOVA effects: CAS—F(1;26) = 0.44, p = 0.51; time—F(2;52) = 72.7, p < 0.00001; interaction—F(2;52) = 1.21, p = 0.308).
Fishes 10 00174 g004
Figure 5. Data dispersion. Principal component analysis (PCA) of individual shape variation across different treatments and time points. Each dot represents an individual, with colors indicating the treatment (vehicle control—blue; conspecific alarm substance (CAS)—red) and symbols denoting the sampling time (first day—circle; last day—triangle). The ellipses represent 95% confidence intervals for each treatment–time combination. The X-axis (PC1) accounts for 52.5% of the shape variation, while the Y-axis (PC2) accounts for 41.79%.
Fishes 10 00174 g005
Figure 6. Effect of the CAS and time on PC1. Distribution of the first principal component (PC1) values across treatments (CAS or vehicle control) and sampling times. The boxplots illustrate the variation in PC1 values, comparing the vehicle control (blue) and CAS (red) at two time points (first day and last day). The line inside each box is the median, while the box boundaries indicate the first and third quartiles. Whiskers extend to the most extreme values within 1.5 times the interquartile range, and points outside this range represent potential outliers. The PC1 showed a significant effect of time (ANOVA; F(1;52) = 325.6; p < 0.00001), but no effect of the CAS (ANOVA; F(1;52) = 0.79; p = 0.38) or interaction between the effects of the CAS and time (ANOVA; F(1;52) = 0.04; p = 0.84).
Fishes 10 00174 g006
Figure 7. Effect of the CAS and time on PC2. Distribution of the first principal component (PC2) values across treatments (CAS and vehicle control) and sampling times. The boxplots illustrate the variation in PC2 values, comparing the vehicle control (blue) and CAS (red) at two time points (first day and last day). The line inside each box is the median, while the box boundaries indicate the first and third quartiles. Whiskers extend to the most extreme values within 1.5 times the interquartile range, and points outside this range represent potential outliers. The PC2 showed a significant effect of time (ANOVA; F(1;52) = 0.31; p < 0.58), but no effect of the CAS (ANOVA; F(1;52) = 1.33; p = 0.25) or interaction between the effects of the CAS and time (ANOVA; F(1;52) = 0.61; p = 0.44).
Fishes 10 00174 g007
Figure 8. Landmark deformation between first and last day. The graph illustrates the deformation of landmarks between the first and last day of the experiment using the TPS (thin-plate spline) method with a 2× magnification. The deformed mesh represents the displacement of landmarks on the last day relative to their initial positions on the first day. While the last day’s landmarks are not explicitly shown, the mesh deformation effectively visualizes the morphological changes over time.
Fishes 10 00174 g008
Figure 9. Chronic effects of the CAS (conspecific alarm substance—skin extract) on morphometric axes in Nile tilapia (AD). The meaning of each body axis of the tilapia is shown below each photo in this figure and is indicated by a red line on the body of the fish. Data are expressed as mean ± standard deviation (n = 14 for each condition: distilled water—vehicle control (white bars) or CAS (black bars)). Different letters denote a significant difference over time for each axis. All axes showed a linear increase over time without effects of the CAS or interaction between the CAS and time (ANOVA effects: Axis 1, CAS—F(1;26) = 1.48, p = 0.23; time—F(1;26) = 84.3, p < 0.00001; interaction—F(1;26) = 1.23, p = 0.28; Axis 2, CAS—F(1;26) = 2.43, p = 0.13; time—F(1;26) = 150.0, p < 0.00001; interaction—F(1;26) = 0.41, p = 0.53; Axis 3, CAS—F(1;26) = 1.51, p = 0.23; time—F(1;26) = 203.9, p < 0.00001; interaction—F(1;26) = 1.79, p = 0.19; Axis 4, CAS—F(1;26) = 2.76, p = 0.11; time—F(1;26) = 89.3, p < 0.00001; interaction—F(1;26) = 0.57, p = 0.46).
Fishes 10 00174 g009
Figure 10. Chronic effects of the CAS (conspecific alarm substance—skin extract) on (A) food intake or (B) FCE (feed conversion efficiency) in Nile tilapia. Data are expressed as mean ± standard deviation (n = 14 each condition: distilled water—vehicle control (white bars) or CAS (black bars)). Different letters denote a significant difference over time for both variables. No difference was found for food intake (ANOVA effects: CAS—F(1;26) = 2.8, p = 0.11; time—F(2;52) = 0.57, p = 0.60; interaction—F(2;52) = 0.05, p = 0.95). The FCE decreased over time (ANOVA; F(2;52) = 26.4; p < 0.00001), but no effect of the CAS (ANOVA; F(1;26) = 0.08; p = 0.78) or interaction between the effects of the CAS and time were found (ANOVA; F(2;52) = 1.87; p = 0.17).
Fishes 10 00174 g010
Disclaimer/Publisher’s Note: The statements, opinions and data contained in all publications are solely those of the individual author(s) and contributor(s) and not of MDPI and/or the editor(s). MDPI and/or the editor(s) disclaim responsibility for any injury to people or property resulting from any ideas, methods, instructions or products referred to in the content.