Article

An Ecosystem-Based Approach to Evaluating Impacts of Fisheries Management on Ecosystem Restoration in a Chinese Subtropical Yangming Reservoir

1
Jiangxi Provincial Aquatic Biology Protection and Rescue Center, Nanchang 330029, China
2
School of Environment and Surveying Engineering, Suzhou University, Suzhou 234000, China
3
Institute of Hydrobiology, Chinese Academy of Sciences, Wuhan 430072, China
4
Jiangxi Fisheries Research Institute, Nanchang 330039, China
*
Author to whom correspondence should be addressed.
Fishes 2025, 10(6), 246; https://doi.org/10.3390/fishes10060246
Submission received: 9 April 2025 / Revised: 16 May 2025 / Accepted: 19 May 2025 / Published: 23 May 2025
(This article belongs to the Section Fishery Economics, Policy, and Management)

Abstract

:
This study delves into the ecological implications of diverse fishery patterns on aquatic ecosystems, centering on environmental parameters, species richness, and nutrient dynamics. Using the ecological fishery management model of Yangming Lake as a case, it evaluates its influence on water quality improvement, species diversity promotion, and ecosystem stability maintenance. From 2018 to 2022, the Shannon–Wiener index in Yangming Lake increased by 17.34%, and water quality significantly improved, with phytoplankton biomass decreasing by 95.5%, total nitrogen content dropping by 33.69%, and permanganate index declining by 30.75%. Although ecological fisheries demonstrate certain effectiveness in tackling invasive species, further in-depth research is needed. This study emphasizes the importance of striking a balance between fishery development and ecological protection, in line with the United Nations Food and Agriculture Organization’s “blue transformation” strategy. Our findings offer valuable insights for sustainable fisheries development and highlight the necessity of customized management strategies to protect biodiversity and ecosystem resilience. Future research will focus on exploring the long-term ecological effects of ecological fisheries and the role of native carnivorous fish in controlling invasive species.
Key Contribution: Customized ecological fishery management strategies are necessary for biodiversity conservation, aligning with the United Nations “Blue Transformation” strategy. They provide empirical evidence for balancing fishery development and ecological protection, and offer new perspectives for sustainable fisheries development.

1. Introduction

Globally, freshwater ecosystems are among the most important ecosystems [1,2], playing a key role in supporting species diversity and providing a variety of ecological services. In particular, the reservoir, which has natural functions, assumes more economic and social functions, providing human beings with services such as agricultural irrigation, flood control, power generation, and drinking water sources [3]. At the same time, as a general part of the surface water, it is more affected by human activities than other lakes [4]. Fishing is a source of low-cost animal protein to fulfill the needs of the growing human population [5,6,7]. The adverse ecological effects of aquaculture on lake ecosystems, however, cannot be disregarded [8,9,10,11].
Cage fish farming, a common fishery activity in aquaculture activities, has caused significant ecological stress. For example, cage fisheries often introduce foreign species for domestication to pursue their interests [12,13]. The escape of farmed fish causes damage to the diversity of local wild fish species [8,14,15]. Pseudorasbora parva invasion has led to the simplification of local fish community food networks, and local fish growth is limited [16]. Research on the Salmo trutta invasion shows that after leaving the original habitat, it causes severe predation pressure on local species by Budy et al. [17]. As is known, the eutrophication of surface waters has become an endemic global problem. The launch of feed and fertilization has caused worse water quality [11,18,19]. Feeding and fertilization are the main reasons for the eutrophication of nine reservoirs in the middle and lower reaches of the Yangtze River [20]. Studies have shown that excessive fishery breeding and fertilizer use cause increases in nitrogen (N), phosphorus (P), and other elements in the water body [9,10]. The increase in these elements directly causes a lot of breeding of phytoplankton [21,22,23].
Large-water-area ecological fisheries, also known as ecological fisheries, embody a form of stock enhancement fisheries. This approach takes a comprehensive view of ecological protection and the sustainable development of the fishing industry. By leveraging the natural resource endowment of water bodies, it adopts a “human-stocked and naturally-grown” strategy. Currently, in China, the key species for stock enhancement are filter-feeding fish such as silver carp and bighead carp. These fish are vital in removing algae, which is essential for maintaining water quality and ecological equilibrium in water bodies [24]. In the past decade, China has been implementing more stringent ecological environmental protection policies. In 2020, China implemented the nationwide decade-long Yangtze River Basin fishing ban (2021–2031), prohibiting fishing and aquaculture in designated natural waters (including the main stem of the Yangtze River, its major tributaries, Poyang Lake, Dongting Lake, and all protected areas) across the basin. The ecological fishery model in Jiangxi Province has undergone significant changes due to the implementation of national policies, as it is strategically located in the middle and lower reaches of the Yangtze River (Table 1). The change in aquaculture was that some lakes have been forced to start an ecological fisheries model, a fish farming model that prohibits the use of feed, fertilizer, and cages [25]. The ecological fishery model is a new type of fishery model implemented to protect water quality. This has achieved good results in the reservoirs of Qiandao Lake in China, the Three Gorges Reservoir areas, and other reservoirs [26,27]. The lakes in Jiangxi have undergone significant transformations in line with the changes in national management policies, and Yangming Lake serves as a prime example of these alterations. In the past ten years, its fisheries have experienced a series of changes. Key changes in fishery management policies and practices in Yangming Lake from 2017 to 2023 are summarized in Table 1. Prior to 2017, the Yangming Lake was used for cage fishing [28]. In 2018, Shangyou County and Chongyi County carried out ecological fisheries through the efforts of two fishery companies [29]. Subsequently, in 2020, due to the fishing ban in the Yangtze River Basin, the ecological fishery activities in the part of Yangming Lake within Shangyou County were halted, while the ecological fishery continued to be implemented in the water area of Chongyi County. In 2023, Yangming Lake was listed by the Ministry of Ecology and Environment as “the Second Batch of Outstanding Cases of Beautiful River and Lakes” [30].
Yangming Lake is one of the sources of Poyang Lake, the largest freshwater lake in China, and one of the ten largest reservoirs in Jiangxi Province. It is also an important drinking water source and aquatic product supply base. The effects of macrozoobenthos on environmental factors in Yangming Lake were investigated by Li et al. [33]. Other research on Yangming Lake is limited. The research on Yangming Lake is limited, particularly regarding the environmental impact of fishery patterns in Yangming Lake.
Ecopath with Ecosim (EwE) is a rigorously validated modeling framework in ecosystem ecology, designed to quantify food web dynamics and elucidate functional interactions through mechanistic network analysis [34,35]. As its core component, the Ecopath module specializes in quantifying material and energy fluxes within watershed ecosystems, providing critical insights into trophic energy transfer pathways. EwE modeling has become increasingly pivotal for evaluating how fishery practices reshape food web structures and ecosystem processes [36,37]. For example, Yang TW et al. demonstrated via EwE that two decades of adaptive fishery management in Caohai Lake (2001–2021) enhanced fish species richness by 18% and accelerated nutrient cycling rates through improved trophic connectivity [38]. In parallel, Xiang M et al. leveraged the Ecopath module to characterize early-stage responses of the Geheyan Reservoir ecosystem to China’s decade-long fishing ban, identifying significant recoveries in top predator biomass [39]. Deng Y et al. further applied the framework to assess the top-down regulatory impacts of key filter-feeding species—silver carp (Hypophthalmichthys molitrix) and bighead carp (Aristichthys nobilis)—on nutrient retention and plankton dynamics in Qiandao Lake (Xin’anjiang Reservoir) [40]. Martinez et al. evaluated the impacts of the invasive fish species Lepomis gibbosus on the ecosystem of Aoos Springs Reservoir in northwestern Greece using the Ecopath model [41]. Gubiani’s analysis of Ecopath models for 30 reservoirs in southern Brazil shows that although Ecopath has certain limitations, it remains a model for interdisciplinary research on ecology and the environment [42].
In this study, we established three Ecopath models for the traditional cage fishery, the ecological proliferation fishery, and the fishery-prohibited conservation zone. Through comparison, we discussed the ecological environment effects of different fishery statuses. These results will promote the understanding of the structural changes in lake ecosystems under different fishery management schemes, and provide references for lake fishery management under the “ten-year fishing ban” in the Yangtze basin and other lakes’ fishery development around the world.

2. Materials and Methods

2.1. Study Area and Sampling

Yangming Lake (YML) (25°45′–25°57′ N, 114°12′–114°37′ E), with a total area of 38 km2, is located in Shangyou County (12.67 km2) and Chongyi County (25.3 km2), southern Jiangxi province, China (Figure 1). Yangming Lake (YML) (formerly known as the Shangyou River Reservoir, or Lake Doushui) is the source of the Ganjiang River (the first-level tributary of the Yangtze River). This reservoir was formed by Shangyou River Power Station in the 1950s. It includes two parts of the waters in two parts of Shangyou County (the area accounts for about 1/3) and Chongyi County (the area accounts for about 2/3). It is also dominated by a subtropical hilly mountainous monsoon humid climate, with a mean annual temperature of 23.2 °C, a mean depth of 20.9 m, and a maximum water depth of 45.2 m.
The ecology of YML in both regions is highly consistent, with both areas featuring long, narrow hilly reservoirs divided by barrage nets in the middle—a setup that provides an ideal research foundation for this study [43].
In this study, 11 sampling sites were set up, which basically covered the whole reservoir area. Among them, sampling sites 1–5 are located in the waters of Shangyou County (SYL), and sampling sites 6–11 are located in the waters of Chongyi County (CYL). Seasonal data on water quality, fish, and plankton at these points were collected in 2022–2023. These data in CYL were collected in 2018 during both the high and low water periods. These results in 2018 were provided by Chongyi Zhangyuan Tungsten Co., Ltd. (Ganzhou, Jiangxi, China)’s fishery department. The data collection in 2018 is the time node of the cage fish farms and ecological fisheries at CYL, so we believe that these data can represent the situation of the fishery of the cage. These allow year-round hydrological connectivity and the flow of small fish, but prevent the flow of large economic fish. The establishment of a net of block partitions is implemented to demarcate the boundary waters between the two counties (between the No. 2 and No. 6 sampling points). A net was set up across the 2 counties’ junction (between the No. 2 and No. 6 sampling points).
Eleven sampling sites (five in the waters of the Shangyou county conservation areas and seven in Chongyi county ecological fishery areas) were selected for this study (Figure 1). Each site was sampled in the spring (2022, May), summer (2022, August), fall (November), and winter (2023, February). The fishery resources are primarily harvested using gill nets of varying sizes, including 2 cm, 6 cm, 8 cm, and 10 cm. The duration of each gill net set is 12 h. The total length, body length, and weight of each identified species were measured and recorded.
To ensure the comparability of interannual data, we implemented a comprehensive set of strategies. First, the sampling methodologies remained strictly consistent across the two study years. Annual average values were calculated by aggregating quarterly samples, and all catch data for different taxonomic groups were normalized using the formula log2(weight + 1). This not only standardized the data but also minimized potential biases arising from variations in sample sizes or organismal sizes. Moreover, sampling conditions, including environmental factors and equipment usage, were carefully controlled to maintain uniformity over time. The same analytical protocols were rigorously applied during data processing, ensuring that the results were both reliable and comparable. In the context of Ecopath model implementation, we adhered meticulously to the EWE user manual, thereby guaranteeing the integrity and consistency of interannual datasets [44]. To address the differences in sampling frequency between years, we adopted a hydrology-based weighting approach. For the 2018 dataset, which consisted of samples collected during the dry season (March) and wet season (September), each season was assigned an equal weight of 50% based on Yangming Lake’s historical hydrological records. In contrast, the 2022 quarterly data were averaged using a 25% weight for each season. This method aligns with established practices in long-term ecological monitoring [45,46,47,48], effectively accounting for temporal variations in hydrological and biological processes within the ecosystem model inputs.

2.2. Ecopath with Ecosim Modelling Approach

Ecopath with Ecosim (EwE) model (version: 6.6.8) was used to describe the trophic structure of the YML aquatic germplasm reserves ecosystem [31]. The model software is freely available at http://www.ecopath.org (accessed on 19 April 2023) [49]. The model is constructed fundamentally on the principle of mass and energy balance [44]. This model is a static and descriptive model used to assess trophic interactions in aquatic systems. The basic mass-balance equation of EWE can be described as follows:
B i × ( P / B ) i × E E i j = 1 n B j × ( Q / B ) j × D C j i E X i = 0
where Bi is the biomass of group i; (P/B)i represents the production/biomass ratio of group i, which is equal to the coefficient of total mortality Z under steady-state conditions; EEi is the ecotrophic efficiency of group i; Bj is the biomass of predator j; (Q/B)j is the consumption/biomass ratio of predator j; DCji is the contribution of prey i in the diet of predator j; EXi is the export of group i.

2.2.1. Functional Groups

Groups were classified according to research objectives, similar size, availability of information, trophic habits (mainly diet), and abundance [44,49,50]. This paper defined 17, 22, and 24 functional groups corresponding to 2018, 2022–2023 Chongyi, and 2022–2023 Shangyou, according to the investigation. The number of functional groups varies due to the large variation of fish species in the different groups. All important biota components are covered by these groups [50]. Some commercial and invasive fish species were grouped separately. Table 2 and Table 3 showed a list of compartments selected to represent the food web function groups in Yangming Lake [51,52].

2.2.2. Fish

Fish were caught by catches with different types of nets, including shrimp cage, gill net, and bottom drag net during 2022–2023. The catch was classified, counted, sampled, and weighted (accurate to 0.1 g) immediately to infer fish community composition. Hydroacoustic detections with the EK-80 (60 kHz, Norse, Simrad, Horten, Norway) were performed simultaneously to estimate the fish density. In 2018, fish were assessed using gillnets and hydroacoustic instruments (EY60, 200 kHz, Norway, Simrad).
P/B and Q/B ratios were calculated for each fish group using the following 2 equations:
Z = P / B = K × ( L L ) / ( L L )
l o g ( Q / B ) = 7.964 0.204 × l o g W 1.965 × T + 0.083 × A + 0.532 × h + 0.398 × d
where Z is the total mortality (1/year). K, L∞, L, W∞, and L′ represent the growth rate of the von Bertalanffy growth function, asymptotic length (cm), asymptotic weight (g), mean length (cm), and maximum length of the fish (cm), respectively [55,56]. T, is an expression for the mean annual water temperature, A is the aspect ratio (A = h2 (height)/s (surface area)), h is a dummy variable expressing food type (1 for herbivores or 0 for detritivores and carnivores), and d is a dummy variable also expressing food type (1 for detritivores or 0 for herbivores and carnivores) [55]. L was obtained from the fisheries resource assessment, and K, L∞, W∞, and L′ were calculated using life history data in FishBase (https://fishbase.se/search.php, accessed on 3 April 2023) and other studies [57,58,59,60].

2.2.3. Zoobenthos and Planktons

Plankton sampling followed the Manual for Monitoring Aquatic Biological Resources in the Yangtze River [61], with methods standardized by taxonomic group and body size. Phytoplankton were collected using a 64-μm mesh plankton net, while small-bodied zooplankton (e.g., rotifers) were sampled with the same 64-micrometer net, and large-bodied zooplankton (cladocerans, copepods) with a 112-micrometer mesh plankton net. Qualitative samples were collected via the figure-eight towing method, and quantitative water samples were obtained using a water sampler at a depth of 0.5 m. Phytoplankton and rotifer samples were fixed with 1.5% (v/v) Lugol’s solution, whereas large zooplankton samples were preserved in 3–5% formaldehyde solution. The identification and enumeration of plankton were conducted in accordance with the corresponding standards [62,63]. The relative difference between individual counts and the mean was required to be ≤15%. If this threshold was exceeded, additional counts were performed until two consecutive counts met the precision criterion, ensuring reliable quantitative data. The provided inputs for P/B and Q/B values were adapted from the literature [32].

2.2.4. Detritus

Detritus is composed of organic materials and bacteria. The biomass of bacteria was calculated as 17.5% of phytoplankton biomass [2]. Organic materials were estimated according to the following empirical regression [31]:
l g D = 2.41 + 0.954 l g P P + 0.863 l g E
where D is the organic materials (g·C/m2), PP the primary production (g·C/m2), and E the euphotic depth (m, calculated as triple transparency).

2.2.5. Diet

To construct a diet matrix, we analyzed all functional groups of YML by stable isotopes. For fishes, all individuals were identified to species and measured before a section of dorsal white muscle tissue was removed and frozen until processed [64]. The feeding habits of some carnivorous fish are referred to in other studies. For invertebrates, organisms were identified, recorded, and hard parts (mollusk shells, crustacean exoskeletons) were removed, and then the remaining soft tissues were frozen until processed [65]. Plankton and detritus are important food components of fish [66]. Methods for plankton collection are described in detail in Section 2.2.2. In order to obtain the detritus samples, water samples were filtered through 0.7 μm glass fiber filters (GF/F) and ashed. These processed samples were used to determine the abundance ratios of stable isotopes δ13 C/12 C and δ15 N/14 N. Stable isotope data are expressed in parts per thousand (‰) deviation from international standards using the following equation:
δ X = R s a m p l e R s t a n d e r d 1 × 1000
where X = 15N values or 13C values, and R = ratio of heavy/light isotope content (15N/14N or 13C/12C). The standard for carbon is PeeDee Belemnite limestone, and the standard for nitrogen is atmospheric nitrogen gas. Internal standards were run every 10 samples [66,67]. Tables S1–S3 show the diet matrix input into the Ecopath model.

2.2.6. Model Balance and Data Analysis

After the model data are entered, the parameters are adjusted to balance the model. An EE of all groups of less than 1 is an important indicator of the equilibrium of the model. To balance the model, this study fine-tuned the P/B, Q/B, and diet matrix. To assess the reliability of assembling data from different sources, we calculated the Pedigree value [49].
The dominant fish species were determined by the index of relative importance (IRI) [68]. IRI was calculated from the following equations:
I R I = ( N + W ) × F
where N is the numerical percentage; W is the weight percentage; F is the frequency of occurrence percentage. The species whose IRI value is greater than or equal to 1000 is defined as the dominant species. Species with an IRI > 1000 are classified as dominant species; those with an IRI between 1000 and 100 are common species; an IRI of 100–10 indicates general species; an IRI of 10–1 classifies species as infrequent; and species with an IRI < 1 are considered rare species.
Mixed trophic impact (MTI) was used to describe a group (impacting group) on each of the other groups (impacted groups) [69].
In order to better understand the changes in the fish community of Yangming Lake, we compared the keystoneness species index (KSi) of fish groups [70,71]. Ecopath also estimates an index for the keystones of each functional group to identify groups with MTIs that are relatively high for their biomass [71].
Total primary production/total respiration (TPP/TR), connectance index (CI), total primary production/total biomass (TPP/TB), system omnivory index (SOI), total system throughput (TST), total biomass/total system throughput (TB/TST), Finn’s mean path length (FML), and Finn’s cycling index (FCI) were calculated and used as parameters for describing the functional state of the ecosystem [72]. These indices analyzed the overall development status of the ecosystem, and are important indices of ecosystem maturity [73]. The total transfer efficiency (TE) was also an important indicator in system property evaluation, calculated as the ratio between the throughput on the TL and the sum of the exports [49].
Shannon–Wiener diversity index, Pielou evenness index, and Margalef richness index were used to describe the diversity of fish populations [74]. Shannon–Wiener diversity index (H′), Pielou evenness index (J′), and Margalef richness index (D) were calculated for each fish group by using the following 3 equations:
H = i = 1 s P i · l n P i
J = H / ln S
D = ( S 1 ) / l n N
where S is the number of species in the community, N is the number of individuals of all species in the community, and Pi is the proportion of the i species in the total number of individuals in the community [75]. The data analysis and plotting for this section were completed using Excel (2021) and Origin (origin pro 2024).

3. Results

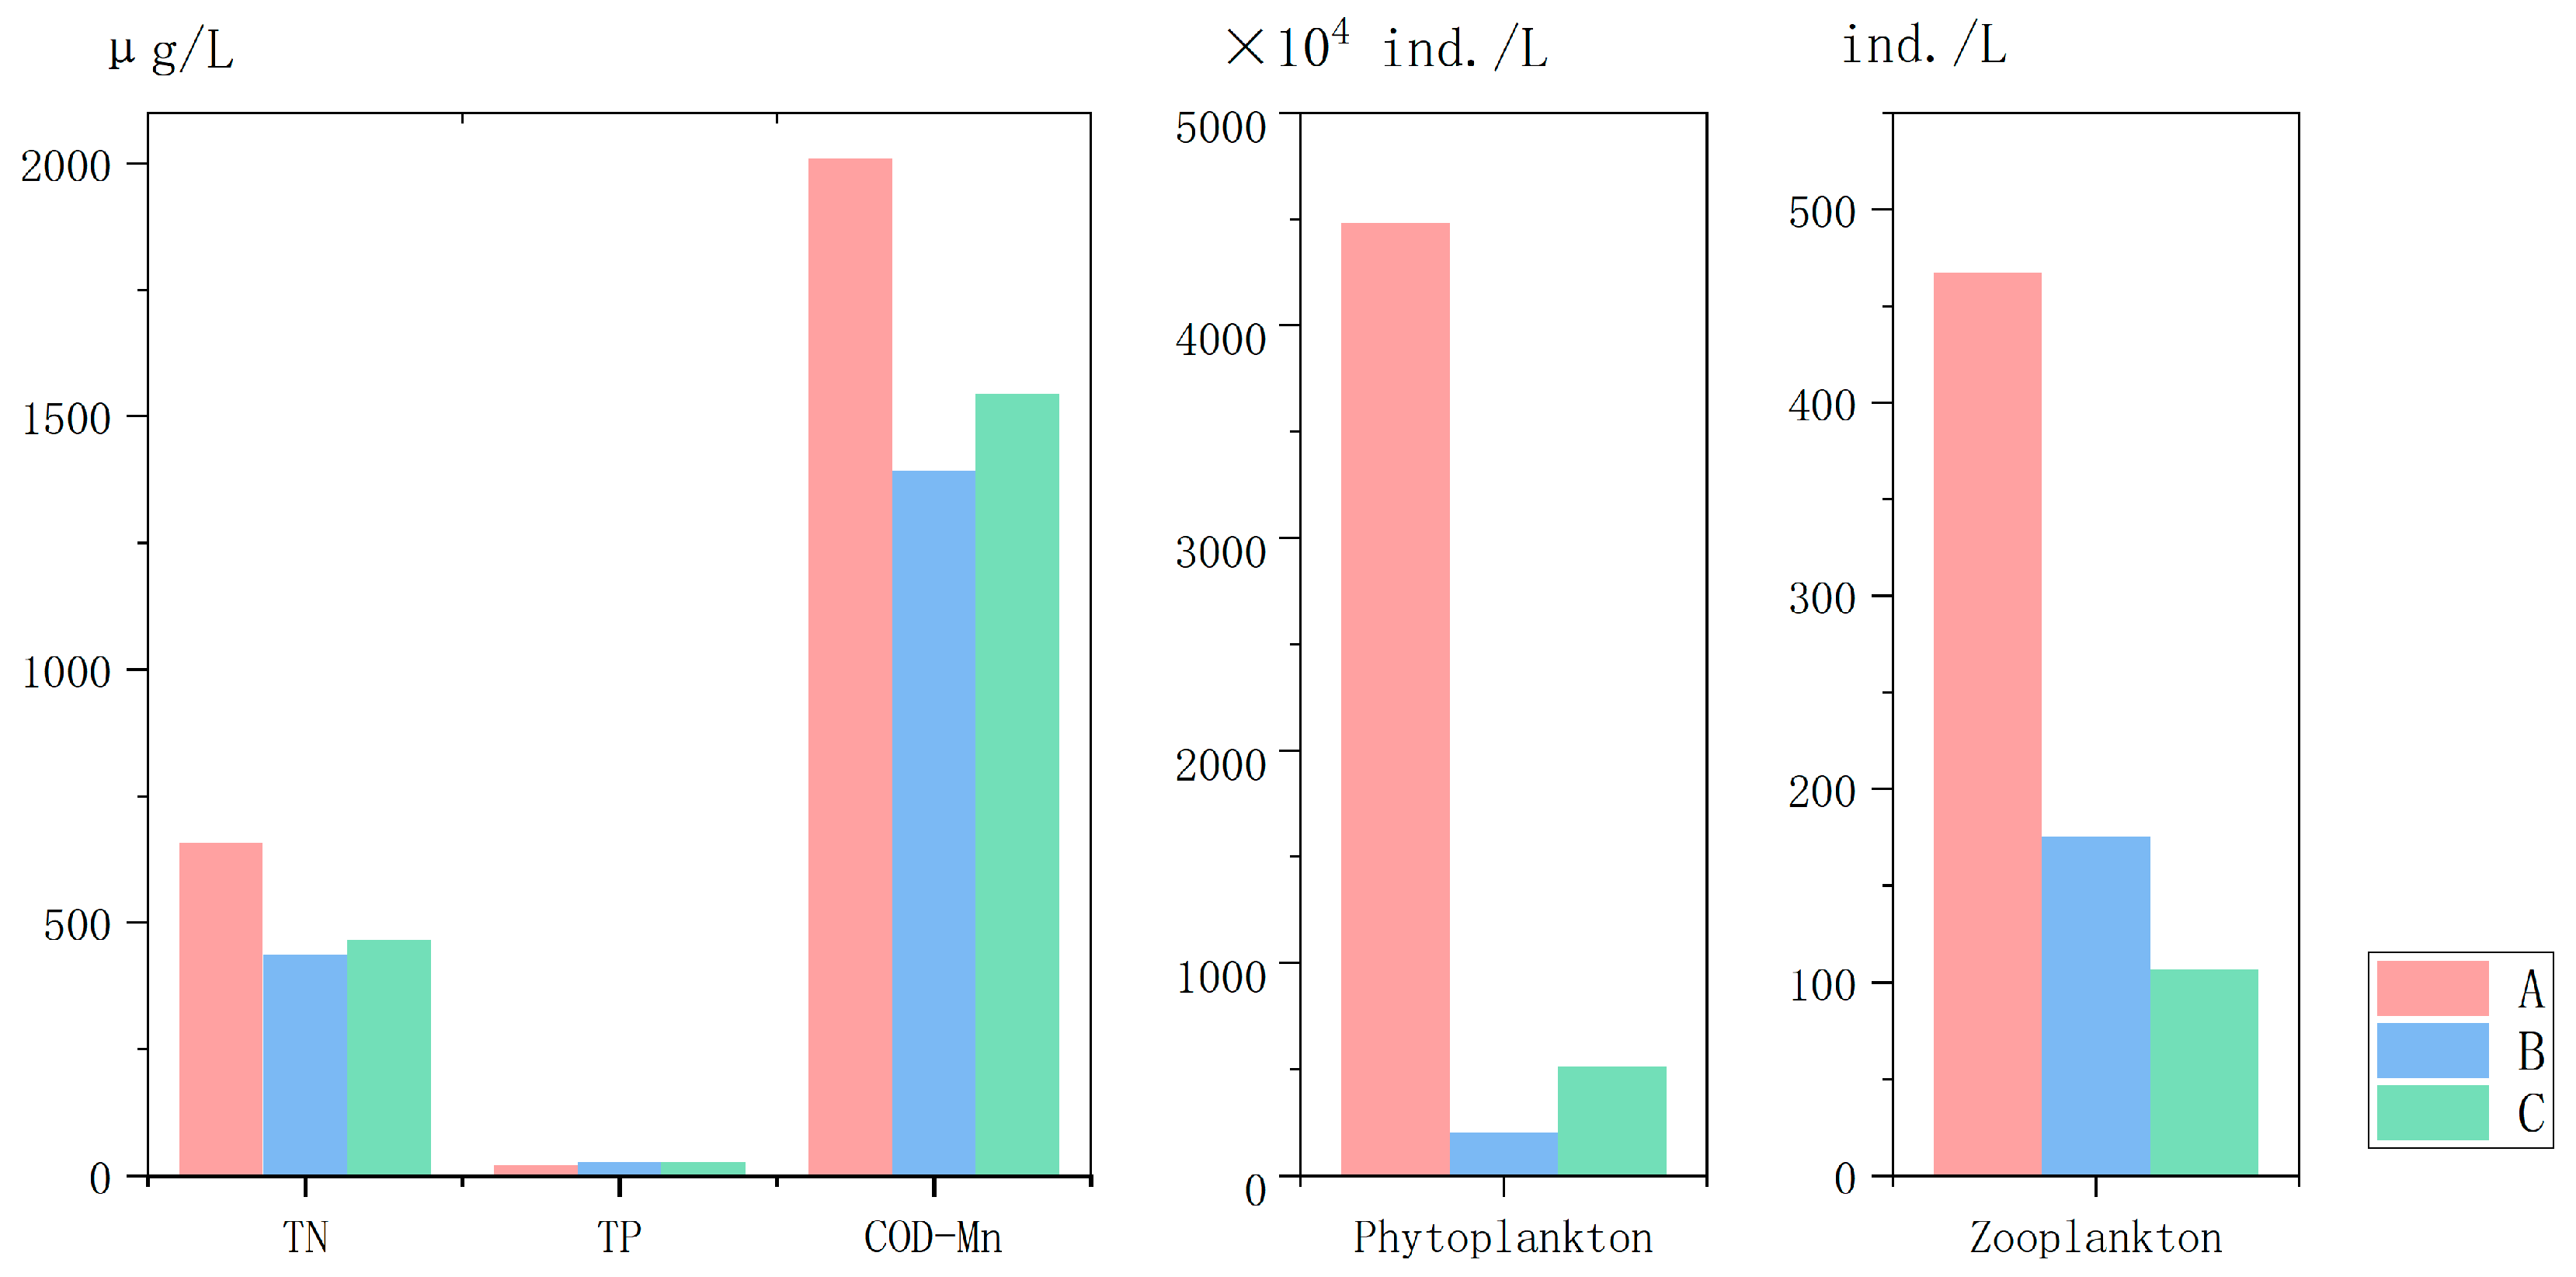
3.1. Phytoplankton and Water Quality
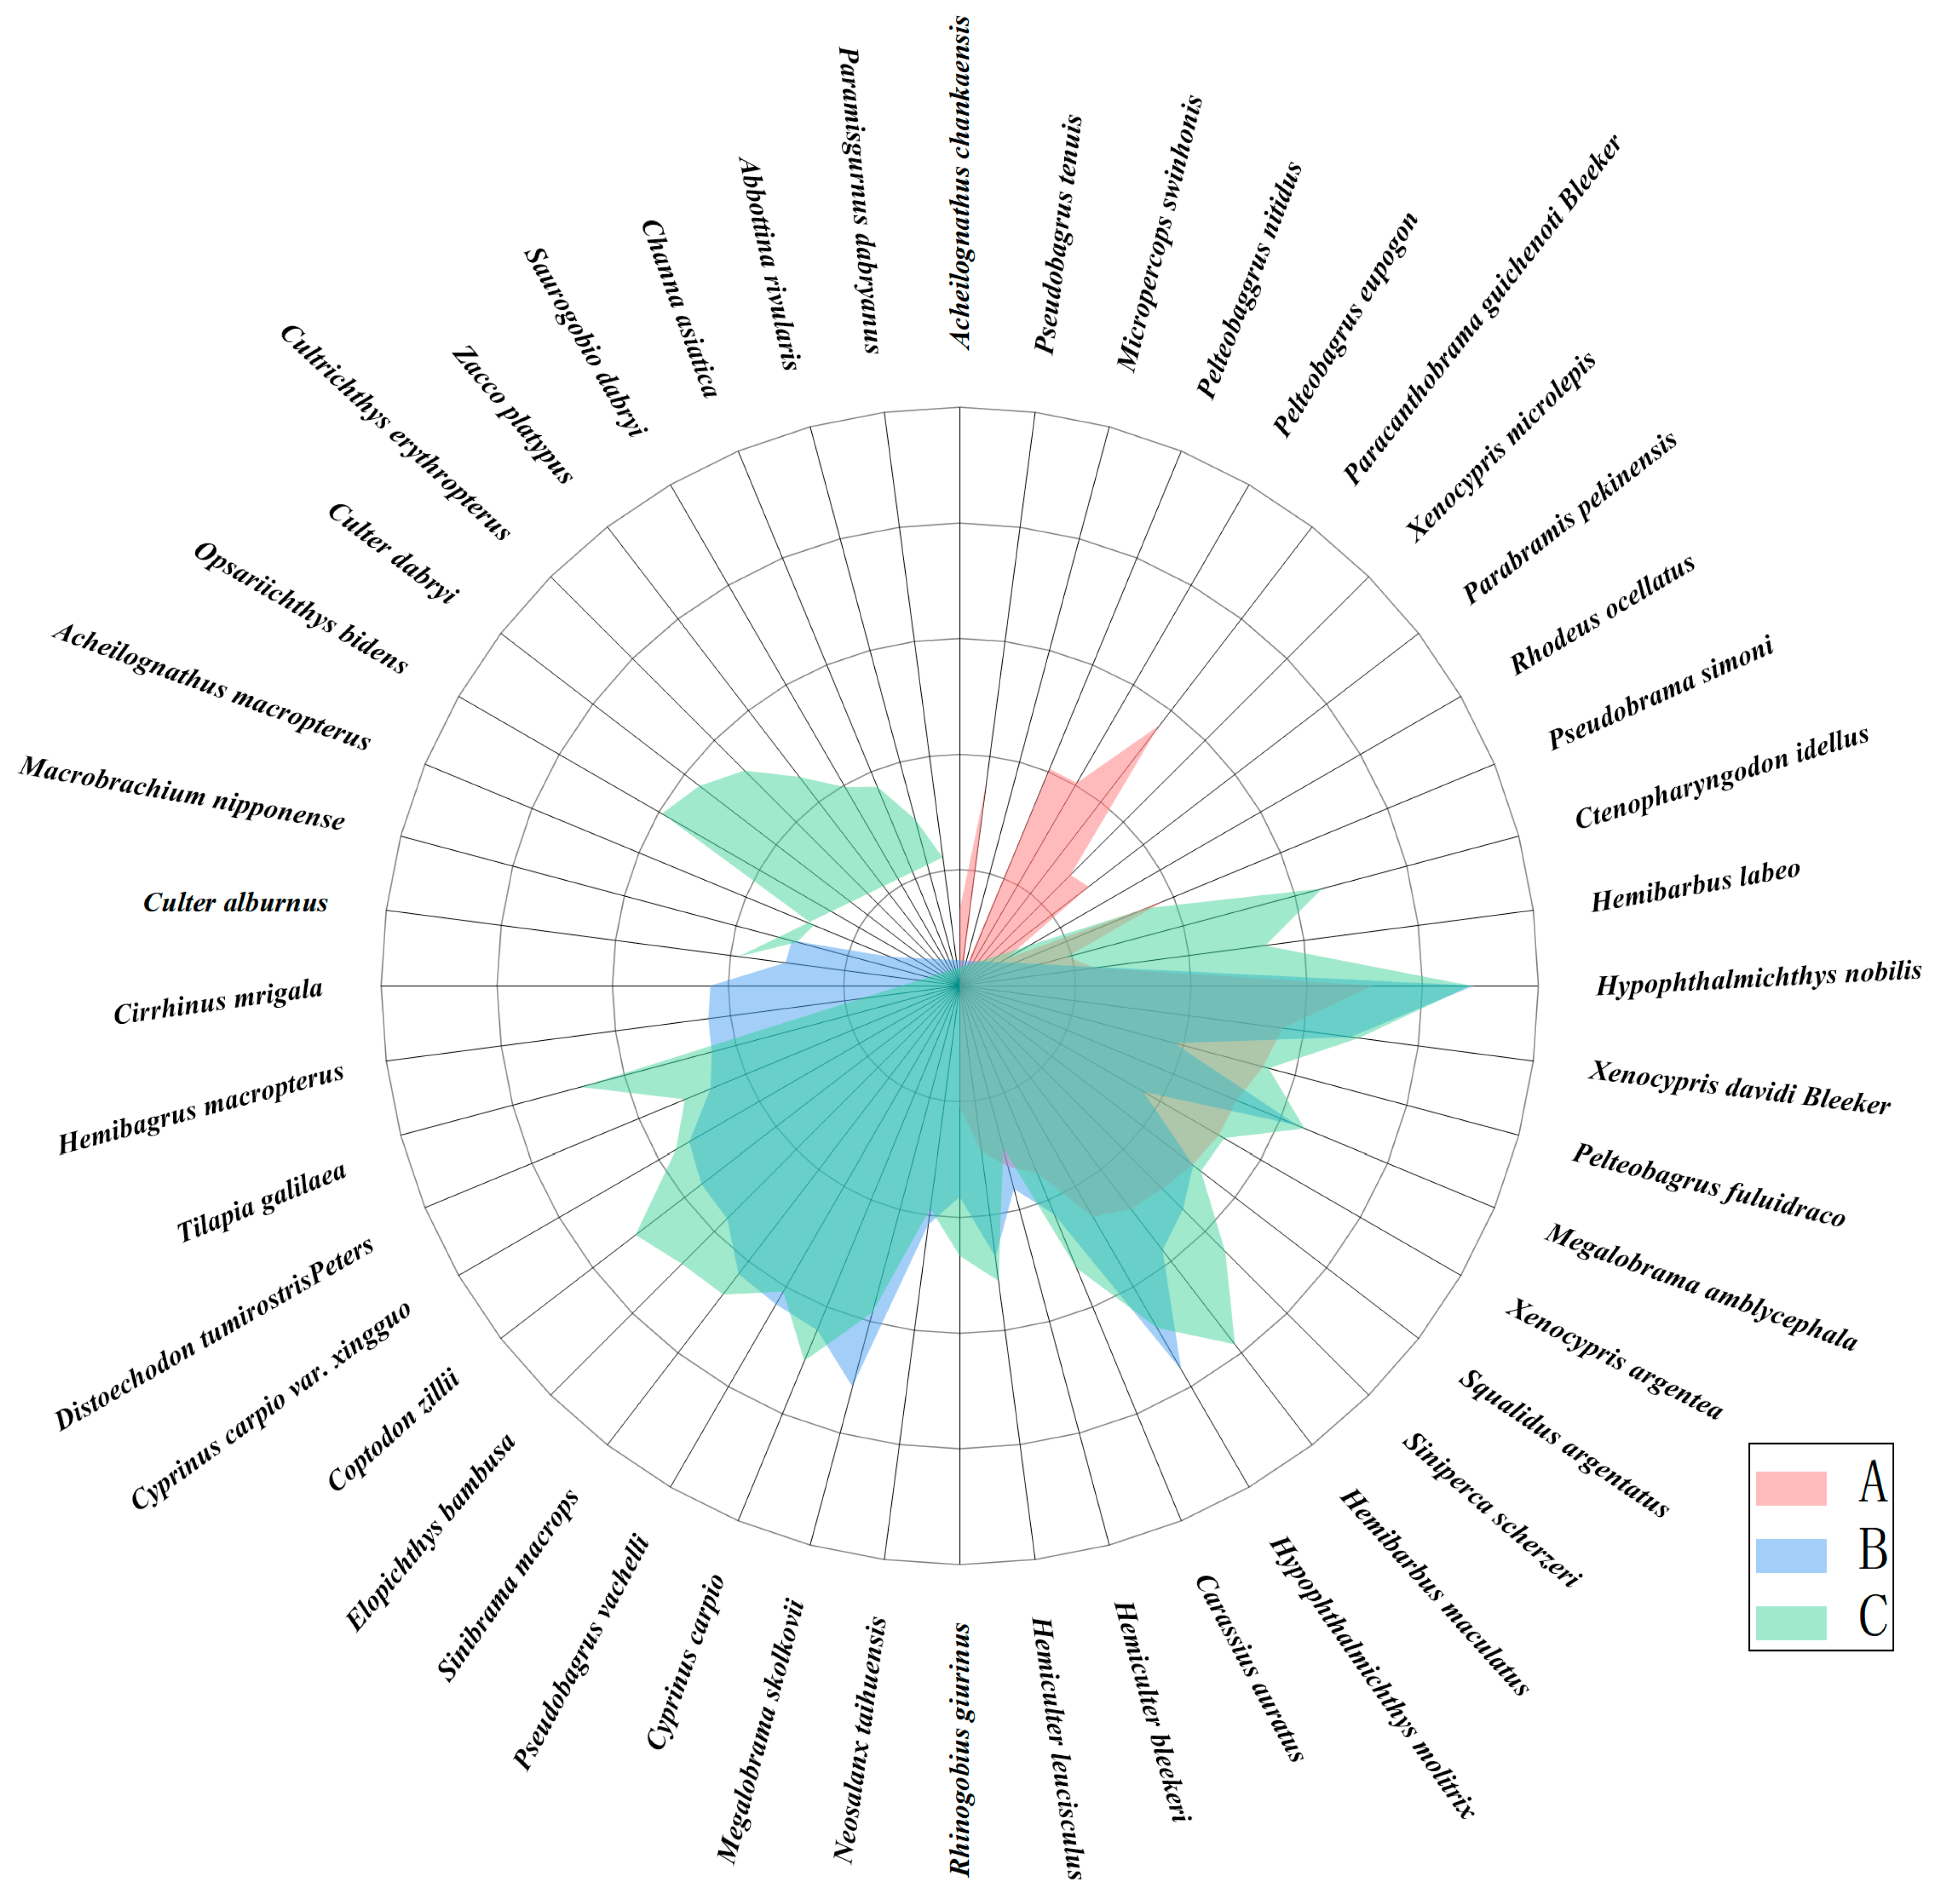
The changes in plankton and water quality in Yangming Lake (YML) from 2018 to 2022 are shown in Figure 2. In 2018, the average phytoplankton abundance in CYL was 4.48 × 10⁷ individuals per liter (ind./L). By 2022, the annual average phytoplankton quantity in CYL decreased by 95.50% compared to 2018 and by 60.53% compared to SYL in 2022. For zooplankton, the average abundance in CYL was 467.33 ind./L in 2018, dropping to 175.75 ind./L in 2022—a 62.39% decrease—while zooplankton abundance in SYL was 106.95 ind./L in 2022.
In terms of water quality, the annual average total nitrogen (TN) content in CYL was 657.5 μg/L in 2018. By 2022, TN in CYL decreased by 33.68% compared to 2018 and was 6.24% lower than that in SYL in 2022. The annual average permanganate index (CODMn) in CYL was 2010 μg/L in 2018, decreasing by 30.75% in 2022 compared to 2018 and exceeding that of SYL in 2022 by 9.90%.

3.2. Fish Community

The changes in the survey of fish species are shown in Figure 3, and the three survey results are obviously different. In 2018, there were 26 types of fishing objects surveyed. In 2022, there were 30 kinds of fishing objects in CYL. There are 39 kinds of catches in the 2022 SYL. Unfortunately, Paracanthobrama guichenoti, relatively rich in 2018 CYL, has not been captured in 2022 CYL and SYL.
The IRIs of three species for M. amblycephala, A. nobilis, and X. argentea were higher than 1000 in 2018 CYL. The IRIs of X. davidi, P. guichenoti, S. argentatus, and H. maculatus were greater than 100. In 2022–2023 CYL, the IRIs of four Species, A. nobilis, S. macrops, X. davidi, and M. skolkovii, were greater than 1000; T. zei, H. molitrix, S. argentatus, H. leucisculus, R. zilingensis, N. taihuensis, M. amblycephala, P. vachelli, and S. scherzeri were greater than 100. In 2022 SYL, A. nobilis (IRI: 2864.404), T. zei (IRI: 1427.747), and S. macrops (IRI: 1397.246) were the main species. The IRIs of the following nine species were greater than 100: X. davidi, R. zilingensis, N. taihuensis Chen, H. leucisculus, S. scherzeri, G. tilapia, S. argentatus, O. bidens, and M. amblycephala.
Previous studies divided the species dominance level in the Yangtze River Resource Survey by the IRI [61]. Table 4 shows the YML fish biological diversity index from 2018 to 2022. With the changes in policies, the H′, J′, and D indexes have improved. The diversity indexes of SYL were higher than CYL in 2022. In summary, the fish community structure of YML has undergone changes, and the diversity of fish has improved.

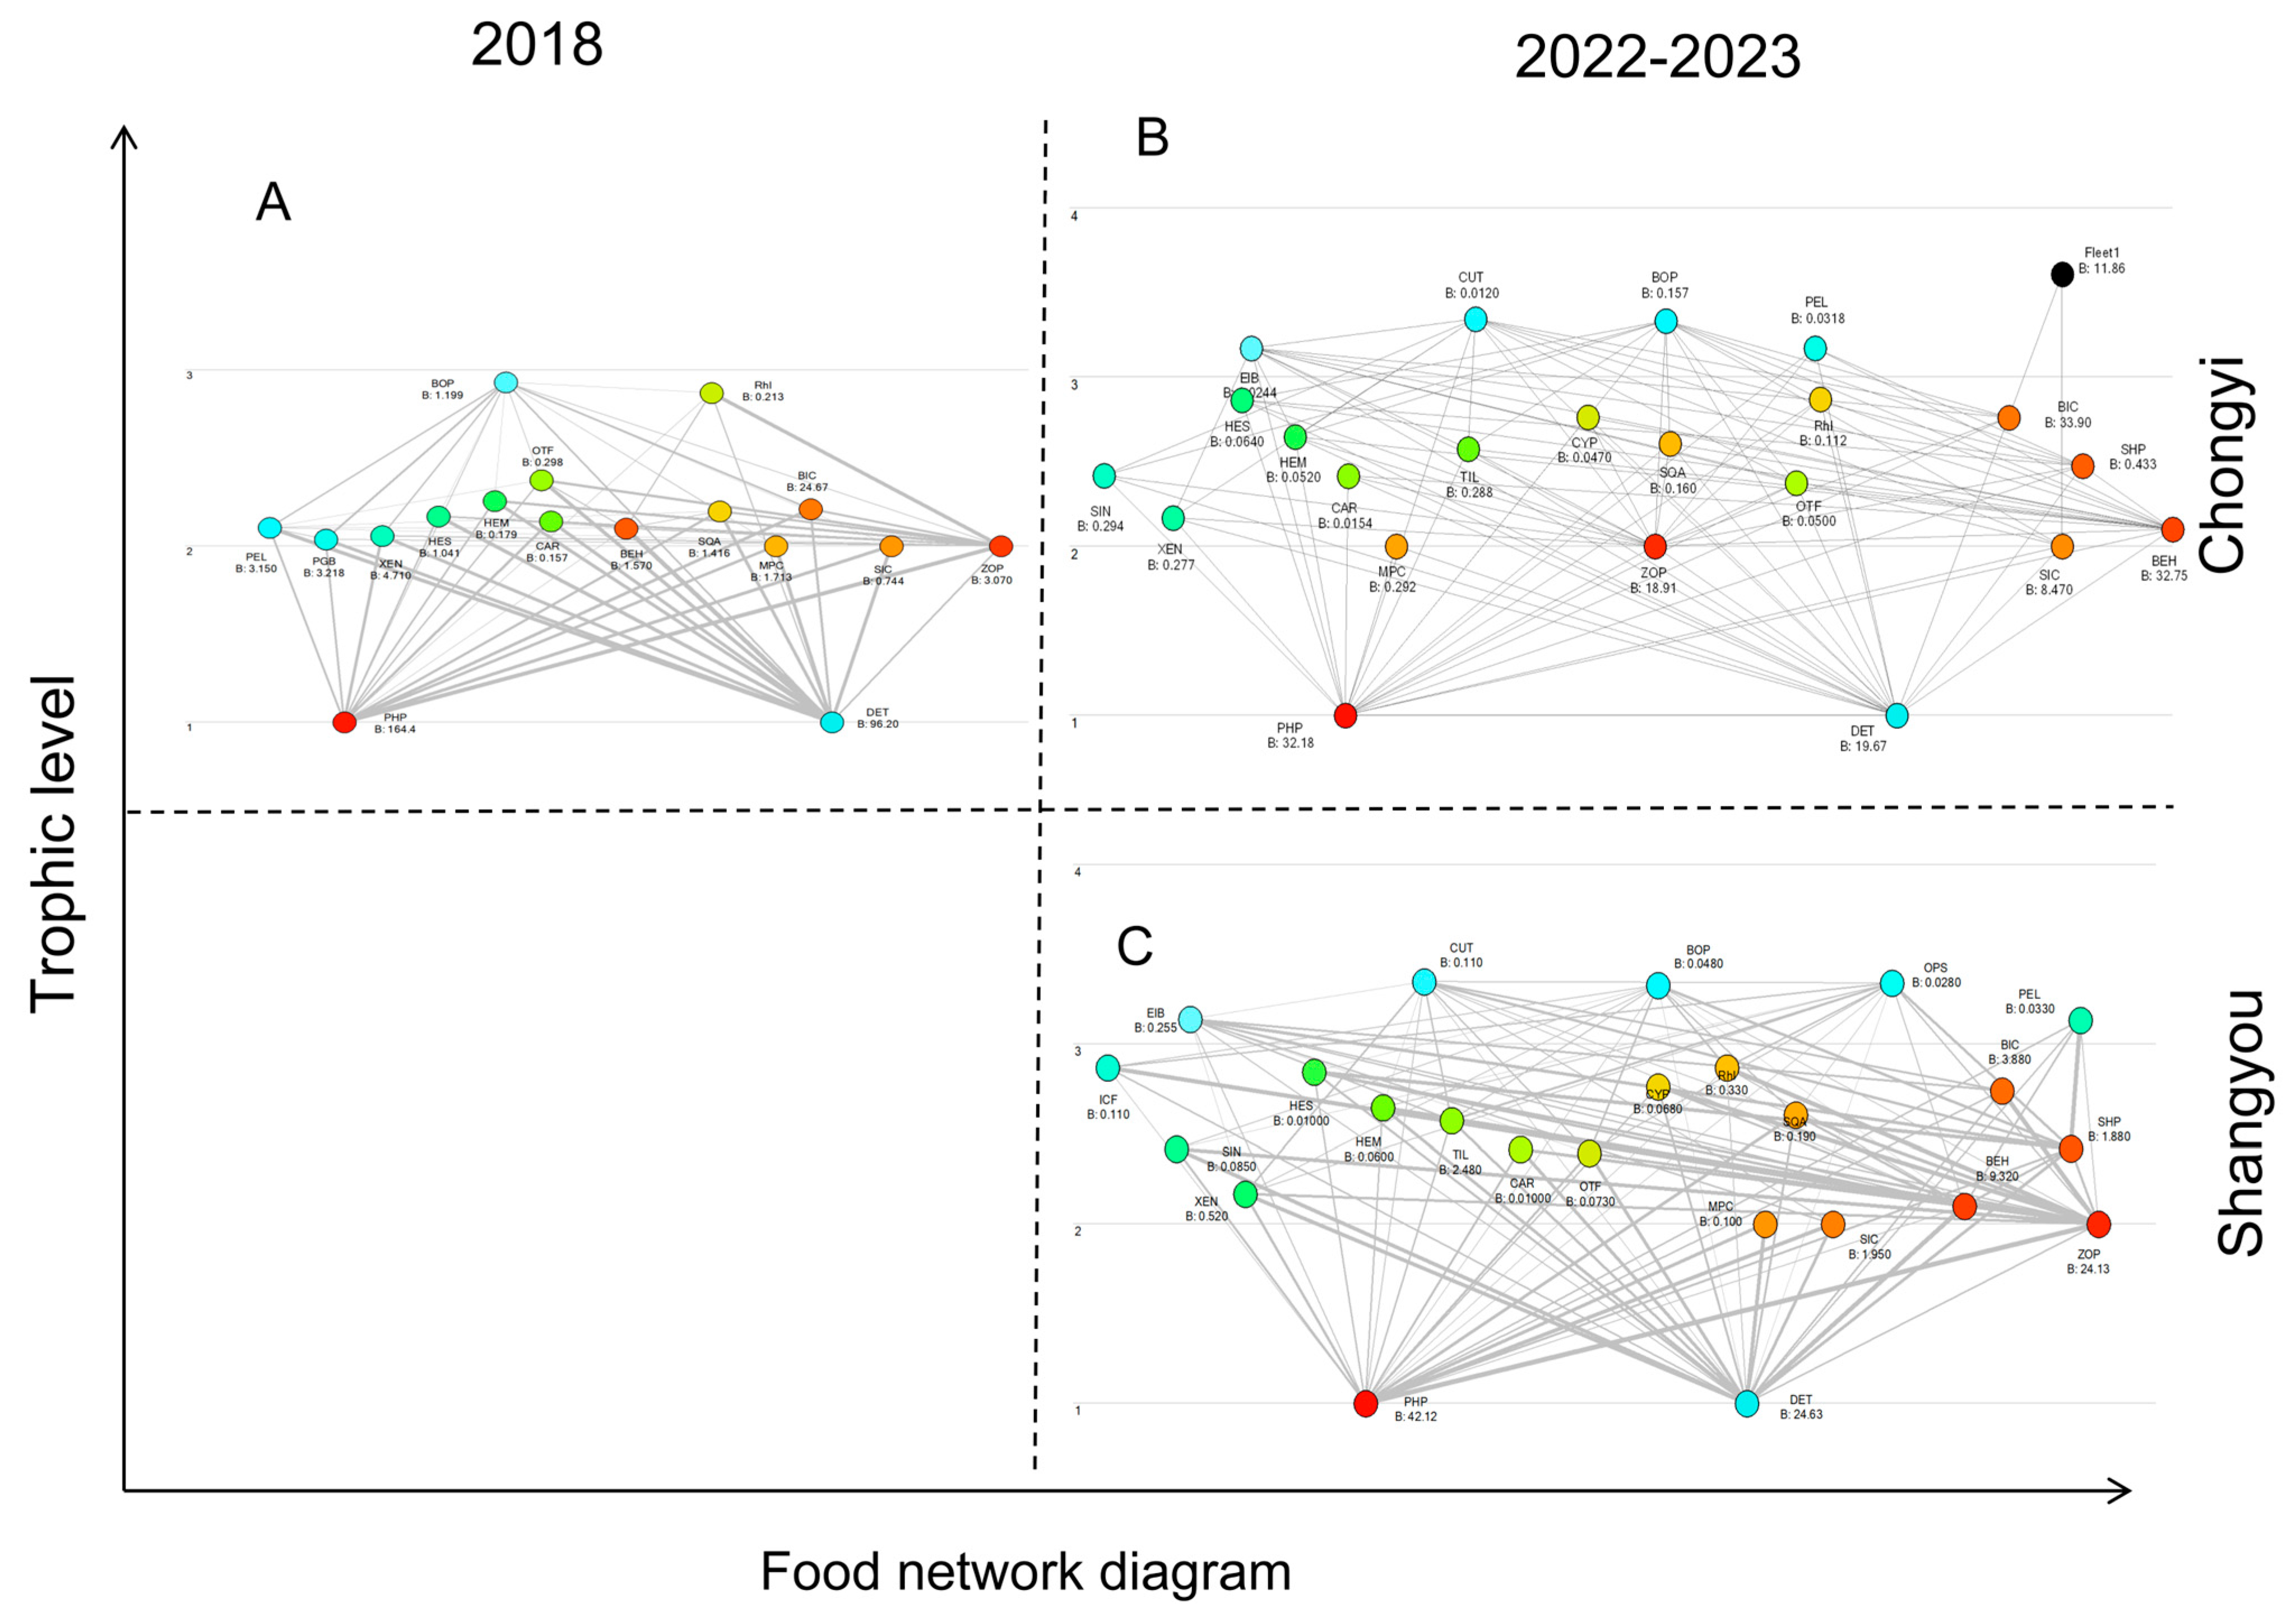
3.3. Model Basic Estimations

Table S4 shows the input parameters and model estimation parameters of the three models developed by EWE. The range of trophic levels (TLs) of the three models is 1~2.93 (2018 CYL), 1~3.377 (2022 CYL), and 1~3.349 (2022 SYL), respectively. Figure 4 shows the structure of the three YML food webs. It can be seen that the food network from 2022 is more complicated than 2018 in CYL. In 2018, the highest trophic level was the underlying carnivorous fish (Siniperca punctata). In 2022 CYL and SYL, the highest trophic level was the culter. The trophic level of bighead crap and silver carp increased from 2.21, 2 (2018 CYL) to 2.76, 2.46 (2022 CYL), and 2.741, 2 (2022 SYL). The ecotrophic efficiencies (EEs) of phytoplankton were 0.037 (2018 CYL), 0.921 (2022 CYL), and 0.663 (2022 SYL); EEs of zooplankton were 0.991 (2018 CYL), 0.614 (2022 CYL), and 0.144 (2022 SYL), respectively.

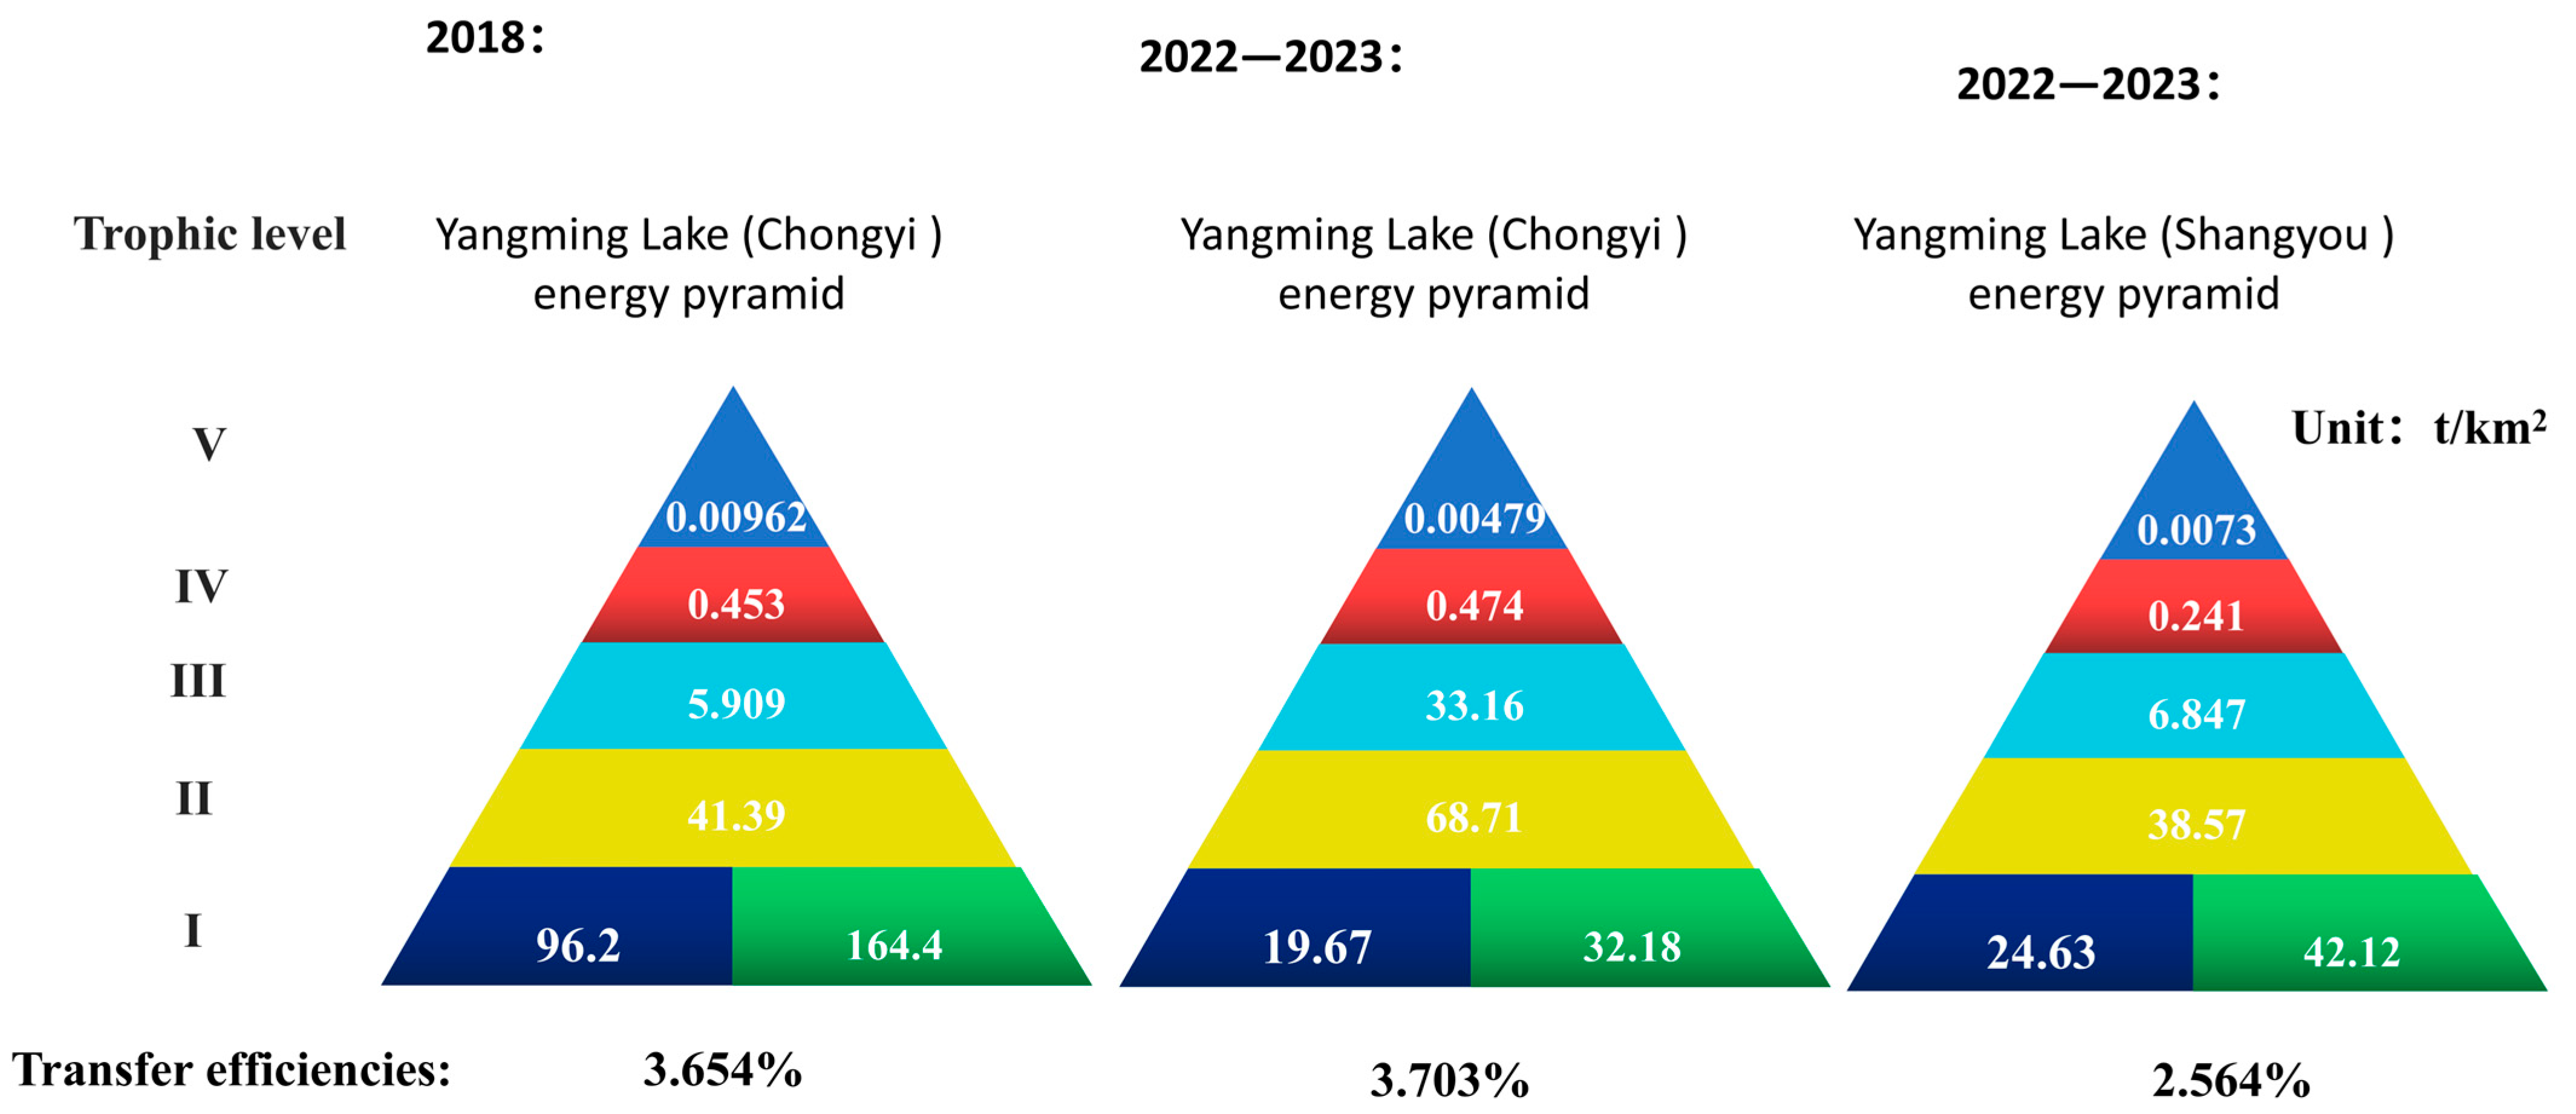
3.4. Model System Statistics

The pedigree indexes were 0.419 (2018 CYL), 0.667 (2022 CYL), and 0.689 (2022 SYL). Morissette et al. indicated that these pedigree indexes are within the “high pedigree” category [76]. These measures of fit of 1.728, 3.899, and 4.355 indicate a reliable source of input parameters for the model and the robustness of the model with a high confidence level.
From 2018 to 2022, in YML, the sum of all consumption (SC) and the sum of all respiratory flows (SRF) increased. In the 2022 CYL, the sum of all exports (SE), sum of all flows into detritus (SFID), total system throughput (TST), sum of all production (SP), calculated total net primary production (CNPP), net system production (NSP), total biomass (TB) (excluding detritus), and total primary production/total respiration (TPP/TR) were smaller than in 2018 CYL (Table 5). It was found that sum of all consumption and sum of all respiratory of SYL flows are lower than CYL, and sum of all exports, sum of all flows into detritus, total system throughput, sum of all production, calculated total net primary production, net system production, total biomass (excluding detritus) and total primary production/total respiration were higher in 2022. Connectance index (CI), system omnivory index (SOI), throughput cycled (including detritus), Finn’s cycling index (FCI), and Finn’s mean path length (FMPL) were indicators that reflect the ecosystem food webs [73]. The more complex the food web, the more stable the ecosystem [72]. SOI of 2022 YML is higher than that of 2018.
TB (excluding detritus) of the models is shown in Table 3. From 2018 to 2022, TB (excluding detritus) has significantly decreased: 211.724 t/km2, 128.523 t/km2, 87.792 t/km2, for 2018 CYL, 2022 CYL, and 2022 SYL models, respectively. The number of biological levels of each nutrition level is shown in Figure 4. The biomass of 2022 CYL, the second nutrition level, and the third nutritional biological volume were higher than the other two models. In the 2018 CYL, phytoplankton and detritus biomass reached 96.2 t/km2 and 164.4 t/km2, respectively, much higher than others.
Transfer efficiencies of the models were 3.654% (2018), 3.937% (2022 CYL), and 2.564% (2022 SYL) (Figure 5). This value is lower than the 10% conversion efficiency of the Lindemann Pyramid and the 9.2% transmission efficiency proposed by Christensen et al. [31].

4. Discussion

Agricultural pollution has long been a concern for the water safety of reservoirs, which serve as vital sources of drinking water for cities and towns [77]. Among the various sources of reservoir pollution, aquaculture, particularly cage culture in reservoirs, has a direct negative impact on water quality and safety [78]. Numerous studies have demonstrated that cage culture not only increases the levels of nitrogen and phosphorus in the water, but also raises the concentration of heavy metals [79]. On the other hand, aquatic products serve as a crucial source of high-quality protein food, and China stands as the largest global supplier, accounting for over 60% of the total supply [80]. The provision of aquatic products has significantly curtailed marine fishing activities while making substantial contributions to the preservation of marine living resources [81]. However, due to the ecological storm, China’s extensive surface aquaculture has experienced a decline in product availability, ranging from 11% to 34% compared to 2016 [25]. Consequently, it is imperative for the aquaculture industry to adapt and transform. This study investigates and compares ecological fisheries in Yangming Lake with traditional cage aquaculture and natural restoration waters, aiming to provide support for the development of fisheries in large water bodies, such as reservoirs and lakes.
Compared with the water quality during the cage culture period, the TN during the ecological fishery period dropped by 30%, and the TP also dropped significantly. The levels of N and P elements in the ecological fishery stage were comparatively lower than those observed during the natural recovery stage in Yangming Lake. We posit that this phenomenon can be attributed to the ecological fisheries’ ability to mitigate exogenous pollution from aquaculture, while simultaneously bioenriching N, P, and other elements. Afterwards, these enriched elements are effectively removed from the water body through fishing activities, thereby achieving a biologically controlled outcome. Theoretically, this difference can be attributed to the “trophic energy loss” mechanism in Lindeman’s (1942) energy flow theory—cage aquaculture relies on single high-trophic-level species, leading to unutilized feed energy being discharged into water bodies, whereas ecological fisheries directly convert phytoplankton energy through filter-feeding fish, reducing nutrient accumulation [82]. Li Wei and others compared the water quality changes in Xiaosihai during different fishery development periods, and found that TN and TP reached their highest levels under the cage culture mode of feeding and fertilizing [83]. However, Yangming Lake is different from XiaoSihai. XiaoSihai is a shallow lake that can control TN and TP through aquatic plants. Yangming Lake is a long and narrow, deep-water reservoir where emergent plants cannot grow. It is impossible to rely on aquatic plants to purify water quality. Experiments conducted and others in Qiandao Lake have shown that ecological fisheries can effectively reduce TN and TP [84]. TN and TP are important factors affecting phytoplankton abundance [85]. With the development of ecological fisheries, the number of phytoplankton in Yangming Lake has also declined significantly. The annual average number of phytoplankton in 2018 was 4.48 × 10⁷ ind./L, which was higher than the 5.76 × 10⁶ ind./L in the Yangtze Estuary monitored in the summer of 2018 [86]. Compared with 2018, the number of phytoplankton in Chongyi, which implements ecological fisheries, has dropped by 95.5% in 2022, while the number of phytoplankton in Shangyou waters, which has restored its natural restoration state, has dropped by 88.6% in 2022. This “predator-phytoplankton” cascading regulatory effect aligns with Paine’s (1966) trophic cascade theory, whereby filter-feeding fish inhibit algae through top-down effects on algal populations [87]. Figure 6 illustrates a schematic diagram of the pathways through which ecological fisheries mitigate nitrogen (N) and phosphorus (P) concentrations in water bodies.
From 2018 to 2022, the quantity of zooplankton also underwent a drastic change (Figure 2), and this change conforms to the cascading effect. After the implementation of the ecological fishery, a large number of filter-feeding fish were released, which affected zooplankton in two ways. Firstly, filter-feeding fish directly exert a top-down effect on zooplankton through predation. Secondly, the enhanced top-down effect of filter-feeding fish on phytoplankton leads to a weakened bottom-up effect of phytoplankton on zooplankton, thereby resulting in a decline in the quantity of zooplankton.
Moreover, the ecological fisheries management model has significantly enhanced fish diversity. In this study, analysis of the Shannon–Wiener diversity index, Pielou evenness index, and Margalef richness index reveals a significant improvement in fish resource abundance with the implementation of the YML ecological fishery and natural restoration. According to MacArthur’s (1955) species diversity–stability hypothesis and Pimm’s (1982) food web theory, the system omnivory index (SOI) of the ecological fishery system was significantly higher than that of other models, indicating that fish enhance food web redundancy and disturbance resistance through stratified utilization of plankton, benthic organisms, and organic detritus (i.e., niche differentiation) [85,88,89].
The stability of food webs is increasing and ecosystems are progressing towards maturity. According to MacArthur’s (1955) species diversity–stability hypothesis and Pimm’s (1982) food web theory, higher food web connectance index (FCI) and mean food chain length (FMPL) enhance a system’s resistance to disturbances through multiple energy pathways [88,89]. The highest trophic level serves as a pivotal indicator for assessing the complexity of food webs. Kaptai reservoir’ study indicated that the higher the trophic level indicated the longer the food chain [90]. This finding suggests that there was an increase in the abundance of apex predatory fish species in Yangming Lake following the implementation of the policy change. These carnivores were also key species, the same as the Santa Cruz reservoirs and the Umari reservoirs [91]. Because the number of top predators is small, they can apply predation pressure to other fish [92]. The Ecopath model provides important features regarding the maturity and stability of an ecosystem. Some of the theoretical attributes (Odum, 1969) related to the ecosystem’s development and maturity have been incorporated in Ecopath models to describe the ecosystem’s maturity, stability, and health (Christensen, 1995) [73,93]. TPP/TR is a crucial metric for evaluating the level of ecosystem maturity. The comparison of the TPP/TR between the ecosystems of different fishery zones reveals that the ecosystem of the ecological fishery zone exhibits a higher level of maturity (TPP/TR: 4.641). FCI and FMPL are important indicators for the stability of the food network [94,95]. We can see that the FCI and FMPL of YML have improved significantly after the management policy changes, indicating that the stability of the food network has improved. The food web stability in the ecological fishery area of Yangming Lake exceeds that observed in Qiandao Lake, Kaptai reservoir, and Lake Toya, as indicated by the FCI and FMPL indexes [40,90,95]. TST analysis reveals a reduction in the ecosystem energy scale of the ecofishery model, attributed to a decline in organic detritus and phytoplankton at the primary trophic level.
The objective of ecological fisheries is to achieve a harmonious balance between environmental conservation and sustainable fisheries development. Currently, our research on ecological fishery primarily focuses on the silver carp and bighead model; however, it is crucial to acknowledge that ecological fishery should not be limited solely to these species. Additionally, an issue arises when economic interests drive an unreasonable expansion of farming operations beyond the maximum ecological capacity, thereby jeopardizing the healthy development of ecosystems. In general, the economic value of fish tends to decrease with lower trophic levels. In China, bighead carp exhibit a higher economic value compared to silver carp. However, an imbalanced proportion of bighead carp driven by the pursuit of fishery economic benefits may lead to potential environmental issues. As water quality improves, we anticipate a decline in both ecological capacity and associated economic benefits for filter-feeding fish.
From our perspective, it is imperative to develop ecologically sustainable fisheries that demonstrate adaptability towards other economically valuable fish species in local aquatic ecosystems, thereby enhancing economic benefits. Simultaneously, careful consideration should be given to the stocking scale of fish in order to ensure optimal ecological carrying capacity.
Simultaneously, it is imperative to mitigate ecological risks associated with the introduction of economically valuable fish species in ecological fisheries [96]. Our investigation has unveiled a substantial upsurge in the tilapia population within the Yangming Lake protection area over the past five years. Based on our comprehensive examination, this surge in tilapia can be attributed to unregulated cage management practices resulting in inadvertent escape from neighboring farmers’ cages during the culture stage. Consequently, an extensive tilapia population has established itself within protected areas while remaining scarce in ecological fishery zones due to diminished system productivity and competition for an ecological niche. This serves as a cautionary reminder regarding the prudent introduction of species into fisheries [5].
Comparing the ecosystems of the protected areas and the ecological fishery areas, it was observed that various ecological indicators in the protected areas exhibited lower values compared to those in the ecological fishery areas. Many ecological theories suggest that invasive species are more likely to succeed in the early stages of drastic ecosystem changes—such as the shift from intensive cage aquaculture to other management models in this study. Hobbs and Huenneke (1992) noted that during ecosystem reconstruction (e.g., recovery after fires or human disturbances), the original community structure is disrupted, increasing resource availability, which allows invasive species to establish dominance by rapidly occupying ecological niches [97]. Shea and Chesson’s (2002) theory emphasizes that environmental disturbances (including ecosystem reconstruction) can release resources, reduce natural enemy pressures, or alter biotic interactions, thereby creating “niche opportunities” for invasive species [98,99]. This disparity may be attributed to tilapia’s rapid occupation of the ecological niche due to its superior fertility when compared to other native fish during ecosystem reconstruction [100]. Furthermore, this phenomenon highlights how changes in fisheries management can create a sensitive period wherein ecosystems become vulnerable. We posit that this is because the local ecosystem remains relatively stable, necessitating tilapia’s adaptation for survival. China currently finds itself in a unique phase with a 10-year fishing ban imposed on the Yangtze River—an unprecedented occurrence globally—which significantly impacts aquatic ecosystem reconstruction and stability. Consequently, the lack of ecological niches provides an opportunity for tilapia to invade [101]. The study conducted by Yin Chengjie et al. on Erhai Lake demonstrates that the presence of invasive alien fish leads to a range of issues, including ecosystem degradation [35].

5. Conclusions

This study investigates the impacts of diverse fishery patterns on the aquatic ecological environment, focusing on environmental factors, species diversity, and nutrient energy flow. The ecological fishery management model implemented at Yangming Lake not only enhances water quality but also promotes species diversity and ecosystem stability. Our findings indicate that the implementation of ecological fisheries for multiple fish species can effectively mitigate the issue of invasive alien species while improving water quality. These results provide substantial evidence for the sustainable development of fisheries, demonstrating that ecological fisheries can achieve a harmonious balance between fishery advancement and ecological preservation, in alignment with the “blue transformation” strategy advocated by the Food and Agriculture Organization of the United Nations [102].
Regarding the development of ecological fisheries, this study puts forward the following specific recommendations: (1) Prioritize the selection of native species and strictly prohibit the introduction of non-native species, with adaptive species screened based on the environmental characteristics of water bodies. For example, in eutrophic waters, native filter-feeding fish species such as silver carp (A. molitrix) and bighead carp (A. nobilis) can be scientifically stocked to enhance the regulatory capacity of water bodies for nitrogen and phosphorus; (2) Stocking density should be determined in combination with the habitat conditions of different water bodies. The Ecopath model should be used to quantitatively assess the ecological carrying capacity of water bodies, and based on the theory of maximum sustainable yield (MSY), the actual stocking density should be strictly controlled at 50% of the ecological carrying capacity threshold to maintain the dynamic balance of the structure and function of aquatic ecosystems [103,104].
This study contains specific limitations. The most significant limitation of Ecopath, which is the main model employed in this research, is that it requires a large number of input parameters as a basis. At the same time, it merely provides a description of the current situation, unable to offer the most direct evidence, nor can it describe direct causal relationships. Since the explanatory framework of this study predominantly relies on results from existing studies rather than detailed experimental manipulations to explore the mechanisms by which ecological fisheries mitigate nutrient levels in aquatic environments, it is necessary to combine long-term investigations [24,105,106,107]. To further enhance the effectiveness of ecological fisheries, we recommend the adoption of specific management practices that prioritize biodiversity and ecosystem health. Additionally, future research should explore the long-term effects of ecological fisheries on local ecosystems and investigate the role of native carnivorous fish in controlling invasive species, and utilize dynamic simulations with Ecosim to model the ecological impacts of Tilapia invasion under different management scenarios. By addressing these areas, we can better inform policies aimed at preserving aquatic ecosystems while promoting sustainable fisheries.

Supplementary Materials

The following supporting information can be downloaded at https://www.mdpi.com/article/10.3390/fishes10060246/s1, Table S1: Basic inputs and estimated parameters of Yangming Lake ecosystem; Table S2: Diet of Function 2018 in Yangming Lake of Chongyi; Table S3: Diet of function 2022 in Yangming Lake of Chongyi; Table S4: Diet of function 2022 in Yangming Lake of Shangyou.

Author Contributions

Conceptualization, H.G. and C.Y.; methodology, H.G. and X.W.; software, H.G.; validation, H.G. and X.F.; formal analysis, X.F.; investigation, H.G., Z.Y., and X.W.; resources, C.L.; data curation, X.W.; writing—original draft preparation, H.G.; writing—review and editing, H.G. and J.X.; visualization, H.G.; supervision, J.Y. and B.H.; project administration, X.F.; funding acquisition, X.F. and C.Y. All authors have read and agreed to the published version of the manuscript.

Funding

This research was funded by Jiangxi Province key research and development plan project (20223BBF61010) and Jiangxi Province agriculture, animal husbandry and fishery research guidance project, Large Water Surface Ecological Capacity Assessment and Water Purification Fishery Technology Research and Application (JXNMY202245).

Institutional Review Board Statement

Our research does not involve any experiments on live animals. However, the surveys in the protected areas involved in this study have obtained the fishery special fishing license from the Department of Agriculture and Rural Affairs of Jiangxi Province, China.

Informed Consent Statement

Not applicable.

Data Availability Statement

The data are not publicly available.

Acknowledgments

The authors sincerely express our gratitude to Guo Qin, Zhang Lele, and others from the Ganzhou Institute of Animal Husbandry and Fisheries for their strong support during the investigation of Yangming Lake.

Conflicts of Interest

The authors declare no conflicts of interest.

References

  1. Amoros, C.; Bornette, G. Connectivity and biocomplexity in waterbodies of riverine floodplains. Freshw. Biol. 2002, 47, 761–776. [Google Scholar] [CrossRef]
  2. Heymans, J.; Ulanowicz, R.; Bondavalli, C. Network analysis of the South Florida Everglades graminoid marshes and comparison with nearby cypress ecosystems. Ecol. Model. 2002, 149, 5–23. [Google Scholar] [CrossRef]
  3. Zhang, Y.; Qin, B.; Zhu, G.; Song, C.; Deng, J.; Xue, B.; Gong, Z.; Wang, X.; Wu, J.; Shi, K.; et al. Importance and main cological and environmental problems of lakes in China. Chin. Sci. Bull. 2022, 67, 3503–3519. [Google Scholar] [CrossRef]
  4. Zhang, Y.; Deng, J.; Qin, B.; Zhu, G.; Zhang, Y.; Jeppesen, E.; Tong, Y. Importance and vulnerability of lakes and reservoirs supporting drinking water in China. Fundam. Res. 2023, 3, 265–273. [Google Scholar] [CrossRef]
  5. Diana, J.S. Aquaculture Production and Biodiversity Conservation. BioScience 2009, 59, 27–38. [Google Scholar] [CrossRef]
  6. FAO. The State of World Fisheries and Aquaculture; Food and Agriculture Organization of the United Nations (FAO): Rome, Italy, 2014; ISBN 9789251082751. [Google Scholar]
  7. Naylor, R.L.; Goldburg, R.J.; Primavera, J.H.; Kautsky, N.; Beveridge, M.C.; Clay, J.; Folke, C.; Lubchenco, J.; Mooney, H.; Troell, M. Effect of aquaculture on world fish supplies. Nature 2000, 405, 1017–1024. [Google Scholar] [CrossRef]
  8. Charvet, P.; Occhi, T.V.T.; Faria, L.; Carvalho, B.M.; Pedroso, C.R.; Carneiro, L.; Freitas, M.O.; Petrere-junior, M.; Vitule, J.R.S. Tilapia farming threatens Brazil’s waters. Science 2021, 371, 356. [Google Scholar] [CrossRef]
  9. Withers, P.; Neal, C.; Jarvie, H.; Doody, D. Agriculture and Eutrophication: Where Do We Go from Here? Sustainability 2014, 6, 5853–5875. [Google Scholar] [CrossRef]
  10. Varol, M. Impacts of cage fish farms in a large reservoir on water and sediment chemistry. Environ. Pollut. 2019, 252, 1448–1454. [Google Scholar] [CrossRef]
  11. Marques, É.A.T.; da Silva, G.M.N.; de Oliveira, C.R.; Cunha, M.C.C.; Sobral, M.d.C. Assessing the negative impact of an aquaculture farm on effluent water quality in Itacuruba, Pernambuco, Brazilian semiarid region. Water Sci. Technol. 2018, 78, 1438–1447. [Google Scholar] [CrossRef]
  12. Veer, G.v.d.; Nentwig, W. Environmental and economic impact assessment of alien and invasive fish species in Europe using the generic impact scoring system. Ecol. Freshw. Fish 2015, 24, 646–656. [Google Scholar] [CrossRef]
  13. García Berthou, E. The characteristics of invasive fishes: What has been learned so far? J. Fish Biol. 2007, 71, 33–55. [Google Scholar] [CrossRef]
  14. Grabowska, J.; Kotusz, J.; Witkowski, A. Alien invasive fish species in Polish waters: An overview. Folia Zool. 2010, 59, 73–85. [Google Scholar] [CrossRef]
  15. Martinez, P.J.; Chart, T.E.; Trammell, M.A.; Wullschleger, J.G.; Bergersen, E.P. Fish species composition before and after construction of a main stem reservoir on the White River, Colorado. Environ. Biol. Fishes 1994, 40, 227–239. [Google Scholar] [CrossRef]
  16. Britton, J.R.; Davies, G.D.; Harrod, C. Trophic interactions and consequent impacts of the invasive fish Pseudorasbora parva in a native aquatic foodweb: A field investigation in the UK. Biol. Invasions 2010, 12, 1533–1542. [Google Scholar] [CrossRef]
  17. Budy, P.; Thiede, G.P.; Lobón-Cerviá, J.; Fernandez, G.G.; McHugh, P.; McIntosh, A.; Vøllestad, L.A.; Becares, E.; Jellyman, P. Limitation and facilitation of one of the world’s most invasive fish: An intercontinental comparison. Ecology 2013, 94, 356–367. [Google Scholar] [CrossRef]
  18. Hu, C.; Wan, C.; Ding, Q.; Pan, L.; Wu, S.; Gao, S. Effect of reservoir fisheries on water quality of Chinese reservoirs and bionomic control countermeasures. J. Lake Sci. 2010, 22, 161–168. [Google Scholar]
  19. Lazar, L.; Vlas, O.; Pantea, E.; Boicenco, L.; Marin, O.; Abaza, V.; Filimon, A.; Bisinicu, E. Black Sea Eutrophication Comparative Analysis of Intensity between Coastal and Offshore Waters. Sustainability 2024, 16, 5146. [Google Scholar] [CrossRef]
  20. Zhu, A.; Yu, Q.; Huang, X. Evaluation of the Nutritional Status of Water Bodies in Nine Large Reservoirs in the Yangtze River Basin. J. Hydroecol. 2001, 30–32. [Google Scholar] [CrossRef]
  21. Zang, C.; Huang, S.; Wu, M.; Du, S. Effect of fish stocking with bait on phytoplankton and water quality in Panjiakou Reservoir enclosures. Acta Sci. Circumstantiae 2011, 31, 525–532. (In Chinese) [Google Scholar] [CrossRef]
  22. Environmental Protection Industry Standards of the People’s Republic of China; Ministry of Ecology and Environment of the People’s Republic of China. Technical specifications for monitoring and evaluating algal bloom based on remote sensing and field monitoring(HJ 1098-2020). 2020. Available online: https://www.mee.gov.cn/ywgz/fgbz/bz/bzwb/other/qt/202002/t20200213_762889.shtml (accessed on 7 April 2022).
  23. Bișinicu, E.; Boicenco, L.; Pantea, E.; Timofte, F.; Lazăr, L.; Vlas, O. Qualitative Model of the Causal Interactions between Phytoplankton, Zooplankton, and Environmental Factors in the Romanian Black Sea. Phycology 2024, 4, 168–189. [Google Scholar] [CrossRef]
  24. Chen, J.; Liu, J.; Han, S.; Su, H.; Xia, W.; Wang, H.; Liu, Y.; Zhang, L.; Ke, Z.; Zhang, X.; et al. Nontraditional biomanipulation: A powerful ecotechnology to combat cyanobacterial blooms in eutrophic freshwaters. Innov. Life 2023, 1, 100038. [Google Scholar] [CrossRef]
  25. Liu, Z.; Li, F.; Xia, J. Research on Development Status, Issues and Countermeasures for Ecological Fishery of Large-Scale Water. Ecol. Econ. 2022, 38, 142–148. (In Chinese) [Google Scholar]
  26. Ye, S.; Yang, H.; Chen, Y.; Liu, J.; Hu, Z.; Bi, Y.; Li, Z. Analysis on the development strategies and key techniques of ecological fisheries in the Three Gorges Reservoir, China. Acta Hydrobiol. Sin. 2015, 39, 1035–1040. [Google Scholar] [CrossRef]
  27. Yu, X.; Wang, L. The Dilemma and Path Choice of Reservoir Fishery Sustainable Development Based on the Perspective of Ecology: Verified by the Illustration of Qiandao Lake Aquatic Environment Protection Oriented Fishery. Ecol. Econ. 2013, 143–147. [Google Scholar]
  28. Zhang, X. Development Status and Countermeasures of Cage Fish Farming Industry in Doushui Lake, Shangyou County. Mod. Agric. Sci. Technol. 2013, 12, 324–325. Available online: https://kns.cnki.net/kcms2/article/abstract?v=XMmmt_ij6VHME3s1JGji4HuMeuabbkhZsMtDQE90PknImgS67x81cIzCRoRWiotD34TLIQVLperu901TTO0YeUpRllTBGXEzFchWQes3nRUAgpgMJV-ObD14hnGGtZChlbkxzmHfk-BW900ykPZwjDChx-L9Re2olrwSYnFICJEo9QDvIwN9MA==&uniplatform=NZKPT&language=CHS (accessed on 7 March 2024). (In Chinese).
  29. He, Y.; Zhang, X. Thinking of Ecological Fisheries Development in Shangyou County. Jiangxi Fish. Sci. Technol. 2014, 1, 7–9. Available online: https://kns.cnki.net/kcms2/article/abstract?v=XMmmt_ij6VGBUjWAgBE_XdqwiARwgIhoTxXnNFEr4ReLv6V3-Q6SYvhDiOpiA4NdCX6jE5GeSsqOD4rn7pyeNidTT3_UO6rhA-ZPd2zrdTPlv8Yo_5IOc5RlerPCpxJBw0lEvyK_goZA9aVK5iV6S8F6ptjZ_qEhxIR4yBkcQVaU0RRw2w-VFw==&uniplatform=NZKPT&language=CHS (accessed on 7 October 2023).
  30. Yangming Lake Ganzhou City Jiangxi Province—Beauiful Rivers and Lakes. China Ecol. Civiliz. 2024, 62–63. (In Chinese)
  31. Christensen, V.; Pauly, D. Trophic Models of Aquatic Ecosystems; WorldFish: Penang, Malaysia, 1993; Volume 26. [Google Scholar]
  32. Liu, J.K. Studies on Ecology of the East Lake; Science Press: Beijing, China, 1995. [Google Scholar]
  33. Li, K.; Zhang, M.; Liu, X.; Yang, L.; Xue, T.; Ouyang, S.; Wu, X.P. Community structure and environmental determinants of Macrozoobenthos in the Doushui Lake Basin. Resour. Environ. Yangtze Val. 2019, 28, 939–949. [Google Scholar] [CrossRef]
  34. Philippsen, J.S.; Minte-Vera, C.V.; Coll, M.; Angelini, R. Assessing fishing impacts in a tropical reservoir through an ecosystem modeling approach. Rev. Fish Biol. Fish. 2019, 29, 125–146. [Google Scholar] [CrossRef]
  35. Yin, C.; Gong, L.; Chen, Y.; Ni, L.; Pitcher, T.J.; Kang, B.; Guo, L. Modeling ecosystem impacts of the invasive Japanese smelt Hypomesus nipponensis in Lake Erhai, southwestern China. Ecol. Inform. 2022, 67, 101488. [Google Scholar] [CrossRef]
  36. Dianneke, V.W.; Kong, X.; Knap, H.; Janssen, A.B.G. A serious game approach for lake modeling and management: The EscapeBLOOM. Environ. Model. Softw. 2024, 173, 105941. [Google Scholar] [CrossRef]
  37. Gianni, B.; Francesca, L.M.; Teresa, M.; Ceferina, V.; Giuseppe, P.; Anna, N. The quality of meat in milk fed lambs is affected by the ewe diet: A review. Meat Sci. 2024, 207, 109374. [Google Scholar] [CrossRef]
  38. Yang, T.; Li, D.; Xu, Q.; Zhu, Y.; Zhu, Z.; Leng, X.; Zhao, D.; An, S. Effects of a Fishing Ban on the Ecosystem Stability and Water Quality of a Plateau Lake: A Case Study of Caohai Lake, China. Water 2024, 16, 782. [Google Scholar] [CrossRef]
  39. Xiang, M.; Liu, H.; Wei, N.; Meng, Z.; Hu, F.; Li, X. Comparing Ecosystem Structure and Function of the Geheyan Reservoir Based on the Ecopath Model After a Fishing Ban. Fishes 2025, 10, 168. [Google Scholar] [CrossRef]
  40. Deng, Y.; Zheng, Y.; Chang, J. Evaluation of the effect of stocking silver carp and binghead carp on the ecosystem of Qiandao Lake using Ecopath model. Acta Ecol. Sin. 2022, 42, 6853–6862. [Google Scholar] [CrossRef]
  41. Moutopoulos, D.K.; Douligeri, A.S.; Ziou, A.; Kiriazis, N.; Korakis, A.; Petsis, N.; Katselis, G.N. A Modelling Approach for the Management of Invasive Species at a High-Altitude Artificial Lake. Limnol. Rev. 2024, 24, 1–16. [Google Scholar] [CrossRef]
  42. Gubiani, É.A.; Angelini, R.; Vieira, L.C.G.; Gomes, L.C.; Agostinho, A.A. Trophic models in Neotropical reservoirs: Testing hypotheses on the relationship between aging and maturity. Ecol. Model. 2011, 222, 3838–3848. [Google Scholar] [CrossRef]
  43. Ouyang, Y. Ecological safety Assessment and Research of the Lake of Doushui Based on F-IBI and Nutrient Criterion. Master’s Thesis, Nanchang University, Nanchang, China, 2018. (In Chinese). [Google Scholar]
  44. Christensen, V.; Walters, C.J. Ecopath with Ecosim: Methods, capabilities and limitations. Ecol. Model. 2004, 172, 109–139. [Google Scholar] [CrossRef]
  45. Ishikawa, M.; Gurski, L.; Bleninger, T.; Rohr, H.; Wolf, N.; Lorke, A. Hydrodynamic Drivers of Nutrient and Phytoplankton Dynamics in a Subtropical Reservoir. Water 2022, 14, 1544. [Google Scholar] [CrossRef]
  46. Beheshti, K.M.; Smith, R.S.; Raimondi, P.; Reed, D. Sensitivity analysis to reduce sampling effort of a long-term monitoring program. Ecol. Indic. 2024, 158, 111585. [Google Scholar] [CrossRef]
  47. Paterson, M.J.; Beaty, K.G.; Findlay, D.L.; Findlay, W.J.; Schiff, S.L.; St. Louis, V.L.; Venkiteswaran, J.J. Long-term changes in nutrient dynamics and plankton communities following the creation of a new reservoir. Can. J. Fish. Aquat. Sci. 2019, 76, 1459–1469. [Google Scholar] [CrossRef]
  48. Burford, M.A.; Green, S.A.; Cook, A.J.; Johnson, S.A.; Kerr, J.G.; O’Brien, K.R. Sources and fate of nutrients in a subtropical reservoir. Aquat. Sci. 2012, 74, 179–190. [Google Scholar] [CrossRef]
  49. Christensen, V.; Walters, C.; Pauly, D. Ecopath with Ecosim: A User’s Guide. 2005. Volume 12. Available online: https://ecopath.org/ (accessed on 7 May 2022).
  50. Polovina, J. An overview of the ECOPATH model. Fishbyte 1984, 2, 5–7. [Google Scholar]
  51. Wu, Y.; Li, H.; Liao, F.; Yang, X.; Xie, Z.; Song, R. Fishes of Hunan; Science Press: Beijing, China, 2021. [Google Scholar]
  52. Guo, Y.; Sun, Z.; He, X.; Jin, W.; Chen, Y. Colored Atlas of Fishes in Sichuan; Science Press: Beijing, China, 2021. [Google Scholar]
  53. Wang, S. Fishes of Jiangxi; Jiangxi Science and Technology Press: Nanchang, China, 2020. (In Chinese) [Google Scholar]
  54. Wang, Y. Atlas of Common Aquatic Organism in China Basin; Science Press: Beijing, China, 2020. (In Chinese) [Google Scholar]
  55. Palomares, M.L.D.; Pauly, D. Predicting food consumption of fish populations as functions of mortality, food type, morphometrics, temperature and salinity. Mar. Freshw. Res. 1998, 49, 447–453. [Google Scholar] [CrossRef]
  56. Beverton, R.J.H.; Holt, S.J. A Review of Methods for Estimating Mortality Rates in Exploited Fish Populations, with Special Reference to Sources of Bias in Catch Sampling. Agric. Sci. 1956, 140, 67–83. [Google Scholar]
  57. Chang, J.; Sun, J.; Duan, Z.; Xiang, Y. Study on The Population Growth and mortality of Paracanthobrama Guichenoti Bleeker in Wanghu Lake. Acta Hydrobiol. Sin. 1994, 18, 10. [Google Scholar] [CrossRef]
  58. Jin, Q.; Song, X. The preliminary investigation of the biological characteristics of the Rhinogobius giurinus in Paiyang Lake. Hebei Fish. 2013, 6–8. [Google Scholar] [CrossRef]
  59. Tang, J. Studies on Fisheries Ecology in a Large Yunnan Plateau Lake, Lake Erhai, China; The Chinese Academy of Sciences: Wuhan, China, 2013. [Google Scholar]
  60. Yang, D.; Chen, F.; Changyan, F.; Luo, J. Studies on age and growth of Channa asiatica. J. Fish. Sci. China 1999, 6, 10–13. (In Chinese) [Google Scholar]
  61. Chen, D. Yangtze River Aquatic Biological Resources Monitoring Manual; China Agriculture Press: Beijing, China, 2021. [Google Scholar]
  62. Ministry of Ecology and Environment (China). Water Quality—Determination of Phytoplankton—Filtration Membrane-Microscope Counting Method. 2021, HJ1215. Available online: https://www.mee.gov.cn/ywgz/fgbz/bz/bzwb/jcffbz/202201/W020220121590258111680.pdf (accessed on 7 May 2022).
  63. SC/T 9102.3-2007; Specification for Ecological Environment Monitoring of Fisheries. Part 3: Freshwater. National Library of Digital Standards: Beijing, China, 2007. Available online: https://www.ndls.org.cn/standard/detail/748ebe4b689fbe01399797d8fa505998 (accessed on 10 April 2022).
  64. Moraes, C.R.F.d.; Attayde, J.L.d.; Henry-Silva, G.G. Stable isotopes of C and N as dietary indicators of Nile tilapia (Oreochromis niloticus) cultivated in net cages in a tropical reservoir. Aquac. Rep. 2020, 18, 100458. [Google Scholar] [CrossRef]
  65. Xu, J.; Wang, S.; Huang, H.; Yao, X.; Zhao, K.; Qiu, B.; Dai, M. Research on spatial difference of diet of cultured abalone by stable carbon and nitrogen isotope. J. Fuzhou Univ. (Nat. Sci. Ed.) 2017, 45, 454–458. [Google Scholar]
  66. Xu, J. Ecological Studies on the Food Web Structures and Trophic Relationships of Freshwater Lakes in China Using Stable Carbon and Nitrogen Isotopes. Ph.D. Thesis, Institute of Hydrobiology, Chinese Academy of Sciences, Wuhan, China, 2006. [Google Scholar]
  67. Deehr, R.A.; Luczkovich, J.J.; Hart, K.J.; Clough, L.M.; Johnson, B.J.; Johnson, J.C. Using stable isotope analysis to validate effective trophic levels from Ecopath models of areas closed and open to shrimp trawling in Core Sound, NC, USA. Ecol. Model. 2014, 282, 1–17. [Google Scholar] [CrossRef]
  68. Pinkas, L.; Oliphant, M.S.; Iverson, I.L.K. Fish Bulletin 152. Food Habits of Albacore, Bluefin Tuna, and Bonito In California Waters. Scripps Inst. Oceanography Library. 1970. Available online: https://escholarship.org/uc/item/7t5868rd (accessed on 20 September 2022).
  69. Ulanowicz, R.; Puccia, C. Mixed trophic impacts ecosystems. Coenoses 1990, 5, 7–16. [Google Scholar]
  70. Valls, A.; Coll, M.; Christensen, V. Keystone species: Toward an operational concept for marine biodiversity conservation. Ecol. Monogr. 2015, 85, 29–47. [Google Scholar] [CrossRef]
  71. Libralato, S.; Christensen, V.; Pauly, D. A method for identifying keystone species in food web models. Ecol. Model. 2006, 195, 153–171. [Google Scholar] [CrossRef]
  72. Barausse, A.; Duci, A.; Mazzoldi, C.; Artioli, Y.; Palmeri, L. Trophic network model of the Northern Adriatic Sea: Analysis of an exploited and eutrophic ecosystem. Estuar. Coast. Shelf Sci. 2009, 83, 577–590. [Google Scholar] [CrossRef]
  73. Odum, E.P. The Strategy of Ecosystem Development: An understanding of ecological succession provides a basis for resolving man’s conflict with nature. Science 1969, 164, 262–270. [Google Scholar] [CrossRef]
  74. Pielou, E.C. Ecological Diversity; John Wiley & Sons, Ltd.: New York, NY, USA, 1975; Volume 22, p. 174. [Google Scholar]
  75. Wilhm, J.L. Use of Biomass Units in Shannon’s Formula. Ecology 1968, 49, 153–156. [Google Scholar] [CrossRef]
  76. Morissette, L. Complexity, cost and quality of ecosystem models and their impact on resilience: A comparative analysis, with emphasis on marine mammals and the Gulf of St. Lawrence. Ph.D. Thesis, University of Brithish Columbia, Vancouver, BC, USA, 2007. [Google Scholar]
  77. Tao, T.; Xin, K. Public health: A sustainable plan for China’s drinking water. Nature 2014, 511, 527–528. [Google Scholar] [CrossRef]
  78. Dauda, A.B.; Ajadi, A.; Tola-Fabunmi, A.S.; Akinwole, A.O. Waste production in aquaculture: Sources, components and managements in different culture systems. Aquac. Fish. 2019, 4, 81–88. [Google Scholar] [CrossRef]
  79. Liu, G.-F.; Xu, P.; Wu, X.; Xu, Z.-H.; Xu, Z.-H. Present condition of aquaculture nitrogen and phosphorus environmental pollution and future development strategy. Jiangsu J. Agric. Sci. 2018, 34, 225–233. [Google Scholar]
  80. The State Council Information Office of the People’s Republic of China Development of China’s Distant-Water Fisheries. Beijing, China; 2023. Available online: https://www.gov.cn/zhengce/202310/content_6911268.htm (accessed on 29 October 2023).
  81. Zhao, K.; Zhang, M.; Wang, K.; Zhu, K.; Xu, C.; Xie, J.; Xu, J. Aquaculture Impacts on China’s Marine Wild Fisheries Over the Past 30 Years. Front. Mar. Sci. 2021, 8, 710124. [Google Scholar] [CrossRef]
  82. Lindeman, R.L. The Trophic-Dynamic Aspect of Ecology. Ecology 1942, 23, 399–417. [Google Scholar] [CrossRef]
  83. Li, X.; Meng, Z.; HU, F.; Zhu, Y.; Yang, D. Nitrogen and phosphorus emissions from cage fish culture. Freshw. Fish. 2020, 50, 39–46. [Google Scholar] [CrossRef]
  84. Rao, C.; Wu, X.; Liu, Q.; Wang, J.; Pan, J. Study on the influence of cage fish culture on water environment of Qiandao Lake. Agric. Technol. 2022, 42, 119–121. (In Chinese) [Google Scholar] [CrossRef]
  85. Zhang, M.; Zhou, Y.; Xie, P.; Xu, J.; Li, J.; Zhu, D.; Xia, T. Impacts of cage-culture of Oreochromis niloticus on organic matter content, fractionation and sorption of phosphorus, and alkaline phosphatase activity in a hypereutrophic lake, People’s Republic of China. Bull. Environ. Contam. Toxicol. 2004, 73, 927–932. [Google Scholar] [CrossRef]
  86. Shao, H.; Wang, Q.; Gao, C.; Zhao, J. Analysis of phytoplankton community characteristics and influencing factors in the Yangtze River Estuary. J. Dalian Ocean Univ. 2024, 39, 124–133. [Google Scholar] [CrossRef]
  87. Paine, R.T. Food Web Complexity and Species Diversity. Am. Nat. 1966, 100, 65–75. [Google Scholar] [CrossRef]
  88. MacArthur, R. Fluctuations of Animal Populations and a Measure of Community Stability. Ecology 1955, 36, 533–536. [Google Scholar] [CrossRef]
  89. Pimm, S.L. Food Webs; University of Chicago Press: Chicago, IL, USA, 2002. [Google Scholar]
  90. Khatun, M.H.; Barman, P.P.; Yi, J.; Lupa, S.T.; Zahangir, M.M.; Liu, Q. A preliminary snapshot of the trophic model and ecosystem attributes of Kaptai reservoir ecosystem, Bangladesh. J. Oceanol. Limnol. 2021, 39, 223–241. [Google Scholar] [CrossRef]
  91. Moura, R.S.T.d.; Angelini, R.; Henry-Silva, G.G. Interactions between cage fish farms and fishing in Brazilian semiarid reservoirs: An ecosystemic approach. Aquaculture 2023, 575, 739714. [Google Scholar] [CrossRef]
  92. Thomaz, S.M.; Kovalenko, K.E.; Havel, J.E.; Kats, L.B. Aquatic invasive species: General trends in the literature and introduction to the special issue. Hydrobiologia 2015, 746, 1–12. [Google Scholar] [CrossRef]
  93. Christensen, V. Ecosystem maturity—Towards quantification. Ecol. Model. 1995, 77, 3–32. [Google Scholar] [CrossRef]
  94. Brandão, H.; Lobón-Cerviá, J.; Ramos, I.P.; Souto, A.C.; Nobile, A.B.; Zica, É.d.O.P.; Carvalho, E.D. Influence of a cage farming on the population of the fish species Apareiodon affinis (Steindachner, 1879) in the Chavantes reservoir, Paranapanema River SP/PR, Brazil. Acta Limnol. Bras. 2012, 24, 438–448. [Google Scholar] [CrossRef]
  95. Hossaina, M.M.; Matsuishia, T.; Arhonditsisb, G. Elucidation of ecosystem attributes of an oligotrophic lake in Hokkaido, Japan, using Ecopath with Ecosim (EwE). Ecol. Model. 2010, 221, 1717–1730. [Google Scholar] [CrossRef]
  96. Xiong, W.; Guo, C.; Gozlan, R.E.; Liu, J. Tilapia introduction in China: Economic boom in aquaculture versus ecological threats to ecosystems. Rev. Aquac. 2022, 15, 179–197. [Google Scholar] [CrossRef]
  97. Hobbs, R.J.; Huenneke, L.F. Disturbance, Diversity, and Invasion: Implications for Conservation. Conserv. Biol. 1992, 6, 324–337. [Google Scholar] [CrossRef]
  98. Shea, K.; Chesson, P.; Shea, K.; Chesson, P. Community ecology theory as a framework for biological invasions. Trends Ecol. Evol. 2002, 17, 170–176. [Google Scholar] [CrossRef]
  99. Guo, Q.; Brockway, D.G.; Larson, D.L.; Wang, D.; Ren, H. Improving Ecological Restoration to Curb Biotic Invasion—A Practical Guide. Invasive Plant Sci. Manag. 2018, 11, 163–174. [Google Scholar] [CrossRef]
  100. Li, J.; Wang, J.; LIU, Z.; LIU, Q.; Guo, C.; Liao, C.; LI, W.; Guo, C.; ZHang, T.; Liu, J. Comparative Study on Reproductive Biology of Two Coinvasion Tilapia Species in the Shanmei Reservoir. Acta Hydrobiol. Sin. 2023, 47, 657–665. (In Chinese) [Google Scholar] [CrossRef]
  101. Henson, M.N.; Derek Aday, D.; Rice, J.A.; Layman, C.A. Assessing the Influence of Tilapia on Sport Fish Species in North Carolina Reservoirs. Trans. Am. Fish. Soc. 2018, 147, 350–362. [Google Scholar] [CrossRef]
  102. FAO. The State of World Fisheries and Aquaculture 2022: Towards Blue Transformation; FAO: Rome, Italy, 2022. [Google Scholar]
  103. Yang, C.; Liu, Q.; Wang, Y. Assessment of the Maximum Sustainable Yield of Portunus trituberculatus in the Northern Areas of the East China Sea Under the Impact of Stock Enhancement. Oceanol. Limnol. Sin. 2022, 53, 1219–1224. [Google Scholar]
  104. Fan, Z.Y.; Bai, X.L., Xu; Wang, X.N.; Lv, Y.B.; Hou, J.; He, X.G. Analysis of ecological system characteristics and ecological capacity of Hypophthalmichthys molitrix and Aristichthys nobilis in the Weishui Reservoir based on Ecopath model. J. Fish. Sci. China 2021, 28, 773–784. [Google Scholar] [CrossRef]
  105. Zhang, Y.; Chen, L.; Guo, Y.; Zhu, Y.; Yu, J. The effects of microorganisms on the migration and transformation of nitrogen in the polyculture system of Plagiogathops microlepis Bleeker, Hypophthalmichthys molitrix and Aristichthys nobilis. China Environ. Sci. 2021, 42, 897–906. [Google Scholar] [CrossRef]
  106. Keramidas, I.; Dimarchopoulou, D.; Ofir, E.; Scotti, M.; Tsikliras, A.C.; Gal, G. Ecotrophic perspective in fisheries management: A review of Ecopath with Ecosim models in European marine ecosystems. Front. Mar. Sci. 2023, 10, 1182921. [Google Scholar] [CrossRef]
  107. Coll, M.; Bundy, A.; Shannon, L.J. Ecosystem Modelling Using the Ecopath with Ecosim Approach. In Computers in Fisheries Research; Megrey, B.A., Moksness, E., Eds.; Springer: Dordrecht, The Netherlands, 2009; pp. 225–291. [Google Scholar]
Figure 1. Location of Yangming Lake and its sampling sites.
Fishes 10 00246 g001
Figure 2. TN is the total nitrogen content (unit: μg/L). TP is total phosphorus content (unit: μg/L). CODMn is the permanganate index (unit: μg/L). Phytoplankton is the number of phytoplankton (unit: 104 ind./L). Zooplankton is the number of zooplankton (unit: ind./L). A is 2018 Chongyi; B is 2022–2023 Chongyi; C is 2022–2023 Shangyou (2022 SYL).
Fishes 10 00246 g002
Figure 3. Distinct color-coded areas represented the assessment of fish resources in different time periods and spatial divisions in Yangming Lake. A is 2018 Chongyi; B is 2022–2023 Chongyi; C is 2022–2023 Shangyou (2022 SYL). (Catch index = log2(weigh) + 1).
Fishes 10 00246 g003
Figure 4. Food network diagram of Chongyi Yangming Lake. Each circle indicates the functional group. (A) is 2018 Yangming Lake of Chongyi; (B) is 2022 Yangming Lake of Chongyi, and (C) is 2022 Yangming Lake of Shangyou. In B, the black circles represent captures.
Fishes 10 00246 g004
Figure 5. This is Yangming Lake ecosystem model Biomass energy pyramid. The different colors indicate the existing biomass at different trophic levels.
Fishes 10 00246 g005
Figure 6. Modeling of ecological fisheries impacts on water quality. (Note: N refers to nitrogen elements in water, and P refers to phosphorus elements in water.).
Fishes 10 00246 g006
Table 1. Key changes in fisheries management measures in the Yangtze River Basin and Yangming Lake (2017–2023).
YearPolicy/EventImpact on Fisheries in Yangming Lake (Jiangxi Province)Wider Context/Policy Drivers
Pre-
2017
Cage fishing dominant in Yangming Lake.Traditional cage farming using feed and cages was the primary fishery mode, introducing non-native species and contributing to water quality degradation (e.g., eutrophication from nutrient inputs).Global concerns over aquaculture’s ecological impacts (e.g., cage fisheries linked to biodiversity loss and water pollution) [8,9,10,11,19].
2018Ecological fisheries pilot launched in Yangming Lake.Shangyou County and Chongyi County initiated ecological fisheries via two fishery companies, shifting to “human-stocked, naturally-grown” models without feed/fertilizer/cages.China’s growing emphasis on ecological protection; Jiangxi Province’s role in Yangtze River Basin sustainability [23,24].
2020Yangtze River Basin decade-long fishing ban implemented.Shangyou County’s portion of Yangming Lake halted all fishery activities (including ecological fisheries) due to the ban.Nationwide policy to prohibit natural water fishing/aquaculture, aiming to restore aquatic ecosystems [31,32].
Chongyi County continued ecological fisheries (selective stocking of filter-feeding fish like silver carp/bighead carp).Aligned with UN Sustainable Development Goals (SDGs) for life below water (SDG 14).
2023Yangming Lake listed as “Second Batch of Outstanding Cases of Beautiful River and Lakes”.Ecological fisheries in Chongyi County demonstrated improved water quality and biodiversity, serving as a model for sustainable fishery practices under the ban.National recognition of successful ecosystem restoration; policy emphasis on balancing fishery development with ecological conservation [29].
Note: The “decade-long fishing ban” (2020–2030) is a unified national policy, but implementation varied locally (e.g., the ten-year fishing ban in Jiangxi Province began in January 2020, one year earlier than the national ban).
Table 2. Model groups in Ecopath models of 2018 Yangming Lake.
No.Function GroupCodeComposition
1Bottom piscivorousBOPSiniperca scherzeri
2Yellow-head catfishPELPelteobagrus eupogon, P. nitidus, Tachysurus fulvidraco, Pseudobagrus tenuis
3Paracanthobrama guichenoti BleekerPGBParacanthobrama guichenoti Bleeker
4XenocyprisXENXenocypris davidi, Xenocyprisargentea, Xenocypris microlepis
5Hemibarbus maculatusHESHemibarbus maculatus
6HemiculterHEMHemiculter leucisculus,
7CrucianCARCarassius auratus
8Other fishOTFAbbottina rivularis, Acheilognathus chankaensis, Rhodeus ocellatus, Pseudobrama simoni
9GobyRhIRhinogobius giurinus
10Silver gobioSQASqualidus argentatus,
11BreamMPCMegalobrama amblycephala, Parabramis pekinensis, Ctenopharyngodon idella
12Silver carpSICHypophthalmichthys molitrix
13Bighead carpBICAristichthys nobilis
14BenthosBEHAnodonta, bellamya, Chironomid, Annelida, Arthropoda
15ZooplanktonZOPRotifera, Cladocera, Copepods
16PhytoplanktonPHPCyanophyta, Bacillariophyta, Chlorophyta
17DetritusDETDetritus
Note: Fish appraisal is based on Jiangxi fish, Hunan fish, and Sichuan fish [51,52,53]. Floating organisms, benthic organisms reference is Atlas of Common Aquatic Organism in China Basin [54].
Table 3. Model groups in Ecopath models of 2022–2023 Yangming Lake.
SYLCYL
No.Function GroupCodeCompositionNo.Function GroupCodeComposition
1Large carnivorous fishElBElopichthys bambusa1Large carnivorous fishElBElopichthys bambusa
2CulterCUTCultrichthys erythropterus, Culter alburnus, Culter dabryi dabryi2CulterCUTCultrichthys erythropterus, Culter alburnus, Culter dabryi dabryi
3Botton piscivorousBOPSiniperca scherzeri, Channa asiatica3Botton piscivorousBOPSiniperca scherzeri, Channa asiatica
4OpsariichthysOPSOpsariichthys bidens, Zacco platypus4Yellow-head catfish meatPELPelteobagrus fulvidraco, Pelteobagrus vachelli,
5IcefishICFNeosalanx taihuensis5Sinibrama macropsSINSinibrama macrops
6Yellow-head catfish meatPELPelteobagrus fulvidraco, Pelteobagrus vachelli, 6XenocyprisXENXenocypris davidi, Distoechodon tumirostrisPeters, Xenocyprisargentea
7Sinibrama macropsSINSinibrama macrops7GobioHESHemibarbus maculatus, Hemibarbus labeo, Saurogobio dabryi
8XenocyprisXENXenocypris davidi, Distoechodon tumirostrisPeters, Xenocyprisargentea8HemiculterHEMHemiculter leucisculus,
9GobioHESHemibarbus maculatus, Hemibarbus labeo, Saurogobio dabryi9TilapiaTILCoptodon zillii, Tilapia galilaea
10HemiculterHEMHemiculter leucisculus10CrucianCARCarassius auratus
11TilapiaTILCoptodon zillii, Tilapia galilaea11Other fishOTFRhodeus ocellatus, Acheilognathus macropterus, Abbottina rivularis,
12CrucianCARCarassius auratus12CarpCYPCyprinus carpio, Cyprinus carpiouar singuonensis
13Other fishOTFRhodeus ocellatus, Acheilognathus macropterus, Abbottina rivularis13GobyRhIRhinogobius giurinus
14CarpCYPCyprinus carpio, Cyprinus carpiouar singuonensis14Silver GobioSQASqualidus argentatus,
15GobyRhIRhinogobius giurinus15BreamMPCMegalobrama amblycephala, Parabramis pekinensis, Ctenopharyngodon idella
16silver GobioSQASqualidus argentatus16Silver carpSICHypophthalmichthys molitrix
17BreamMPCMegalobrama amblycephala, Parabramis pekinensis, Ctenopharyngodon idella17Bighead carpBICAristichthys nobilis
18Silver carpSICHypophthalmichthys molitrix18ShrimpsSHPMacrobrachium nipponens
19Bighead carpBICAristichthys nobilis19BenthosBEHAnodonta, bellamya, Chironomid, Annelida, Arthropoda
20ShrimpsSHPMacrobrachium nipponens20ZooplanktonZOPRotifera, Cladocera, Copepds
21BenthosBEHAnodonta, bellamya, Chironomid, Annelida, Arthropoda21PhytoplanktonPHPCyanophyta, Bacillariophyta, Chlorophyta
22ZooplanktonZOPRotifera, Cladocera, Copepodas22DetritusDETDetritus
23PhytoplanktonPHPCyanophyta, Bacillariophyta, Chlorophyta
24DetritusDETDetritus
Note: Fish appraisal is based on Jiangxi fish, Hunan fish and Sichuan fish [51,52,53]. Floating organisms, benthic organisms reference is Atlas of Common Aquatic Organism in China Basin [54].
Table 4. Fish community diversity index.
2018 CYL2022 CYL2022 SYL
H′2.1982.5792.823
J′0.6750.7580.770
D4.1694.2825.033
Table 5. Summary of system statistics for Yangming Lake food web models. A: 2018 Chongyi. B: 2022–2023 Chongyi. C: 2022–2023 Shangyou. TC is throughput cycled.
Parameter (Unit)ABC
SC (t/km2/year)1310.6785438.054553.905
SE (t/km2/year)19,178.8503029.2874523.993
SRF (t/km2/year)546.743832.031530.638
SFID (t/km2/year)19,634.5605039.5435565.581
TST (t/km2/year)40,670.83014,338.9115,174.120
SP (t/km2/year)19,885.9704724.4846053.789
CNPP (t/km2/year)19,725.6003861.65054.616
TPP/TR (t/km2/year)36.0784.6411749.526
NSP (t/km2/year)19,178.8603029.5694523.978
TPP/TB93.16730.04657.575
TB (excluding detritus) (t/km2)211.724128.522887.792
CI0.242 0.225 0.214
SOI0.086 0.175 0.158
TC (including detritus) (t/km2/year)222.02920.000 1342.000
FCI (% of total throughput)0.546 19.030 8.845
FMPL2.062 3.975 3.002
Ecopath pedigree0.4190.6670.689
Disclaimer/Publisher’s Note: The statements, opinions and data contained in all publications are solely those of the individual author(s) and contributor(s) and not of MDPI and/or the editor(s). MDPI and/or the editor(s) disclaim responsibility for any injury to people or property resulting from any ideas, methods, instructions or products referred to in the content.

