Abstract
This study investigates the biochemical and physiological responses of the economically important fish Barbonymus gonionotus to acute temperature fluctuations. Focusing on malondialdehyde (MDA) levels in serum and visceral organs, serum biochemical indices, hematological parameters, cortisol levels, and operculum movement, this research assessed the impacts of thermal stress. Experimental conditions involved two thermal regimes: heat shock at 25–29 °C and 25–37 °C; as well as cold shock at 25–21 °C and 25–13 °C sustained over 24 (D1), 48 (D2), and 72 (D3) h. Serum MDA levels increased significantly. Notably, MDA in the gills, brain, and liver fluctuated under cold stress, particularly at 13 °C. Serum parameters showed significant alterations except for AST, total protein, and cholesterol, which remained unaffected by heat shock. Red blood cell (RBC) counts dropped to their lowest at 13 °C, while white blood cell (WBC) counts diminished significantly when temperatures dropped to 21 °C and then stabilized. Cortisol surged with temperature changes, peaking at 13 °C and 29 °C for cold and heat shock, respectively. Operculum movement was inversely affected by thermal changes, decreasing with cold and increasing with heat. These findings underscore the sensitivity of silver barb to thermal extremes, providing insights for optimized aquaculture management and enhanced resilience to environmental stressors.
Key Contribution:
A study on silver barb examined the effects of temperature shocks on physiological parameters, focusing on malondialdehyde (MDA) levels across various tissues. The highest MDA levels were observed in serum under all conditions, including normal, cold, and hot environments, indicating that blood samples alone can suffice for such studies, reducing the need for fish sacrifice. A critical threshold for cold shock was identified at 13 °C, while temperatures over 33 °C were found to be stressful for the fish. The optimal temperature range for their survival is between 17 °C and 33 °C.
1. Introduction
Climate change is an urgent global issue that significantly impacts the Earth’s ecosystem. It is one of the major causes of global warming, with human lifestyle behaviors being a primary consequence. Rising temperatures on Earth are linked to extreme situations such as rising sea levels, climate variability, and more frequent and severe weather events. According to the World Meteorological Organization [1], these phenomena are becoming the new normal. For example, there have been serious worldwide events, including Arctic outbreaks in Texas and heatwaves in many states across the USA. Moreover, it is difficult to predict in which areas such incidents will occur [2,3].
In 2021, the “Germanwatch” organization reported that Thailand ranked 9th out of 180 nations in terms of the highest long-term climate risk (CRI) from 2000 to 2019 [4]. Thailand has a tropical climate that is hot and humid all year round. In March to May, the highest temperatures are typically observed within the range of 23–37 °C; however, in the past 10 years, temperatures have often risen above 40 °C. Thailand is also occasionally subject to cold air masses from northern countries, bringing about a rapid decrease in temperature for short periods. Data from the Thai Meteorological department have shown that the lowest temperature during the summer was 12 °C in 2011 and 10.2 °C in 2016 [5]. Rapid temperature fluctuations result in variability in water temperature, which can induce physiological stress in aquatic animals [6].
There is evidence that temperature changes cause physiological responses and increased oxidative stress in fish. Both heat stress and cold shock can induce metabolic changes through oxidative stress when experienced by diverse species of fish [7]. The excessive production of reactive oxygen species (ROS) negatively affects biological molecules through multiple processes such as lipid peroxidation and protein carbonylation [8]. Although lipid peroxidation plays a key role in animal homeostasis, this is more accentuated by the stimulation of ROS overproduction, which results in the creation of a secondary output; namely, malondialdehyde (MDA) [9]. Many researchers have reported that oxidative stress is related to elevated values of MDA in various organs of fish—such as the gills, intestine, and liver—under different conditions, including changes in many environmental factors [10,11]. Additionally, serum biochemical indices such as alanine transaminase (ALT), aspartate transaminase (AST), blood urea nitrogen (BUN), glucose, total protein, and cholesterol are commonly utilized to assess the impacts of abrupt increases or decreases in water temperature. These indices are valuable tools for evaluating stress responses in aquatic animals due to their ability to provide insight into the physiological and metabolic state of the organism, as well as the use of hematological indices such as red blood cells (RBCs), whose primary function is to transport oxygen, and white blood cells (WBCs), which are essential for protecting the body against infections. The hormone cortisol is predominantly produced in response to physiological stress. Its primary functions encompass the regulation of metabolic processes, modulation of inflammatory responses, maintenance of blood glucose levels, and facilitation of the body’s adaptation to stress. Moreover, operculum movement is used to evaluate these effects of environmental changes, serving as a direct indicator of respiratory distress and physiological adjustments under stress [12,13,14,15].
Silver barb, Barbonymus gonionotus (Bleeker, 1849), with the local name “Pla tapien khao” in Thai, is a species belonging to the family Cyprinidae. This species is distributed throughout Asia: the Mekong and Chao Phraya basins, the Malay Peninsula, Sumatra, and Java [16]. B. gonionotus lives at midwater to bottom depths in rivers, streams, floodplains, and occasionally in reservoirs, and feeds on plant matter and invertebrates [17]. The unique characteristics of this fish are that its body is strongly compressed, its back is elevated, and its dorsal profile is arched, often being concave above the occiput. Thailand stands out as a major producer and consumer of this fish [18]. This fish is more often cultured because it has a higher growth rate and feed conversion ratio, as well as preferable muscle quality. It also has good taste and can be used in a variety of dishes, which makes the species desirable for consumers all over the world, especially in Asia.
Despite the significance of B. gonionotus in the fish farming industry for both consumption and ornamental purposes, there is a paucity of data regarding alterations in its MDA levels in serum and visceral organs, serum biochemical indices, hematological profiles, stress hormones, and operculum movement in response to thermal shocks. Understanding the critical thresholds at which rapid fluctuations in water temperature exert an influence on such indices in this species is essential. Thus, the objectives of this study were to investigate the effects of heat and cold shocks on MDA concentrations in serum and visceral organs, comparative MDA content from various sources, serum biochemical parameters (ALT, AST, BUN, glucose, total protein, and cholesterol), total red and white blood cells, stress hormone (cortisol) levels, and the frequency of operculum movement in B. gonionotus. The implementation of the research findings may involve disseminating results to enhance best practices for temperature regulation in aquaculture, establishing monitoring systems for biochemical and stress-related biomarkers to identify early signs of thermal stress, and providing education to stakeholders on maintaining optimal environmental conditions to ensure the health and welfare of fish.
2. Materials and Methods
2.1. The Collection and Acclimation of B. gonionotus
Healthy B. gonionotus with an average body weight of 100 ± 2.67 g and mean total length of 15 ± 1.36 cm were acquired from private fish farms in Chiang Mai, Thailand. The fish were acclimated in fiberglass tanks maintained at a water temperature of 25 ± 2 °C for a duration of two weeks. During this period, laboratory conditions—which included continuous aeration and a weekly water recirculation system—were upheld under a natural photoperiod. Throughout the acclimatization phase, key water quality parameters were monitored, yielding a temperature of 25.2 ± 2.20 °C, a dissolved oxygen (DO) concentration of 7.20 ± 1.5 mg/L, a pH level of 7.2 ± 0.25, and conductivity measuring 0.3 mS/cm (multi-probes, HORIBA, U50 series, Kyoto, Japan). The fish were fed a commercial diet containing 28% crude protein at a rate of 3% of their body weight, provided twice daily.
2.2. Experimental Design for MDA Study
After acclimatization, all fish were carefully allocated into seven groups in plastic tanks, with 10 fish per group in triplicate. Two groups subjected to increasing water temperatures were equipped with heaters (MIN JIANG, MJ-HC500, Jiangmen, China), capable of raising the temperature from 25 °C to 29 °C and from 25 °C to 37 °C. Additionally, four groups were fitted with aquarium chillers (Hailea, HS-90A, Yiwu, China) designed to lower the temperature from 25 °C to 21 °C and from 25 °C to 13 °C. The cooling process was maintained consistently for durations of 24 h (D1) and 48 h (D2), respectively. One group was designated to maintain a stable temperature of 25 °C for the fish. In both the cold and heat shock experiments, the water temperature was set to change at a rate of 3 °C/h. Once the target temperature is reached, the experimental fish are immediately sampled for further analysis. Throughout the process, the water was always oxygenated with an air pump.
2.3. Oxidative Stress Analysis
Blood samples were collected from the caudal vein of the experimental fish, and then they were killed via excision of the spine. Subsequently, their brain, gills, liver, and kidneys were removed, and contaminated blood was washed out with a normal saline solution. The blood was centrifuged at 13,000 at 4 °C for 10 min; then the supernatants were collected, and all the samples were stored at −20 °C until used. Lipid peroxidation levels were measured based on the concentration of MDA in the serum, brain, gills, liver and kidneys; the levels were represented in nanomoles of MDA per gram of tissue. The tissue samples were homogenized with 0.1 M phosphate-buffered saline (0.02% w.V−1) at a pH of 7.4 and spun down at 4 °C at 3500 rpm for 10 min; the supernatants were then obtained and investigated afterwards. The thiobarbituric acid-reactive substance (TBARS) method, modified from that used by Uchiyama and Mihara [19] with tetramethoxypropane (TMP), was performed to estimate the MDA concentration. Concisely, 100 µL of supernatant was mixed with 1 mL of 10% trichloroacetic acid (TCA), 450 µL of 0.85% sodium chloride, and 100 µL of 0.86% thiobarbituric acid (TBA) and incubated in a water bath (95 °C) for 30 mins. After cooling, the mixtures were centrifuged, and the supernatant was collected to measure the absorbance at a wavelength of 532 nm.
2.4. Experimental Designs for Serum Biochemical Indices, Hematological Profiles, Cortisol Hormone, and Operculum Movement Studies
A total of 360 fish were utilized in this study, with 30 fish (with 10 fish per group in triplicate) assigned to evaluate each water temperature level. The experimental fish were housed in plastic tanks measuring 0.8 × 0.5 × 0.5 m. Each tank was equipped with a chiller (Hailea, HS-90A, Yiwu, China) to lower the water temperature to ranges between 25 °C and 13 °C, at an average cooling rate of 3 °C/h. Eight different temperature levels for the cold shock study were established: (1) 25 °C (control level), (2) 25 °C to 23 °C, (3) 25 °C to 21 °C, (4) 25 °C to 17 °C, (5) 25 °C to 13 °C, (6) a sustained temperature of 13 °C for 24 h (designated as 13D1), (7) a sustained temperature of 13 °C for 48 h (13D2), and (8) a sustained temperature of 13 °C for 72 h (13D3). For the heat shock study, four different temperature conditions were implemented: (1) 25 °C to 27 °C, (2) 25 °C to 29 °C, (3) 25 °C to 33 °C, and (4) 25 °C to 37 °C. Once the target temperature is reached, the experimental fish are immediately sampled for further analysis. All temperature levels were regulated using an automated program. During the experiments, the water in the tanks was aerated to maintain adequate oxygen levels.
2.5. Serum Biochemistry Study
A total of six fish were randomly selected from each temperature level for this study. Blood samples (1.0 mL per fish) were obtained from the caudal vein using non-heparinized syringes for serum collection. To prepare the serum, the blood samples were transferred into microcentrifuge tubes and allowed to coagulate for four hours at room temperature (25 °C). Subsequently, the samples were centrifuged at 5000 rpm for 15 min at 25 °C. The resulting supernatants were stored in sterile serum tubes at −20 °C until analysis, ensuring they were not kept frozen for more than seven days. The frozen serum samples were sent to the Chiang Mai Veterinary Laboratory Centre Limited Partnership in Chiang Mai, Thailand, for further analysis. The activities of alanine ALT, AST, BUN, serum glucose, serum protein, and serum cholesterol were measured using a blood serum analyzer (PC400, HORIBA, Kyoto, Japan).
2.6. Hematological Indices
In this investigation, six fish were randomly chosen for each temperature setting to study the effects of temperature conditions. For the cold shock study, temperatures included a control at 25 °C, followed by 25–21 °C, 25–13 °C, and specific phases labeled 13D1, 13D2, and 13D3. For the heat shock study, the temperatures were controlled at 25 °C, and elevated levels were set to 29 °C and 37 °C. Blood samples of 0.5 mL were extracted from each fish’s caudal vein using syringes treated with heparin to assess blood indices. RBCs were obtained using a 1:1000 dilution, and WBCs were determined using a 1:100 dilution, both with a Neubauer hemacytometer (Marienfeld, Lauda-Königshofen, Germany).
2.7. Cortisol Level
Six fish were randomly selected from each of the six levels used in the earlier hematological study. For serum collection, a rapid extraction of 0.8 mL of blood was performed on each fish, using non-heparinized syringes to draw from the caudal vein, following the previously referenced method. The collected serum samples were then analyzed for cortisol levels according to the technique described by Brown et al. [20] at the laboratory for hormonal analysis in animals located at Chiang Mai Zoo, Thailand.
2.8. Operculum Movement
For each treatment, six fish (two fish from each tank) were randomly selected to monitor the rate of operculum movement (counts per minute), which served as a respiratory response measure. This assessment was conducted across all eight different temperature levels for both the cold and heat shock studies. The operculum movements were recorded using four-digit tally counters, with three individuals participating in the counting process (one person per replicate). These methodological approaches (Section 2.2, Section 2.3, Section 2.4, Section 2.5, Section 2.6, Section 2.7 and Section 2.8) are shown in Figure 1.
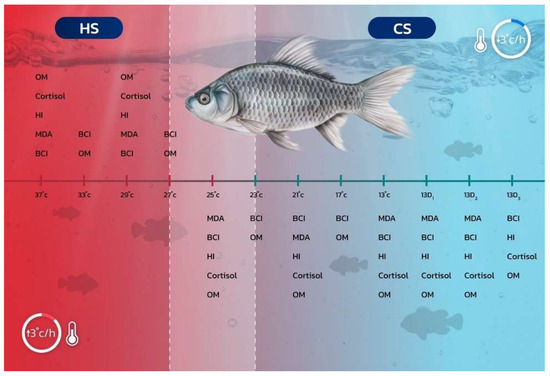
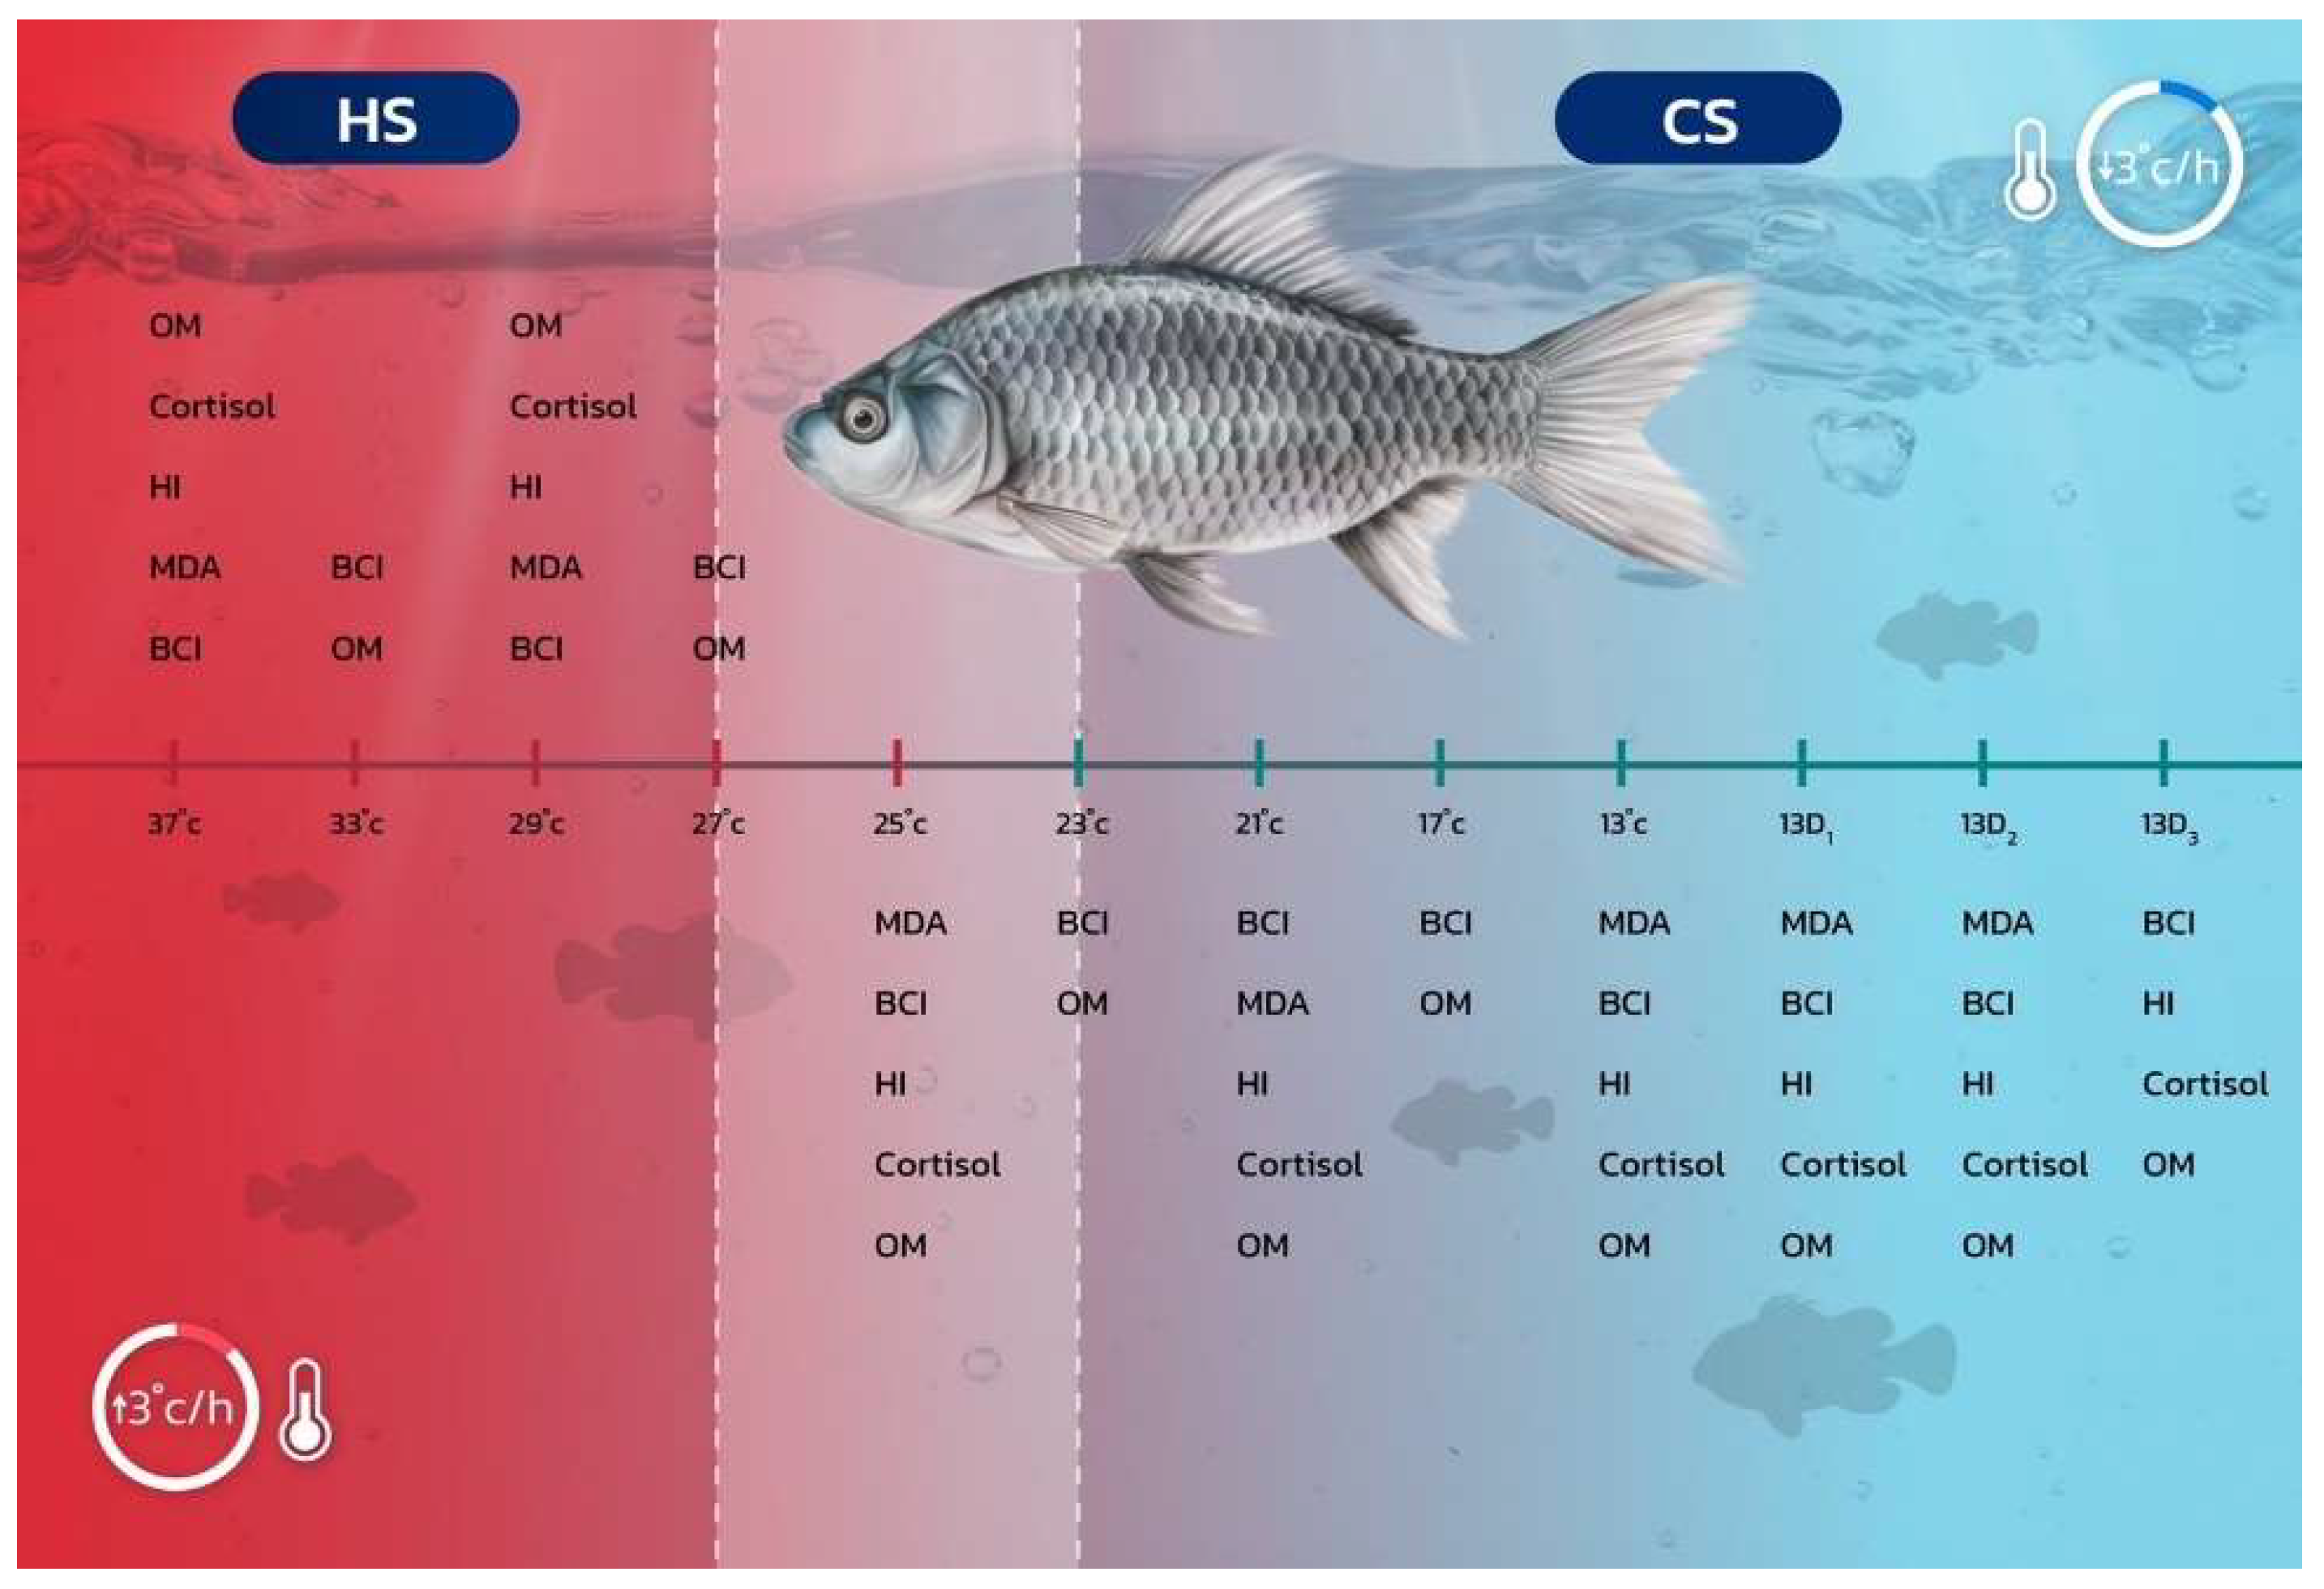
Figure 1.
Schematic representation of the rapid thermal fluctuation protocol (in °C) implemented under controlled laboratory experiments designed to induce cold shock (CS) and heat shock (HS) in silver barb (Barbonymus gonionotus), with a temperature change rate of 3 °C per hour. Abbreviations include MDA (malondialdehyde), BCI (biochemical indices), HI (hematological indices), cortisol (cortisol hormone), and OM (operculum movement).
2.9. Statistical Analysis
Prior to analyzing all the parameters, the data were normalized and assessed for homogeneity of variance. All parameters are expressed as mean ± standard deviation (SD). To assess differences between groups, a one-way ANOVA was performed, followed by a post hoc Tukey’s test using SPSS software (version 17). The significance level was established at p < 0.05 for all analyses.
3. Results
3.1. MDA Level from Different Sources
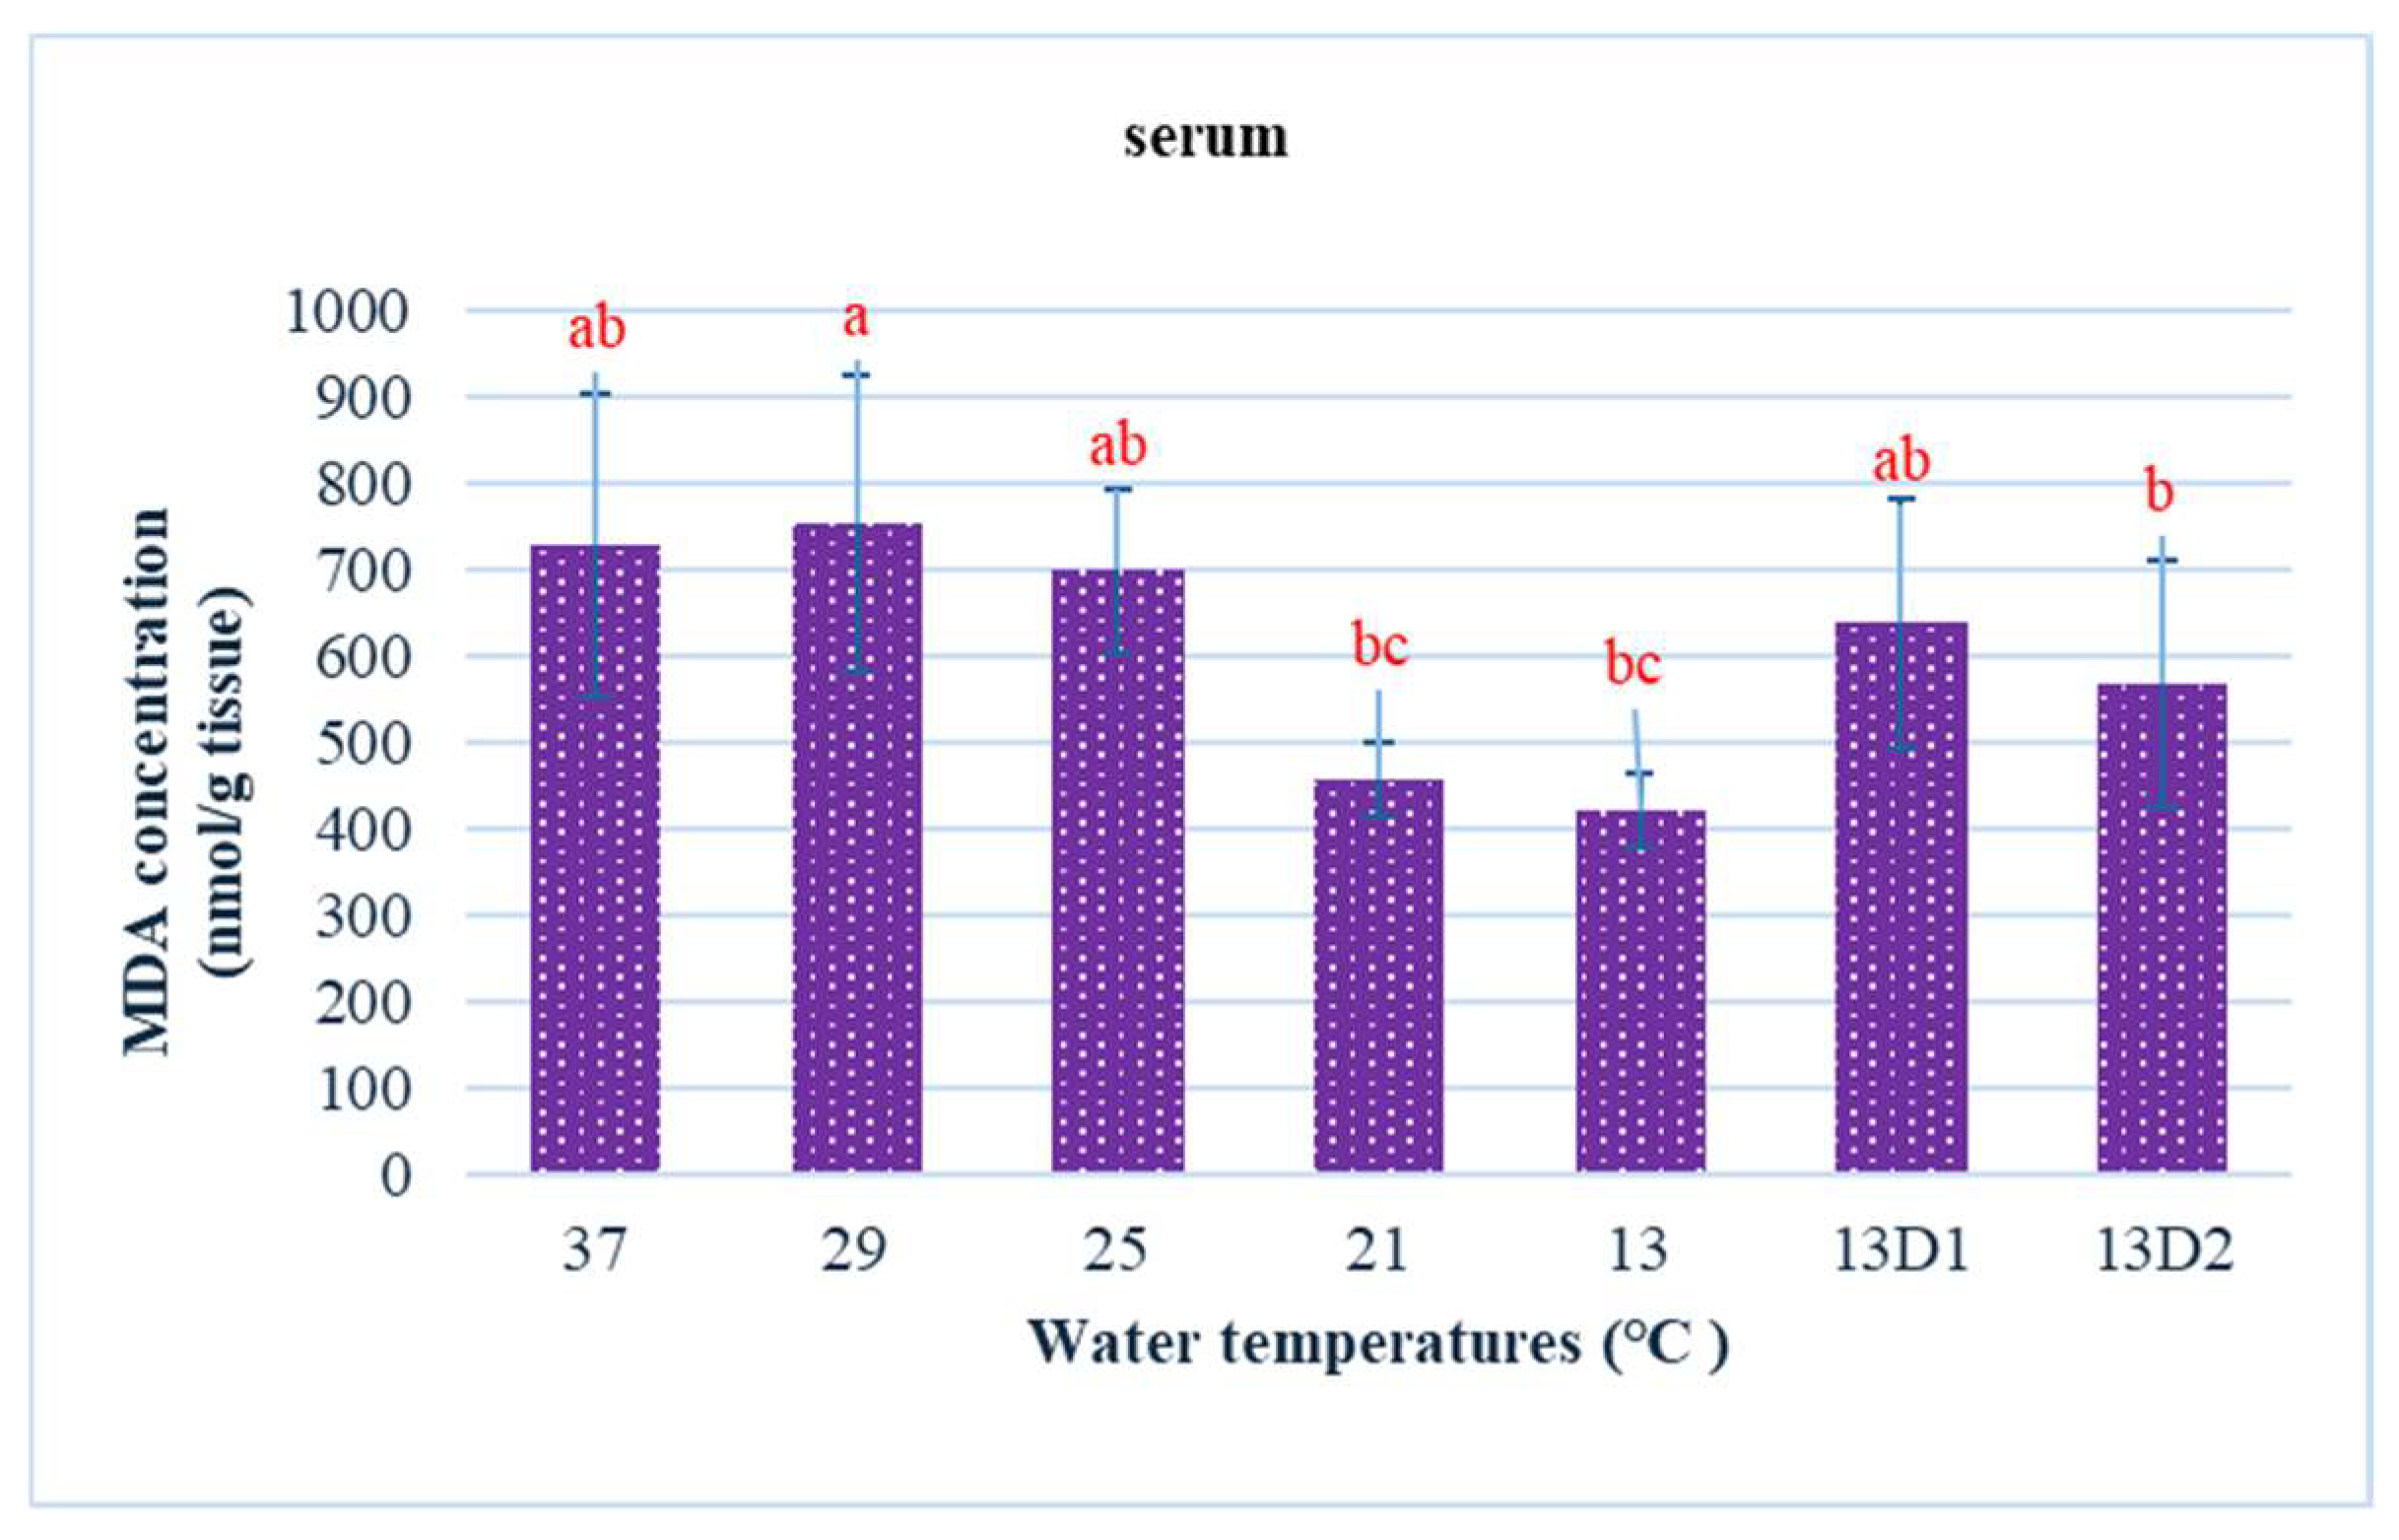
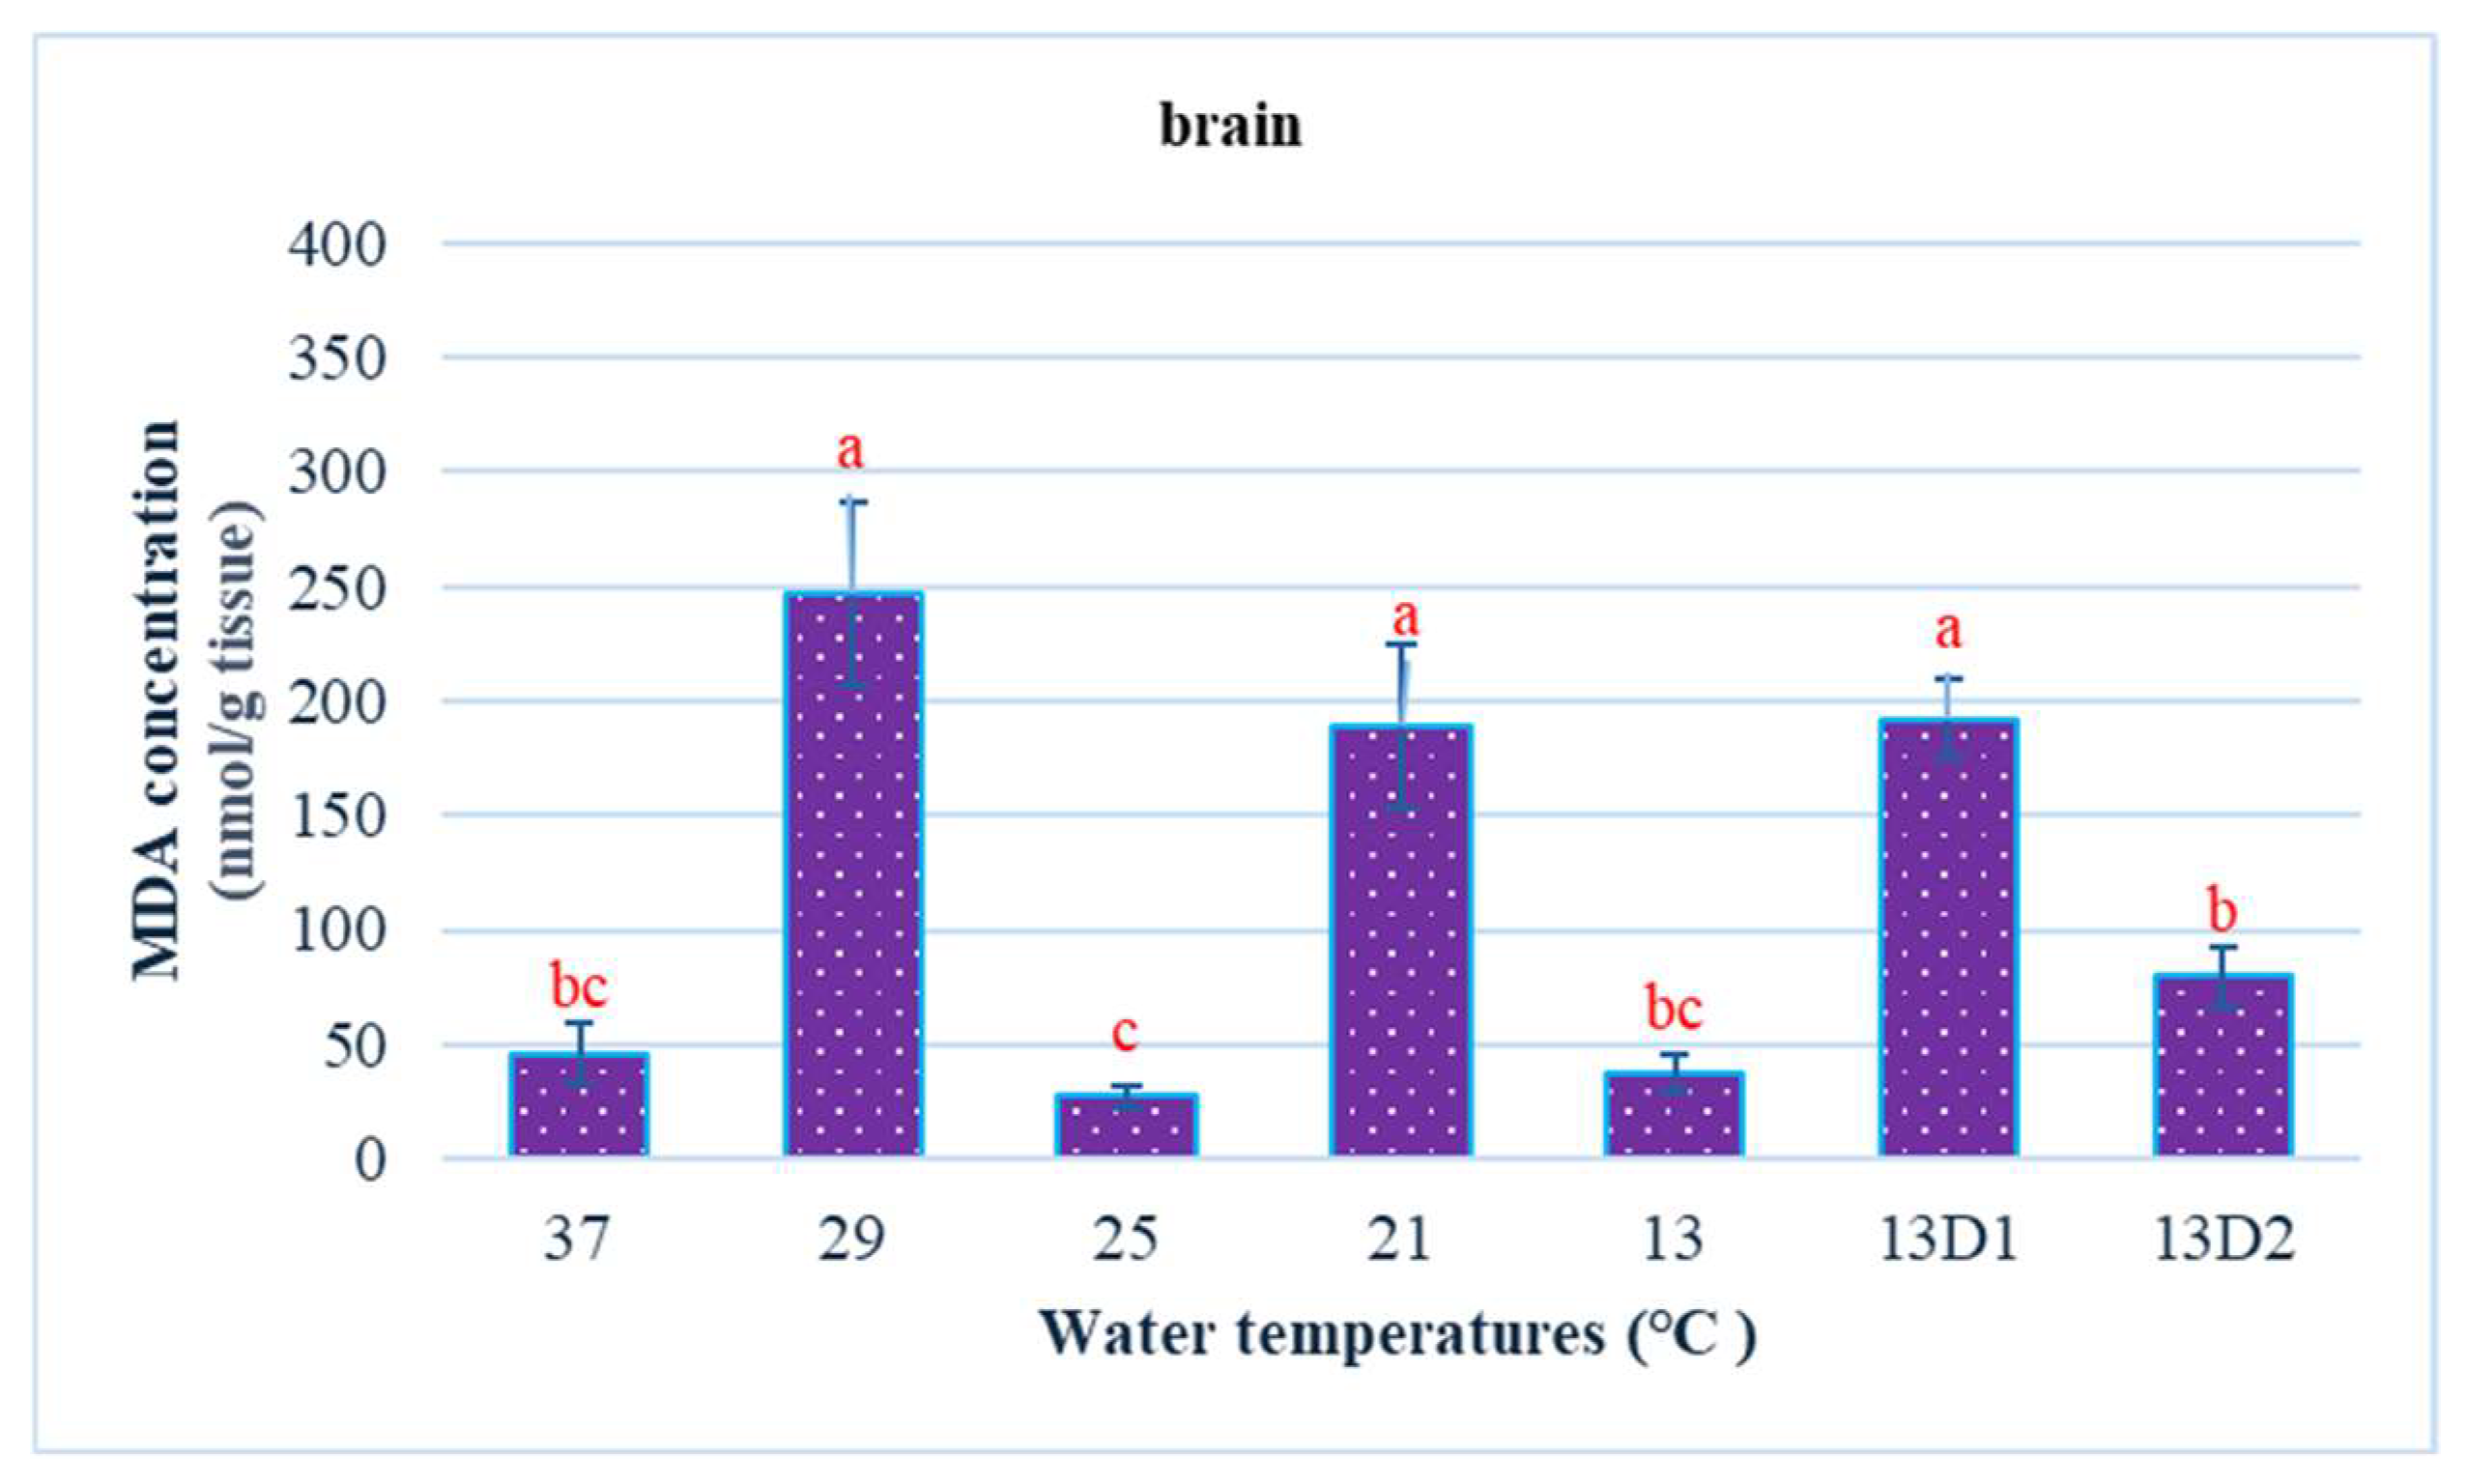
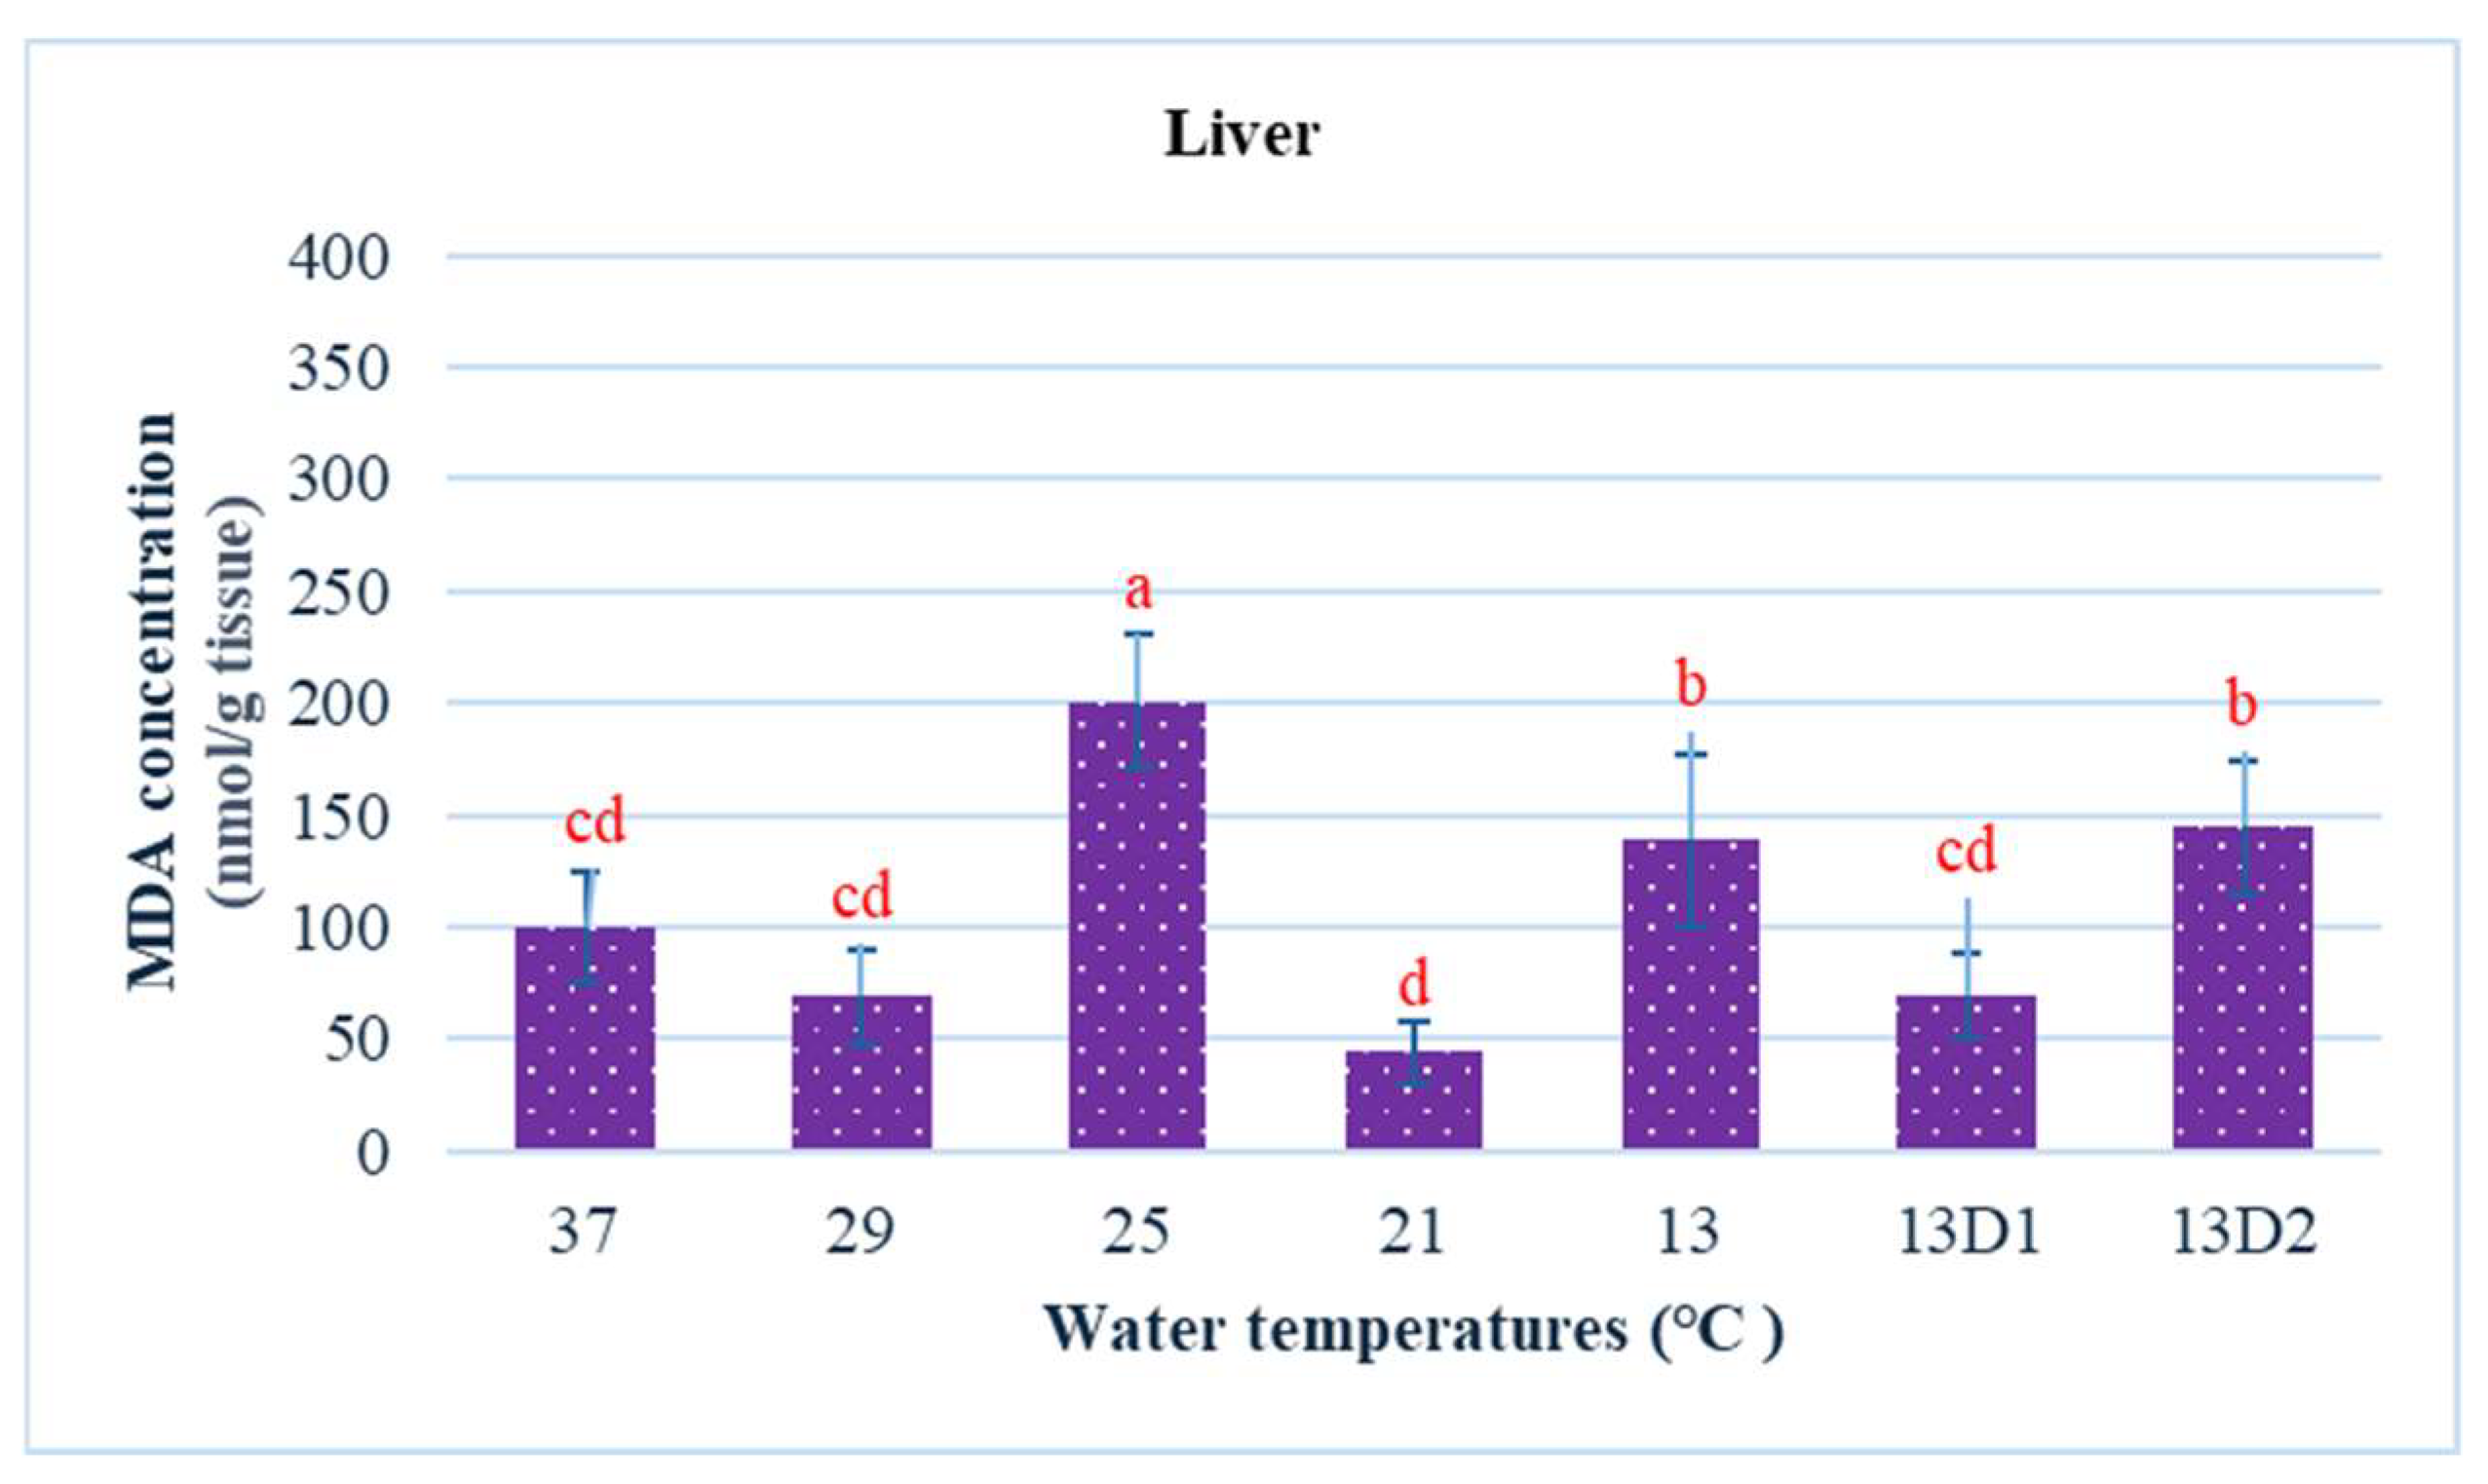
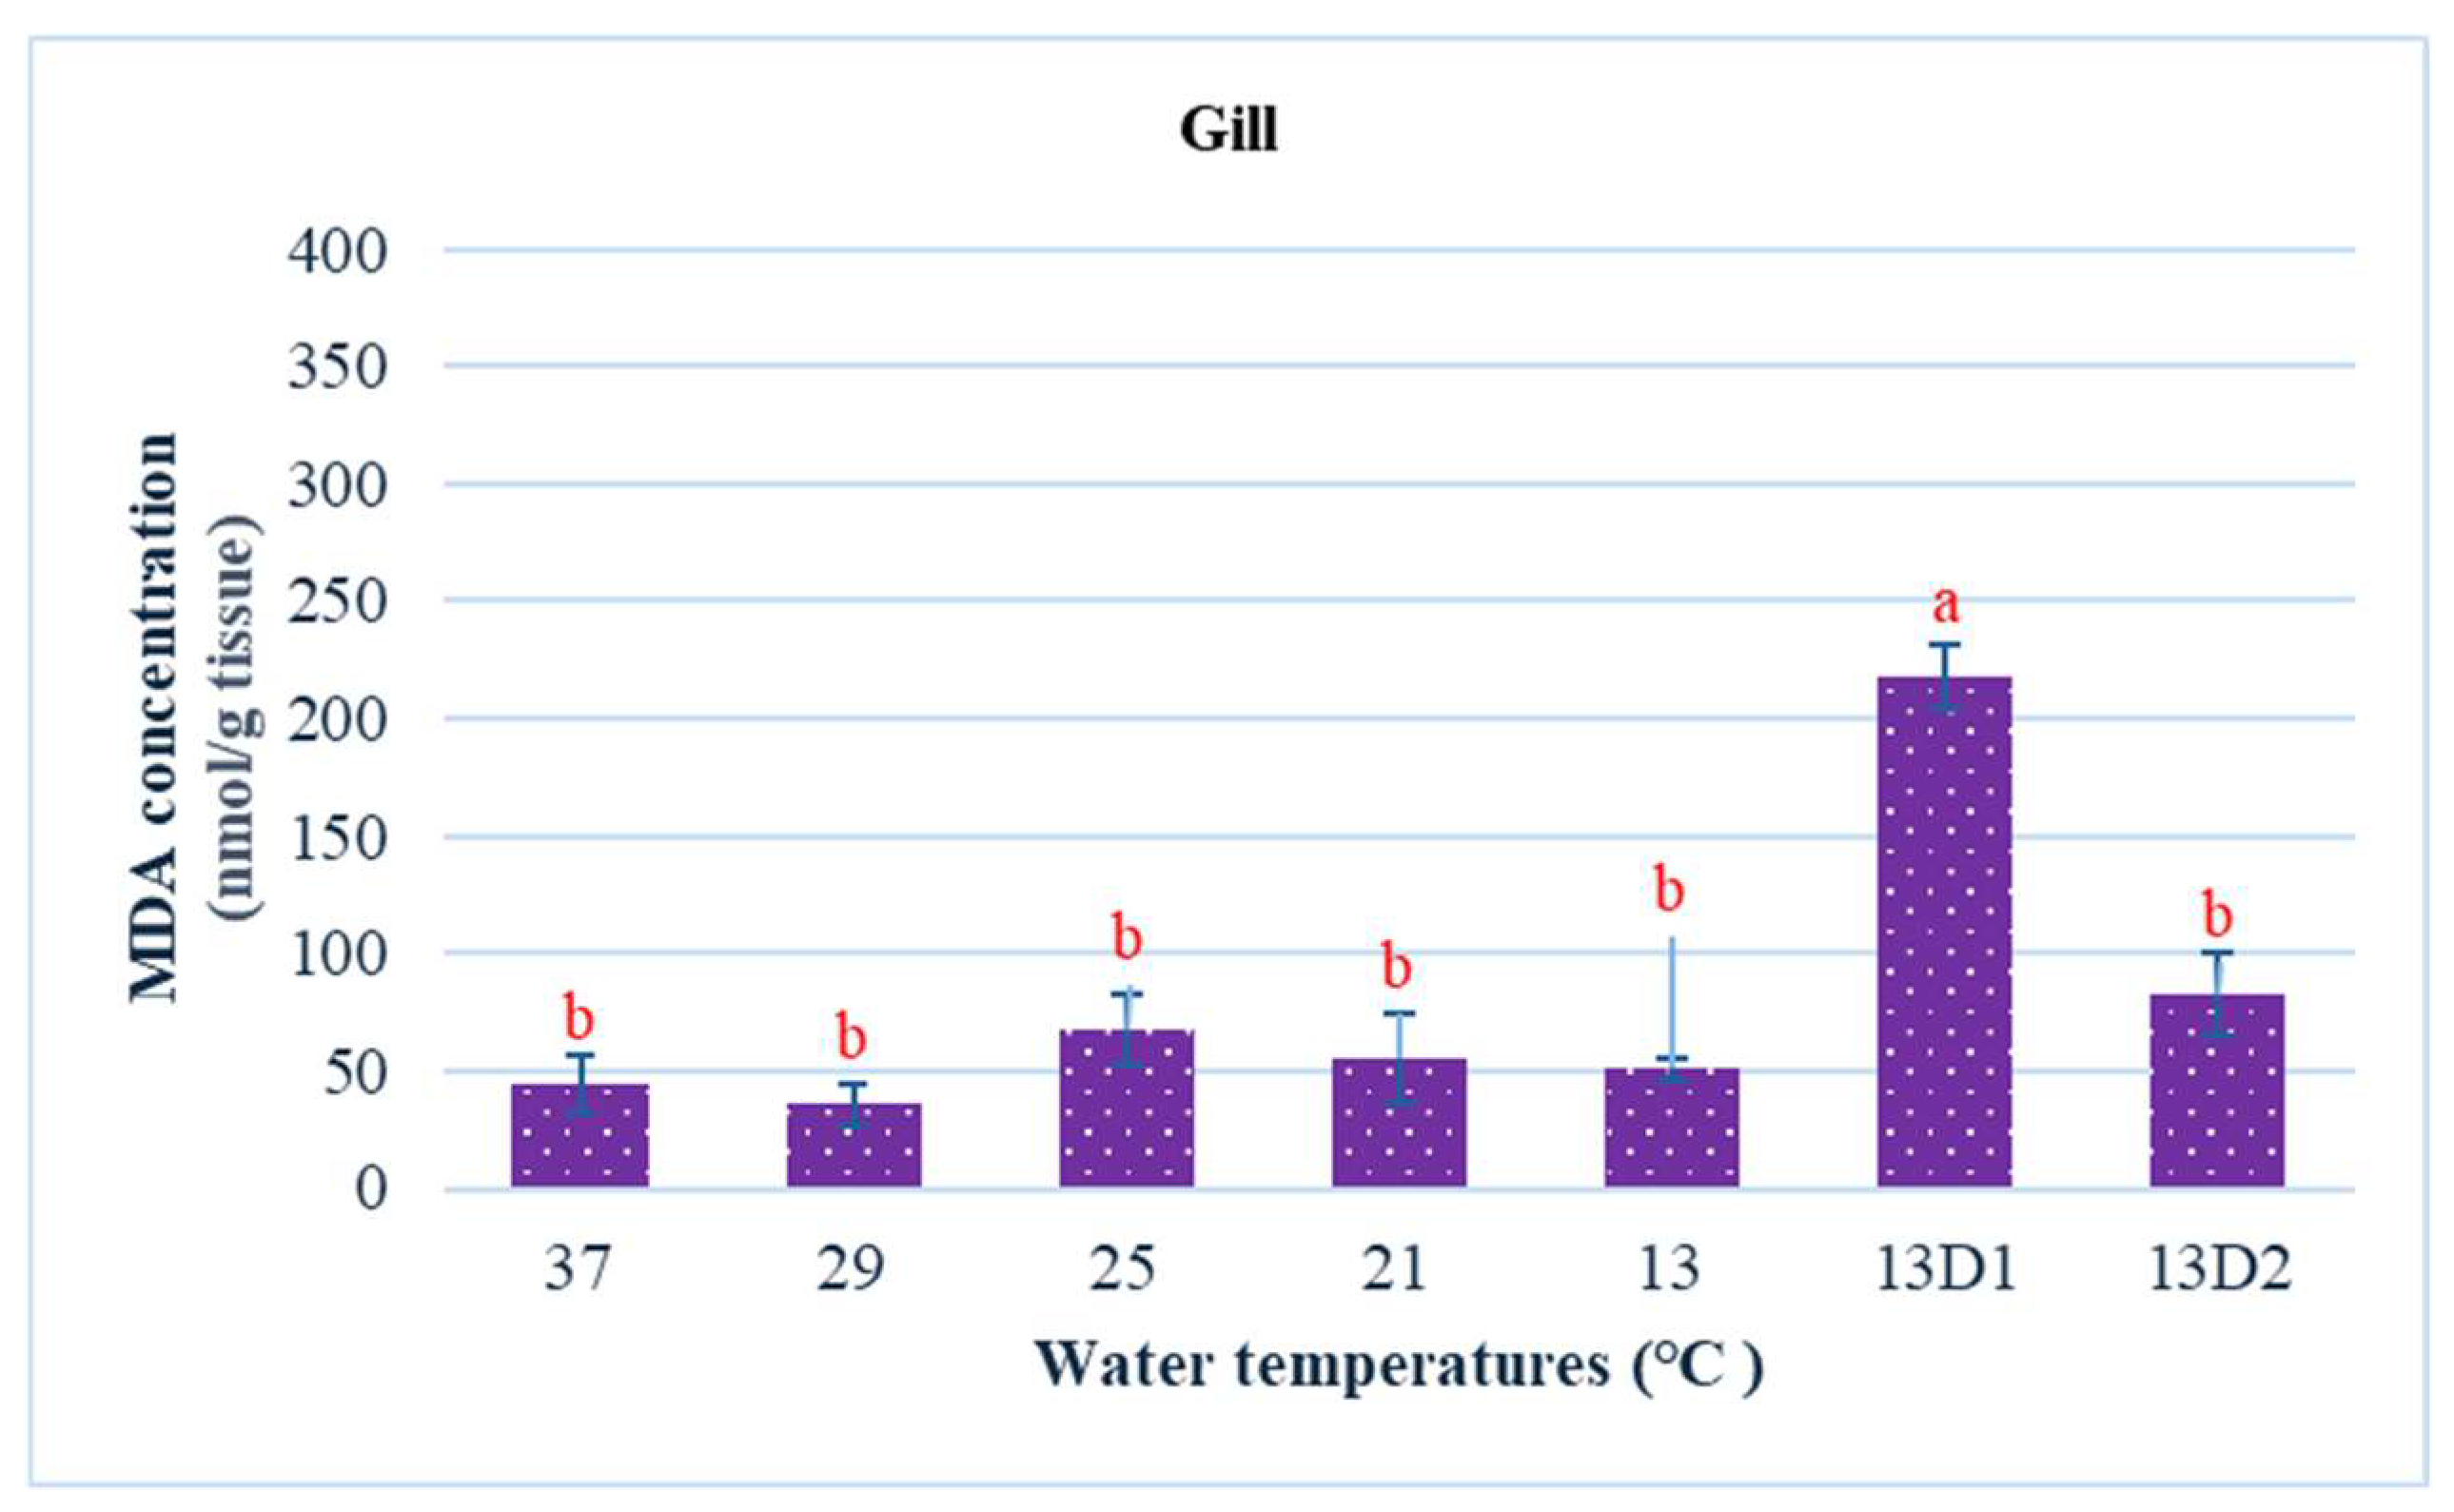
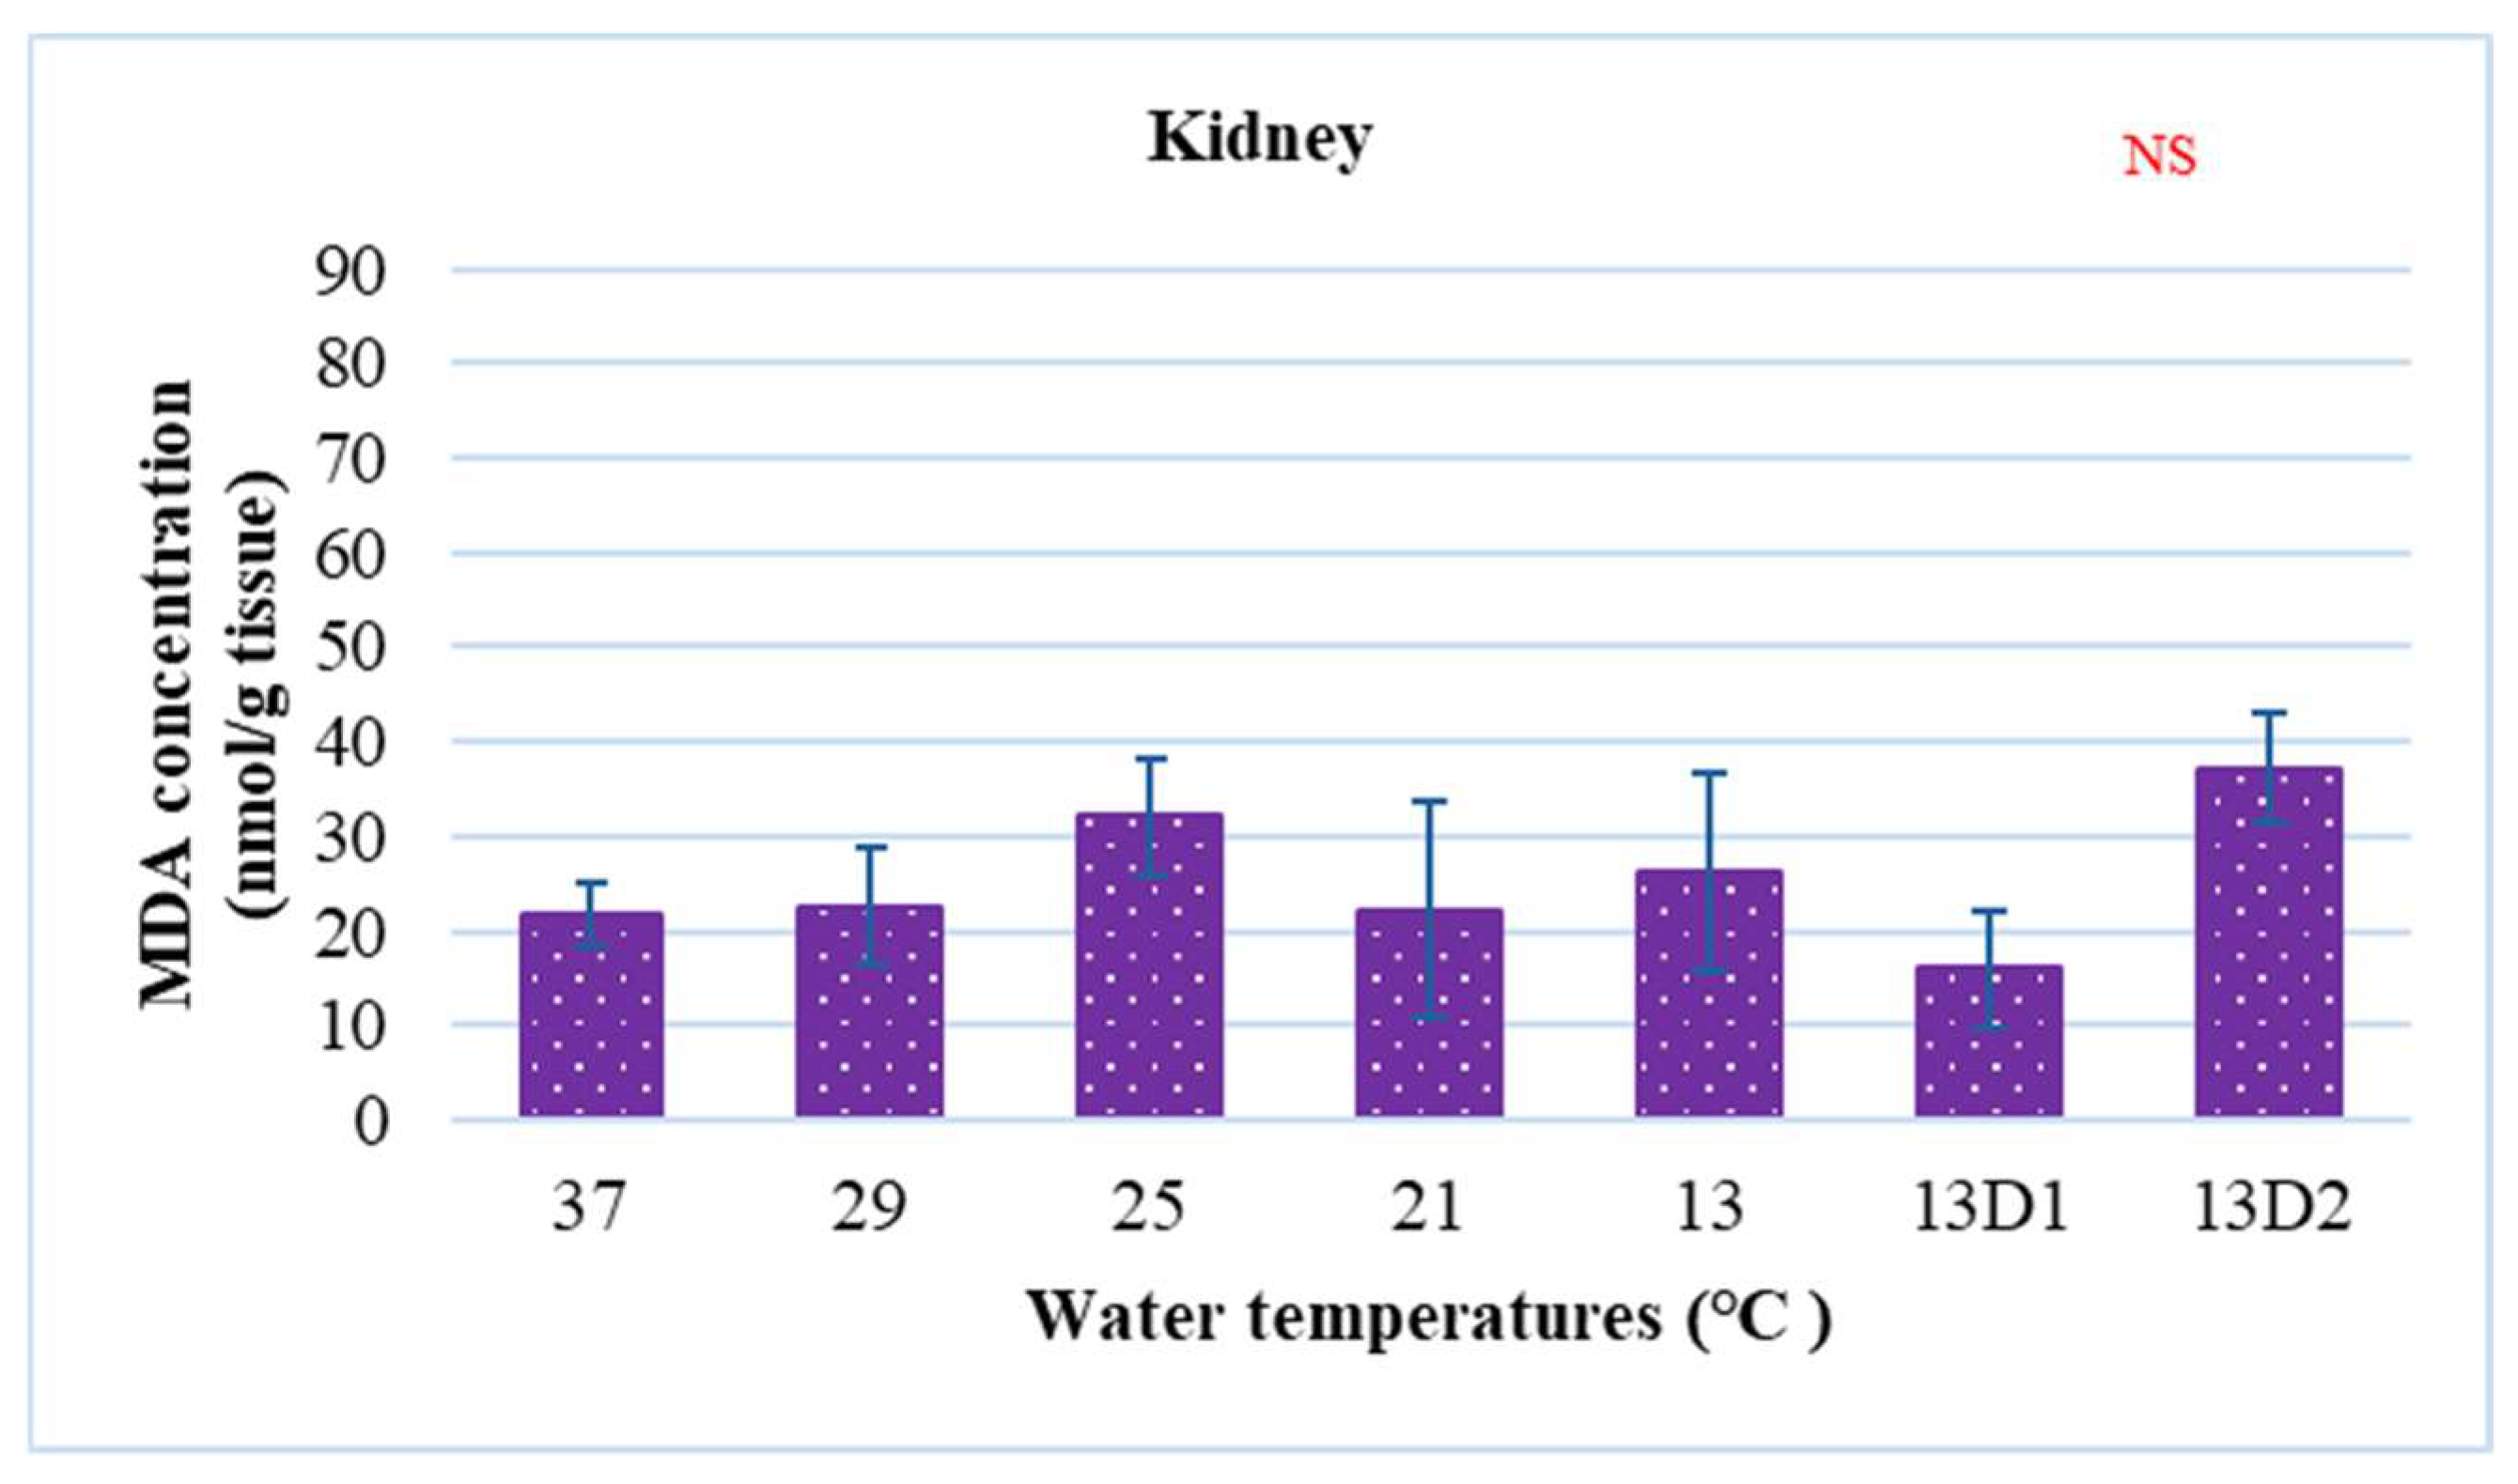
In the context of inducing cold shock, a significant decrease in serum MDA levels was observed in both the 21 °C and 13 °C groups, compared to the control group maintained at 25 °C. However, when the temperature was sustained at 13 °C for periods of 24 h and 48 h, increases in serum MDA levels were noted (Figure 2). The MDA level in the brain of the control group was lowest. The findings indicated that MDA levels in the brain exhibited fluctuations across each group. Specifically, the MDA levels were elevated at temperatures of 29 °C, 21 °C, and 13 °C (D1) (p < 0.05) (Figure 3). Similarly, the MDA concentrations in the liver also fluctuated; however, they demonstrated an inverse trend compared to those in the brain. At 25 °C, the liver exhibited a notably high MDA concentration, though it did not reach the levels observed in serum, measuring 200 nmol/g tissue (Figure 4). In the gills, the increase in MDA content occurred when they were incubated at 13 °C for 24 h (13D1), but it was abated when the temperature was at 13 °C for 48 h (13D2) (Figure 5). In terms of kidney MDA levels, only one level of MDA content in this source was not significantly different after subjected to heat and cold shocks (Figure 6). However, upon comparing MDA levels from various sources, it is evident that the concentration in serum is significantly higher than in other sources, such as the brain, liver, gills, and kidneys (Figure 7).
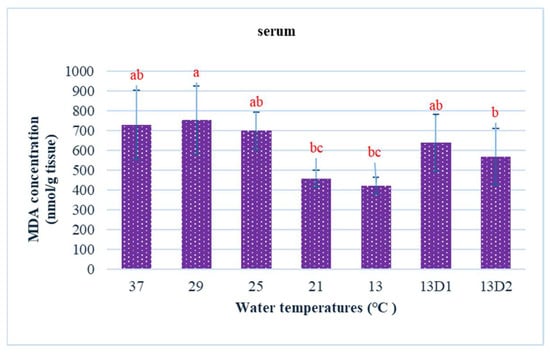
Figure 2.
The effect of water temperature changes on the change in MDA concentration in serum of Barbonymus gonionotus. The data are shown as mean ± SD. Different lowercase letters above the bars indicate statistically significant differences (p < 0.05) among distinct temperature conditions, as determined by one-way ANOVA followed by a post hoc Tukey’s test.
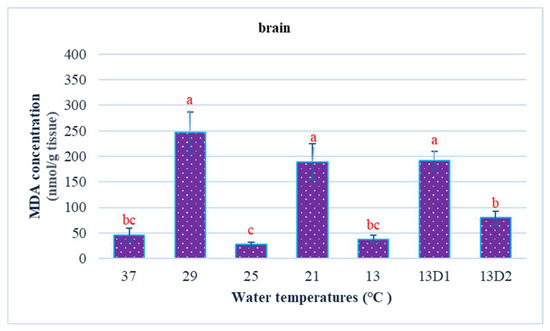
Figure 3.
The effect of water temperature changes on the change in MDA concentration in brain tissue of Barbonymus gonionotus. The data are shown as mean ± SD. Different lowercase letters above the bars indicate statistically significant differences (p < 0.05) among distinct temperature conditions, as determined by one-way ANOVA followed by a post hoc Tukey’s test.
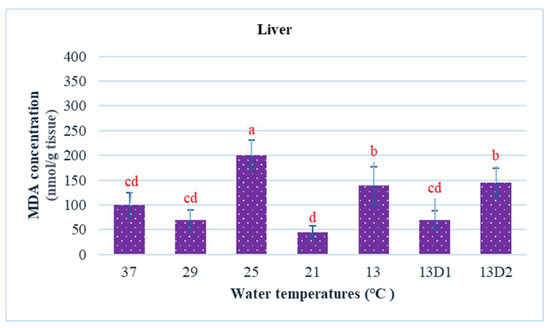
Figure 4.
The effect of water temperature changes on the change in MDA concentration in liver tissue of Barbonymus gonionotus. The data are shown as mean ± SD. Different lowercase letters above the bars indicate statistically significant differences (p < 0.05) among distinct temperature conditions, as determined by one-way ANOVA followed by a post hoc Tukey’s test.

Figure 5.
The effect of water temperature changes on the changing of MDA concentration in gill tissue and polynomial equation of Barbonymus gonionotus. The data showed as mean ± SD. Different lowercase letters above the bars indicate statistically significant differences (p < 0.05) among distinct temperature conditions, as determined by one-way ANOVA followed by a post hoc Tukey’s test.

Figure 6.
The effect of water temperature changes on the change in MDA concentration in kidney tissue and polynomial equation of Barbonymus gonionotus. The data are shown as mean ± SD. NS, not significant.
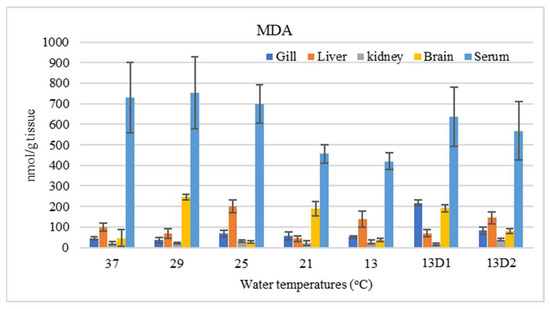
Figure 7.
Comparison of malondialdehyde (MDA) content from various sources of Barbonymus gonionotus after being subjected to temperature shocks. Values presented as mean ± SD.
3.2. Serum Biochemical Indices
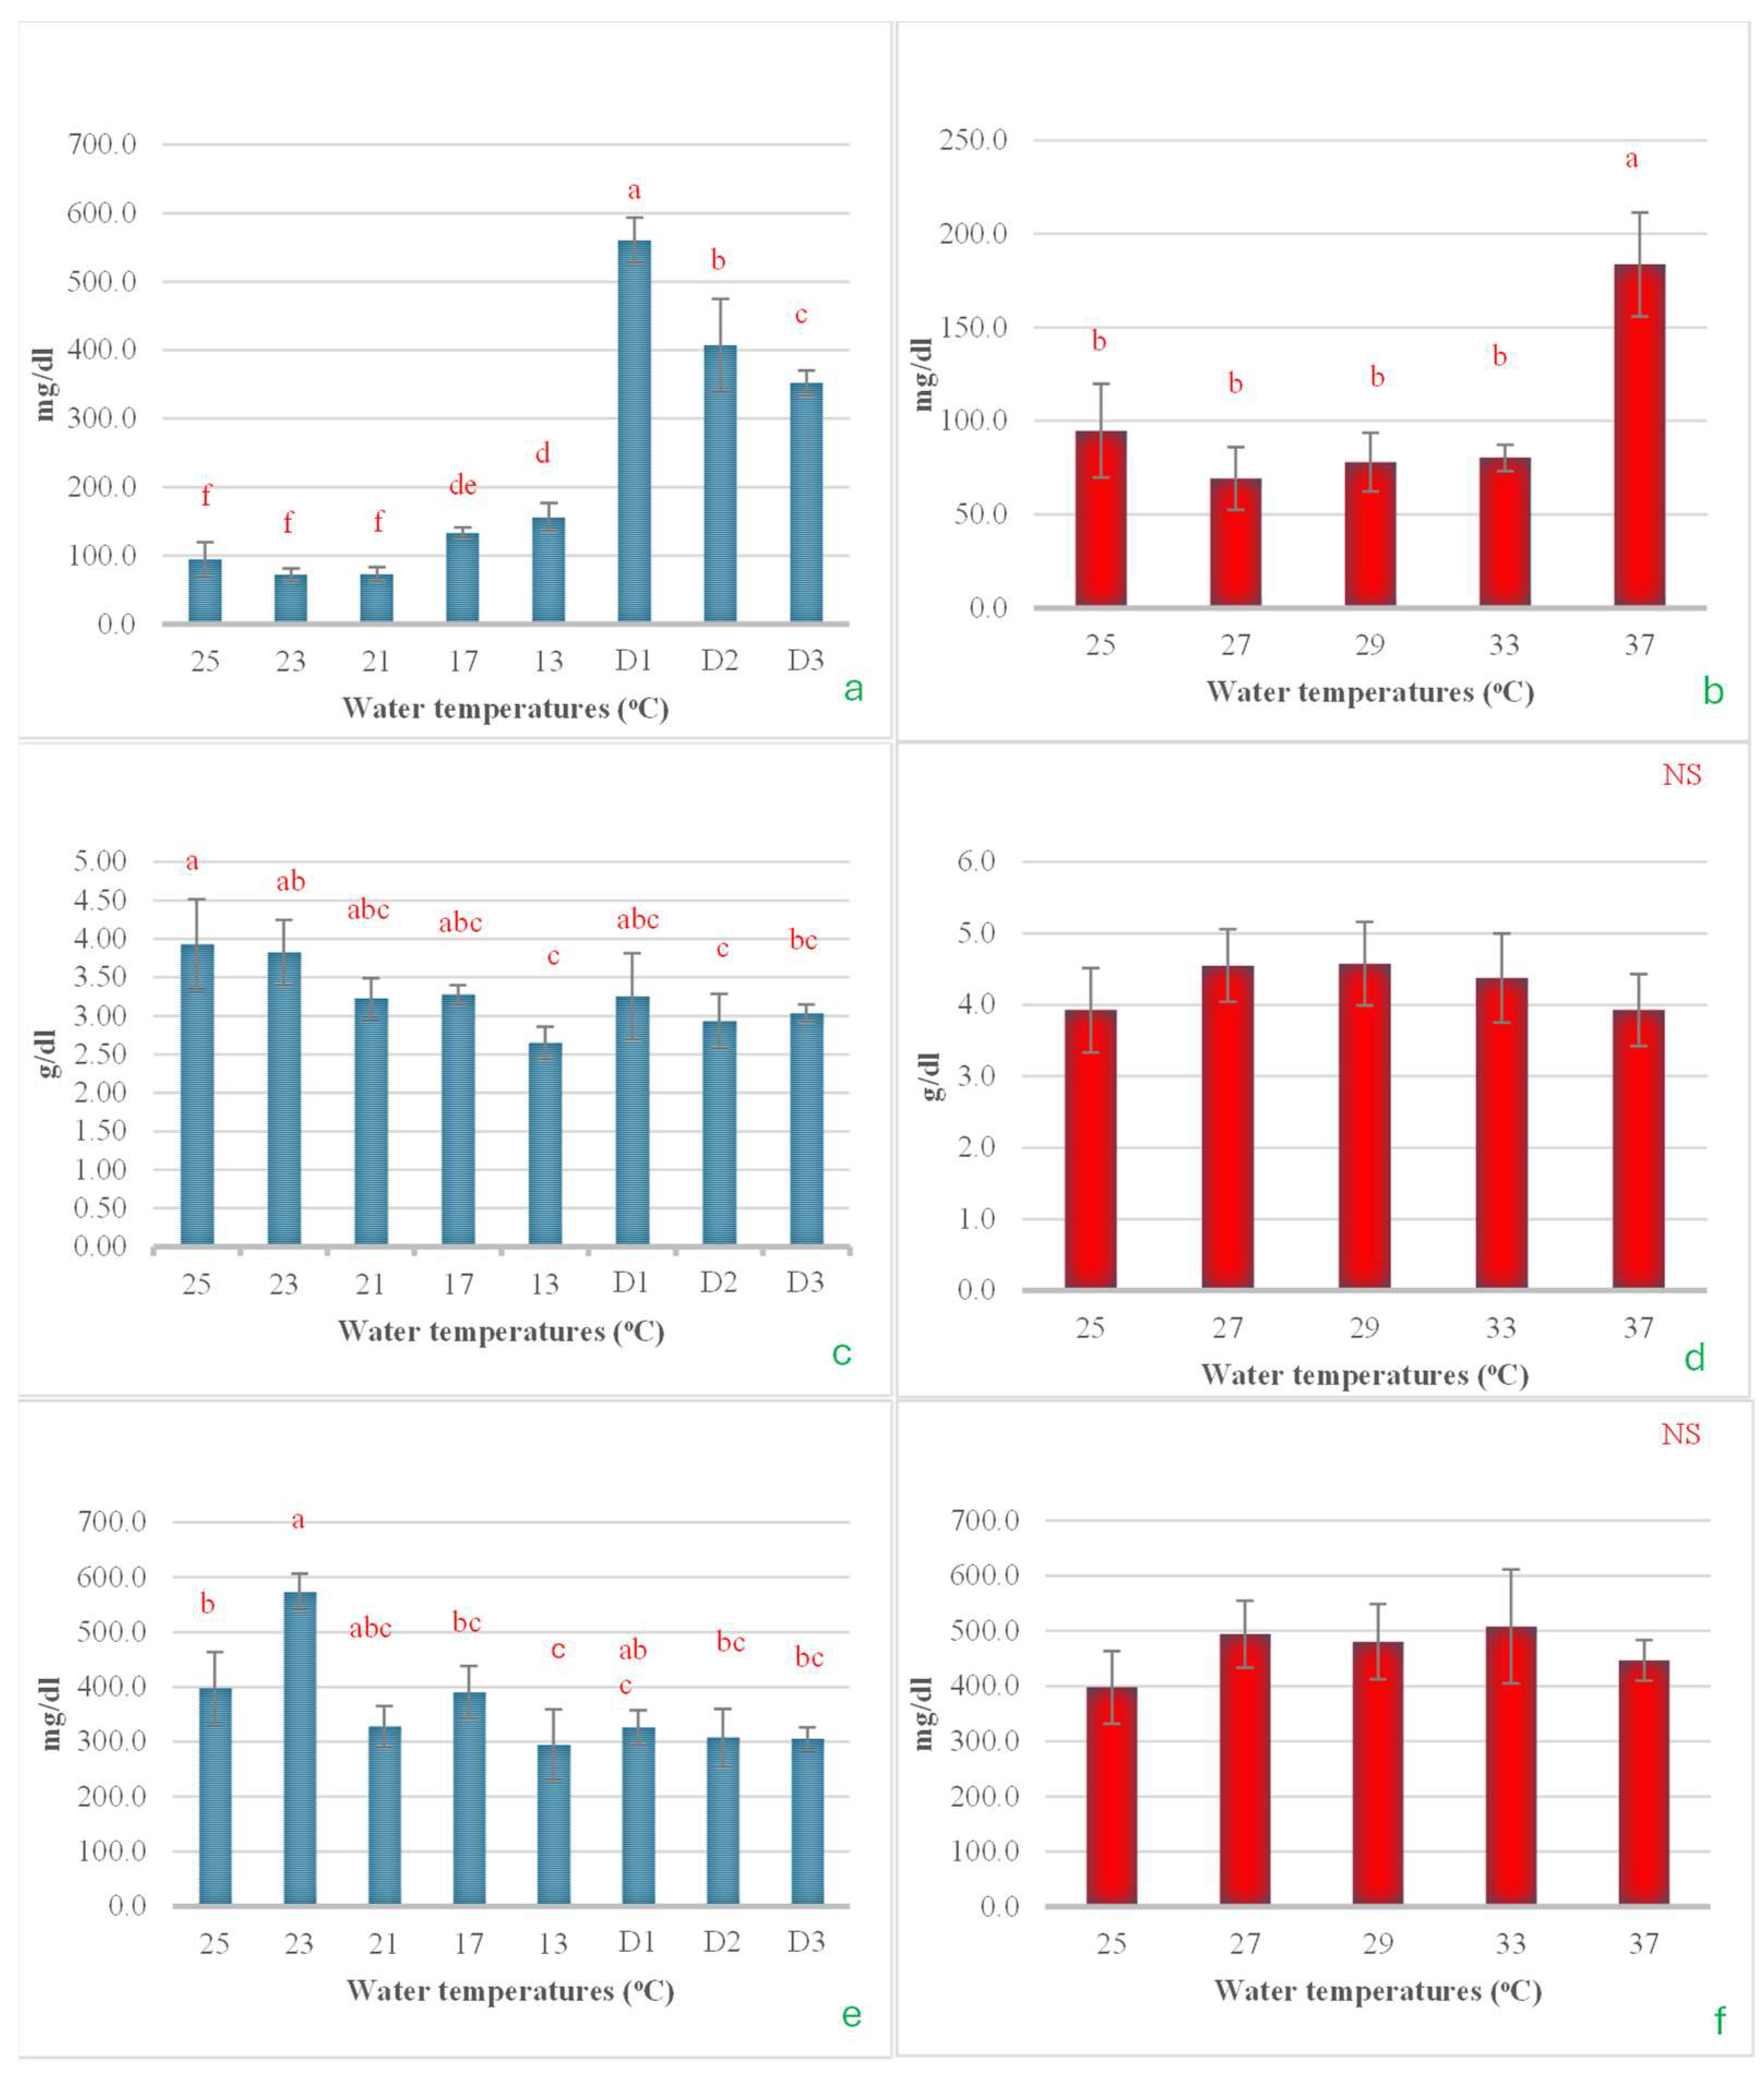
In the cold shock study, it was observed that after a rapid decrease in water temperature from 25 °C to 13 °C at a rate of 3 °C/h, then maintenance of this temperature for an additional 24 h (Day 1, D1), the serum ALT did not change significantly. However, when the temperature was maintained at 13 °C for 48 h and further extended to 72 h, the ALT levels significantly increased, reaching approximately 3 and 6 times higher, respectively (Figure 8a). When examining the effects of heat shock on ALT levels, it was found that increasing the temperature from 25 °C to 29 °C led to a notable decrease in ALT levels, nearly halving them. However, as the temperature increased to 37 °C, the ALT levels returned to their initial values, comparable to those observed at the start of the experiment (Figure 8b). In the cold shock experiment, the serum AST levels demonstrated a pattern similar to that of ALT. A rapid decrease in temperature from 25 °C to 13 °C initially had no impact on AST levels. However, when the temperature was maintained at 13 °C for 24, 48, and 72 h, a noticeable increase in AST levels was observed, with the increases being statistically significant over time (Figure 8c). However, during the heat shock experiment, there were no statistically significant changes observed in AST levels (Figure 8d). Serum BUN levels exhibited minor, non-significant changes with a reduction in temperature to 13 °C. However, when the temperature was sustained at 13 °C for 24, 48, and 72 h, a progressive increase in serum BUN levels was observed (Figure 8e). In the heat shock experiment, it was observed that BUN levels significantly increased when the water temperature reached 33 °C. The levels then returned to their original values when the temperature increased by an additional 4 °C (Figure 8f).
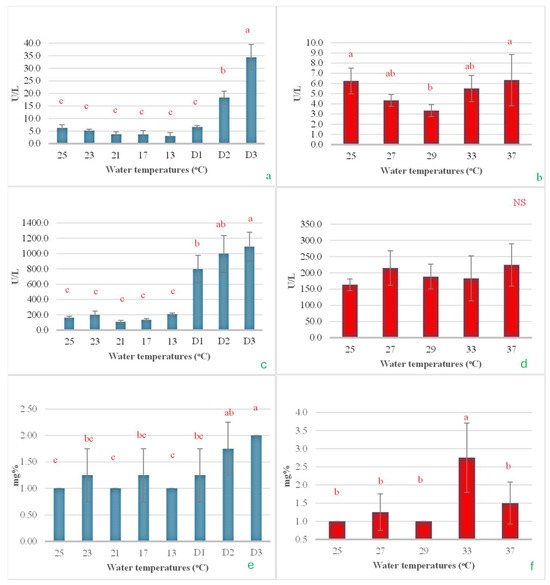
Figure 8.
The impact of water temperature variations on the levels of alanine transaminase (a,b), aspartate transaminase (c,d), and blood urea nitrogen (e,f) in Barbonymus gonionotus was analyzed through (blue color) cold shock and (red color) heat shock experiments. The results are presented as mean ± standard deviation (SD). Different lowercase letters above the bars indicate statistically significant differences (p < 0.05) among distinct temperature conditions, as determined by one-way ANOVA followed by a post hoc Tukey’s test. NS (not significant).
Serum glucose levels began to change when the temperature was reduced to 17 °C. Subsequently, a significant increase was observed as the water temperature decreased to 13 °C, with a further rise noted when this temperature was maintained for an additional 24 h. However, after being sustained for 48 and 72 h, serum glucose levels decreased steadily and noticeably (Figure 9a). In the heat shock experiment, it was found that serum glucose levels did not change after the water temperature increased to 33 °C. However, when the temperature was raised further to 37 °C, glucose levels approximately doubled (Figure 9b). For serum total protein, significant changes were observed only during the cold shock experiment. The total protein levels tended to decrease as the water temperature was lowered, reaching their minimum value when the temperature dropped to 13 °C. The heat shock experiment showed that it did not have a statistically significant effect on total protein levels (Figure 9c,d). Serum cholesterol exhibited a response similar to that of total protein, showing significant changes only in the cold shock experiment. In contrast, no statistically significant changes were observed in the heat shock experiment. During the cold shock experiment, the changes in serum cholesterol did not follow a clear pattern. Cholesterol levels increased significantly with the initial rapid drop in temperature but subsequently decreased as the temperature continued to decline, reaching their lowest point at 13 °C. However, when the temperature was maintained at 13 °C for 24, 48, and 72 h, cholesterol levels showed a slight upward trend (Figure 9e,f).

Figure 9.
The impact of water temperature variations on the levels of serum glucose (a,b), total protein (c,d), and cholesterol (e,f) in Barbonymus gonionotus was analyzed through (blue color) cold shock and (red color) heat shock experiments. The results are presented as mean ± standard deviation (SD). Different lowercase letters above the bars indicate statistically significant differences (p < 0.05) among distinct temperature conditions, as determined by one-way ANOVA followed by a post hoc Tukey’s test. NS (not significant).
3.3. Hematological Indices
During the gradual reduction in water temperature from 25 °C to 13 °C, the RBCs decreased significantly, reaching their lowest value at 13 °C. However, when the temperature was maintained at 13 °C for 48 h (D2), RBC levels showed a tendency to increase, and a significant rise was observed when the temperature was held steady at 13 °C for 72 h (D3) (Figure 10a). In the heat shock experiment, when the temperature increased to 29 °C, there was a noticeable decrease in the RBCs. However, upon further increasing the temperature to 37 °C, the RBC count rose again, returning to levels comparable to the initial temperature of 25 °C (Figure 10b). However, as the temperature continued to drop to 13 °C and remained constant at 13 °C for 48 h, the WBCs stayed at their lowest level. Beyond 48 h, the WBC count began to increase and eventually returned to levels similar to those observed at the initial temperature of 25 °C (Figure 10c). In the heat shock experiment, it was observed that WBCs decreased significantly as soon as the temperature increased from 25 °C to 29 °C. However, when the temperature increased to 37 °C, the WBC count returned to the same level as at the initial temperature (Figure 10d). This outcome was similar to that observed with RBCs (Figure 10a–d).
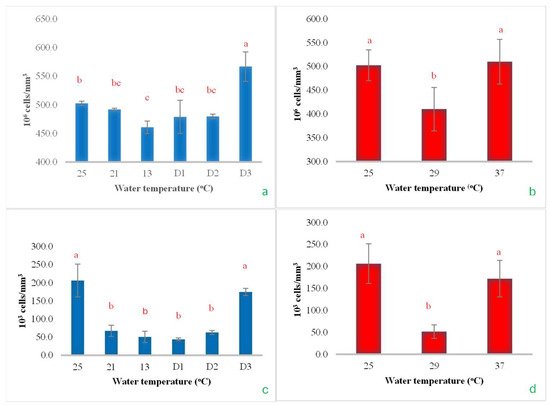
Figure 10.
The impact of water temperature variations on the levels of total red blood cells (a,b) and white blood cells (c,d) in Barbonymus gonionotus was analyzed through (blue color) cold shock and (red color) heat shock experiments. The results are presented as mean ± standard deviation (SD). Different lowercase letters above the bars indicate statistically significant differences (p < 0.05) among distinct temperature conditions, as determined by one-way ANOVA followed by a post hoc Tukey’s test.
3.4. Cortisol Level
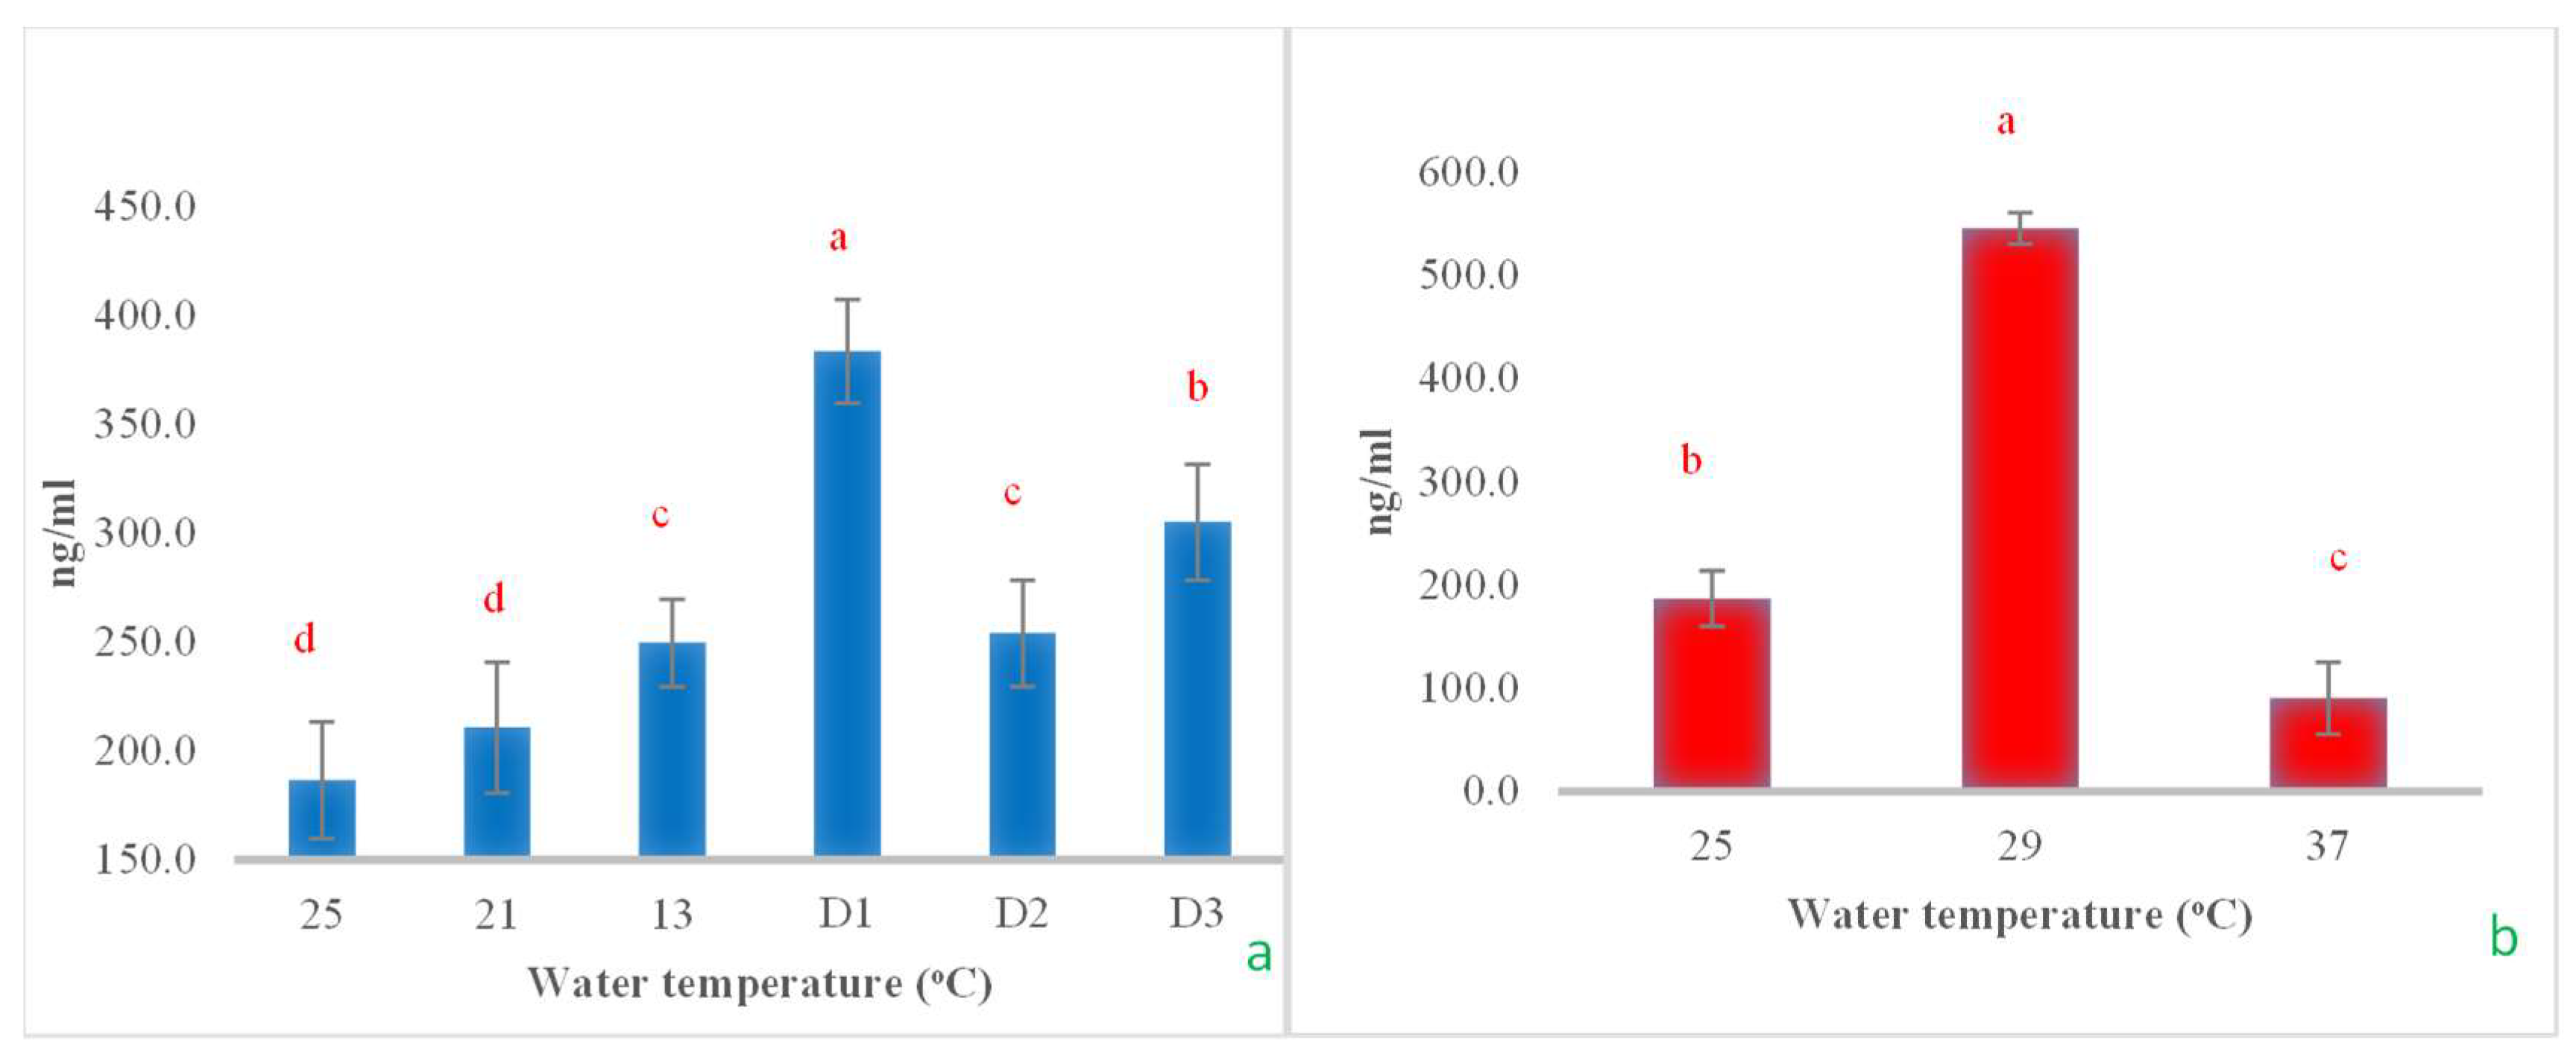
The cortisol levels increased significantly as the water temperature rapidly dropped from 25 °C to 13 °C and remained at 13 °C for an additional 24 h, reaching a significant peak. However, when maintained at 13 °C for another 48 h, cortisol levels decreased rapidly and then increased again when the temperature was held constant for 72 h (Figure 11a). In the heat shock experiment, cortisol levels exhibited a fluctuating pattern. They increased significantly when the temperature rose from 25 °C to 29 °C and then decreased rapidly and significantly when the temperature increased to 37 °C (Figure 11b).

Figure 11.
The impact of water temperature variations on the levels of cortisol hormone in Barbonymus gonionotus was analyzed through (a) cold shock and (b) heat shock experiments. The results are presented as mean ± standard deviation (SD). Different lowercase letters above the bars indicate statistically significant differences (p < 0.05) among distinct temperature conditions, as determined by one-way ANOVA followed by a post hoc Tukey’s test.
3.5. Operculum Movement
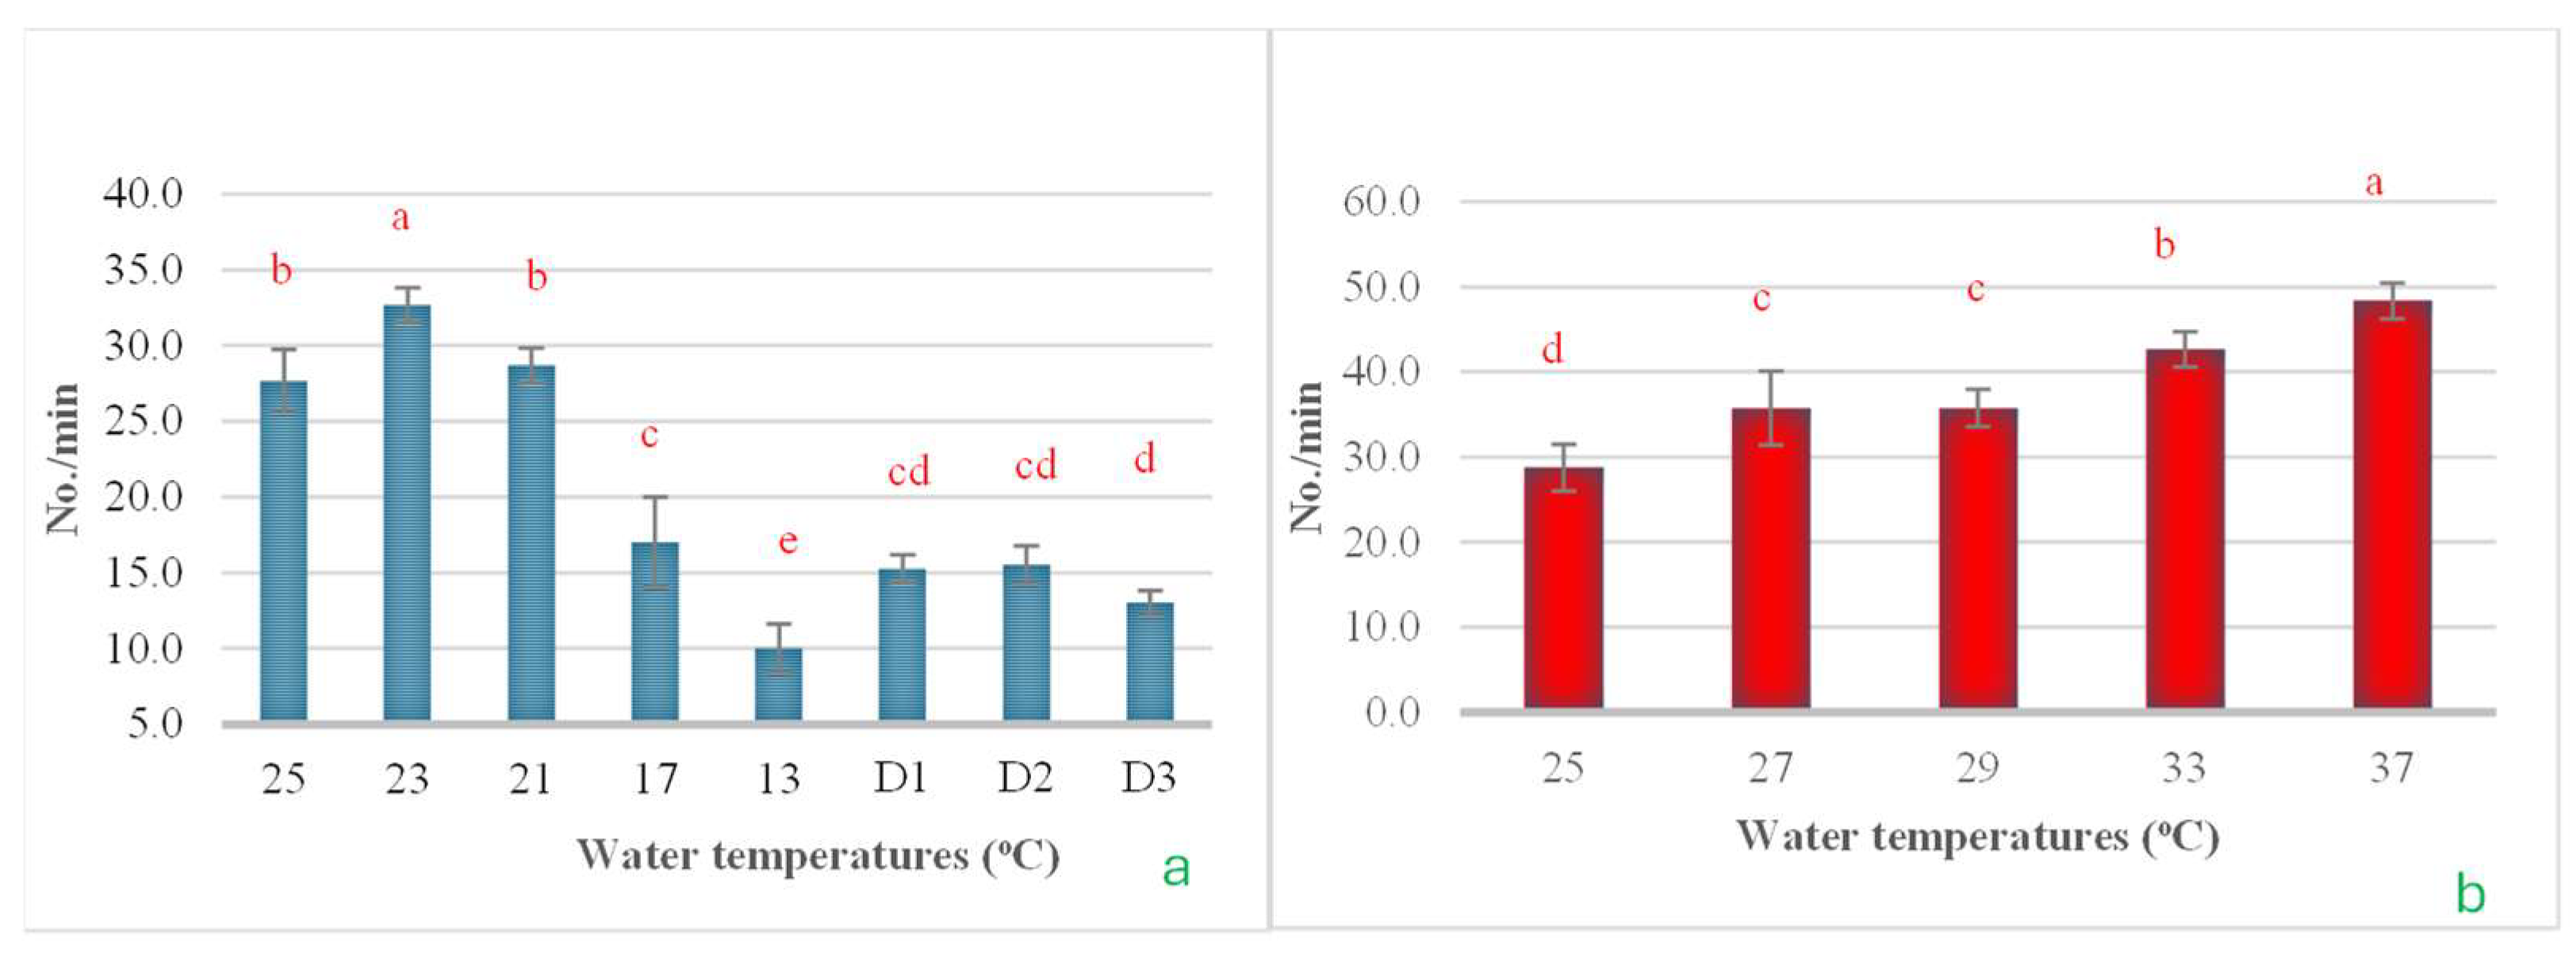
In this experiment, the rate of operculum movement was also evaluated due to its impact on gas exchange rates. The results from both the cold shock and heat shock experiments revealed clear patterns of change. In the cold shock experiment, it was observed that as the water temperature decreased, operculum movement significantly diminished, reaching its lowest point when the temperature fell to 13 °C. However, when the temperature was maintained at 13 °C for 24, 48, and 72 h, operculum movement increased slightly from its lowest levels (Figure 12a). In the heat shock experiment, results were opposite to those observed in the cold shock experiment. Operculum movement increased significantly as the water temperature rose, reaching its peak when the temperature increased to 37 °C (Figure 12b).

Figure 12.
The impact of water temperature variations on the levels of operculum movement in Barbonymus gonionotus was analyzed through (a) cold shock and (b) heat shock experiments. The results are presented as mean ± standard deviation (SD). Different lowercase letters above the bars indicate statistically significant differences (p < 0.05) among distinct temperature conditions, as determined by one-way ANOVA followed by a post hoc Tukey’s test.
4. Discussion
This study examines the effects of acute changes in water temperature, employing a novel experimental design primarily focused on the impacts of temperature increases or decreases in isolation on physiological and behavioral responses. This investigation was structured to assess the effects of both acute increases and decreases in water temperature on bodily changes. The main findings of this study are as follows: First, the levels of MDA in various internal organs—such as the brain, liver, gills, and serum—exhibited significant changes as a result of heat and cold shock experiments, with the exception of the kidneys. Furthermore, the expression levels of MDA in sera were found to be higher compared to other sources. Secondly, serum indices—including ALT, BUN, and glucose—were significantly influenced by both heat and cold shock experiments, whereas AST, total protein, and cholesterol showed significant changes only in response to cold shock. Additionally, operculum movement was significantly affected by both heat and cold shock experiments.
Oxidative stress is defined by an imbalance caused by elevated oxidant levels or diminished antioxidant levels due to stress. This condition results in the production of free radicals at rates exceeding the norm. Lipid peroxidation is a key process arising from oxidative stress, potentially leading to cellular death through various mechanisms, including damage to cell membranes, DNA damage, and the promotion of apoptosis [21]. MDA—a small reactive organic molecule that is the main secondary product of oxidation activity—is frequently used to analyze and research the generation of lipid peroxidation in tissues induced by ROS; this is because the primary products are inconsistent, may be present at high rates, and reactive, making them difficult to determine [22]. In this study, we assessed that MDA levels serve as an indicator of oxidative status across various organs. Serum exhibited the highest MDA levels, attributable to the delivery of substances from organs throughout the body into the bloodstream. Cells capable of inducing lipid peroxidation were found to activate apoptotic mechanisms and contribute to cell membrane dysfunction in terms of permeability [8]. Consequently, the small-sized MDA molecules are readily released from cells into the intercellular fluid and ultimately enter the bloodstream, leading to an elevated concentration in serum [23]. MDA levels were reduced when the temperature decreased rapidly from 25 °C to 21 °C and 13 °C. However, incubation at 13 °C for 24 and 48 h caused the MDA level to shift back to nearly normal conditions (25 °C). In alignment with the findings of Panase et al. [12], regarding the effects of cold-water temperature shock on Nile tilapia, it was observed that serum cholesterol levels decreased at 13 °C but returned to normal levels after 24 h of incubation at this temperature. It has been suggested that fluctuations in serum cholesterol levels directly influence changes in serum MDA content: higher levels of serum cholesterol, especially LDL cholesterol, are linked to a greater risk of lipids in the blood undergoing oxidative changes, as supported by EL-Yassin et al. [24]. This signifies that sudden temperature changes induce the abatement of lipid peroxidation, and this probably means that this is a subtoxic condition resulting in a lack of cell activity, so cells try to survive through conservative antioxidant defense. In contrast, retention at 13 °C for 1 day can be considered a toxic condition, producing more ROS and leading to the stimulation of lipid peroxidation.
Brain tissue carries a high mass of polyunsaturated lipids and is subjected to aerobic metabolism. As a result, it is highly sensitive to free radical-mediated oxidative damage [25]. In the present study, the brain’s MDA concentrations significantly fluctuated when the temperature was switched, so we ascribe that changing the water temperature must be the cause of lipid peroxidation in fish brains. The diencephalon is part of the central nervous system, which performs functions related to hormones and body homeostasis. The main structure that responds to external temperature variation is the preoptic area of the hypothalamus in the diencephalon, and its role is to regulate body temperature at normal levels when a fish is subjected to changes in temperature [26]. In addition, microglial cells in the central nervous system are the primary immune cells that react to brain oxidative damage; this is because they contain high amounts of glutathione, which has good antioxidative potential effects [27]. Attempts to maintain this condition of the nervous system influence the shift in MDA levels in the brain. In any case, thermal factors can affect the whole nervous system and other organ systems, and it would be intriguing to delve into what neurological disorders are induced in B. gonionotus due to temperature shocks in diverse aspects. Fish livers serve as a principal organ frequently utilized as an environmental biomarker. They perform multiple functions, including acting as an accessory digestive organ, synthesizing proteins, detoxifying substances, and storing numerous essential nutrients. The liver is highly vulnerable to damage from contaminants, such as organic and inorganic pollutants, as well as environmental stressors [28]. Long et al. [29] reported that the MDA contents in fish liver were increased after inducing oxidized fish oil. Our study shows the shift in the liver’s MDA level in each group was similar to that in the brain in the control temperature group, rather than in the other organs. The liver always contains high levels of antioxidants such as vitamin E and carotenoids and, thereby, excessive quantities of free radicals are produced. These nutrients act as constitutive antioxidants to attenuate ROS and lipid peroxidation, resulting in fluctuating MDA levels in the liver [30]. Furthermore, previous studies found that temperature shock invokes fluctuations in ALT and AST enzyme levels along with serum MDA levels, as we observed in the livers of fish in our study [13,31]. ALT and AST are the key enzymes observed in liver function tests, which are valuable in the diagnosis of liver disease [32]. According to the parallel correlation of liver function enzymes and lipid peroxidation, we attribute ALT and AST as indicators of liver dysfunction, in addition to the MDA content in the liver.
MDA is the secondary product of the lipid peroxidation process and the kidney is the organ with the smallest amount of lipids, leading to low rates of MDA in this organ. Furthermore, changes in external temperatures did not affect changes in kidney function [12]. Accordingly, MDA concentrations in the kidneys were found to be very low under both normal and stress conditions. On the other hand, the gills are the organ that is in direct contact with the water; as such, any hazard in the water will exert an influence on this organ. Our investigation revealed that the amount of MDA was very high at 13 °C when the fish were incubated for 24 h, but then decreased the next day. The results of this experiment are consistent with those of the study by Phrompanya et al. [33], who predicted that MDA concentrations in the gills increased at 13 °C and gradually decreased after that. In addition, they found that rapid temperature changes can induce severe histological damage in gills of O. niloticus, destroying their lamellar epitheliums, causing the formation of aneurisms, and affecting defense mechanisms through the decrease in mucous cells.
This study also assessed the effects on the serum biochemical indices, some hematological parameters, cortisol levels, and operculum movement of the silver barb. The results clearly indicate the trends in changes for each parameter due to heat and cold shocks. Any type of stressor raises the demand for physiological energy, which can be met through modifications in hormonal, enzymatic, and biomolecular responses. Generally, glucose, triglycerides, and proteins function as energy substrates, with their utilization depending on the specific nature and amount of energy required [12,13,15,31,34]. When fish encounter a sudden drop or increase in temperature, they exhibit various physiological responses, including hormonal alterations, metabolic and hematological changes, as well as behavioral modifications [35,36]. In line with this, this study assessed three categories of physiological responses. The findings indicated that all evaluated parameters demonstrated significant differences when the fish were subjected to rapid decreases in temperature. In a study on cold shock, significant changes in ALT, AST, BUN, protein, cholesterol, and glucose levels were observed when the experimental fish were maintained at a temperature of 13 °C for continuous durations of 24, 48, and 72 h. This may be attributed to the fish entering a state of stress due to the rapid decrease in water temperature by 12 °C within a span of 4 h. The findings suggest that the liver experiences stress and damage, leading to increased levels of ALT and AST in the bloodstream [37]. These results align with those of Liqin et al. [38], who reported that low temperatures adversely affect the liver of turbot (Scophthalmus maximus). They found that ALT exhibited greater sensitivity to low temperatures than AST and γ-GT. However, in this study, both ALT and AST appeared to be more responsive in silver barb. Furthermore, AST is one of the key myocardial enzymes, thus being used as an indicator of cardiac function. The results indicate that the hearts of fish may be compromised or injured when exposed to low water temperatures [39]. Additionally, the results of this study are consistent with the findings of Panase et al. [12], who reported that ALT and AST levels in Oreochromis niloticus increased following exposure to a sudden decrease in water temperature. It was identified that 13 °C represents a critical threshold at which the activities of both enzymes are significantly elevated, indicating the onset of liver damage. BUN is one component of non-protein nitrogen (NPN) found in serum, which showed significant fluctuations in response to temperature decreases. These findings indicate that kidney function was compromised in fish exposed to low temperatures, potentially linked to the filtration capabilities of the kidneys. In Nile tilapia exposed to cold shock (with water temperatures reduced to 13 °C), a significant increase in serum BUN was noted after 48 h of continuous exposure to this temperature [12]. Additionally, creatinine is considered an important indicator of kidney function, and it was found that thermal stress affects kidney function in Scophthalmus maximus, as indicated by increased creatinine levels when temperatures rise [40]. The observed initial increase in cholesterol levels following rapid temperature reduction may be linked to the organism’s adaptive response, aimed at preserving membrane fluidity under declining temperatures [41]. Since lower temperatures tend to slow down molecular and enzymatic processes, this increase in cholesterol concentration could serve as a compensatory mechanism to mitigate the rigidifying effects of cold on cellular membranes [42]. Cholesterol plays an essential role in maintaining membrane structure, influencing both fluidity and permeability, and its levels are rigorously regulated to sustain cellular homeostasis [43]. The stability of cholesterol levels during heat shock conditions can be attributed to the complex interplay of cellular mechanisms that strive to preserve homeostasis [44]. A key factor is the intrinsic stability of cholesterol molecules, which have a rigid sterol ring structure that confers resistance to thermal degradation under physiological temperatures [45].
In response to stress, fish attempt to elevate their blood glucose levels to supply additional energy to essential organs, such as the brain. This process involves altering the metabolism of biomolecules, regulated by hormonal control [35]. This aligns with the findings of the present study, which demonstrated that water temperatures starting from 17 °C began to significantly impact glucose levels, causing them to rise. Furthermore, glucose levels are closely linked to cortisol levels and, together, these two parameters serve as primary indicators of stress. Cortisol stimulates glycogenolysis and gluconeogenesis and also prompts chromaffin cells to release catecholamines. These processes lead to an increase in glycogen breakdown and have subsequent effects on cardiovascular and respiratory functions [36,46]. This is consistent with the findings of the present study, where both glucose and cortisol levels increased when the experimental fish were subjected to a sudden decrease in water temperature. Proteins function as energy molecules in a manner similar to glucose and triglycerides, depending on the nature and amount of energy required [34]. The results of this experiment indicated that at 13 °C—identified as the critical point of stress—the lowest protein levels were observed.
RBCs are well-known for their role in transporting oxygen to target cells for use in cellular respiration, which convert nutrients into energy. The findings of this study revealed that RBCs increased when the experimental fish were exposed to a water temperature of 13 °C. Furthermore, RBC levels continued to rise with prolonged exposure at a constant temperature of 13 °C. This suggests that the fish need to produce more red blood cells to enhance oxygen transportation for metabolic processes in the body. In both the cold and heat shock experiments, the WBCs exhibited similar patterns of change. This initial decline in WBCs may impair the organism’s capacity to effectively defend against pathogens or mount appropriate immune responses [47]. The subsequent delayed recovery likely represents an adaptive process whereby the organism attempts to re-establish immune function following extended exposure to low temperatures, potentially involving enhanced leukocyte production or the mobilization of immune cells from reserve tissues [48].
Moreover, this study’s results align with those of De et al. [49], who observed notable alterations in RBCs, WBCs, and hemoglobin levels in hybrid grouper as a response to temperature variations. However, hematological responses to cold stress vary significantly among different species, life-history stages, and diurnal cycles, as well as other environmental factors like water chemistry [50]. In the heat shock study, it appears that certain biochemical parameters, such as AST, total protein, and cholesterol, were not affected by the heat shock experiment. This may be due to the temperature range selected for this study being suboptimal. The temperatures ranged from 25 °C to 33 °C, which are typical conditions under which tropical fish can normally thrive [51,52]. Only at 37 °C was there an indication of an impact on the physiological functions of fish living in this region. A study of operculum movement was conducted to assess the impact of heat and cold shock on the respiratory rates of the experimental fish. The results clearly demonstrated that a decrease in water temperature resulted in a reduction in the opening and closing rates of the operculum. Conversely, as the water temperature increased, the operculum movement rate also increased. This indicates that a lower water temperature leads to a reduced metabolic rate, thus requiring less oxygen intake. In contrast, with rising temperatures, the metabolic rate increases, necessitating a higher intake of oxygen by the body [53,54].
5. Conclusions
Through heat and cold shock experiments conducted on silver barb (Barbonymus gonionotus), it was found that abrupt changes in water temperature significantly affected MDA levels, particularly in the serum and visceral organs, including the brain, liver, and gills, except for the kidneys. However, when comparing MDA levels from various sources, the serum exhibited a significantly higher expression than other sources. Additionally, this study found that biochemical indices were more affected by cold shock than by heat shock, especially at a water temperature of 13 °C, which was identified as a critical point causing significant changes in various biochemical parameters (including cortisol hormone and RBC levels). Considering the studied parameters, the optimal temperature range for this species was determined to be 25–33 °C. The findings from this study can be beneficial in the management and operation of aquaculture farms, particularly in open rearing systems such as earthen ponds or cages. With the increasing frequency and intensity of sudden temperature changes, appropriate preventive measures can be implemented to mitigate the damage caused by these environmental fluctuations.
Author Contributions
Visualization, validation, data curation, methodology, investigation, and software: K.S.; writing—original draft: N.T.; investigation, methodology, validation, and visualization: S.S.; validation and visualization: P.S.; validation and visualization: W.P.; writing—review and editing: D.P.; conceptualization, data curation, methodology, funding acquisition, project administration, and writing—original draft: P.P. All authors have read and agreed to the published version of the manuscript.
Funding
This research was supported by the Biodiversity-Based Economy Development Office, BEDO (public organization), under the research program Climate Change Impact Assessment on Ecological System and Environment in Kwan Phayao for Adaptation (research grant number R59111), Thailand. In addition, this work was partially supported by the Thailand Science Research and Innovation Fund and the University of Phayao (Fundamental Fund 2025, Grant No. 5032/2567).
Institutional Review Board Statement
The scientific procedures were conducted according to guidelines for the animal care and use of the University of Phayao and approved by the Committee of Institutional Animal Care, University of Phayao, Thailand (ID: 5901040011).
Informed Consent Statement
Not applicable.
Data Availability Statement
Data are contained within the article.
Acknowledgments
The researchers wish to thank all staff who helped with data collection and analysis. Also, the researchers wish to thank the Fisheries Laboratory, School of Agriculture and Natural Resources, University of Phayao, as well as the Department of Biology, Faculty of Science, Chiang Mai University, for their provided facilities.
Conflicts of Interest
The authors declare no conflicts of interest.
References
- World Meteorological Organization. State of Climate in 2021. Extreme Events and Major Impacts. 2021. Available online: https://wmo.int/news/media-centre/state-of-climate-2021-extreme-events-and-major-impacts (accessed on 9 June 2024).
- Humans Rights Watch. Canada: Disastrous Impact of Extreme Heat: Failure to Protect Older People, People with Disabilities in British Columbia. 2021. Available online: https://www.hrw.org/news/2021/10/05/canada-disastrous-impact-extreme-heat (accessed on 9 June 2024).
- National Weather Service. Arctic Outbreak. 2021; p. 50. Available online: https://www.weather.gov/shv/ArcticOutbreak2021 (accessed on 9 June 2024).
- Eckstein, D.; Kȕnzel, V.; Schȁfer, L. Global Climate Risk Index 2021. Germanwatch e.V.: Berlin, Germany, 2021; Available online: https://www.germanwatch.org/sites/default/files/Global%20Climate%20Risk%20Index%202021_2.pdf (accessed on 9 June 2024).
- Thai Meteorological Department. Thailand Climate for March-April-May from 30-year Normal (A.D. 1991–2020 or B.E. 2534–2563 Baseline Average); Ministry of Digital Economy and Society: Bangkok, Thailand, 2022. [Google Scholar]
- Mariana, S.; Alfons; Badr, G. Impact of Heat Stress on the Immune Response of Fishes. J. Surv. Fish. Sci. 2019, 5, 149–159. Available online: https://sifisheriessciences.com/index.php/journal/article/view/181/164 (accessed on 9 June 2024). [CrossRef]
- Rossi, A.; Bacchetta, C.; Cazenave, J. Effect of Thermal stress on metabolic and oxidative stress biomarkers of Hoplosternum littorale (Teleostei, Callichthyidae). Ecol. Indic. 2017, 79, 361–370. [Google Scholar] [CrossRef]
- Meng, X.; Liu, P.; Li, J.; Gao, B.; Chen, P. Physiological responses of swimming crab Portunus trituberculatus under cold acclimation: Antioxidant defense and heat shock proteins. Aquaculture 2014, 434, 11–17. [Google Scholar] [CrossRef]
- Mas-Bargues, C.; Escrivá, C.; Dromant, M.; Borrás, C.; Viña, J. Lipid peroxidation as measured by chromatographic determination of malondialdehyde. Human plasma reference values in health and disease. Arch. Biochem. Biophys. 2021, 709, 108941. [Google Scholar] [CrossRef]
- Ozcan, O.E.; Under, N.; Tame, R.L. Comparison of Na+K+-ATPase activities and malondialdehyde contents in liver tissue for three fish species exposed to azinphosmethyl. Bull. Environ. Contam. Toxicol. 2002, 69, 271–277. [Google Scholar] [CrossRef]
- Dragun, Z.; Filipović, M.V.; Krasnići, N. Malondialdehyde concentrations in the intestine and gills of Vardar chub (Squalius vardarensis Karaman) as indicator of lipid peroxidation. Environ. Sci. Pollut. Res. 2017, 24, 16917–16926. [Google Scholar] [CrossRef]
- Panase, P.; Saenphet, S.; Saenphet, K. Biochemical and physiological responses of Nile tilapia Oreochromis niloticus Lin subjected to cold shock of water temperature. Aquac. Rep. 2018, 11, 17–23. [Google Scholar] [CrossRef]
- Panase, P.; Saenphet, S.; Saenphet, K.; Pathike, P.; Thainum, R. Biochemical and physiological responses of Nile tilapia (Oreochromis niloticus Linn.) subjected to rapid increases of water temperature. Comp. Clin. Pathol. 2019, 28, 493–499. [Google Scholar] [CrossRef]
- Hur, J.W. Stress response of olive flounder, Paralichthys olivaceus and Japanese croaker, Nibea japonica on changes of water temperature. Fish. Aquat. Sci. 2022, 25, 441–449. [Google Scholar] [CrossRef]
- Phinrub, W.; Lunjirapan, T.; Srirum, T.; Kumjumrern, K.; Srisuttha, P.; Panase, A.; Panase, P. Alterations of serum electrolytes and biochemical indices of Panagasianodon gigas subjected to different water temperatures and the appropriate temperature range for sustaining life. J. Appl. Anim. Res. 2023, 51, 342–349. [Google Scholar] [CrossRef]
- Kottelat, M. Fishes of the Nam Theun and Xe Bangfai basins, Laos, with diagnoses of twenty-two new species (Teleostei: Cyprinidae, Balitoridae, Cobitidae, Coiidae and Odontobutidae). Ichthyol. Explor. Freshw. 1998, 9, 1–128. [Google Scholar]
- Mohsin, A.K.M.; Ambak, M.A. Freshwater Fishes of Peninsular Malaysia; Penerbit Universiti Pertanian Malaysia: Serdang, Malaysia, 1983; 284p. [Google Scholar]
- Shamsuzzaman, M.M.; Mozumder, M.M.H.; Mitu, S.J.; Ahamad, A.F.; Bhyuian, M.S. The economic contribution of fish and fish trade in Bangladesh. Aquac. Fish. 2020, 5, 174. [Google Scholar] [CrossRef]
- Uchiyama, M.; Mihara, M. Determination of malonaldehyde precursor in tissues by thiobarbituric acid test. Anal. Biochem. 1978, 86, 271–278. [Google Scholar] [CrossRef] [PubMed]
- Brown, E.S.; Varghese, F.P.; McEwen, B.S. Association of depression with medical illness: Does cortisol play a role? Biol. Psychiatry 2004, 55, 1–9. [Google Scholar] [CrossRef] [PubMed]
- Repetto, M.; Semprine, J.; Boveris, A. Lipid Peroxidation: Chemical Mechanism, Biological Implications and Analytical Determination. In Lipid Peroxidation; Tech: Carlsbad, CA, USA, 2012; pp. 2–29. [Google Scholar] [CrossRef]
- Morales, M.; Munné-Bosch, S. Malondialdehyde: Facts and artifacts. Plant Physiol. 2019, 180, 1246–1250. [Google Scholar] [CrossRef]
- Lorente, L.; Martín, M.M.; Abreu-González, P.; Domínguez-Rodriguez, A.; Labarta, L.; Díaz, C.; Solé-Violán, J.; Ferreres, J.; Cabrera, J.; Igeño, J.C.; et al. Sustained high serum malondialdehyde levels are associated with severity and mortality in septic patients. Crit. Care 2013, 17, R290. [Google Scholar] [CrossRef]
- El-Yassin, H.D.; Hasso, N.M.A.; Al-Rubayi, H.A. Lipid profile and lipid peroxidation pattern pre and post exercise in coronary artery disease. Turk. J. Med. Sci. 2005, 35, 223–228. [Google Scholar]
- Wadhwa, N.; Mathew, B.B.; Jatawa, S.K.; Tiwari, A. Lipid peroxidation: Mechanism, models and significance. Int. J. Curr. Sci. 2012, 3, 29–38. [Google Scholar]
- Golovanov, V.K.; Smirnov, A.K.; Garina, D.V. Teleosts: Evolutionary Development, Diversity and Behavioral Ecology; Nova Science Publishers: New York, NY, USA, 2014. [Google Scholar]
- Dringen, R. Oxidative and antioxidative potential of brain microglial cells. Antioxid. Redox Signal. 2005, 7, 9–10. [Google Scholar] [CrossRef]
- Stori, E.M.; Rocha, M.L.C.F.; Santos, C.E.I.; Souza, C.; Amaral, L.; Dias, J.F. Elemental characterization of injuries in fish liver. Nucl. Instrum. Methods Phys. Res. Sect. B: Beam Interact. Mater. At. 2014, 318, 83–87. [Google Scholar] [CrossRef]
- Long, S.; Dong, X.; Liu, H.; Yan, X.; Tan, B.; Zhang, S.; Chi, S.; Yang, Q.; Liu, H.; Yang, Y.; et al. Effect of dietary oxidized fish oil on liver function in hybrid grouper (♀ Epinephelus fuscoguttatus × ♂ Epinephelus lanceolatus). Aquacult. Rep. 2022, 22, 101000. [Google Scholar] [CrossRef]
- Sies, H.; Stahl, W. Vitamins E and C, beta-carotene, and other carotenoids as antioxidants. Am. J. Clin. Nutr. 1995, 62, 1315S–1321S. [Google Scholar] [CrossRef] [PubMed]
- Sutthi, N.; Panase, A.; Phinrub, W.; Srisuttha, P.; Panase, P. Cold shock and its effect on biochemical indices, cortisol and electrolyte changes in Chao Phraya catfish, Pangasius sanitwongsei Smith 1931. Comp. Clin. Pathol. 2022, 31, 757–764. [Google Scholar] [CrossRef]
- Huang, X.J.; Choi, Y.K.; Im, H.S.; Yarimaga, O.; Yoon, E.; Kim, H.S. Aspartate Aminotransferase (AST/GOT) and Alanine Aminotransferase (ALT/GPT) detection techniques. Sensors 2006, 6, 756–782. [Google Scholar] [CrossRef]
- Phrompanya, P.; Panase, P.; Saenphet, S.; Saenphet, K. Histopathology and oxidative stress responses of Nile tilapia Oreochromis niloticus exposed to temperature shocks. Fish. Sci. 2021, 87, 491–502. [Google Scholar] [CrossRef]
- Mergenthaler, P.; Lindauer, U.; Dienel, G.A.; Meisel, A. Sugar for the brain: The role of glucose in physiological and pathological brain function. Trends Neurosci. 2013, 36, 587–597. [Google Scholar] [CrossRef]
- Roychowdhury, P.; Aftabuddin, M.; Pati, M.K. A review on the impact of thermal stress on fish biochemistry. Aquat. Sci. Eng. 2024, 39, 121–129. [Google Scholar] [CrossRef]
- Reid, C.H.; Patrick, P.H.; Rytwinski, T.; Taylor, J.J.; Willmore, W.G.; Reesor, B.; Cooke, S.J. An updated review of cold shock and cold stress in fish. J. Fish Biol. 2022, 100, 1102–1137. [Google Scholar] [CrossRef]
- Liu, S.M.; Zang, X.N.; Liu, B.; Zhang, X.C.; Arunakumara, K.K.I.U.; Zhang, X.Q.; Liang, B. Effect of growth hormone transgenic synechocystis on growth, feed efficiency, muscle composition, haematology and histology of turbot (Scophthalmus maximus L.). Aquac. Res 2007, 38, 1283–1292. [Google Scholar] [CrossRef]
- Liqin, J.; Keyong, J.; Mei, L.; Baojie, W.; Longjiang, H.; Mingming, Z.; Lei, W. Low temperature stress on the hematological parameters and HSP gene expression in the turbot Scophthalmus maximus. Chin. J. Oceanol. Limnol 2016, 34, 430–440. [Google Scholar] [CrossRef]
- Shahsavani, D.; Mohri, M.; Kanani, H.G. Determination of normal values of some blood serum enzymes in Acipenser stellatus Pallas. Fish Physiol. Biochem. 2010, 36, 39–43. [Google Scholar] [CrossRef] [PubMed]
- Yang, S.; Zhao, T.; Ma, A.; Huang, Z.; Liu, Z.; Cui, W.; Zhang, J.; Zhu, C.; Guo, X.; Yuan, C. Metabolic responses in Scophthalmus maximus kidney subjected to thermal stress. Fish Shellfish Immunol. 2020, 103, 37–46. [Google Scholar] [CrossRef] [PubMed]
- Shumin, L.; Kuang, J.; Ji, S.; Chen, Q.; Deng, W.; Min, T.; Shan, W.; Chen, J.; Lu, W. The membrane lipid metabolism in horticultural products suffering chilling injury. Food Qual. Saf. 2020, 4, 9. [Google Scholar] [CrossRef]
- Wu, G.; Baumeister, R.; Heimbucher, T. Molecular mechanisms of lipid-based metabolic adaptation strategies in response to cold. Cells 2023, 12, 1353. [Google Scholar] [CrossRef]
- Chai, Y.-J.; Cheng, C.-Y.; Liao, Y.; Lin, C.; Hsieh, C. Heterogeneous nanoscopic lipid diffusion in the live cell membrane and its dependency on cholesterol. Biophys. J. 2022, 121, 3146. [Google Scholar] [CrossRef]
- Karunanithi, S.; Brown, I.R. Heat shock response and homeostatic plasticity. Front. Cell. Neurosci. 2015, 9, 68. [Google Scholar] [CrossRef]
- Havlíková, M.; Szabová, J.; Mravcová, L.; Venerová, T.; Chang, C.; Pekař, M.; Jugl, A.; Mravec, F. Cholesterol effect on membrane properties of cationic ion pair amphiphile vesicles at different temperatures. Langmuir 2021, 37, 2436. [Google Scholar] [CrossRef]
- Choi, C.Y.; Kim, T.H.; Choi, Y.J.; Choi, J.Y.; Oh, S.Y.; Kim, B.S. Effects of various wavelengths of light on physiological stress and non-specific immune responses in black rockfish Sebastes schlegelii subjected to water temperature change. Fish. Sci. 2017, 83, 997–1006. [Google Scholar] [CrossRef]
- Abram, Q.H.; Dixon, B.; Katzenback, B.A. Impacts of low temperature on the teleost immune system. Biology 2017, 6, 39. [Google Scholar] [CrossRef]
- Ochokwu, I.J.; Taiwo, M.A.; Bashir, S.Y. Haematological indices and carcass composition of African catfish Clarias gariepinus (Burchell, 1822) fingerlings fed with fluted pumpkin leaf (Telfairia occidentalis) as feed additives. Niger. J. Biotechnol. 2021, 38, 83. [Google Scholar] [CrossRef]
- De, M.; Ghaffar, M.A.; Noor, N.M.; Cob, Z.C.; Bakar, Y.; Das, S.K. Effects of water temperature and diet on blood parameters and stress levels in hybrid grouper (Epinephelus fuscoguttatus ♀ × E. lanceolatus ♂) juveniles. Aquac. Rep. 2019, 15, 100219. [Google Scholar] [CrossRef]
- Donaldson, M.R.; Cooke, S.J.; Patterson, D.A.; Macdonald, J.S. Cold shock and fish. J. Fish Biol. 2008, 73, 1491–1530. [Google Scholar] [CrossRef]
- Djurichkovic, L.D.; Donelson, J.M.; Fowler, A.M.; Feary, D.A.; Booth, D.J. The effects of water temperature on the juvenile performance of two tropical damselfishes expatriating to temperate reefs. Sci. Rep. 2019, 9, 13937. [Google Scholar] [CrossRef] [PubMed]
- Islam, M.A.; Uddin, M.H.; Uddin, M.J.; Shahjahan, M. Temperature changes influenced the growth performance and physiological functions of Thai pangas Pangasianodon hypophthalmus. Aquac. Rep. 2019, 13, 100179. [Google Scholar] [CrossRef]
- Shokri, M.L.L.; Basset, A. The seasonal response of metabolic rate to projected climate change scenarios in aquatic amphipods. J. Therm. Biol. 2024, 124, 10394. [Google Scholar] [CrossRef]
- Herrera-Castillo, L.; Vallejo-Palma, G.; Saiz, N.; Sánchez-Jiménez, A.; Isorna, E.; Ruiz-Jarabo, I.; de Pedro, N. Metabolic rate of goldfish (Carassius auratus) in the face of common aquaculture challenges. Biology 2024, 13, 804. [Google Scholar] [CrossRef]


Disclaimer/Publisher’s Note: The statements, opinions and data contained in all publications are solely those of the individual author(s) and contributor(s) and not of MDPI and/or the editor(s). MDPI and/or the editor(s) disclaim responsibility for any injury to people or property resulting from any ideas, methods, instructions or products referred to in the content. |
© 2025 by the authors. Licensee MDPI, Basel, Switzerland. This article is an open access article distributed under the terms and conditions of the Creative Commons Attribution (CC BY) license (https://creativecommons.org/licenses/by/4.0/).