Article

Mapping and Assessing Commercial Fisheries Services in the Lithuanian Part of the Curonian Lagoon

by
Edgaras Ivanauskas
*,
Andrius Skersonas
,
Vaidotas Andrašūnas
,
Soukaina Elyaagoubi
and
Artūras Razinkovas-Baziukas
Marine Research Institute, Klaipeda University, Universiteto Ave. 17, LT-92294 Klaipėda, Lithuania
*
Author to whom correspondence should be addressed.
Fishes 2022, 7(1), 19; https://doi.org/10.3390/fishes7010019
Submission received: 25 November 2021 / Revised: 31 December 2021 / Accepted: 3 January 2022 / Published: 14 January 2022

Abstract

:
The spatial distribution of biomass of main commercial fish species was mapped to estimate the supply of a provisioning fishery service in the Curonian lagoon. Catch per unit effort (CPUE) was used as a proxy to estimate the efficiency of commercial fishing and, subsequently, the potential biomass of fishes. The relationship between distinctive characteristics of the fishing areas and corresponding commercial catches and CPUE was analyzed using multivariate analysis. The total catch values and CPUE used in the analyses were derived from the official commercial fishery records. RDE analysis was used to assess the variation of both catch and CPUE of commercial fish species, while the percentages of bottom sediment type coverage, average depth, annual salinity, and water residence time in each of the fishing squares were used as explanatory variables. This distance e-based redundancy analysis allowed for the use of non-Euclidean dissimilarity indices. Fisheries data spatial distribution map indicated the lack of coherence between the spatial patterns of commercial catches and CPUE distribution in the northern part of the lagoon. Highest CPUE values were estimated in the central-eastern part of the lagoon as compared to the western part of the lagoon where CPUE values were substantially lower. Both total catch and CPUE appeared not to be related to the type of bottom habitats statistically while being spatially correlated in-between. However, the impact of salinity and water residence time calculated using the 3D hydraulic circulation model on the distribution of both CPUE and commercial catches was statistically significant.

1. Introduction

Estuaries and lagoon ecosystems provide many benefits to humans and create a variety of ecosystem services. These ecosystems are distinguished by high productivity and importance for wildlife and humans. High productivity provides large sources of food and nutrients. Lagoons and estuaries provide habitat for fish spawning, rearing, act like nurseries for juvenile fish [1], support plants and animals, help prevent flooding, and are attractive areas for recreational activities [2]. Fish resources are important and valuable ecosystem services globally. Fish is an important food and protein source for food security and the wellbeing of humans. Fish is also vital for the ecosystem itself through affecting food webs through predation or being prey to other predators themselves [3]. For example, piscivores, preying on zooplanktivores can exert a strong top-down control resulting in a cascade of effects down the food chain. Consumption of organisms by fish is a distinctive feature, which can regulate the trophic structure and thus influence the stability, resilience, and food web dynamics of aquatic ecosystems; moreover, these regulatory influences change as fish pass from one life stage to another [4,5]. Carpenter [6] has described a simplified mechanism, where a decrease in the predation pressure on zooplankton results in an increase of zooplankton, which in turn increases the predation on phytoplankton.
According to Holmud and Hammer [7], ecosystem services provided by fish can be distinguished into two categories: fundamental and demand-derived ecosystem services. Holmud and Hammer [5] define ‘fundamental ecosystem services’ as essential for ecosystem function and capacity to recover. Such services are vitally important for humans regardless of whether people realize their importance or not. Like fish, which are a crucial part of the aquatic ecosystem for their impact on the food web, ‘demand driven’ ecosystem services, such as value generated from recreation, is a concept formed from a demand of human needs and human perspective of monetary values, but is not crucial for a human society to survive. Although demand services are easier to estimate and evaluate their monetary value, demand-derived ecosystem services ultimately depend on natural systems and the fundamental ecosystem services provided by fish. This is the case for cultural and provisioning ecosystem services, which strongly depend on the capability and flow of supporting and regulating services [8]. Formerly, estimates of the value of fish stocks for human societies have predominantly focused on these goods. The fact that such values derived from ecosystems with complex interactions and that both economically and non-economically valuable fish populations play active roles in the maintenance of these ecosystems and in the provision of a range of ecosystem services, is seldom considered. However, economics and ecology do not function in isolation from one other, changes of one can have a significant effect on another. For example, if the fish demand is high and fish prices increase, it may directly affect the ecosystem by the increased commercial fishery. There is insufficient information about ecological and sociological knowledge of how ecosystem services are produced and delivered, and how they vary in time and space [9,10].
In this work, we focus on the commercially important fish species in the Curonian lagoon. Of the four ecosystem service categories described in the Millennium Ecosystem Assessment [11], generally only provisioning services have market values and it is possible to determine an estimate on the spot and in time. Using existing data, we estimated the value of caught fish in fishing squares by commercial fisheries. We applied a simple analysis assigning sediment type, average depth, and landings for each of the allocated fishing squares (zones), based on existing Curonian lagoon map and commercial fishery data.
The objective of this study was to assess and evaluate fishery provisioning ecosystem services in the Curonian lagoon. We investigated whether sediments, bathymetry, and other properties (salinity and circulation patterns) affect commercial fishery catches and effectiveness using the catch per unit effort (CPUE) as a proxy. The work is based on the commercial fishery data collected as paper records submitted to the EPA. The paper is structured as follows. The first part of this work describes the methodological approaches in the study. The second part presents the results of our analysis in the form of a practical approach to evaluating services relevant for water resource management. The third part discusses the challenges in valuing ecosystem services and integrating biophysical and economic assessments.

1.1. Study Area

The Curonian lagoon is the largest freshwater basin in Lithuania and the largest lagoon in Europe (area 1584 km2) located in the southeastern Baltic Sea. The lagoon is connected to the Baltic Sea through the narrow Klaipeda strait and is dominated by the Nemunas river discharges. The lagoon is hypereutrophic [12] and its water quality is controlled by physical factors such as riverine discharges, atmospheric dynamics, and water temperature regime [13,14].
During the development of the seaport, the Klaipeda strait was dredged, enhancing the exchange between the lagoon and the sea [15]. The lagoon is considered as a representative flow-through lagoon with an average water residence time (WRT) of 152 days [16]. However, there is clear spatial heterogeneity in both chemical and physical parameters as well as bottom sediment characteristics [17]. Southern and central parts of the lagoon contain freshwater due to the riverine discharge [18], while the northern part is a mixing zone of marine, lagoon, and riverine waters. In the summer, WRT is the lowest as there is little input to the lagoon from either source [17].

1.2. Fish Communities in Curonian Lagoon

The Curonian lagoon and Nemunas delta area contribute to about 95–98% of the total inland fishery in Lithuania, added only by specialized fishery of eels, vendace, and lake smelt in larger lakes. As in most coastal lagoons, characterized by high biological productivity [19], the Curonian lagoon is one of the richest Baltic Sea areas in terms of fish production, where commercial catches have amounted to up to 60–80 kg/ha for a long time. Many of the fish species found in the Curonian lagoon migrate to the lower reaches of the Nemunas River and its smaller tributaries for spawning. Later their fry migrates back to the Baltic Sea to forage and mature. According to [20], due to the diadromous fish and cephalaspidomorphi migrations, significant seasonal changes in fish communities were observed, while some freshwater fishes perform foraging migrations from the lagoon to the Baltic Sea. In addition, there is a clear indication that during the spring, the flooded areas in the lower reaches of Nemunas River serve as a spawning ground for many fish species migrating there from the Nemunas River and the Curonian lagoon. The scale of migration in flooded areas and their significance in the reproduction (thus recruitment) of fish stocks in the Curonian lagoon is directly dependent on fishing pressure, hydrological, and meteorological factors. The intensity of migration to the flooded areas is related well to the duration and scale of the spring floods [21]. The Curonian lagoon is referred to as high biological productivity eutrophic, bream—pikeperch—smelt waterbody type. Bream (Abramis brama L.), pikeperch (Sander lucioperca L.), and smelt (Osmerus eperlanus L.) are the main commercial fish species and main targeted species for anglers. Despite the fact that total catches in the Curonian lagoon are quite stable for nearly two decades, which implies that fishery is optimal and sustainable, according to some researchers [22] and management authorities, the composition and structure of the fish community have changed significantly. Decrease in catches of such predatory commercially important species as pikeperch, pike, burbot, and eel with the increasing share of roach and bream may well question the sustainability of present fishery management.

2. Materials and Methods

2.1. Data, CPUE Calculation, and Catch Value Estimation

Data, CPUe calculation, and catch value estimation. Total catch values and catch per unit effort (CPUE) were derived from transcripts of monthly commercial fisherman reports provided by Šilutė Wildlife Protection Inspectorate. Each of the reports (approx. 400 reports in total were digitalized and analyzed) contained: fishing location (fishing square), fishing gear type, quantity, duration (in days), and catch by species, and initial sale price. Two separate formulas were used for the CPUE calculation of gillnets (Equation (1)) and fyke nets (Equation (2)). Out of all records, 7.5% of data were considered incomplete (some important fields were missing); incomplete records were discarded from CPUE calculation. The fishing gear in the Lithuanian part of the Curonian lagoon could be classified into six groups. Three groups of gill nets: 60–80 mm, 40–50 mm, and 16–20 mm mesh size, and three groups of fyke nets: large 30–45 mm m, medium 18–30 mm and small 12–20 mm mesh size fyke nets. The CPUE was calculated using the formula below:
E i = Y i t i l i / 75
where: Ei—CPUE; Yi –catches in kg in the record ti—fishing days; li—gill net length in meters; i—specific fishing gear type, for example: fyke nets.
E i = Y i t i k i
Ei—CPUE; Yi—catches in kg in the record; ki—fishing gear quantity (when using fyke nets); ti—fishing days; i—specific fishing gear type, for example, fyke nets.
For the evaluation of basic provisioning ecosystem services provided by the fishery in the Curonian lagoon, the same transcripts of monthly commercial fisherman reports were used to estimate the initial selling price of the catch (euro/kg) separately for all fish species. Prices were indicated in 78% of reports. For 22% of reports (which makes 14.5% of the total catch in Curonian lagoon for 2017) catch value was approximated using the average selling price for certain fish species.
The environmental factors included in the statistical analyses—the percentage of bottom sediment types, average depth, annual salinity, and water residence time in each of the fishing squares—were derived from the digital maps produced in Ferrarin et al. [17].

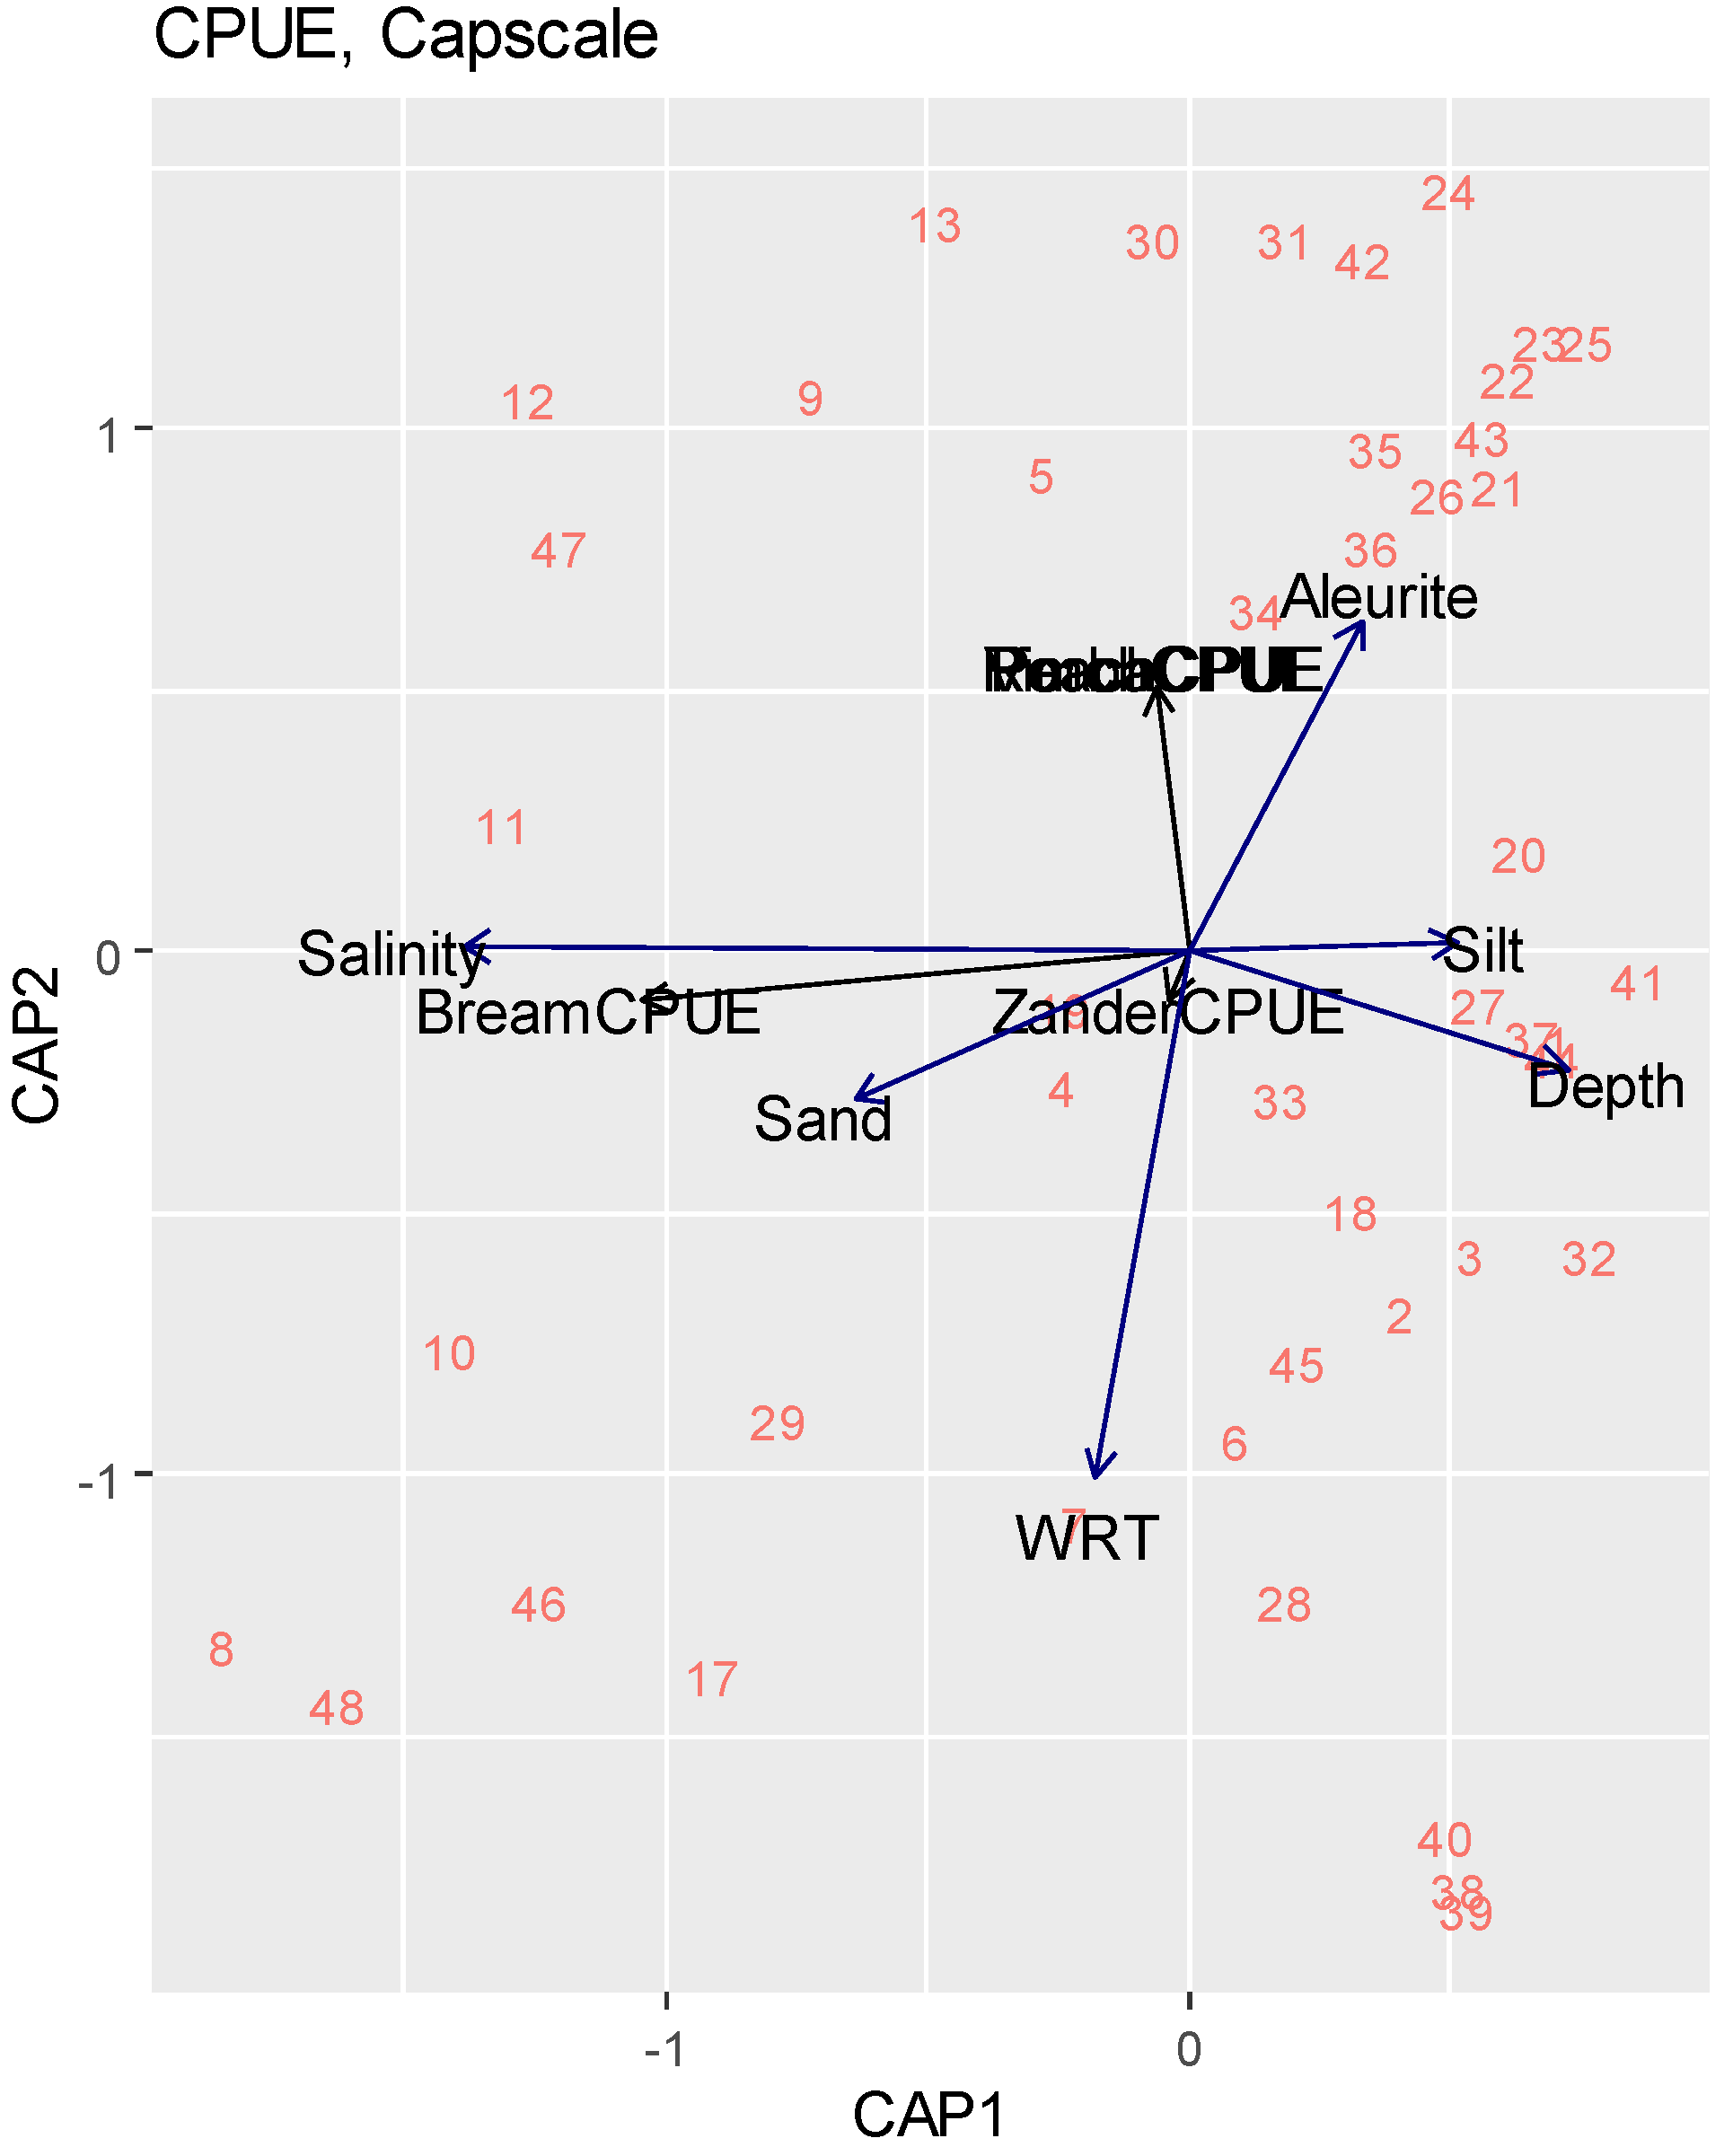
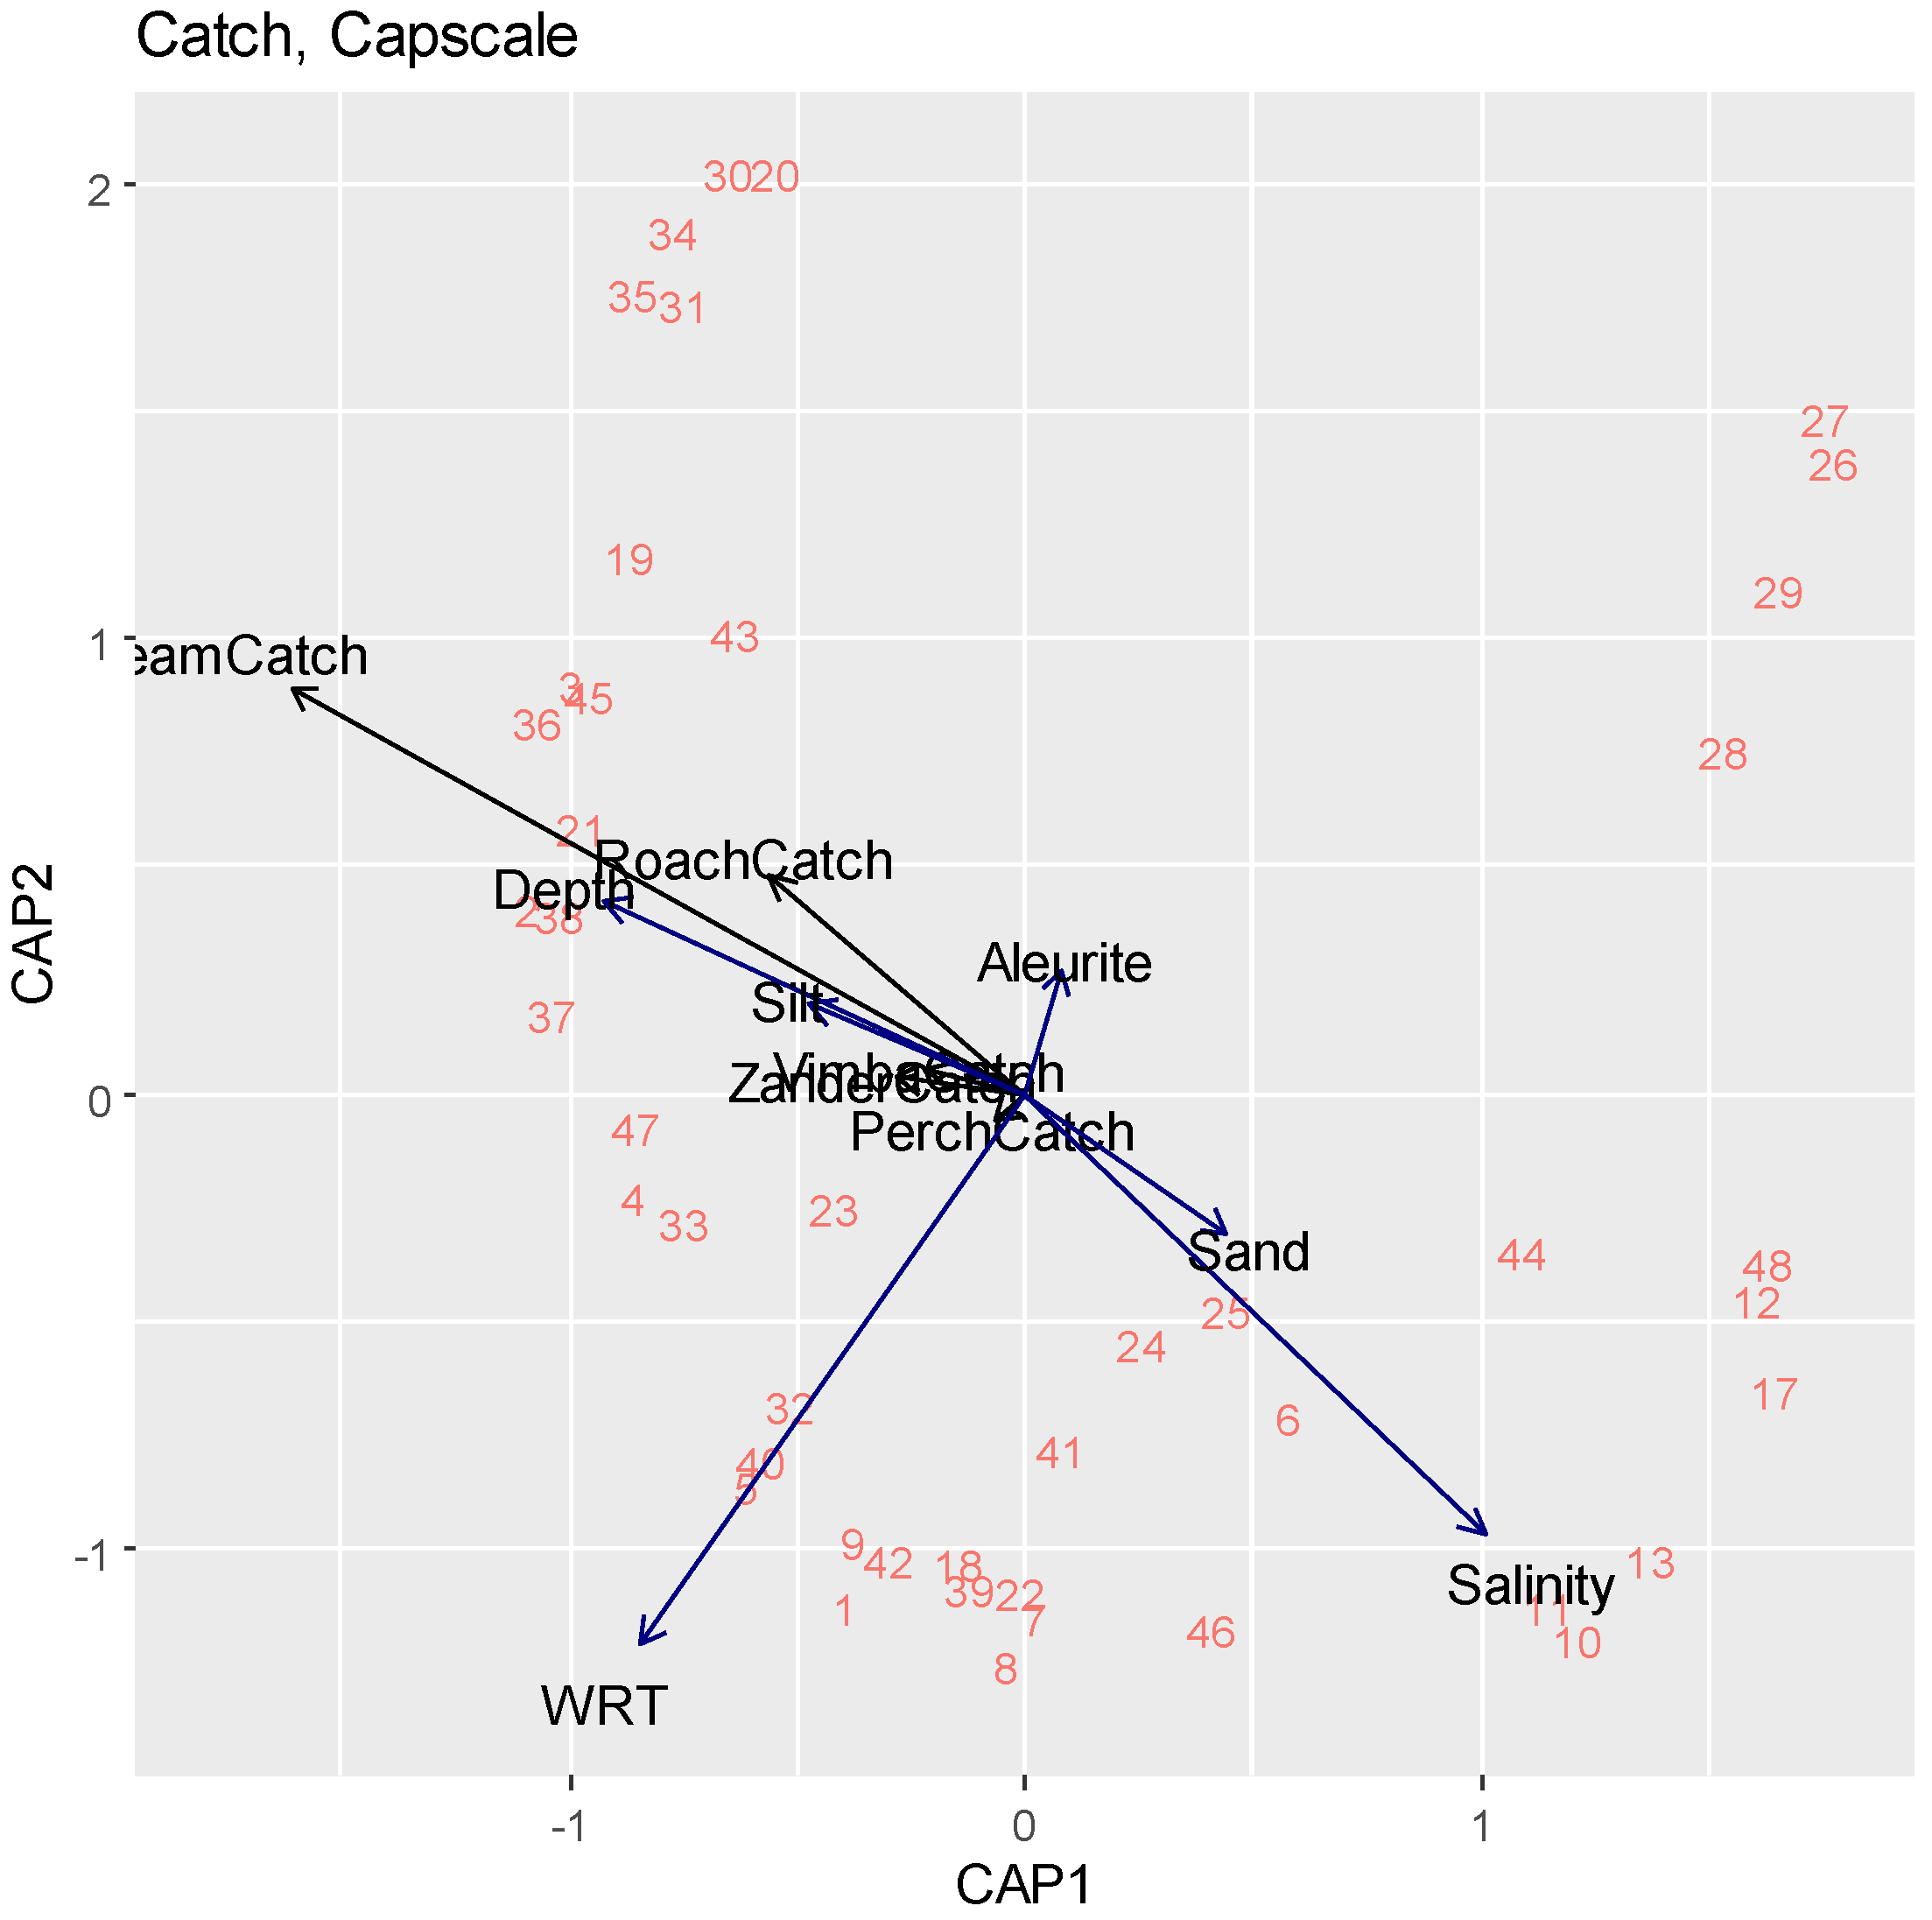
2.2. Statistical Analysis
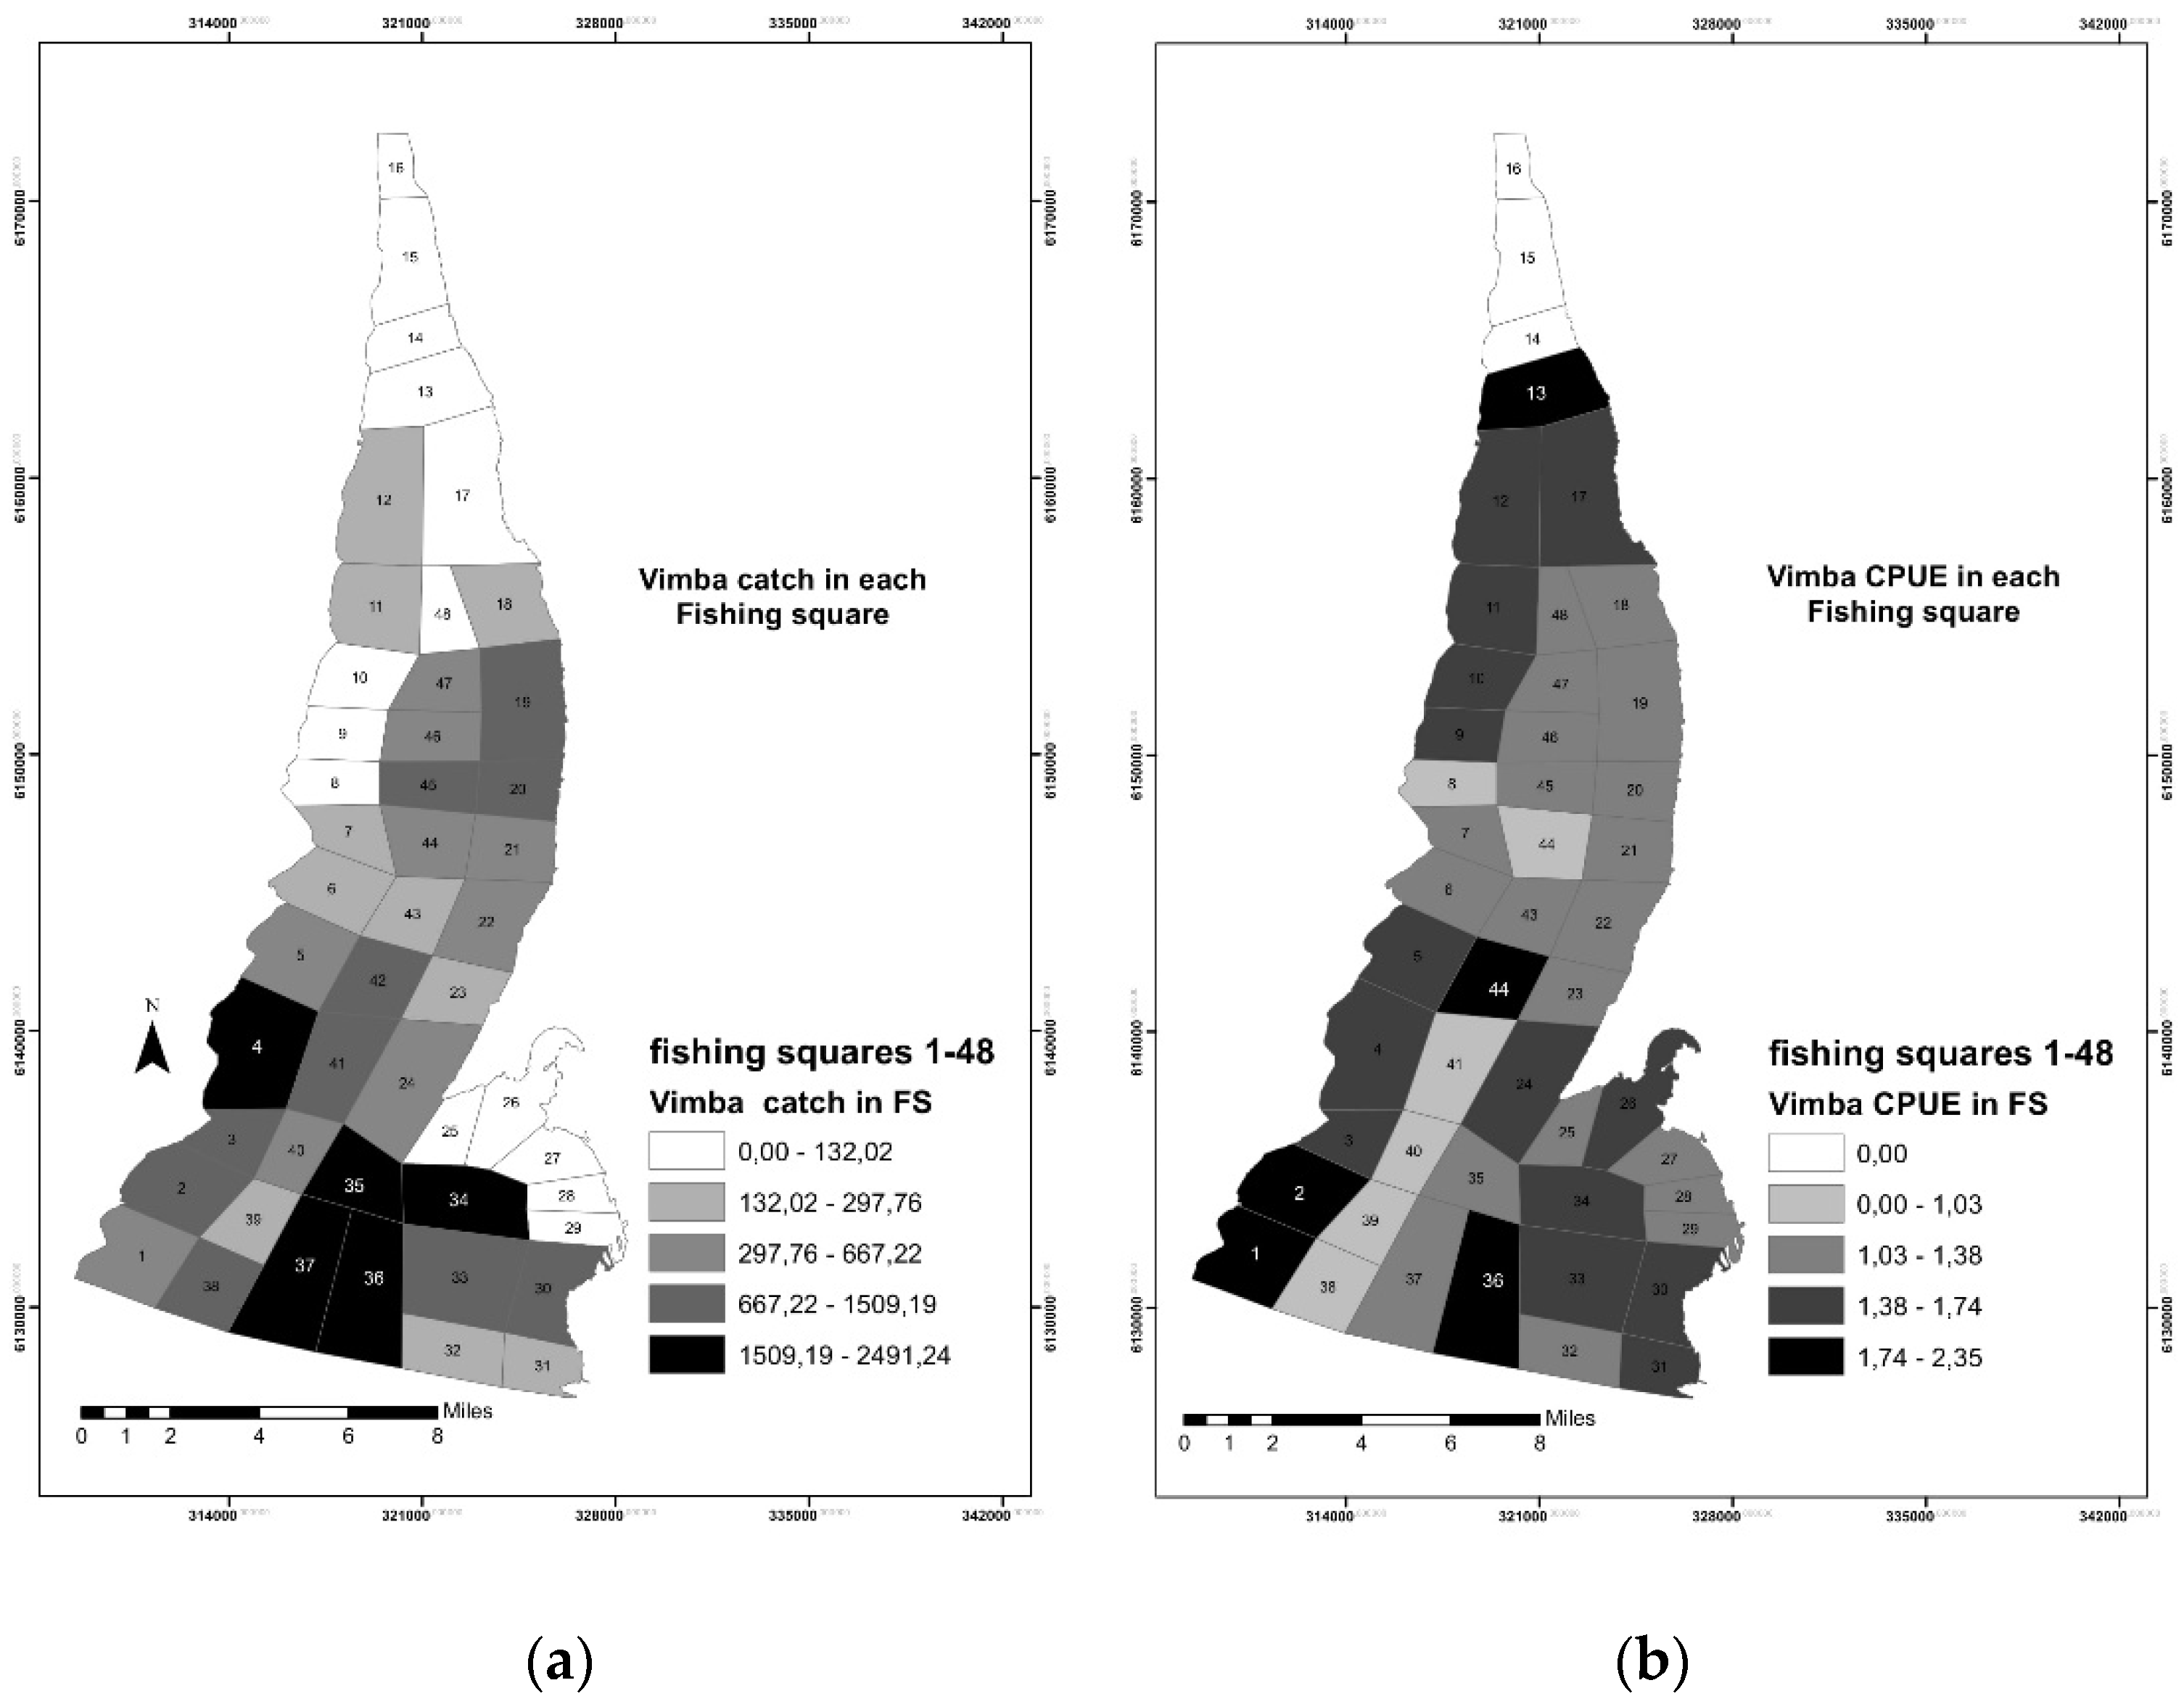
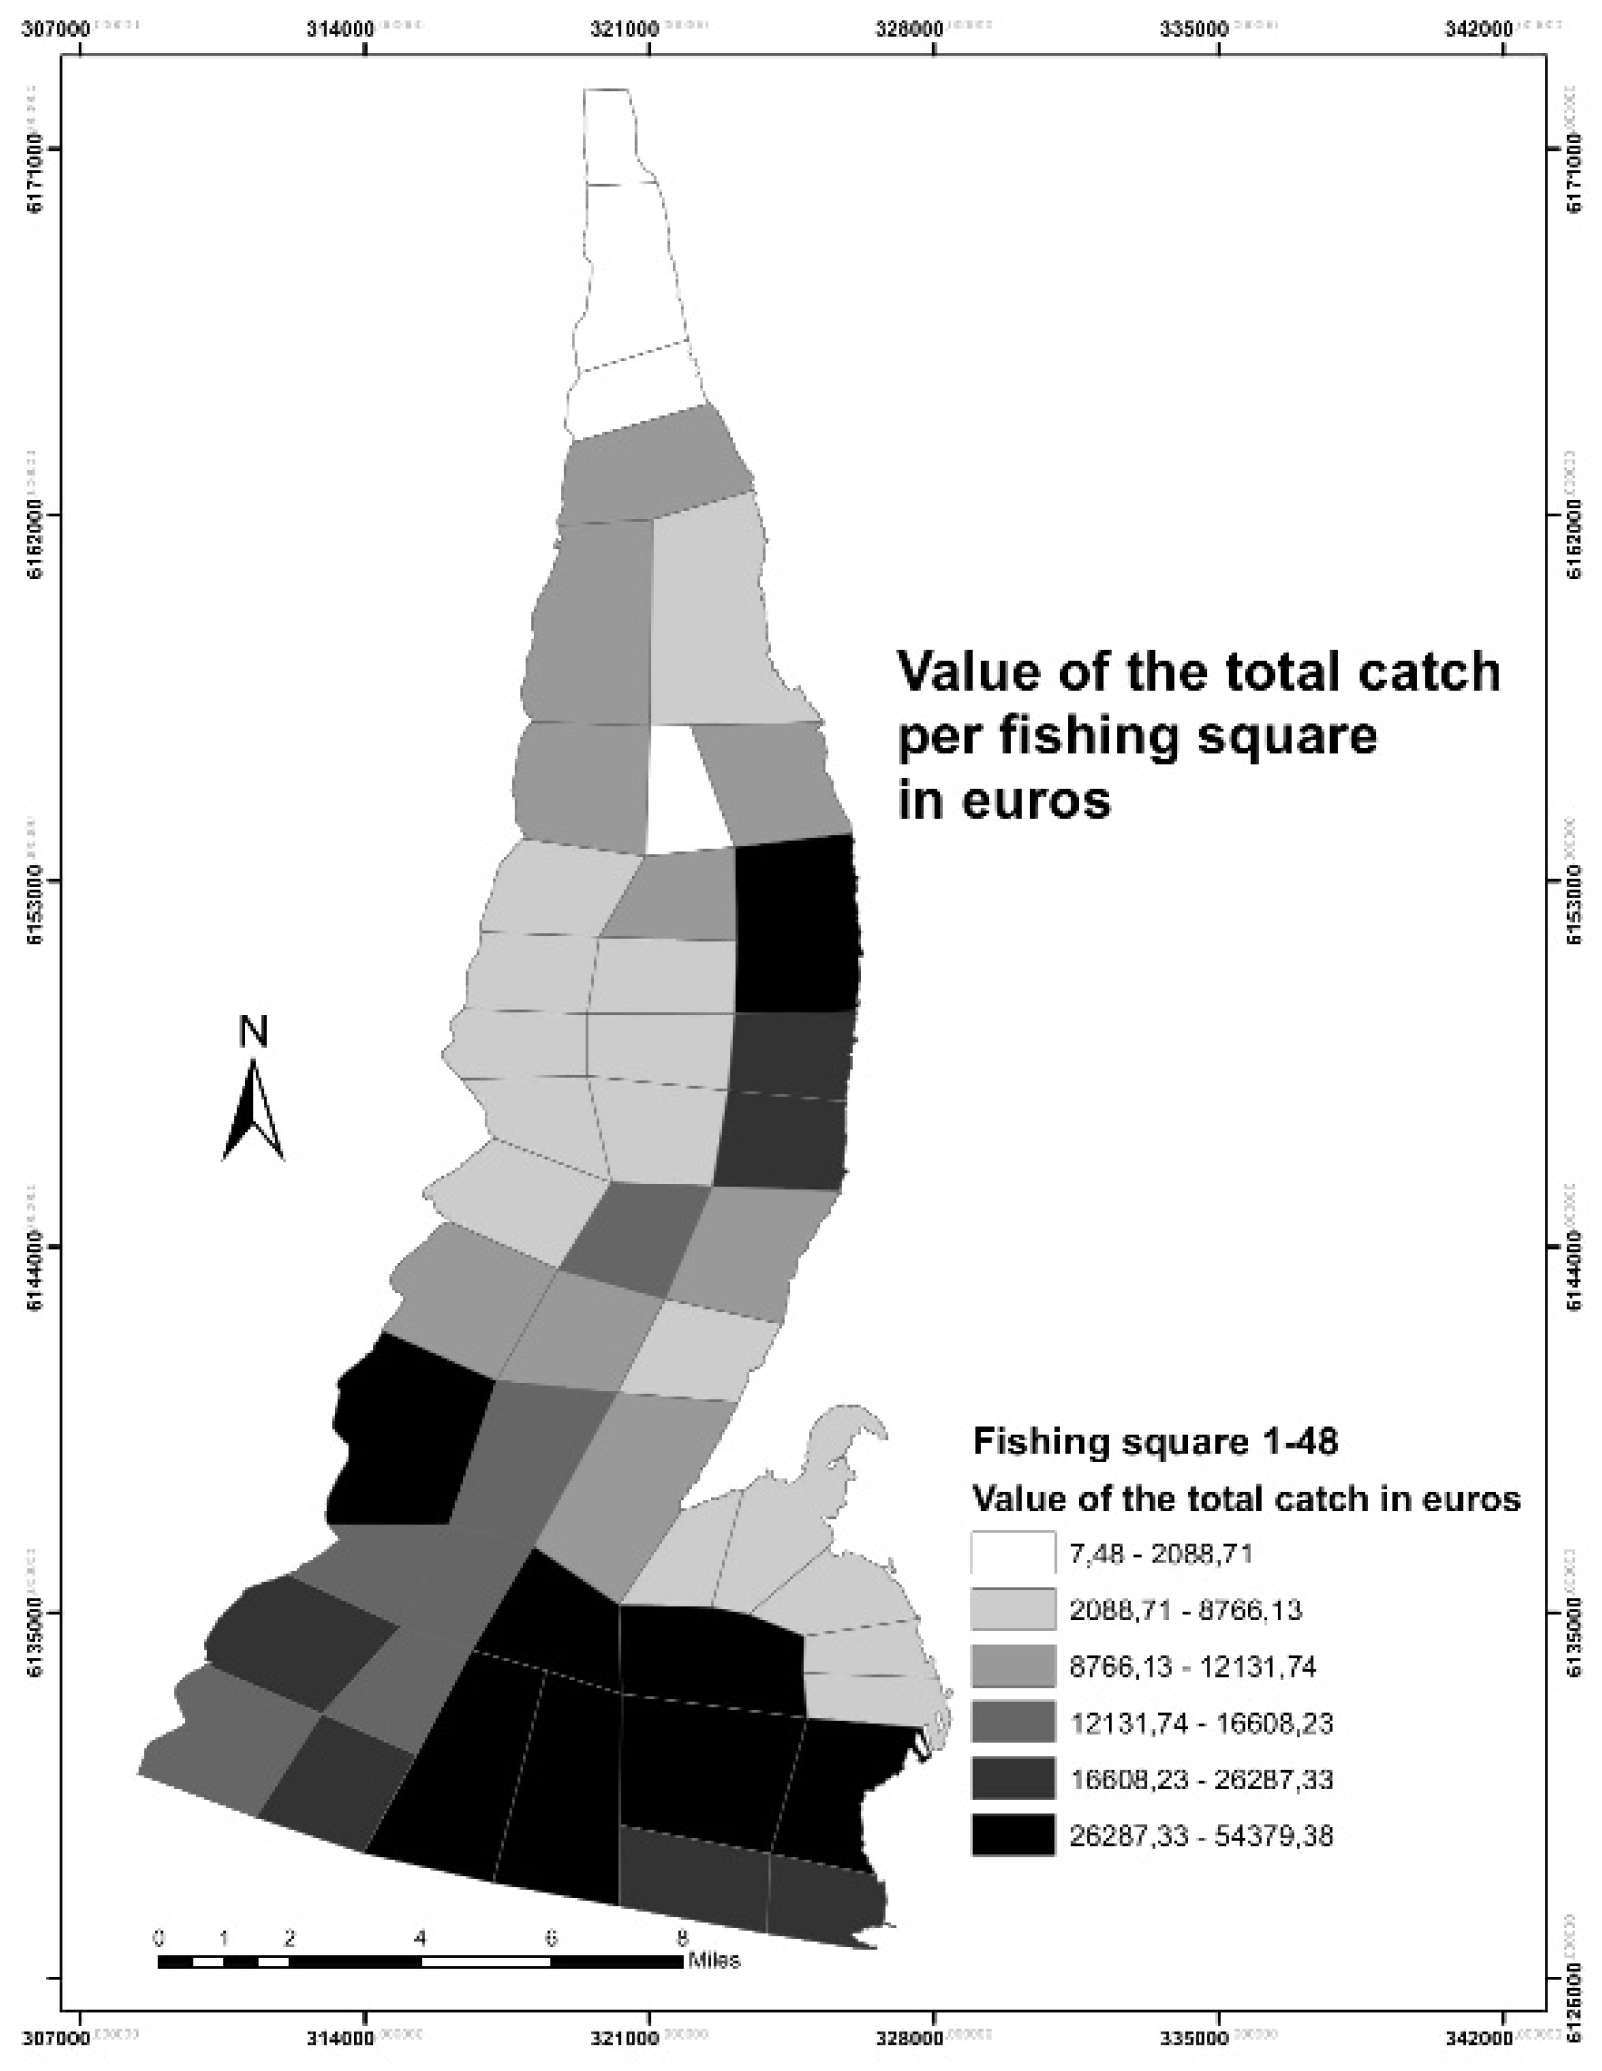
To assess the impact of habitats on both catch and CPUE of commercial fish species, the percentage of different bottom sediment types, average depth, average annual salinity, and water residence time in each of the fishing squares were used as explanatory variables. We did apply the distance-based redundancy analysis (dbRDA) as an ordination method similar to redundancy analysis (RDA), allowing us to use non-Euclidean dissimilarity indices (Bray–Curtis distance in this particular case) as it is implemented in the VEGAN R package version 2.5 [23].

3. Results

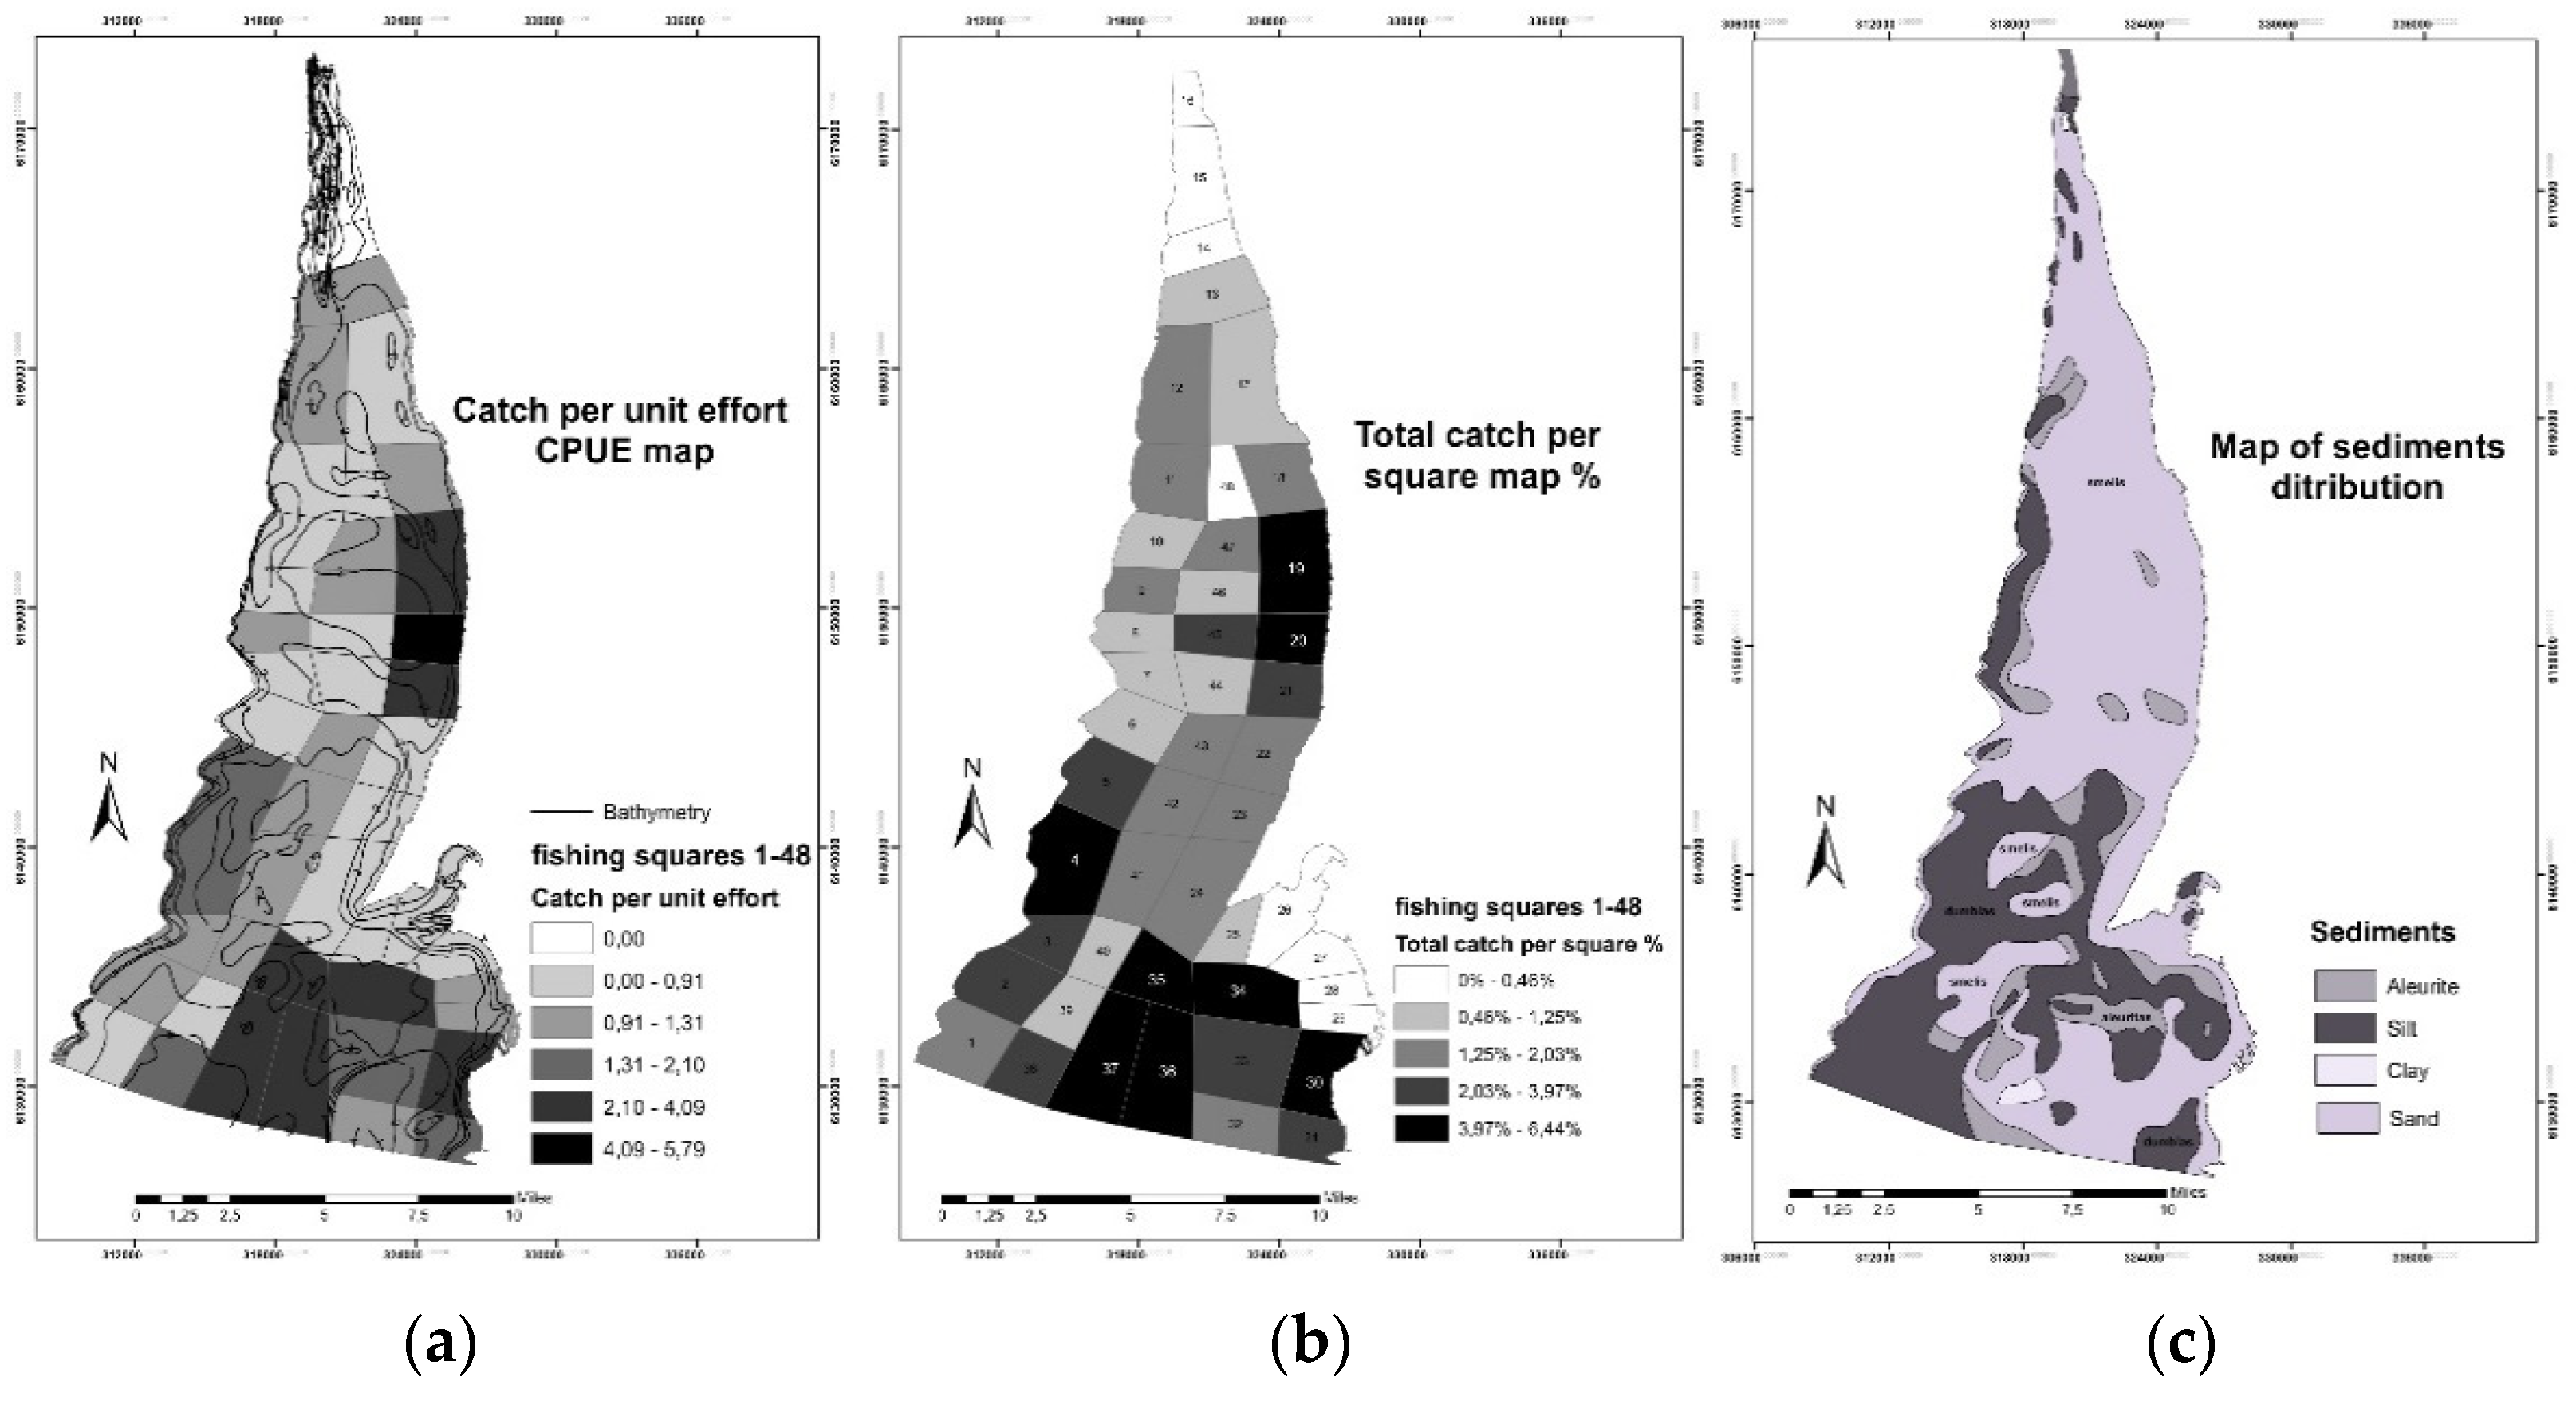
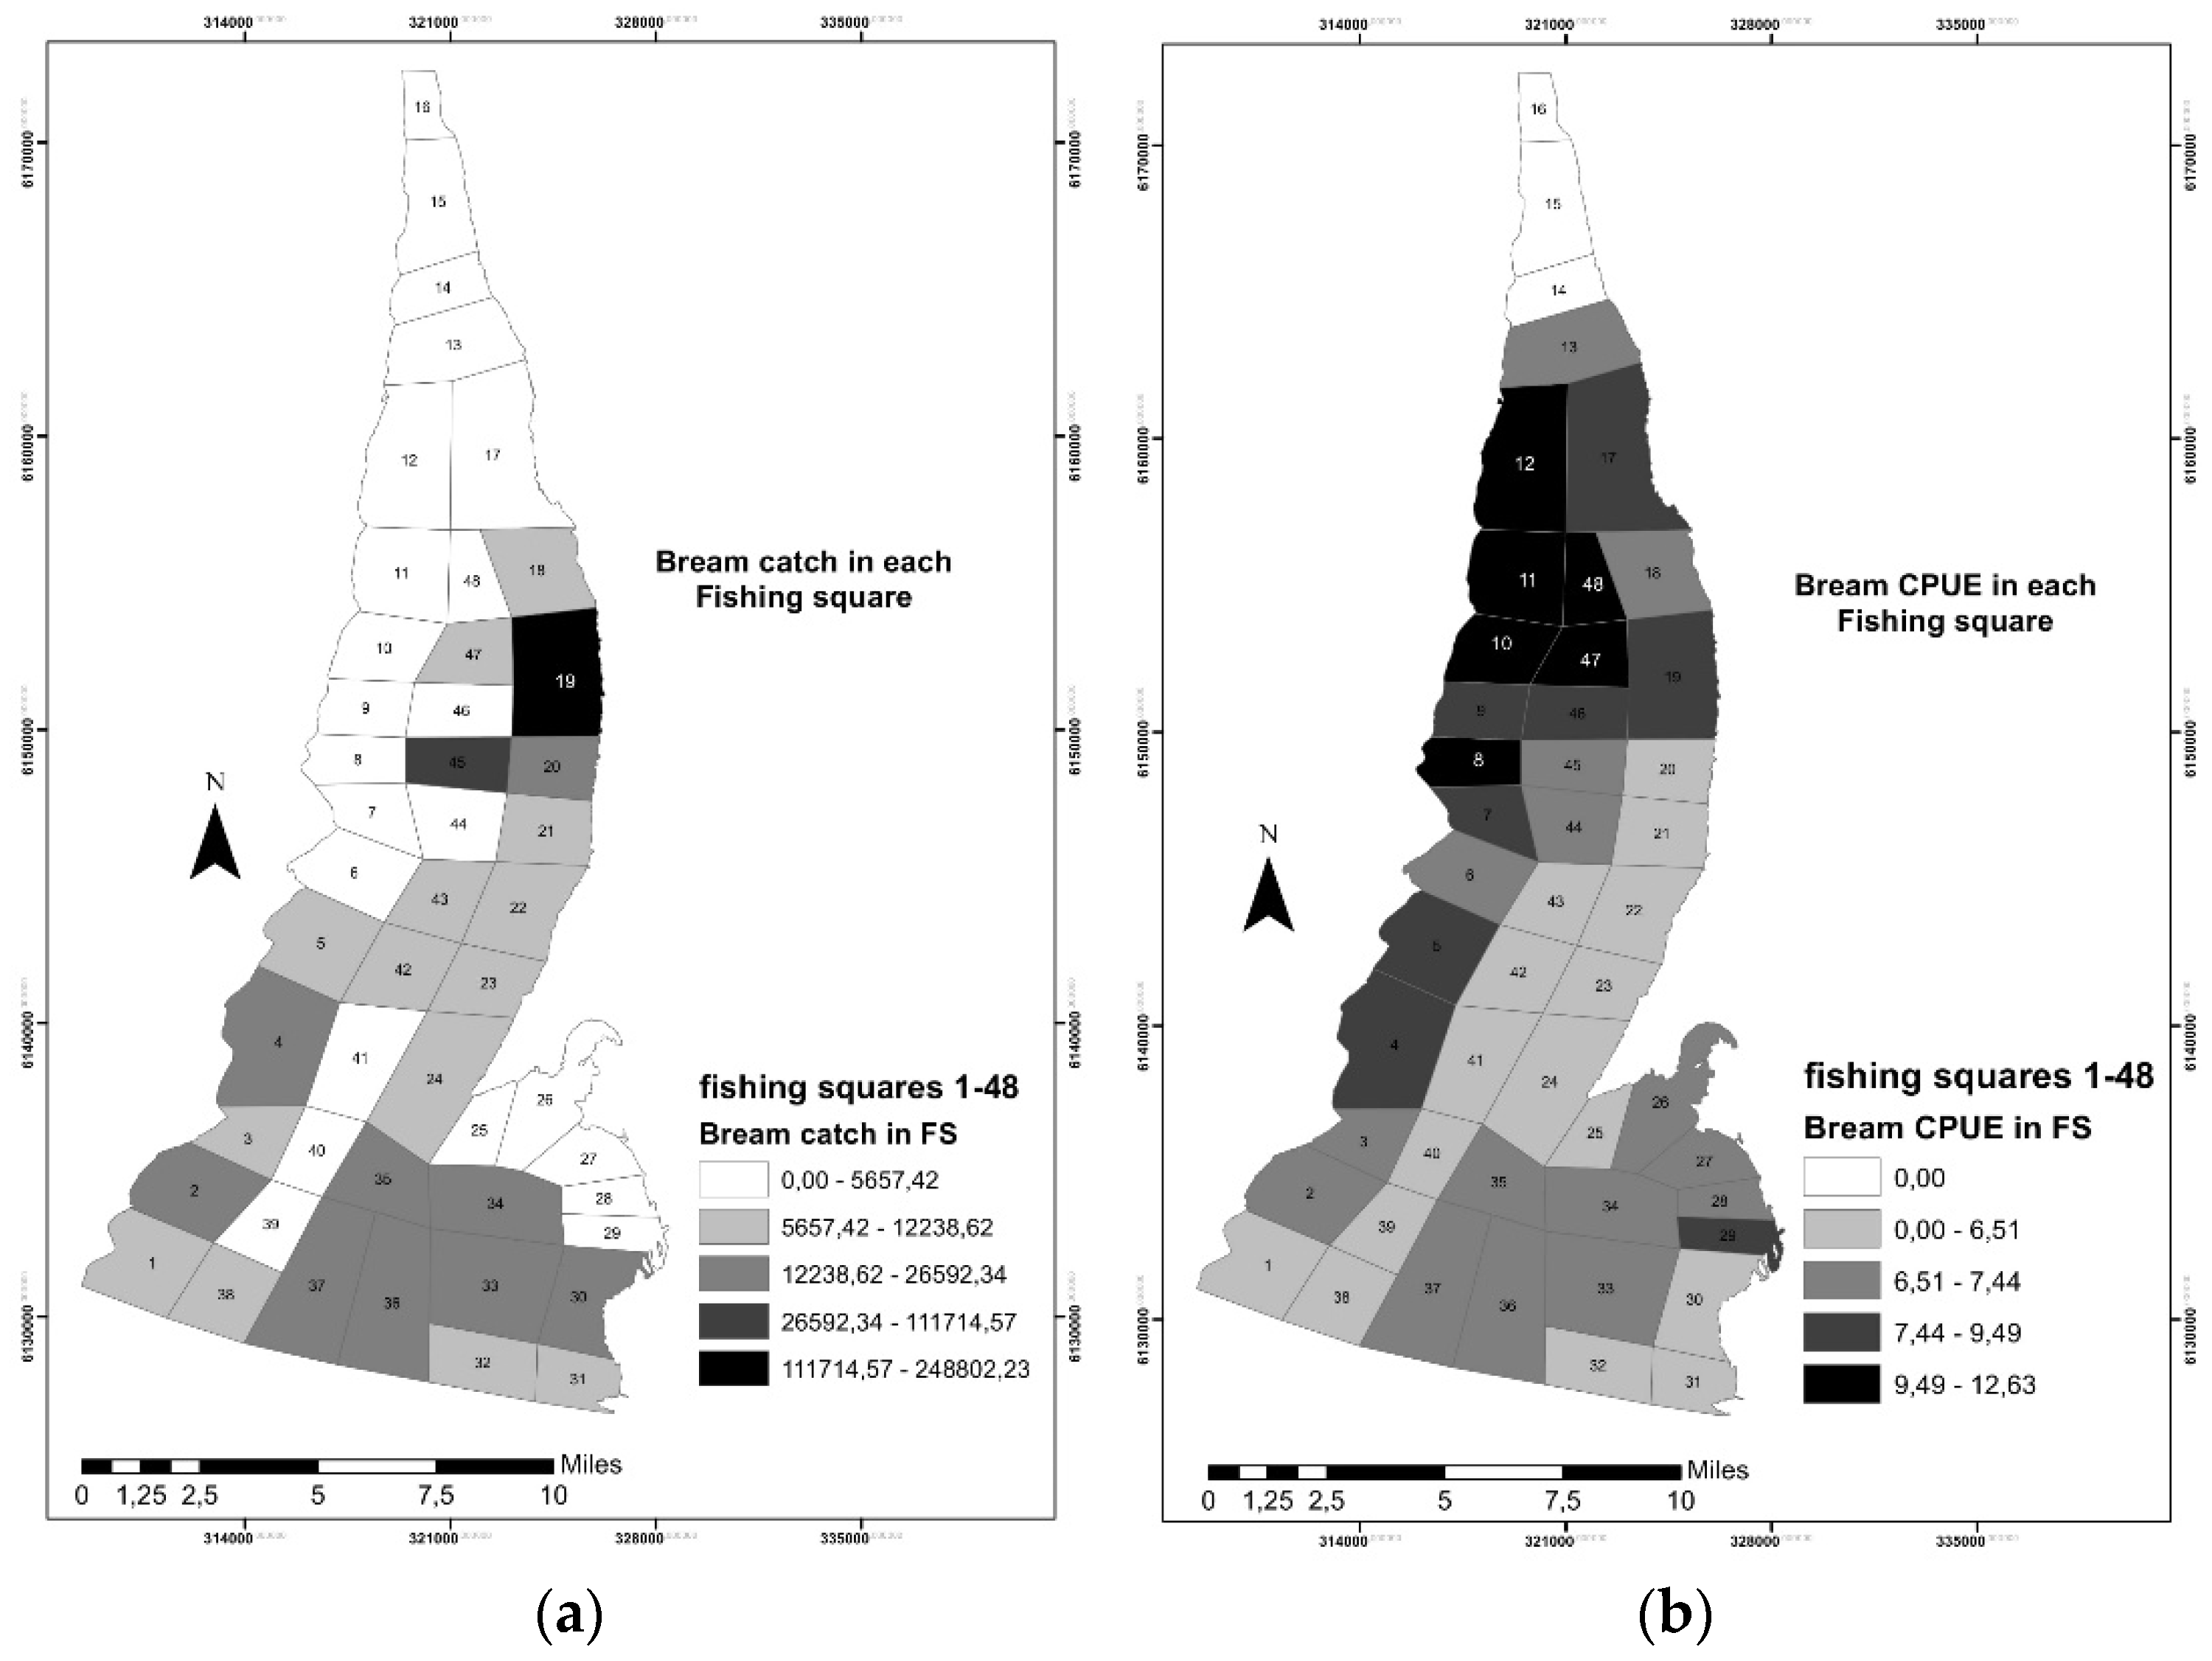
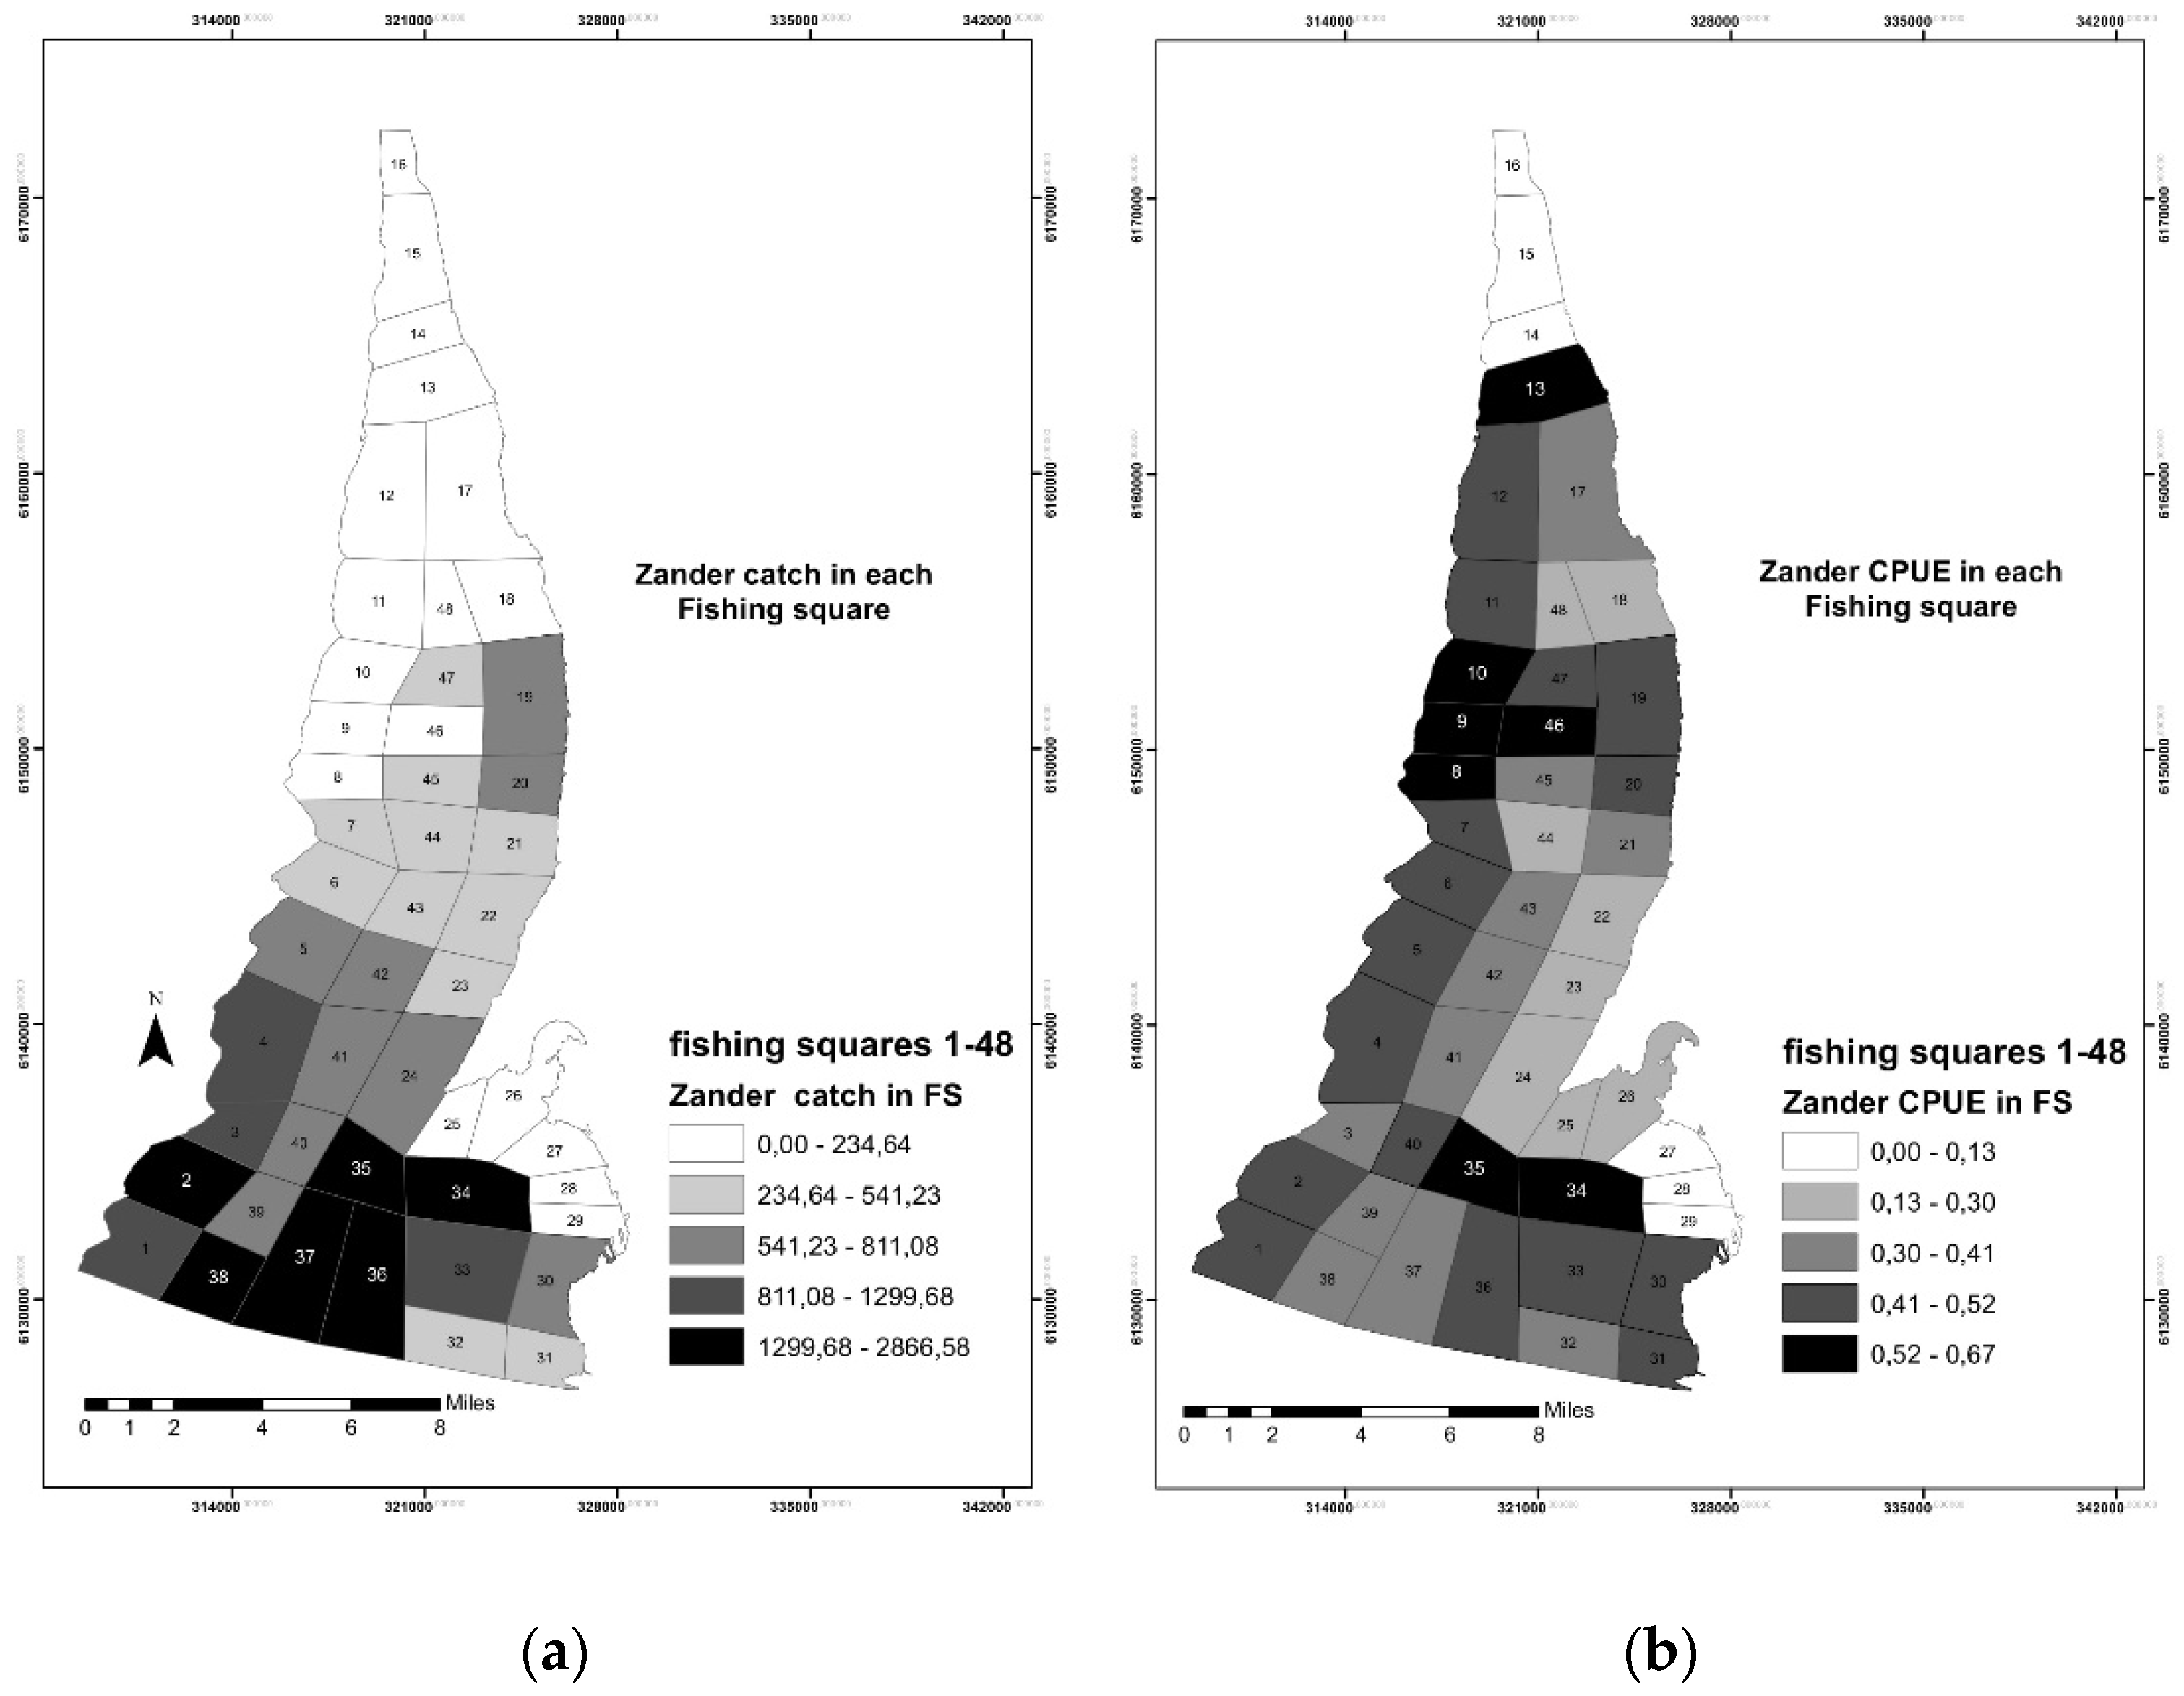
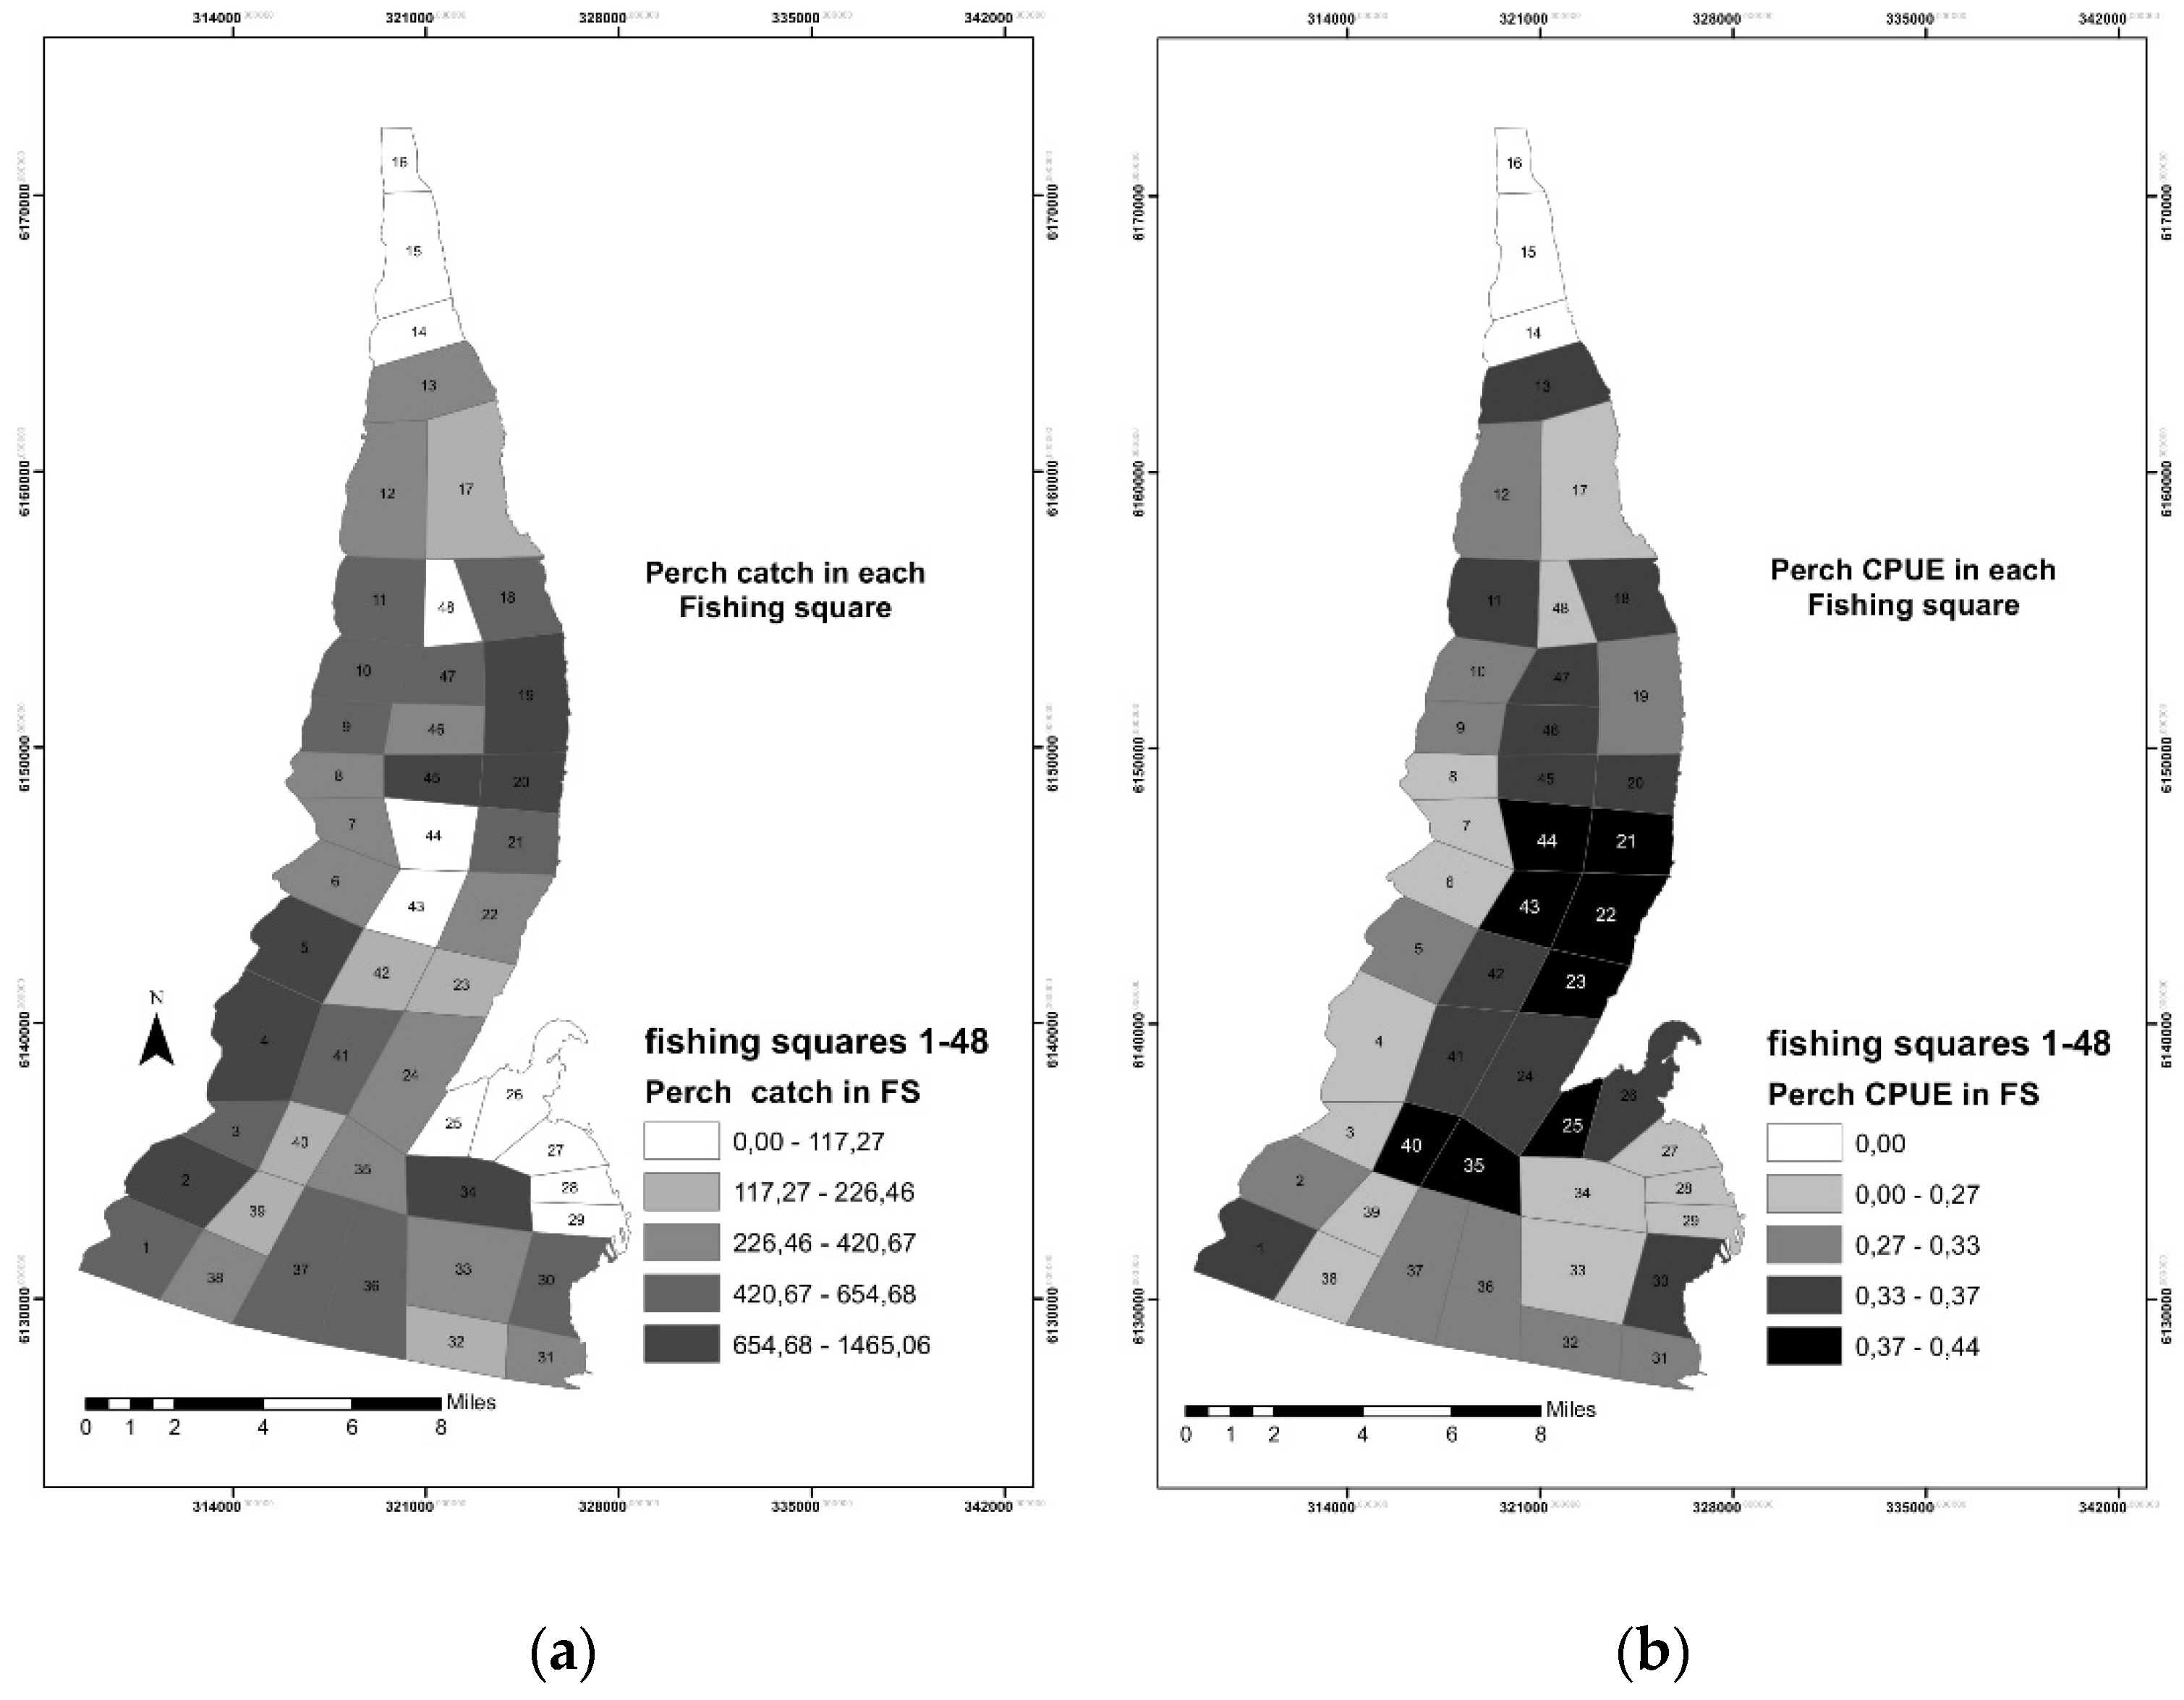
3.1. Fisheries Data Analysis and Mapping

Our analyzed fisheries data and produced CPUE distribution map (Figure 1) for each fishing square (FS) shows that CPUE is not uniformly distributed in the Curonian lagoon. Fishing squares 14–16 are empty since commercial fishery are not allowed in the northern part of the lagoon. The largest CPUE values 4.09–5.79 kg/75 m/day were estimated in the central-eastern part, (Fishing square20, Figure 1). Closely located FS, 19 and 21 also are characterized by higher-than-average CPUE values of 2.1–4.09 kg/75 m/day. There is a visible pattern of more productive areas in the central part of the lagoon, with a more uniform CPUE distribution gradient. All the FS in the western part of the lagoon had lower CPEU values compared to the rest of the FS. However, the low CPUE values in the south-eastern part, 25–31 FS of lagoon could not be explained by the restrictions for any kind of fishing activity and seasonal regulations, banning the usage of specific fishing gear.
Sediment distribution (Figure 1c) and bathymetry (Figure 1a) of the lagoon are becoming more complex, moving from north to south. The deepest location in the north is the dredged port area. The eastern part of the lagoon is shallower, and the bottom sediments consist mostly of sand, with patches of finer sediments. The western part is deeper, and silt is more abundant. Generally, the bottom sediment distribution and the depth are related.
Comparing the CPUE distribution map (Figure 1a) and total catch per square map (Figure 1b), it is visible that FSs with the highest CPUE coincide with high total catches. Comparing the CPUE distribution map (Figure 1a) and total catch per square map (Figure 1b), it is visible that FSs with the highest CPUE coincide with high total catches. The CPUE in the norther and western areas of the lagoon is lower as compared to the southern and central-eastern areas. Likewise, in areas where CPUE is highest, the contribution to the total catch is largest. Low to medium CPEU values and high catch contribution to the total catch in the lagoon form the premise that fishery in those areas is intensive but not as efficient.
In order to understand if there is a different spatial pattern in individual fish species landings in the Lithuanian part of the Curonian lagoon, we produced individual maps (Figure 2, Figure 3, Figure 4, Figure 5 and Figure 6). Each of the fish species is fished using a specific fishing gear; for bream, it is gill nets of 60–80 mm mesh size, while zander is caught using 40–50 mm and 60–80 mm mesh size gill nets. Since the roach, bream, and perch are of similar size, gill nets of 40–50 mm mesh size and fyke nets of 30–45 mm and 18–30 mm mesh size are used for these species.
Bream catch in fishing squares (Figure 2a) is distributed unevenly following the CPUE map (Figure 2b). The highest catches of bream are recorded in the FS 19, where almost 25 tons of bream are caught. The highest CPUE value per FS is recorded in the opposite corner of the lagoon from FS 8 to 12. A more even distribution gradient is visible in the southern part of the lagoon; both CPEU and catch of the bream show similar spatial patterns. Despite high CPUE values in FS 8–12 and 46, 46 of these areas contribute little to the overall catch of bream.
The spatial distribution of CPUE of zander—the most commercially valued fish species (Figure 3)—is uniform throughout the entire lagoon. However, while the CPUE in the northern part is like the rest of the lagoon, the catches are much lower. In FSs located in the southern part, where the bulk of the commercial zander landings are recorded, the match between the CPUE and total catch is more balanced.
Roach (Figure 4) is the second most common commercial fish species in the Curonian lagoon after the bream. The CPUE spatial distribution pattern is quite distinctive as compared to other fish species. The CPUE spatial distribution in FSs is the most uniform but catches are concentrated in FSs located in the east of the central part, south, and south-west.
Despite being caught with identical fishing gear, perch (Figure 5) have almost the opposite catch and CPUE spatial distribution in comparison to roach. Catches are uniform throughout the lagoon, but largest CPUE values are in the central eastern, south-central, and south-west parts.
The only migratory fish species included in this analysis was vimba. Although vimba migrates through the Curonian lagoon to upper branches of Nemunas and its tributaries to spawn, it is caught in the lagoon in moderate numbers throughout the year, maximizing in the mid to late autumn period. The shallower, eastern part of the lagoon seems to be the migration route for this species (Figure 6.) where both CPUE and catches are the highest.
There are distinct spatial differences between CPUE and catch distribution for each of the fish species (Figure 2, Figure 3, Figure 4, Figure 5 and Figure 6). Bream has higher CPUE values in the northern part, but the bulk of catches is in the southern and middle parts of the lagoon. Zander has a more uniform CPUE spatial distribution throughout the lagoon, but the most of catches are in the southern part. Roach CPUE values are high in the central part of the lagoon, but catches are more evenly distributed as compared to other species. For perch, both CPUE and catch spatial distributions in fishing have very similar patterns. In the southern part, both catches and CPUE of vimba spatially are well correlated and are related to each other positively, but in the northern part, higher CPUE values do not correspond to higher catches, which may have been caused by episodic seasonal fishing activities. Such descriptive mapping analysis only shows how uneven the spatial distribution of different species is despite the use of similar fishing gear.
To check whether catches of other less abundant or more seasonal species compensate the lower landings in terms of monetary values, spatial distribution of total catches, and estimated monetary value maps were produced. Mapped estimated commercial landings value (Figure 7) is visibly concentrated in the southern part of the lagoon in Nemunas delta and the area close to the Russian border. Following the spatial distribution patterns of the total catch, the monetary value of fish caught in the middle-east part of the lagoon is the highest. As compared to the southern part, the value of catches in the northern part is several times lower.

3.2. Statistical Analysis

The most important and abundant commercial fishery species, zander (Sander lucioperca), bream (Abramis brama), roach (Rutilus rutilus), vimba (Vimba vimba), and perch (Perca fluviatilis) were included in multivariate statistical analysis. We have analyzed the relationship between different sediment types, salinity, water residence time, and fishing square depth to the total catch and CPUE in each of FSs for different fish species.
Five fish species were selected to be included in the multivariate db-RDA analysis. Distance-based redundancy analysis biplot explores the total catch and CPUE in the square of the most common and important fish species in the FS interactions. Both axes of the ordination account for about 93.5% of the highest correlations with either total catch in the square, specific fish species CPUE, or their interaction.
The CPUEs of individual fish species were found to be statistically related to two of the environmental parameters—salinity and water residence time (Figure 8, Table 1). Out of individual fish species, only roach and perch CPUE are related, and both were opposing the residence time, indicating higher CPUEs in the northern part of the lagoon and the Nemunas delta. This relationship can be explained by the fact that roach and perch are caught with the same fishing gear. Vimba also is caught with a similar gear like the roach and perch but there is even less association with these two species. Such lack of association may be predetermined by completely different life cycle and habitat of vimba since this species only migrates through the lagoon. The rest of fish species are unrelated to the other ones.
The catches of individual fish species were found to be statistically related to the same environmental parameters as CPUE, but the relationship to the water residence time was more pronounced than salinity (Figure 9, Table 2). The catches of bream and roach were ordinated quite close, both opposing the salinity (indication of higher catches in the freshwater southern part of the lagoon).

4. Discussion

The Curonian lagoon is dominated by inflow from the Nemunas River, which strongly influences water residence time in the northern part of the lagoon and periodical brackish water intrusions from the Baltic Sea through the Klaipėda strait. Fishes inhabiting the lagoon are a combination of typical freshwater and estuarine species (mostly in the northern part). The Curonian lagoon also is the only pathway to the Nemunas River and its tributaries basins for migratory fish species spawning grounds. As a typical transitional estuarine ecosystem, it has a low diversity but a high abundance of typical fish species, which are tolerant to the salinity fluctuations. Some fish species exhibit wide tolerance to fluctuating environmental conditions typical of these systems [24] and even seasonally migrate to the Baltic for foraging [20]. All the fishing squares were found to have different spatial patterns of CPUE values and total catch distribution. Variation in total catch values is related to the two physical parameters typically characterizing estuarine systems—water residence and salinity. Our results follow the accepted idea that fish distribution in estuarine ecosystems is mostly decided by salinity gradients [24,25] and depth [26,27]. However, depth and bottom sediment type had little to no impact on both CPUE and total catch values in each fishing square even for particular fish species. High connectivity to the marine environment can be seen through high CPUE values but low catches in 13 FS (Figure 1) for most fish species. This is mostly due to seasonal migrations during summer and early autumn when the water temperature at the open sea is quite high and fish are feeding along the Baltic coast. Experimental data by Dainys [28] showed that perch prefer warm brackish coastal Baltic Sea water over warm Curonian lagoon water, even if the feeding conditions are better in the lagoon and preference is cold lagoon water over cold seawater. We could assume a similar behavioral pattern for other lagoon fish species. Therefore, high CPEU values in 13 FS indicate capture of the fish migrating to sea for only a short period of time. These statistics covering only the northernmost FSs do not have a significant impact on the total catches. Similar assumptions were proposed by Kupschus and Tremain [29], suggesting that interactions between salinity, temperature, and mobility of aquatic organisms in estuarine ecosystems are the factors deciding the distribution of estuarine species.
In order to evaluate ecosystem services provided by fish, we must understand the ecosystem and the relationship between the resources, supply service, and demand of that service. Coherent evaluation of ecosystem services requires not only assessment of the actual human demand but also the relation to the service supply (the fish stock), which could ensure the sustainability of consumption. By analyzing total fish supply (we assume CPUE is a certain proxy for fish abundance and biomass) and demand (fishing efforts, hence difference in CPUE in FS) (Figure 1a,b), fish are distributed quite evenly throughout the Curonian lagoon. In general, fishing squares with the highest CPUE values have the largest contribution to the total catch and vice versa, this can be described as evenly distributed flow. Although we identified and analyzed only one provisioning service supplied by fish, we took multiple angles, taking into consideration that not all fish species have the same economical value in both commercial and recreational fisheries. Both the supply and flow of certain fish species can be high but if it has low demand in terms of monetary value, it has no economic value despite being abundant and easily available. A significant step further should be to consider recreational ecosystem services, which also may not correlate with supply (unwanted trophies). Nevertheless, flow of this service is more related to the accessibility and availability issues from a human perspective (accessibility, accommodation infrastructure). Through this work, we have been able to provide some estimates for the fish provisioning service supply and anticipated demand by commercial fishermen. For this ecosystem service, we tried to establish and describe how its flow is affected by environmental factors and fishery. From the ecosystem services perspective, fishery management should not cover only the issues of the maximum sustainable yield (MSY), but also take into consideration the spatial and temporal distribution of fish and its flow affecting ecosystem services. In contrast to other ecosystem services, the flow of fish is extremely easy to evaluate economically, but the correct identification of the supply of this ES is more complicated.
Thus, the spatial patterns of food provision and economic income from ecosystem services provided by fish in the Curonian lagoon ecosystem are evaluated in this paper. These data could be further used for a more comprehensive assessment of ecosystem services, including the recreational fishery. As the main factors deciding both the supply (CPUE) and flow (catches) are physical parameters affected by the climate change, altering fish abundance by shifting their habitat and spatial distribution through changes in salinity, water temperature, vertical mixing rate, and wind-driven circulation [30]. Management of limited resources and not well understood impacts of the climate change to local fish stock in the future may lead to a drastic decline in catches or shifts in the fish community, and consequently, the catch structure. As the indirect impact of climate change Turner et al. [31] discussed climate change-driven shifts in temperature may affect regulation services measured through eutrophication, changes to food provision services measured in fishing stock. Turner et al. [31] have also implied changes to cultural and recreational ecosystem services measured through impacts on tourism and visitor numbers.

5. Conclusions

Our applied approach to the evaluation of ecosystem services provided by fisheries allows spatial mapping of the distribution of supply–demand of these ecosystem services in the lagoon. It could be further used for the spatial valuation of the Curonian lagoon ecosystem. However, the commercial fishery does not comprise all ecosystem services derived from the existing fish stocks as the assessment of recreational fishery is excluded from the current analysis. We did not find any meaningful relationship between the benthic habitats (using the bottom sediment types as proxy) and both catches and CPUE. As it was expected in estuarine systems, the physical gradients (salinity and water residence time) proved to be more important to the distribution of these fish related indicators (Figure 8).
The most obvious constraint in the otherwise detailed Curonian lagoon commercial fishery reporting system is some ambiguity in spatial allocation of catches, which are often assigned to several fishing squares, which may lead to some uncertainties in spatial evaluation. The main message delivered by this paper is the significant spatial differences and mismatch between the supply and flow of fishery ecosystem services of individual fish species, which could serve as an indication of spatially imbalanced fishery practice.

Author Contributions

Conceptualization, A.R.-B. and E.I.; methodology, E.I. and A.R.-B.; software, S.E. and A.R.-B.; formal analysis, E.I. and V.A.; investigation, A.S. and V.A.; resources, E.I.; data curation, E.I., V.A., S.E. and A.S.; writing—original draft preparation, E.I. and V.A.; writing—E.I., A.R.-B. and V.A. editing, A.R.-B. and V.A.; visualization, S.E.; supervision, A.R.-B. All authors have read and agreed to the published version of the manuscript.

Funding

Preparation of the paper was a part of the EcoServe project “The future ecosystem services of the Lithuanian coastal zone: the global change perspective”. This project has received funding from European Social Fund (project No 09.3.3-LMT-K-712-01-0178) under grant agreement with the Research Council of Lithuania (LMTLT).

Conflicts of Interest

The authors declare no conflict of interest. The funders had no role in the design of the study; in the collection, analyses, or interpretation of data; in the writing of the manuscript, or in the decision to publish the results.

References

  1. Franco, A.; Elliott, M.; Franzoi, P.; Torricelli, P. Life strategies of fishes in European estuaries: The functional guild approach. Marine Ecol. Progress Series 2008, 354, 219–228. Available online: https://www.int-res.com/abstracts/meps/v354/p219-228/ (accessed on 1 January 2022). [CrossRef] [Green Version]
  2. Wilson, S.K.; Sumaila, U.R.; Luisetti, T. Maintenance of fish diversity on disturbed coral reefs. Coral Reefs 2009, 28, 3–14. [Google Scholar] [CrossRef] [Green Version]
  3. Pikitch, E.K.; Harmelin-Vivien, M.; Kulbicki, M. Ecosystem-Based Fishery Management. Science 2004, 305, 346–347. Available online: https://www.science.org/doi/10.1126/science.1098222 (accessed on 1 January 2022). [CrossRef]
  4. Carpenter, S.R.; Harmelin-Vivien, M.; Kulbicki, M. Ecological and economic analysis of lake eutrophication by nonpoint pollution. Aust. J. Ecol. 1998, 23, 68–79. [Google Scholar] [CrossRef]
  5. Post, D.M.; Kitchell, J.F. Trophic ontogeny and life history effects on interactions between age-0 fishes and zooplankton. Ergebnisse Limnol. 1997, 49, 1–12. [Google Scholar]
  6. Carpenter, S.R.; Kitchell, J.F.; Hodgson, J.R. Cascading trophic interactions and lake productivity. BioScience 1985, 35, 634–639. [Google Scholar] [CrossRef]
  7. Holmlund, C.M.; Hammer, M. Ecosystem services generated by fish populations. Ecol. Econ. 1999, 29, 253–268. [Google Scholar] [CrossRef]
  8. Haines-Young, R.; Potschin, M. The links between biodiversity, ecosystem services and human well-being. Ecosyst. Ecol. New Synth. 2010, 1, 110–139. [Google Scholar]
  9. Crossman, N.D.; Summerfield, R.; Gring, A. A blueprint for mapping and modelling ecosystem services. Ecosyst. Serv. 2013, 4, 4–14. [Google Scholar] [CrossRef]
  10. Villamagna, A.M.; Angermeier, P.L.; Bennett, E.M. Capacity, pressure, demand, and flow: A conceptual framework for analyzing ecosystem service provision and delivery. Ecol. Complex. 2013, 15, 114–121. [Google Scholar] [CrossRef]
  11. Finlayson, M.; Cruz, R.D.; Davidson, N.; Alder, J.; Cork, S.; De Groot, R.S.; Lévêque, C.; Milton, G.R.; Peterson, G.; Pritchard, D.; et al. Millennium Ecosystem Assessment: Ecosystems and Human Well-Being: Wetlands and Water Synthesis; Island Press: Washington, DC, USA, 2005; Available online: https://www.millenniumassessment.org/documents/document.358.aspx.pdf (accessed on 1 January 2022).
  12. Gasiūnaitė, Z.R.; Harmelin-Vivien, M.; Kulbicki, M. The curonian lagoon. In Ecology of Baltic Coastal Waters; Springer: Berlin/Heidelberg, Germany, 2008; pp. 197–215. [Google Scholar]
  13. Petkuviene, J.; Summerfield, R.; Gring, A. Phosphorus cycling in a freshwater estuary impacted by cyanobacterial blooms. Estuar. Coasts 2016, 39, 1386–1402. [Google Scholar] [CrossRef]
  14. Razinkovas, A.; Sumaila, U.R.; Tremain, D. Preface: European lagoons—Need for further comparison across spatial and temporal scales. Hydrobiologia 2008, 611, 1–4. [Google Scholar] [CrossRef]
  15. Jakimavičius, D.; Kriaučiūnienė, J. The climate change impact on the water balance of the Curonian Lagoon. Water Resour. 2013, 40, 120–132. [Google Scholar] [CrossRef]
  16. Umgiesser, G.; Mornhe, R.; Whitfield, A. Seasonal renewal time variability in the Curonian Lagoon caused by atmospheric and hydrographical forcing. Ocean Sci. Discuss. 2015, 12, 4. [Google Scholar] [CrossRef] [Green Version]
  17. Christian, F.; Sumaila, U.R.; Luisetti, T. Hydraulic regime-based zonation scheme of the Curonian Lagoon. Hydrobiologia 2008, 611, 133–146. [Google Scholar] [CrossRef]
  18. Čerkasova, N.; Palmieri, M.G.; Luisetti, T. Curonian Lagoon drainage basin modelling and assessment of climate change impact. Oceanologia 2016, 58, 90–102. [Google Scholar] [CrossRef] [Green Version]
  19. Gerulaitis, A.; Sumaila, U.R.; Luisetti, T. The monitoring of fish resources in the Curonian Lagoon and the Lower Nemunas, substantial of annual fishing limits and measures of regulation. In Fishery and Aquaculture; Baltic-ECO: Vilnius, Lithuania, 1994; pp. 92–96. [Google Scholar]
  20. Ložys, L. Seasonal migrations of pikeperch (Sander lucioperca L.) from the Curonian Lagoon to the Baltic Sea and advantages of the phenomenon. Acta Zool. Litu. 2003, 13, 188–194. [Google Scholar] [CrossRef]
  21. Gerulaitis, A.; Gaigalas, K.; Repečka, R.; Valušienė, V.; Rudzianskienė, G.; Overkaitė, T.; Skripkaitė, D. The investigations of fish stocks and catch prognoses in the Kursiu lagoon and Nemunas delta. In Fishery in Lithuania; The Lithuanian Society of Hydrobiologist: Vilnius, Lithuania, 1996; Volume II, pp. 165–182. [Google Scholar]
  22. Kesminas, V.; Domarkas, A. Perspectives of Fishery in Inland Waters; Žuvininkystė Lietuvoje: Klaipeda, Lithuania, 2008; Volume VIII, pp. 114–121. (In Lithuanian) [Google Scholar]
  23. Oksanen, J. Vegan: Community Ecology Package. R Package Version 2.5-7. 2020. Available online: https://CRAN.R-project.org/package=vegan (accessed on 1 January 2022).
  24. Whitfield, A.K. Ichthyofaunal assemblages in estuaries: A South African case study. Rev. Fish Biol. Fish. 1999, 9, 151–186. [Google Scholar] [CrossRef]
  25. Marshall, S.; Elliott, M. Environmental influences on the fish assemblage of the Humber estuary, UK. Estuar. Coast. Shelf Sci. 1998, 46, 175–184. [Google Scholar] [CrossRef]
  26. Hyndes, G.A.; Mornhe, R.; Whitfield, A. Does the composition of the demersal fish assemblages in temperate coastal waters change with depth and undergo consistent seasonal changes? Mar. Biol. 1999, 134, 335–352. [Google Scholar] [CrossRef]
  27. Wantiez, L.; Harmelin-Vivien, M.; Kulbicki, M. Spatial and temporal variation in a soft-bottom fish assemblage in St Vincent Bay, New Caledonia. Mar. Biol. 1996, 125, 801–812. [Google Scholar] [CrossRef]
  28. Dainys, J.; Mornhe, R.; Whitfield, A. Predicted Climate Change Effects on European Perch (Perca fluviatilis L.)—A Case Study from the Curonian Lagoon, South-Eastern Baltic; Estuarine, Coastal and Shelf Science; Academic Press—Elsevier Science: London, UK, 2019; Volume 221. [Google Scholar]
  29. Kupschus, S.; Tremain, D. Associations between fish assemblages and environmental factors in nearshore habitats of a subtropical estuary. J. Fish Biol. 2001, 58, 1383–1403. [Google Scholar] [CrossRef]
  30. Cochranke, K.; Smith, R.; Gerulaitis, A. Climate change implications for fisheries and aquaculture. FAO Fish. Aquac. 2009, 530, 212. [Google Scholar]
  31. Turner, R.K.; Palmieri, M.G.; Luisetti, T. Lessons from the construction of a climate change adaptation plan: A Broads Wetland case study. Integr. Environ. Assess. Manag. 2016, 12, 719–725. [Google Scholar] [CrossRef] [PubMed]
Figure 1. Overlay maps of Curonian lagoon. (a) Distribution of CPUE in each fishing square (1–48), (b) distribution of catch in percentage for each FS from a total landing, and (c) main bottom sediments distribution in Curonian lagoon.
Fishes 07 00019 g001
Figure 2. Distribution of bream catches of commercial fisheries in fishing square: (a) total catch in each fishing square in kilograms, (b) CPUE of bream by the 60–80 mm mesh size gillnets.
Fishes 07 00019 g002
Figure 3. Distribution of zander catches of commercial fisheries in fishing square: (a) total catch in each fishing square in kilograms, (b) CPUE of zander by the 40–80 mm mesh size gillnets.
Fishes 07 00019 g003
Figure 4. Distribution of roach catches of commercial fisheries in fishing square: (a) total catch in each fishing square in kilograms, (b) CPUE of roach by the 40–59 mm mesh size gillnets.
Fishes 07 00019 g004
Figure 5. Distribution of perch catches of commercial fisheries in fishing square: (a) total catch in each fishing square in kilograms, (b) CPUE of perch by the 40–59 mm mesh size gillnets.
Fishes 07 00019 g005
Figure 6. Distribution of vimba catches of commercial fisheries in fishing square: (a) total catch in each fishing square in kilograms, (b) CPUE of vimba by the 40–59 mm mesh size gillnets.
Fishes 07 00019 g006
Figure 7. Evaluated value of the total catch of all fish species per fishing squares by using monthly fisheries reports with the stated initial sale price of each fish species.
Fishes 07 00019 g007
Figure 8. A distance-based redundancy analysis (CAPSCALE) biplots of environmental factors and by CPUE interaction in each fishing square. ZanderCPUE, BreamCPUE, RoachCPUE, and VimbaCPUE, PerchCPUE are the CPUE of corresponding fish species in the particular fishing square. The explanatory variables include sediment type, average depth, average salinity, and water residence time (WRT) in FS. Numbers represent ordinated fishing squares.
Fishes 07 00019 g008
Figure 9. A distance-based redundancy analysis (CAPSCALE) biplots of environmental factors and catch of individual species interaction in each fishing square. The explanatory variables include sediment type, average depth, average salinity, and water residence time (WRT) in FS. Numbers represent ordinated fishing squares.
Fishes 07 00019 g009
Table 1. Statistically significant explanatory variables for the CPUE (ordistep procedure).
dfAICFPr (>F)
Salinity150.0004.35620.005 **
WRT149.8042.10090.040 *
Significance codes: 0.001 ‘**’ 0.01 ‘*’
Table 2. Statistically significant explanatory variables for the catch of individual species (ordistep procedure).
dfAICFPr (>F)
Salinity196.4113.91400.005 **
WRT192.7875.59110.005 **
Significance codes: 0.001 ‘**’.
Publisher’s Note: MDPI stays neutral with regard to jurisdictional claims in published maps and institutional affiliations.

