Article

Hematogenesis Adaptation to Long-Term Hypoxia Acclimation in Zebrafish (Danio rerio)

1
College of Marine Sciences, Shanghai Ocean University, 999 Huchenghuan Road, Lingang New City, Shanghai 201306, China
2
Key Laboratory of Sustainable Exploitation of Oceanic Fisheries Resources, Ministry of Education, Shanghai Ocean University, Shanghai 201306, China
3
Key Laboratory of Aquaculture Resources and Utilization, Ministry of Education, College of Fisheries and Life Sciences, Shanghai Ocean University, Shanghai 201306, China
4
National Distant-Water Fisheries Engineering Research Center, Shanghai Ocean University, Shanghai 201306, China
*
Author to whom correspondence should be addressed.
Fishes 2022, 7(3), 98; https://doi.org/10.3390/fishes7030098
Submission received: 13 February 2022 / Revised: 18 April 2022 / Accepted: 20 April 2022 / Published: 22 April 2022
(This article belongs to the Special Issue Discovery and Utilization of Fish Resistance Genes)

Abstract

:
When fish live in the wild or are cultured artificially, they will inevitably suffer from hypoxia. At the same time, blood physiological indexes represent the physiological state of fish. In order to study the effect of long-term hypoxia acclimation on fish hematogenesis, we cultured zebrafish embryos into adulthood in a hypoxia incubator (1.5 ± 0.2 mg/L). Then we compared the hematological parameters of zebrafish cultured in normoxia and hypoxia conditions. Transcriptome sequencing analysis of the main hematopoietic tissue, the head kidney, was also compared between the two groups. Results showed that the number of erythrocytes increased significantly in the long-term hypoxia acclimated group, while the size of several cell types, such as red blood cells, eosinophils, basophils, small lymphocytes and thrombocytes, decreased significantly. The transcriptomic comparisons revealed that there were 6475 differentially expressed genes (DEGs) between the two groups. A Gene Ontology (GO) annotation and Kyoto Encyclopedia of Genes and Genomes (KEGG) pathway analysis showed that hematopoiesis and cell proliferation signaling were the most significantly enriched pathways in the head kidney of hypoxia acclimated zebrafish. In addition, many genes involved in the hematopoietic process showed significantly higher levels of expression in the hypoxia acclimated zebrafish, when compared to the normoxia zebrafish. When considered together, these data allowed us to conclude that long-term hypoxia can promote the hematopoiesis process and cell proliferation signaling in the zebrafish head kidney, which resulted in higher red blood cell production. Higher numbers of red blood cells allow for better adaptation to the hypoxic environment. In conclusion, this study provides a basis for the in-depth understanding of the effects of hypoxia on hematogenesis in fish species.

Graphical Abstract

1. Introduction

Hypoxia is a normal, natural phenomenon that occurs seasonally in freshwater lakes, estuaries and oceans. Biologically, hypoxia is generally defined as a dissolved oxygen content of less than 2.8 mg/L (equivalent to 2 mL O2/L). Oxygen that is dissolved in water is called dissolved oxygen (DO) and is necessary for the survival of most organisms in the aquatic environment. The DO content of water affects life processes, such as metabolism, growth and reproduction of aquatic animals. When fishes are in a hypoxic environment, their biochemical and physiological status will also change, to create differences in growth and development [1], behavior [2], and metabolism [3].
In the hematological index, the blood cell is an important parameter used to evaluate the physiological state of fish and plays an important role in the nutritional status of fish, fish disease [4], and reactions to water pollution [5]. The blood cell number varies depending on species, age, health, and environment. It is also crucial in the context of the immune system. In addition, blood circulation is the main mode of oxygen transportation for many organisms. It is well known that the hematopoietic process is regulated by the hypoxia stress signaling pathway. Early studies focused mainly on the effects of hypoxia on the red blood cells [6] and revealed changes in blood physiological indicators, such as the reduction in the oxygen-carrying capacity of hemoglobin, hemoglobin content, and increase in heme concentration, induced by hypoxia stress [7]. Studies have also revealed the signaling pathways involved in the development and function of hematopoietic stem cells (HSCs) [8,9]. However, studies on fish hematogenesis, under long-term hypoxia stress, have not yet been reported.
Zebrafish are small, tropical freshwater fish that belong to the Actinopterygii, Cypriniformes, Cyprinidae, and Danio. Eighty-five percent of zebrafish genes are similar to humans [10]. This makes zebrafish an excellent animal model in the field of developmental biology, genetics, and toxicology. Zebrafish larvae are transparent, which allows the blood flow to be observed. In situ hybridization and solid blue staining are used to visually observe the expression of genes in blood cells and other hematopoietic-related genes. Therefore, zebrafish are often used in the study of the blood system and hematopoietic function. After increased glucose metabolism, Harris et al. found that HSCs in the zebrafish aorta-gonad-mesonephros (AGM) region increased and HSCs appeared earlier [11]. Paffett-Lugassy et al. studied the expression of erythropoietin (EPO) in zebrafish at different developmental stages, by qRT-PCR, and compared it with mammals. This showed that the hematopoietic function of zebrafish is similar to that of mammals and indicated that hematopoietic regulation in vertebrates is highly conserved [12]. However, there is no research on hematogenesis in zebrafish under long-term hypoxia stress.
Recently, high-throughput RNA sequencing technology (RNA-Seq) has been widely used as an effective tool for transcriptome analysis and developmental biology studies. For example, Jia et al. conducted a transcriptome analysis of the hematopoietic tissue (HPT) and blood cells of the Chinese mitten crab, Eriocheir sinensis, and found the potential signal pathways related to hematopoietic function [13]. Jeff Klomp et al. found that SRY-box transcription factor 7 (SOX7) is an early regulator of angiogenesis in hypoxic human endothelial cells through comprehensive transcriptome profiling [14].
To explore the mechanism of changes in fish hematogenesis caused by hypoxia stress, we compared head kidney (the main hematopoietic organ) transcriptome profiling between long-term hypoxia and normoxia cultured zebrafish, using high-throughput sequencing technology. The results of this study provided a basis for the further study of the mechanism of hypoxia adaptation in zebrafish. We have provided basic theoretical research and potential future applications in fish anti-hypoxia breeding practice.

2. Materials and Methods
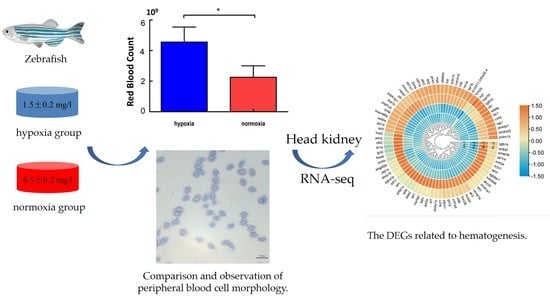
2.1. Samples

All the zebrafish (AB type) used in this experiment were cultured in the Key Laboratory of Sustainable Development of Ocean Fishery Resources, Ministry of Education. Zebrafish were bred and maintained at 28 °C, in a 12 h light/12 h dark cycle. All experimental protocols in this study were approved by The Scientific Ethic Committee of Shanghai Ocean University, Shanghai, China (SHOU-DW-20171022).
The low oxygen environment used in this experiment was created by constantly bubbling nitrogen into the water [15]. The DO level (DOL) was measured with a portable DO meter (YSI Pro20) daily. We checked the ammonia level regularly, and the aquaculture water was regularly changed. The DOL in the hypoxia group was 1.5 ± 0.2 mg/L, which was based on previous hypoxia studies in zebrafish [16,17], whilst the DOL in the normoxia group was 6.5 ± 0.2 mg/L. All the fish were the offspring of the same pair of parents and they were randomly divided into the hypoxia group (1.5 ± 0.2 mg/L) and normoxia group (6.5 ± 0.2 mg/L). Both groups were raised from fertilized eggs to adulthood, and were continuously exposed to the corresponding treatments for six months.

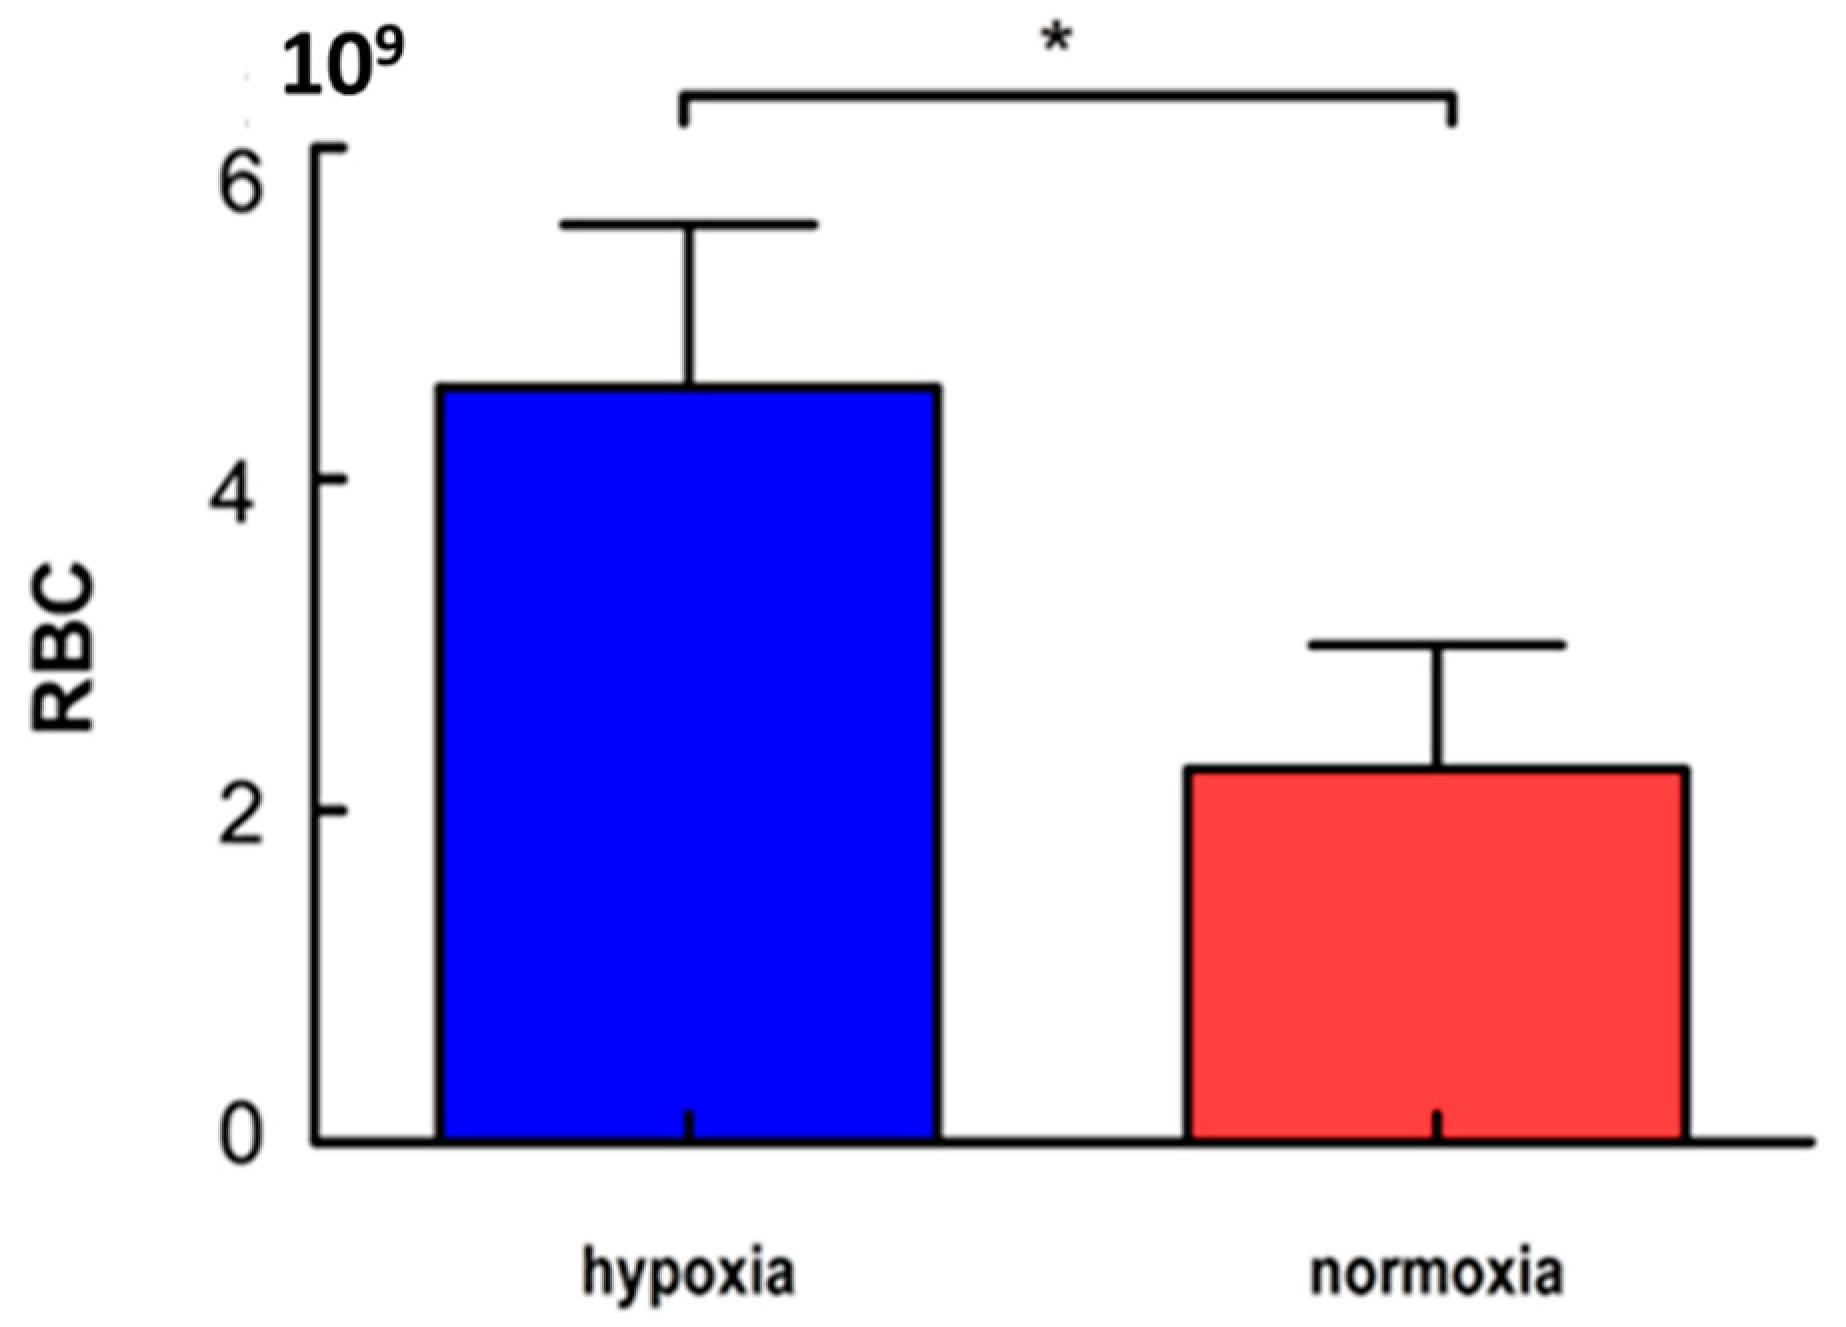
2.2. Red Blood Cell Count

Zebrafish were anesthetized in a Petri dish containing 160 mg/L Tricaine working solution. Blood was sampled by the caudal vein sampling method. Three fish were taken from both the hypoxia group and normoxia group, and the blood sample (0.5 µL) were collected three times from the same fish. We diluted the collected blood samples 1:200 with PBS. 100 µL of the diluted solution was added to the blood cell counting plate and the number of red blood cells in the unit volume was counted under the microscope at 100× magnification [18].

2.3. Light Microscopy Study

We collected five fish from both the experimental group and the control group and produced three blood smears from each fish. The blood smears were stained with Wright-Giemsa dye and cell morphology was observed under a microscope at 1000× magnification. The length and width of the cells and nuclei were measured.

2.4. RNA Isolation, cDNA Library Construction and Illumina Sequencing

Sixteen fish were taken from both the experimental group and the control group and killed immediately after anesthesia (160 mg/L Tricaine). The head kidney tissues were removed immediately, then kept in RNAlater solution and put it into −80 °C for standby. As the head kidney tissue is small, the tissues of eight fish were pooled together as a sample and RNA was extracted using TRIzol R (Invitrogen, Carlsbad, CA, USA). Transcriptome sequencing was performed on two samples from the experimental group and two samples from the control group. After RNA integrity and concentration assessment (the range of OD260/OD280 is 1.8–2.1) using a Bioanalyzer system, cDNA libraries were constructed using the VAHTS Stranded mRNA-seq Library Prep Kit from Illumina. 1 µg/µL concentration of total RNA was used for cDNA synthesis. The libraries were sequenced with the Illumina hiseqtm 2000 sequencer (San Diego, CA, USA). We adopted paired-end sequencing and the read length of sequencing analysis was 150 bp.

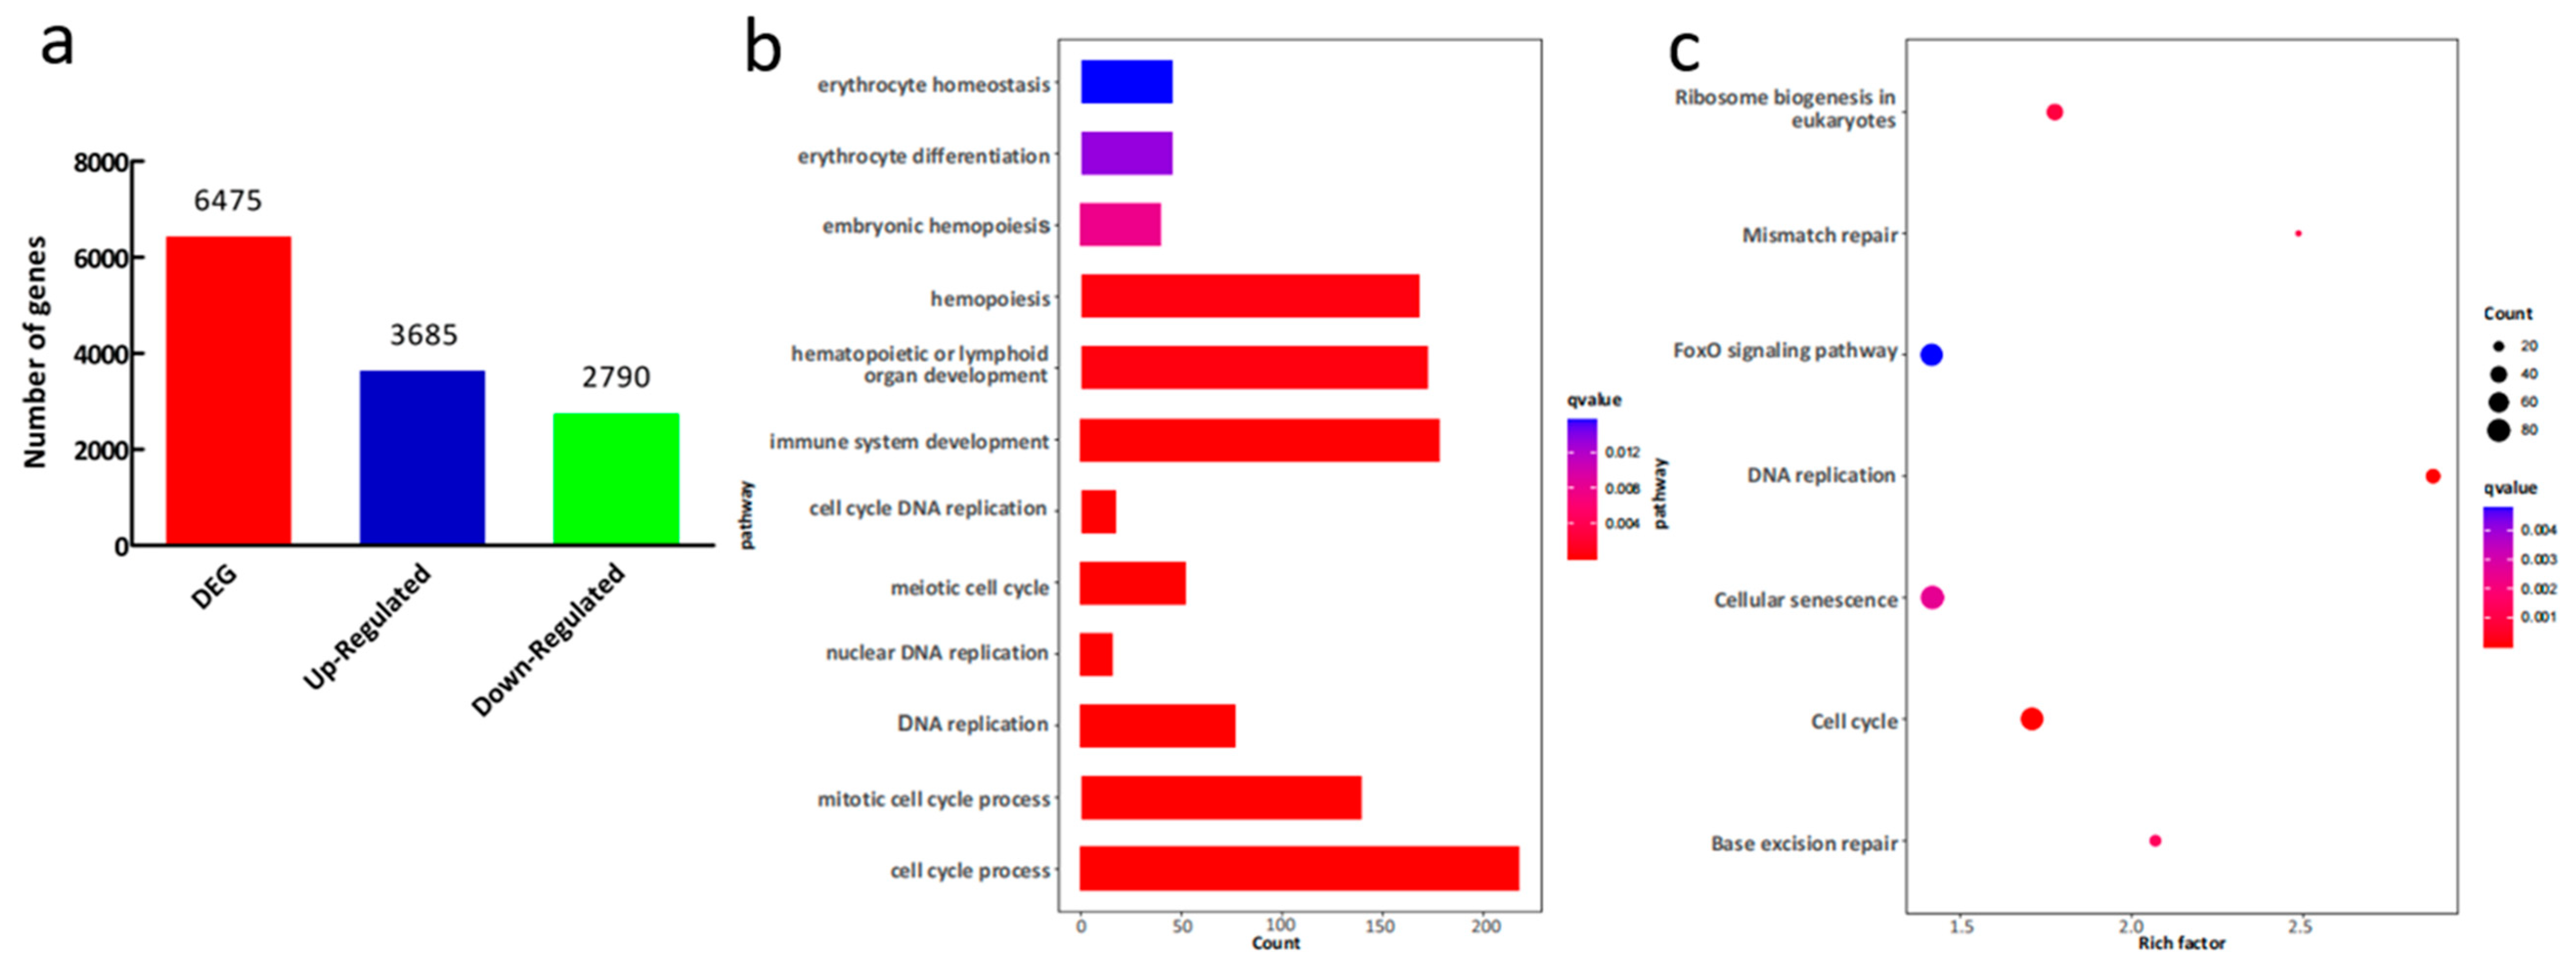
2.5. Differentially Expressed Gene Analysis and Functional Enrichment

The paired-end cleaned reads were obtained by Trimmomatic [19] (0.33) with the parameter: AVGQUAL:20 TRAILING:20 MINLEN:50. We used HISAT2 to map all clean reads to the reference gene sequence (http://ftp.ensembl.org/pub/release-105/gtf/danio_rerio/ (accessed on 1 June 2021)) [20,21]. The reference genome version used was GRCz11. The gene expression level of each sample was then calculated to determine the fragments per kilobase of exon model per million (FPKM) mapped fragments, using the Cufflinks software with default settings [22]. The significantly differentially expressed genes (DEGs) were analyzed by EdgeR (v 3.26.8) software, to screen the DEGs in the head kidney, between the normoxia group and hypoxia acclimated group [23]. Lastly, we selected genes with differential expression |log2 (Fold change)| > l and adjusted p < 0.05 and used the cluster Profiler package in R software for enrichment analysis. The clusterProfiler package calculates enrichment test for GO terms and KEGG pathways based on hypergeometric distribution [24,25,26]. To prevent high false discovery rate (FDR) in multiple testing, q-values [27] were also estimated for FDR control. The Gene Ontology (GO) terms and Kyoto Encyclopedia of Genes and Genomes (KEGG) pathways with q-value < 0.05 were regarded as significant.

2.6. Quantitative Real-Time PCR

To validate the results of the RNA-Seq analysis, six DEGs were randomly selected for quantitative real-time PCR (qRT-PCR). The ACTB gene (β-actin) was used as the internal control gene, as previously described [28]. Total RNA was extracted from the head kidney of zebrafish from the experimental group and the control group. The samples here grew up under the same conditions as the samples of transcriptome analysis and were dissected at the same time. 1 μg/μL concentration of total RNA was used for cDNA synthesis, in accordance with the steps provided by the reverse transcription kit (Tsingke Biological Technology Co., Ltd., Wuhan, China), and the cDNA was used as the template for the qRT-PCR experiments. Adopt 2 × T5 fast qPCR mix kit (SYBR Green (Tsingke Biological Technology Co., Ltd., Wuhan, China)) performs quantitative analysis of genes in cfx96 fluorescence quantitative PCR instrument (BioRad, Hercules, CA, USA). The relative expression of each sample was calculated by the 2ΔΔCt method [29]. SPSS (Version 25.0, IBM, Armonk, NY, USA) was used for Pearson correlation analysis. Pearson correlation analysis was used to evaluate the strength of the relationship between RNA-seq data and RT-qPCR measurements. Detailed information on the primers is given in Table 1.

2.7. Statistical Analysis

Differences in the mean ± SD were calculated for the number of red blood cells and the size of cells between the normoxia and hypoxia acclimated groups. Statistical differences were assessed using the independent sample t test of the IBM SPSS software and a p < 0.05 was considered to be significant.

3. Results

3.1. Erythrocyte Counts

The number of erythrocytes in the hypoxia group was 4.56 × 10⁹/mL. The number of erythrocytes in the normoxia group was 2.25 × 10⁹/mL (Figure 1). The number of erythrocytes in zebrafish from the hypoxia group was significantly higher than that in the normoxia group (p < 0.05) (Figure 1).

3.2. Cell Morphology

Erythrocytes, thrombocytes, lymphocytes, neutrophils, basophilic granulocytes, eosinophilic granulocytes and monocytes were distinguished and characterized. The blood smears showed that there was no significant difference in the cell structure between the hypoxia acclimated zebrafish and normoxia zebrafish. Figure 2 shows the morphology of various blood cells of the zebrafish. The sizes of the different types of blood cells in the two groups are given in Table 2.
Erythrocytes were the predominant cell type found in the blood. Mature and immature erythrocytes were observed in the peripheral blood but most were mature erythrocytes. The mature erythrocytes were oval, with a smooth surface. The cytoplasm was full of hemoglobin and was orange or light purplish-red in color. The nuclei were oval in shape, small and located in the middle of the cell. The nuclear chromatin was dense, lumpy and dark purplish-red (Figure 2a). The number of immature erythrocytes was very small and they were more round in shape than the mature erythrocytes (Figure 2b). The cytoplasm was even and a light gray-blue or light orange-red. In the peripheral blood smear, the phenomenon of erythrocyte division was occasionally observed (Figure 2c).
Lymphocytes were classified as small or large. Small lymphocytes accounted for the majority and had a small cell body that was round or quasi-round. The cytoplasm was very small, blue and sometimes only visible at the edge of the cell. The nuclei were round or oval (Figure 2e). The morphology of large lymphocytes was similar to that of the small lymphocytes, with a slightly larger volume and more pseudopodia. The large lymphocytes had more cytoplasm and a few particles were observed. The nuclei were lightly stained (Figure 2d).
The cell bodies of the neutrophils varied in size and were round or quasi-round. The cytoplasm was light pink or almost colorless and contained a large number of fine particles. The nuclei were small and diverse and either rod-shaped, kidney-shaped, dumbbell-shaped, U-shaped or S-shaped, with obvious hollows. The lobulated nuclei generally had two lobes (Figure 2f).
The eosinophil cell bodies were large, round or oval and rarely found in the peripheral blood. The cytoplasm was light orange-red and filled with small orange particles. The nuclei had various shapes, with most being kidney-shaped, oval or with two lobes. The nucleus was often found to one side of the cell (Figure 2g).
The cell body of the basophils was slightly smaller than that of the eosinophils and was round or quasi-round. The cytoplasm was light blue and filled with thick, round black-blue particles. The nuclei were small and oval or round. The nucleus was often found to one side of the cell and sometimes tangential to the cell membrane (Figure 2h).
The cell body of the monocytes was large and quasi-round or irregular in shape. The cytoplasm was light blue and contained vacuoles, some visible pseudopodia and purplish-red particles. The nuclei were diverse and mainly kidney-shaped or irregular in shape. The nucleus was often found to one side of the cell (Figure 2i).
The macrophage cell body was large and irregular in shape. The cytoplasm was light blue and often had protruding pseudopodia, with a large number of vacuoles. The nucleus was often found close to the edge of the cell and the staining was shallow (Figure 2j).
The thrombus cell body was small and quasi-round or spindle shaped, with a smooth surface and dark purple color. They often appeared in pairs or groups. The cytoplasm was small, and most platelets had no cytoplasm (Figure 2k,l).

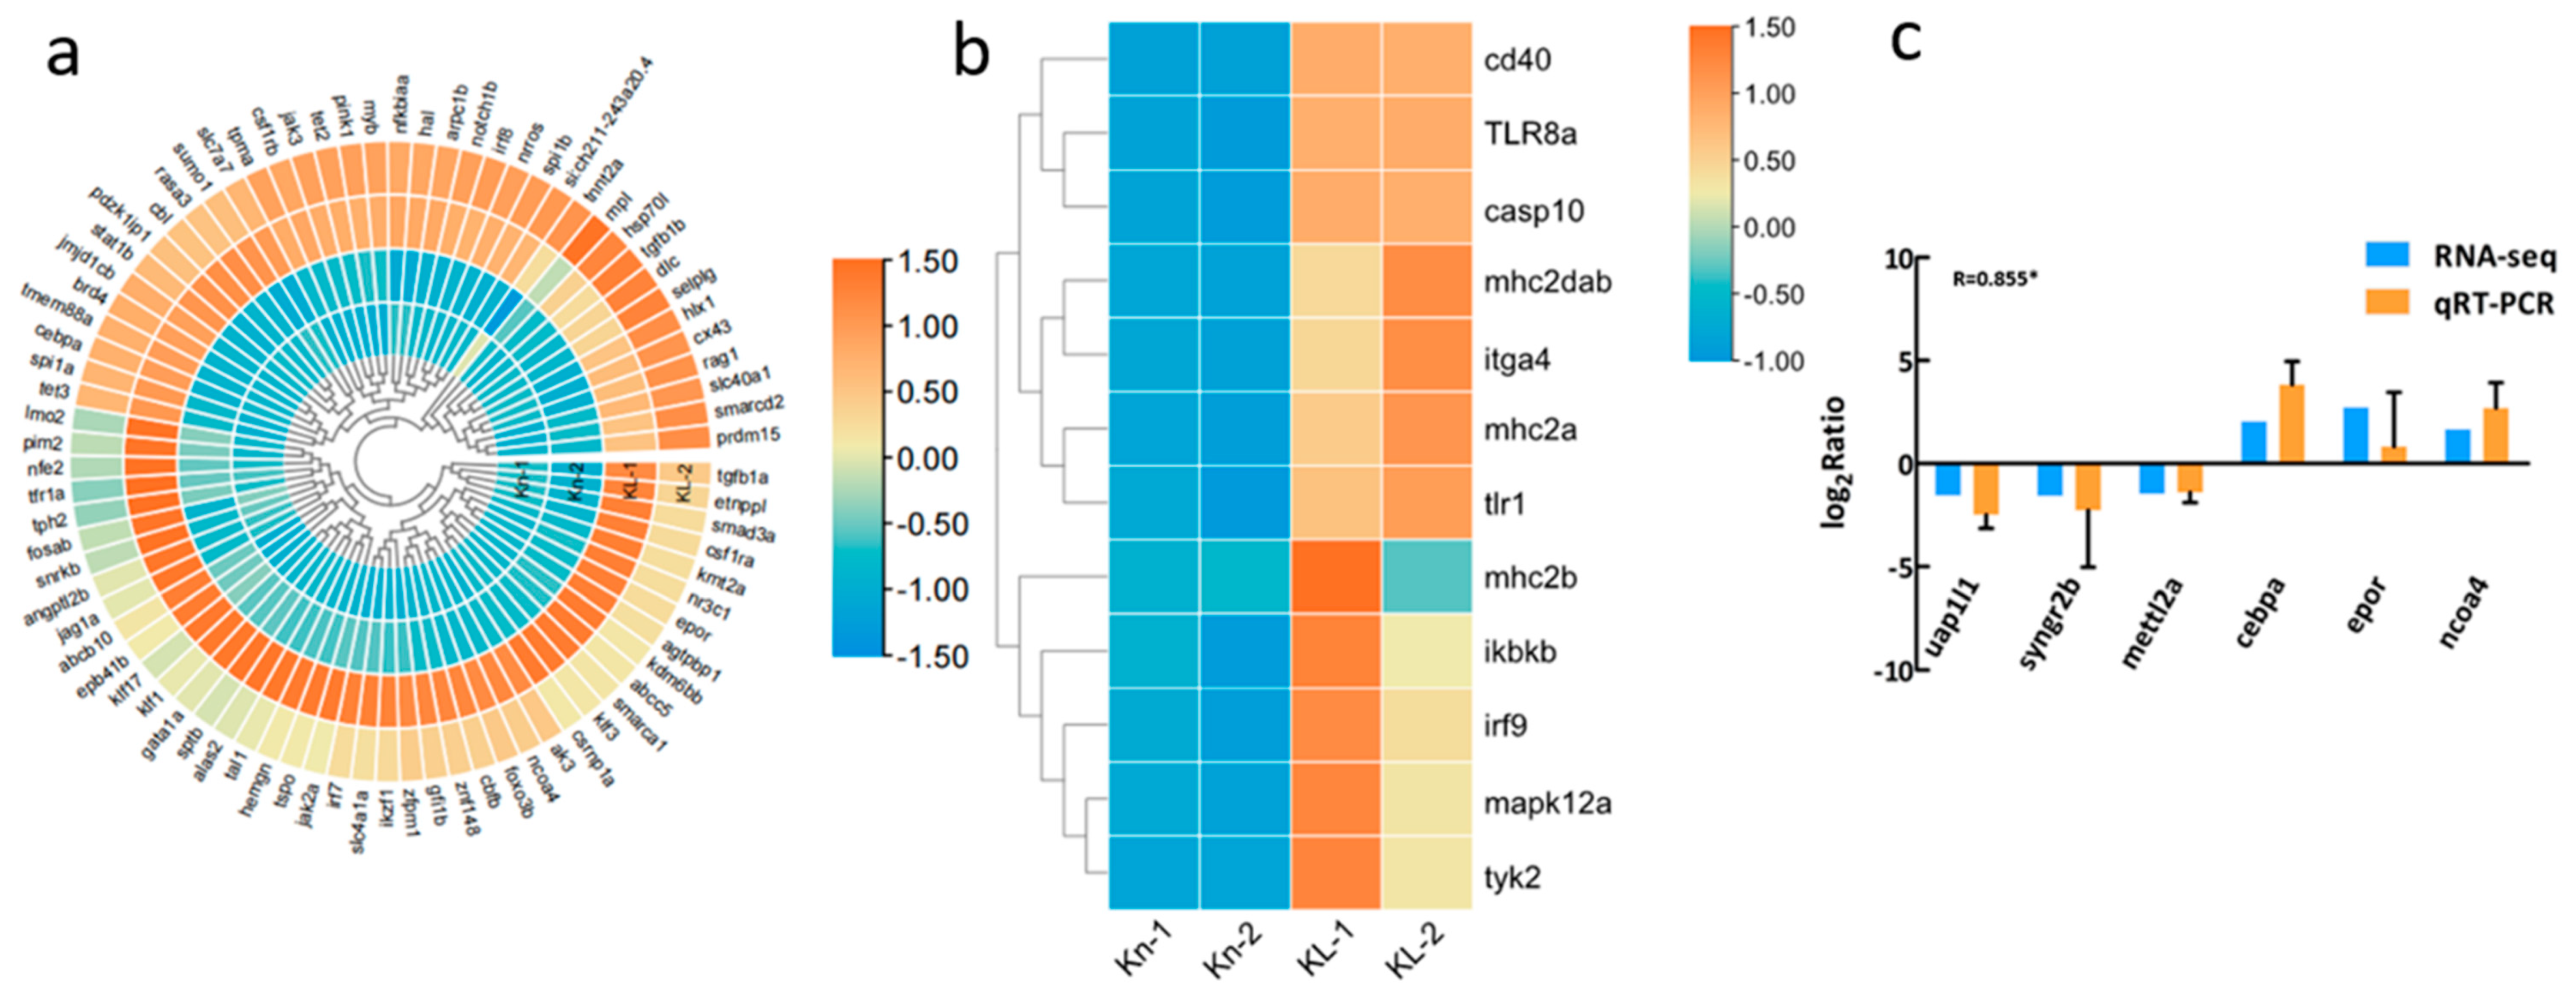
3.3. Analysis of the Differentially Expressed Genes

After data analysis and quality filtering of the sequencing data, a total of 11.8 million raw reads (2,990,417, 1,749,882, 3,560,098, 3,518,347 raw reads for KL-1, KL-2, Kn-1, and Kn-2) were obtained. Of these reads, 2,507,567, 1,500,788, 3,068,762, 3,047,622 clean reads were mapped onto the reference genome, respectively. The percentage of reads mapped to the reference genome were 87.88%, 82.21%, 90.33%, 87.79%, respectively (Table S1). The number of genes in the reference genome is 35,115. Besides, we obtained 24,827 expressed genes.
The head kidney samples were used for transcriptome sequencing to identify the DEGs between the hypoxia acclimated zebrafish and normoxia zebrafish. We found 6475 significant DEGs, 3685 of which were upregulated and 2790 were downregulated (shown in Figure 3a).
There are three categories in the GO database: biological process (BP), cellular component (CC) and molecular function (MF). The GO enrichment analysis of the DEGs between the hypoxia and normoxia zebrafish showed that the DEGs were mainly summarized in 246 biological processes, 50 cellular component and 46 molecular functions (Table S2). It was clearly shown that the DEGs were enriched in many GO terms involved in hematopoiesis, immunity and cell proliferation processes, such as hemopoiesis, immune system development and cell cycle process (Figure 3b). The KEGG annotation showed that many DEGs were related to the cell proliferation pathways, such as DNA replication and Cell cycle (Figure 3c).
Moreover, we noted that many DEGs involved in the hematopoiesis process were upregulated in the head kidney tissues of the hypoxia acclimated zebrafish (Figure 4a). Hematopoietic regulatory transcription factors, Lmo2 [30] and Gata1a [31], which were specifically expressed in erythrocyte precursors, were significantly upregulated in the hypoxia acclimated zebrafish (Figure 4a). Many immune related DEGs were upregulated in the head kidney tissues of the hypoxia acclimated zebrafish. For example, tlr8a, mhc2a, mhc2b, mhc2dab, irf9, mapk12a, itga4, casp10, tlr1, cd40, ikbkb, and tyk2 were significantly upregulated (Figure 4b).

3.4. Transcriptome Data Validation by qRT-PCR

We validated the expression patterns of six DEGs using qRT-PCR. Similar expression patterns were observed in these randomly selected genes as in the RNA-seq analysis (Figure 4b). The Pearson correlation coefficient (R) between qRT-PCR and RNA-seq data was 0.855 (|R| ≥ 0.7, indicating a strong correlation between the two variables). This indicated the reliability and accuracy of the transcriptome expression analysis.

4. Discussion

Hematological parameters are important for monitoring physiological and pathological changes in fish [32]. However, the results may vary tremendously unless the technical details for the species are well defined [33]. In this study, the hypoxia acclimation background and genetic background of the zebrafish were clearly defined. Therefore, the hematological parameters obtained in this study can provide useful information in the comparison of the physiological status between normoxia zebrafish and zebrafish with long-term hypoxia.
The effects of hypoxia on hematological parameters have been reported in other organisms. Researchers discovered a link between reduced atmospheric oxygen pressure and elevated red blood cell numbers in humans and other animals more than 100 years ago [34]. Francois-gilbert Viault discovered an increase in the number of red blood cells in his and his companions’ blood during an expedition in the Peruvian Andes, demonstrating the acute and direct physiological stimulation of red blood cell production caused by low oxygen [35]. When the DO in summer is lower than that in winter, the number of red blood cells and hemoglobin content in fish increases and the oxygen uptake capacity of fish is enhanced. This is a compensatory reaction for fish to adjust their oxygen-carrying capacity in the blood, to adapt to the environment [36]. When the banded knife fish, Gymnotus carapo, was exposed to a hypoxic environment, the number of red blood cells increased [37]. In this study, it was observed that the number of red blood cells in zebrafish acclimated to long-term hypoxia was higher than that in normoxia zebrafish. One of the most extensively studied adaptations to hypoxia is the stimulation of red blood cell production [6]. Zebrafish acclimated to long-term hypoxia respond by increasing the number of red blood cells and the ability to transport oxygen, which allows them to adapt to the hypoxic environment in a short time.
In this study, the cell sizes of red blood cells, eosinophils, basophils, small lymphocytes and thrombocytes in zebrafish acclimated to hypoxia were significantly smaller than those in the normoxia group. There was no significant change in the size of the large lymphocytes, neutrophils and monocytes. It is understandable that the size of the red blood cells determines the number of red blood cells, per unit volume of blood. If erythrocytes are smaller, the number of erythrocytes in the blood is larger, per unit volume, and the total relative surface area increases, which is conducive to gas exchange between erythrocytes and blood. Hemoglobin is mainly found in the erythrocytes. When the number of erythrocytes increases, the hemoglobin content also increases. Therefore, smaller erythrocytes can enhance the ability of the body to carry oxygen and carbon dioxide, to improve respiratory function. This enables the body to better meet the needs of exercise [38] and adapt to a low oxygen environment. The small length and width of these cells suggested that the cells were dividing and the number of cells increases in the blood flow after division [39]. The cell size of eosinophils, basophils, small lymphocytes and thrombocytes in hypoxia acclimated zebrafish was decreased, which suggested that the number of these four leukocyte cells was increased. We speculated that long-term hypoxia acclimation will affect the immune ability of zebrafish.
High-throughput sequencing technology can quickly, economically and efficiently generate genome-scale data, which enhances studies in genomics and transcriptomics [40]. In order to further explore the reasons for the changes in the hematology of zebrafish under long-term hypoxia acclimation, transcriptome sequencing technology was used to compare the gene expression differences in the head kidney between long-term hypoxia acclimated zebrafish and normoxia zebrafish. This experiment also provided a theoretical basis for the hypoxia adaptation mechanism of fish.
Hematopoiesis is a very complex process that requires the participation of a large number of genes to maintain the proliferation ability of certain types of cells [41]. Through GO clustering of DEGs, many genes were found to be enriched in GO terms related to hematopoiesis, immunity and cell proliferation. This indicated that zebrafish acclimated to long-term hypoxia have large differences in hematopoiesis, immune and cell proliferation function, when compared with normoxia zebrafish. The expression levels of many genes related to hematogenesis showed significant differences between the hypoxia acclimated zebrafish and normoxia zebrafish. The comparison of expression levels of DEGs showed that the epor and tfr1a genes, which were specifically expressed in erythrocyte precursors, were significantly upregulated in the long-term hypoxia acclimated zebrafish head kidney (Figure 4a), which was consistent with Wingert’s study [42]. It is known that each step of erythropoiesis is finely regulated by specific factors, such as transcription factors and signal molecules. For example, the TAL1, LMO2 and GATA1 transcription factors are necessary for the establishment of erythrocyte lineage [43,44]. The TAL1 transcription factor, also known as stem cell leukemia (scl), has a helix-loop-helix structure that is required for both primitive and definitive erythropoiesis [45]. The LMO2 transcription factor may act with scl to control the transcription of genes related to erythropoiesis [30]. Another transcription factor that is essential for primordial erythropoiesis is GATA1, which activates the expression of many erythroid genes [46]. The above transcription factors were enriched in the hematopoiesis GO term (Figure 3b) and their expression was upregulated after hypoxia acclimation (Figure 4a). From these data, we concluded that long-term hypoxia can promote hematopoiesis and the differentiation and maturation of red blood cells in zebrafish. We speculated that hypoxia promotes red blood cell production in hematopoietic organs of the zebrafish and increases erythropoiesis, which make zebrafish better able to adapt to a hypoxic environment. In addition, most pathways related to cell replication, such as the cell cycle and DNA replication pathways, were significantly enriched in the head kidney after hypoxia acclimation. Accordantly, zebrafish in hypoxia group produce more erythrocytes than zebrafish in normal oxygen group, and the significant enrichment of cell replication pathways provide evidence of activation of hematopoiesis.
The DEGs were enriched in GO terms related to immunity (Figure 3b). Moreover, the expression of immune-related genes was upregulated after long-term hypoxia acclimation (Figure 4b). The Toll-like receptors (TLRs) are the most widely studied pattern recognition receptors (PRRS), which can mediate natural and adaptive immunity through recognition ligands. As a member of the TLRs family, TLR8 is mainly expressed in monocyte macrophages and is responsible for the recognition of nucleic acids [47]. The mhc2a, mhc2b and mhc2dab genes were also significantly upregulated (Figure 4b). The MHT II protein plays an important role in the immune response and immune regulation and is involved in the recognition of parasitic antigens by T cell receptors (TCR) [48]. The MHC II antigen complex activates helper T cells to induce a specific immune response [26]. These data suggested that a hypoxic environment may activate the immune response of the zebrafish.

5. Conclusions

In this study, the number of erythrocytes increased significantly in the long-term hypoxia acclimated zebrafish and some blood cell types were significantly smaller in size. The transcriptomic comparison of head kidney tissue revealed that 6475 genes were differentially expressed between the two groups. After long-term hypoxia acclimation, the expression levels of hematopoietic and immune-related genes in the head kidney were significantly upregulated. It was speculated that zebrafish can increase the number of erythrocytes by upregulating the hematopoiesis process in the hematopoietic organs, to adapt to a hypoxic environment.

Supplementary Materials

The following supporting information can be downloaded at: https://www.mdpi.com/article/10.3390/fishes7030098/s1, Table S1: The information of total reads and passed reads used in this study; Table S2: GO enrichment analysis of the DEGs.

Author Contributions

Validation, L.S, L.C., S.J., Z.W. and Y.Z.; formal analysis, L.S.; data curation, L.S. and L.C.; writing—original draft preparation, L.S.; writing—review and editing, Q.X.; visualization, L.S.; supervision, Q.X.; project administration, Q.X.; funding acquisition, Q.X. All authors have read and agreed to the published version of the manuscript.

Funding

This work was supported in part by the Funding Project of the National Key Research and Development Program of China (2018YFD0900601), the National Natural Science Foundation of China (31772826), the National Key Research and Development Program of China (2018YFC0310600), the National Natural Science Foundation of China (32130109), and the major scientific innovation project from Shanghai Committee of Education (2017-01-07-00-10-E00060).

Institutional Review Board Statement

All experimental protocols in this study were approved by The Scientific Ethic Committee of Shanghai Ocean University, Shanghai, China (SHOU-DW-20171022).

Informed Consent Statement

Not applicable.

Data Availability Statement

All sequencing data associated with this project were deposited in the National Center for Biotechnology Information (NCBI) Sequence Read Archive database with the BioProject Accession Number: PRJNA799166; https://www.ncbi.nlm.nih.gov/sra/PRJNA799166) (accessed on 20 January 2022).

Conflicts of Interest

The authors declare no conflict of interest.

References

  1. Dabrowski, K.; Lee, K.J.; Guz, L.; Verlhac, V.; Gabaudan, J. Effects of dietary ascorbic acid on oxygen stress (hypoxia or hyperoxia), growth and tissue vitamin concentrations in juvenile rainbow trout (Oncorhynchus mykiss). Aquaculture 2003, 233, 383–392. [Google Scholar] [CrossRef]
  2. Pang, X.; Cao, Z.D.; Fu, S.J. The effects of temperature on metabolic interaction between digestion and locomotion in juveniles of three cyprinid fish (Carassius auratus, Cyprinus carpio and Spinibarbus sinensis). Comp. Biochem. Physiol. 2011, 159, 253–260. [Google Scholar] [CrossRef] [PubMed]
  3. Nilsson, G.E.; Renshaw, G.M.C. Hypoxic survival strategies in two fishes: Extreme anoxia tolerance in the North European crucian carp and natural hypoxic preconditioning in a coral-reef shark. J. Exp. Biol. 2004, 207, 3131–3139. [Google Scholar] [CrossRef] [PubMed] [Green Version]
  4. Sara, C.; Alex, D.; Joseph, M.F.; Daniel, S.D.; Gregory, A.L. A comparison of blood gases, biochemistry, and hematology to ecomorphology in a health assessment of pinfish (Lagodon rhomboides). PeerJ 2016, 4, e2262. [Google Scholar] [CrossRef] [Green Version]
  5. Ren, P.L.; Zhang, Y.M.; Geng, G.Q.; Qi, Y.M. Changes in Morphology and Quantity of Peripheral Blood Cells in Carassius auratus Collected from Polluted Water Area. Chin. J. Zool. 2008, 43, 37–42. [Google Scholar] [CrossRef]
  6. Haase, V.H. Hypoxic regulation of erythropoiesis and iron metabolism. American journal of physiology. Ren. Physiol. 2010, 299, F1–F13. [Google Scholar] [CrossRef] [Green Version]
  7. Soivio, A.; Nikinmaa, M.; Westman, K. The blood oxygen binding properties of hypoxic Salmo gairdneri. J. Comp. Physiol. 1980, 136, 83–87. [Google Scholar] [CrossRef]
  8. Suda, T.; Takubo, K.; Semenza, G.L. Metabolic Regulation of Hematopoietic Stem Cells in the Hypoxic Niche. Cell Stem Cell 2011, 9, 298–310. [Google Scholar] [CrossRef] [Green Version]
  9. Imanirad, P.; Dzierzak, E. Hypoxia and HIFs in regulating the development of the hematopoietic system. Blood Cells Mol. Dis. 2013, 51, 256–263. [Google Scholar] [CrossRef] [Green Version]
  10. Kettleborough, R.N.W.; Busch-Nentwich, E.M.; Harvey, S.A.; Dooley, C.M.; de Bruijn, E.; van Eeden, F.; Sealy, I.; White, R.J.; Herd, C.; Nijman, I.J.; et al. A systematic genome-wide analysis of zebrafish protein-coding gene function. Nature 2013, 496, 494–497. [Google Scholar] [CrossRef] [Green Version]
  11. Harris, J.M.; Esain, V.; Frechette, G.M.; Harris, L.J.; Cox, A.G.; Cortes, M.; Garnaas, M.K.; Carroll, K.J.; Cutting, C.C.; Khan, T.; et al. Glucose metabolism impacts the spatiotemporal onset and magnitude of HSC induction in vivo. Blood 2013, 121, 2483–2493. [Google Scholar] [CrossRef] [PubMed] [Green Version]
  12. Paffett-Lugassy, N.; Hsia, N.; Fraenkel, P.G.; Paw, B.; Leshinsky, I.; Barut, B.; Bahary, N.; Caro, J.; Handin, R.; Zon, L.I. Functional conservation of erythropoietin signaling in zebrafish. Blood 2007, 110, 2718–2726. [Google Scholar] [CrossRef] [PubMed] [Green Version]
  13. Jia, Z.H.; Wang, M.Q.; Wang, X.D.; Wang, L.L.; Qiu, L.M.; Song, L.S. Transcriptome sequencing reveals the involvement of reactive oxygen species in the hematopoiesis from Chinese mitten crab Eriocheir sinensis. Dev. Comp. Immunol. 2018, 82, 94–103. [Google Scholar] [CrossRef] [PubMed]
  14. Klomp, J.; Hyun, J.; Klomp, J.E.; Pajcini, K.; Rehman, J.; Malik, A.B. Comprehensive transcriptomic profiling reveals SOX7 as an early regulator of angiogenesis in hypoxic human endothelial cells. J. Biol. Chem. 2020, 295, 4796–4808. [Google Scholar] [CrossRef] [Green Version]
  15. Léger, J.A.D.; Athanasio, C.G.; Zhera, A.; Chauhan, M.F.; Simmons, D.B.D. Hypoxic responses in Oncorhynchus mykiss involve angiogenesis, lipid, and lactate metabolism, which may be triggered by the cortisol stress response and epigenetic methylation. Comp. Biochem. Physiol.—Part D Genom. Proteom. 2021, 39, 100860. [Google Scholar] [CrossRef]
  16. Feng, J.F.; Guo, Y.; Gao, Y.F.; Zhu, L. Effects of Hypoxia on the Physiology of Zebrafish (Danio rerio): Initial Responses, Acclimation and Recovery. Bull. Environ. Contam. Toxicol. 2016, 96, 43–48. [Google Scholar] [CrossRef]
  17. Rees, B.B.; Sudradjat, F.A.; Love, J.W. Acclimation to hypoxia increases survival time of zebrafish, Danio rerio, during lethal hypoxia. J. Exp. Zool. 2001, 289, 266–272. [Google Scholar] [CrossRef] [Green Version]
  18. Cao, X.J.; Wang, W.M. Haematological and biochemical characteristics of two aquacultured carnivorous cyprinids, topmouth culter Culter alburnus (Basilewsky) and yellowcheek carp Elopichthys bambusa (Richardson). Aquac. Res. 2010, 41, 1331–1338. [Google Scholar] [CrossRef]
  19. Grabherr, M.G.; Haas, B.J.; Yassour, M.; Levin, J.Z.; Thompson, D.A.; Amit, I.; Adiconis, X.; Fan, L.; Raychowdhury, R.; Zeng, Q.D.; et al. Full-length transcriptome assembly from RNA-Seq data without a reference genome. Nat. Biotechnol. 2011, 29, 644–652. [Google Scholar] [CrossRef] [Green Version]
  20. Daehwan, K.; Ben, L.; Salzberg, S.L. HISAT: A fast spliced aligner with low memory requirements. Nat. Methods 2015, 12, 357–360. [Google Scholar] [CrossRef] [Green Version]
  21. Bolger, A.M.; Lohse, M.; Usadel, B. Trimmomatic: A flexible trimmer for Illumina sequence data. Bioinformatics 2014, 30, 2114–2120. [Google Scholar] [CrossRef] [Green Version]
  22. Cole, T.; Adam, R.; Loyal, G.; Geo, P.; Daehwan, K.; Kelley, D.R.; Harold, P.; Salzberg, S.L.; Rinn, J.L.; Lior, P. Differential gene and transcript expression analysis of RNA-seq experiments with TopHat and Cufflinks. Nat. Protoc. 2012, 7, 562–578. [Google Scholar] [CrossRef] [Green Version]
  23. Robinson, M.D.; McCarthy, D.J.; Smyth, G.K. edgeR: A Bioconductor package for differential expression analysis of digital gene expression data. Bioinformatics 2010, 26, 139–140. [Google Scholar] [CrossRef] [Green Version]
  24. Dai, J.J.; Zhou, W.B.; Wang, B. Identification of crucial genes associated with lung adenocarcinoma by bioinformatic analysis. Medicine 2020, 99, e23052–e23062. [Google Scholar] [CrossRef]
  25. Cao, Y.L.; Tang, W.H.; Tang, W.X. Immune cell infiltration characteristics and related core genes in lupus nephritis: Results from bioinformatic analysis. BMC Immunol. 2019, 20, 37. [Google Scholar] [CrossRef] [Green Version]
  26. Bracamonte, S.E.; Johnston, P.R.; Knopf, K.; Monaghan, M.T. Experimental infection with Anguillicola crassus alters immune gene expression in both spleen and head kidney of the European eel (Anguilla anguilla). Mar. Genom. 2019, 45, 28–37. [Google Scholar] [CrossRef]
  27. Storey, J.D. A Direct Approach to False Discovery Rates. J. R. Stat. Soc. Ser. B (Stat. Methodol.) 2002, 64, 479–498. [Google Scholar] [CrossRef] [Green Version]
  28. Chen, B.X.; Yi, S.K.; Wang, W.F.; He, Y.; Huang, Y.; Gao, Z.X.; Liu, H.; Wang, W.M.; Wang, H.L. Transcriptome comparison reveals insights into muscle response to hypoxia in blunt snout bream (Megalobrama amblycephala). Gene 2017, 624, 6–13. [Google Scholar] [CrossRef]
  29. Livak, K.J.; Schmittgen, T.D. Analysis of relative gene expression data using real-time quantitative PCR and the 2−ΔΔCt method. Methods 2001, 25, 402–408. [Google Scholar] [CrossRef]
  30. Patterson, L.J.; Gering, M.; Eckfeldt, C.E.; Green, A.R.; Verfaillie, C.M.; Ekker, S.C.; Patient, R. The transcription factors Scl and Lmo2 act together during development of the hemangioblast in zebrafish. Blood 2007, 109, 2389–2398. [Google Scholar] [CrossRef] [Green Version]
  31. Rhodes, J.; Hagen, A.; Hsu, K.; Deng, M.; Liu, T.X.; Look, A.T.; Kanki, J.P. Interplay of pu.1 and gata1 determines myelo-erythroid progenitor cell fate in zebrafish. Dev. Cell 2005, 8, 97–108. [Google Scholar] [CrossRef] [Green Version]
  32. Zhu, P.P.; Tang, Y.; Fan, J.D.; Fang, J.; Peng, X.; Cui, H.M. Hematological Parameters and Blood Cell Morphology of Male and Female Schizothorax (Racoma) davidi (Sauvage). J. World Aquac. Soc. 2017, 48, 821–830. [Google Scholar] [CrossRef]
  33. Burrows, A.S.; Fletcher, T.C.; Manning, M.J. Haematology of the turbot, Psetta maxima (L.): Ultrastructural, cytochemical and morphological properties of peripheral blood leucocytes. J. Appl. Ichthyol. 2001, 17, 77–84. [Google Scholar] [CrossRef]
  34. Bert, P. La pression barométrique: Recherches de physiologie expérimentale; Masson: Paris, France, 1878. [Google Scholar]
  35. Viault, F. Sur l’augmentation considerable du nombre des globules rouges dans sang chez les habitants des haut plateauz de l’Amerique de Sud. Comp. Rend. Acad. Sci. 1890, 111, 917–918. [Google Scholar]
  36. Lin, Y.H. Factors Influencing the Hematology of Fishes. J. Anhui Agric. Sci. 2011, 39, 8657–8659. [Google Scholar] [CrossRef]
  37. Kupittayanant, P.; Kinchareon, W. Hematological and biochemical responses of the flowerhorn fish to hypoxia. J. Anim. Vet. Adv. 2011, 10, 2631–2638. [Google Scholar] [CrossRef]
  38. Chen, Y.X.; Xiao, L.Y.; Yan, T.M.; Zhao, H.T.; Shen, S.J.; Zhou, D.G. Hematological of wild and cultured schizothoracin fishes. Acta Hydrobiol. Sin. 2009, 33, 905–910. [Google Scholar] [CrossRef]
  39. Lin, G.H.; Zhang, F.W. On Hematological Studies of Singuo Red Carp--Differential Blood Count and Normal Size of Blood Cells. J. Nanchang Univ. (Sci. Ed.) 1987, 11, 41–48. [Google Scholar]
  40. Qu, Y.M.; Athey, B.D.; Arabnia, H.R.; Sung, A.H.; Liu, Q.Z.; Yang, J.Y.; Mao, J.H.; Deng, Y.P. High-throughput next-generation sequencing technologies foster new cutting-edge computing techniques in bioinformatics. BMC Genom. 2009, 10 (Suppl. 1), 1–3. [Google Scholar] [CrossRef] [Green Version]
  41. Oburoglu, L.; Romano, M.; Taylor, N.; Kinet, S. Metabolic regulation of hematopoietic stem cell commitment and erythroid differentiation. Curr. Opin. Hematol. 2016, 23, 198–205. [Google Scholar] [CrossRef]
  42. Wingert, R.A.; Brownlie, A.; Galloway, J.L.; Dooley, K.; Fraenkel, P.; Axe, J.L.; Davidson, A.J.; Barut, B.; Noriega, L.; Sheng, X.M.; et al. The chianti zebrafish mutant provides a model for erythroid-specific disruption of transferrin receptor 1. Development 2004, 131, 6225–6235. [Google Scholar] [CrossRef] [PubMed] [Green Version]
  43. Hattangadi, S.M.; Wong, P.; Zhang, L.; Flygare, J.; Lodish, H.F. From stem cell to red cell: Regulation of erythropoiesis at multiple levels by multiple proteins, RNAs, and chromatin modifications. Blood 2011, 118, 6258–6268. [Google Scholar] [CrossRef] [PubMed] [Green Version]
  44. Kuhrt, D.; Wojchowski, D.M. Emerging EPO and EPO receptor regulators and signal transducers. Blood 2015, 125, 3536–3541. [Google Scholar] [CrossRef] [PubMed] [Green Version]
  45. Gering, M.; Rodaway, A.R.; Göttgens, B.; Patient, R.K.; Green, A.R. The SCL gene specifies haemangioblast development from early mesoderm. EMBO J. 1998, 17, 4029–4045. [Google Scholar] [CrossRef] [Green Version]
  46. Lyons, S.E.; Lawson, N.D.; Lei, L.; Bennett, P.E.; Weinstein, B.M.; Liu, P.P. A nonsense mutation in zebrafish gata1 causes the bloodless phenotype in vlad tepes. Proc. Natl. Acad. Sci. USA 2002, 99, 5454–5459. [Google Scholar] [CrossRef] [Green Version]
  47. Tamassia, N.; Aguilera, B.F.; Gasperini, S.; Polletti, S.; Gardiman, E.; Ostuni, R.; Natoli, G.; Cassatella, M.A. Induction of OCT2 contributes to regulate the gene expression program in human neutrophils activated via TLR8. Cell Rep. 2021, 35, 109143–109165. [Google Scholar] [CrossRef]
  48. Morris, A.; Hewitt, C.; Young, S. The major histocompatibility complex: Its genes and their roles in antigen presentation. Mol. Asp. Med. 1994, 15, 377–503. [Google Scholar] [CrossRef]
Figure 1. Erythrocyte numbers in the hypoxia zebrafish and normoxia zebrafish (* p < 0.05 indicates a significant difference between the hypoxia and normoxia group). Values are the mean erythrocyte numbers ± SD (n = 3).
Fishes 07 00098 g001
Figure 2. The microstructure of peripheral blood cells of zebrafish (Wright-Giemsa staining). (a) Mature erythrocyte (ME) (arrow); (b) immature erythrocyte (IME) (arrow); (c) dividing erythrocyte (DE) (arrow); (d) large lymphocyte (LL) (arrow); (e) small lymphocyte (SL) (arrow); (f) neutrophil (NE) (arrow); (g) eosinophils (EG) (arrow); (h) basophilic granulocyte (BG) (arrow); (i) monocyte (MO) (arrow); (j) macrophage (MP) (arrow); (k,l) thrombocytes in clusters (TH) (arrow). Bars = 10 μm.
Fishes 07 00098 g002
Figure 3. Differentially expressed genes (DEGs) between the long-term hypoxia acclimated zebrafish and the normoxia zebrafish. (a) Statistical analysis of DEGs in the head kidney. (b) GO enrichment analysis of the DEGs. (c) KEGG annotation of DEGs.
Fishes 07 00098 g003
Figure 4. DEGs involved in the hematopoiesis process and immunity response and qRT-PCR results. (a) Heatmap of DEGs involved in the hematopoiesis process. (b) Heatmap of DEGs involved in the immunity response. Kn-1 and Kn-2 are the normoxia zebrafish group and KL-1 and KL-2 are the hypoxia group. (c) Comparison of gene expression between the RNA-seq and qRT-PCR data. The qRT-PCR results in the bar graph are shown as mean +/- standard deviation. The Pearson correlation coefficient (R) was used to measure the correlation between RT-qPCR and RNA-seq results. Moreover, * indicates significant correlation (p < 0.05).
Fishes 07 00098 g004
Table 1. Specific primers for the selected unigenes and reference gene.
Acc. NumberGenePrimers Sequences (5′ to 3′)Product Length
NM_200294.1uap1l1F-TGAGGGACGTGGCAGAAAAG80
R-TTCTCCATCCACAAACGGCA
NM_001082858.1syngr2bF-TTCCTCAGCTGGGTGTTTGC179
R-TCAGCCAATAGGAAGCCCAC
NM_001017902.1mettl2aF-AGCACAACGCGTGGGATAAT91
R-GCTGGGAGAGGTTGACTGTT
NM_131885.2CebpaF-AGTCGGGACAAGGCGAAAAT176
R-CAGTTGCCCATGGCTTTGAC
NM_001043334.1EporF-GTCACATGGGCAAGGTGGAG116
R-ATAAGAAACGCCGTCCGGTT
NM_201129.1ncoa4F-GAGAGGACGCGGCAGTATTT102
R-CCCCATAGGAGACATACTGGGT
NM_131031.2β-ActinF-CACTGAGGCTCCCCTGAATC167
R-GGGTCACACCATCACCAGAG
Table 2. The size of different types of blood cells in the two groups (μm).
NormoxiaHypoxia
ParametersLength
(Mean ± SD)
Width
(Mean ± SD)
nLength
(Mean ± SD)
Width
(Mean ± SD)
n
Erythrocyte11.51 ± 0.888.23 ± 0.835010.81 ± 0.72 **7.19 ± 0.69 **50
Nucleus size of erythrocyte6.36 ± 0.554.06 ± 0.60506.39 ± 0.543.45 ± 0.39 **50
Neutrophil11.52 ± 1.1510.35 ± 1.194011.23 ± 1.269.83 ± 1.4030
Nucleus size of neutrophil9.02 ± 1.426.47 ± 1.004010.67 ± 11.196.29 ± 1.0930
Eosnophils12.13 ± 1.3411.07 ± 1.253010.25 ± 1.41 **8.88 ± 1.14 **20
Nucleus size of eosnophils8.34 ± 1.715.94 ± 1.11307.77 ± 1.375.97 ± 0.9020
Basophilic granulocyte10.99 ± 1.919.97 ± 1.46209.72 ± 1.38 *9.03 ± 1.43 *20
Nucleus size of basophilic granulocyte 8.95 ± 1.714.98 ± 1.51207.41 ± 1.23 **4.58 ± 1.2520
Small lymphocyte 6.33 ± 0.505.48 ± 0.76506.32 ± 0.435.08 ± 0.86 *50
Nucleus size of small lymphocyte 5.54 ± 0.604.70 ± 0.59506.03 ± 0.58 **4.81 ± 0.7650
Large lymphocyte7.98 ± 0.776.31 ± 0.90508.41 ± 1.21 *6.15 ± 1.0350
Nucleus size of large lymphocyte6.72 ± 1.015.49 ± 0.78507.61 ± 0.91 **5.66 ± 0.8950
Monocyte12.08 ± 1.0910.96 ± 1.324012.56 ± 1.4111.21 ± 1.3530
Nucleus size of monocyte10.07 ± 1.246.66 ± 1.34409.54 ± 1.266.11 ± 1.3130
Thrombocyte 6.86 ± 1.105.08 ± 1.02506.78 ± 1.404.12 ± 0.74 **50
n = the number of cells; * p < 0.05 and ** p < 0.01 indicates a significant difference between normoxia and hypoxia.
Publisher’s Note: MDPI stays neutral with regard to jurisdictional claims in published maps and institutional affiliations.

