Article

Unravelling Stock Spatial Structure of Silverside Odontesthes argentinensis (Valenciennes, 1835) from the North Argentinian Coast by Otoliths Shape Analysis

by
Santiago Morawicki
1,2,
Patricio J. Solimano
1 and
Alejandra V. Volpedo
3,4,*
1
Centro de Investigaciones y Transferencia de Río Negro, Rotonda Cooperación y Ruta Provincial N° 1, Universidad Nacional de Río Negro, Viedma C.P 8500, Río Negro, Argentina
2
Consejo Nacional de Investigaciones Científicas y Técnicas (CONICET), Centro de Investigaciones y Transferencia de Río Negro, Rotonda Cooperación y Ruta Provincial N° 1, Viedma C.P 8500, Río Negro, Argentina
3
Instituto de Investigaciones en Producción Animal (INPA), Facultad de Ciencias Veterinarias, CONICET—Universidad de Buenos Aires, Av. Chorroarín 280, Buenos Aires C1427CWO, Argentina
4
Centro de Estudios Transdisciplinarios del Agua (CETA), Buenos Aires C1427CWO, Argentina
*
Author to whom correspondence should be addressed.
Fishes 2022, 7(4), 155; https://doi.org/10.3390/fishes7040155
Submission received: 26 April 2022 / Revised: 31 May 2022 / Accepted: 31 May 2022 / Published: 29 June 2022
(This article belongs to the Special Issue Otoliths and Their Applications in Fishery Science)

Abstract

:
The marine silverside (Odontesthes argentinensis) is an euryhaline species, distributed along the southwest coast of the Atlantic Ocean, present in estuaries, brackish coastal lagoons and shallow marine waters. It is a significant economic resource for local fisheries in southern Brazil, Uruguay and Argentina. The aim of this work was to contribute to knowledge on the stock spatial structure of the silverside, using otolith shape analysis, based on samples from nine locations in the Argentinian Sea, covering a large distribution range of the species. A combination of elliptic Fourier descriptors, Wavelet coefficients and otolith Shape indices were explored by multivariate statistical methods. The application of wavelet and combined wavelet, Fourier and Shape Indices were the most effective variables to discriminate between sampling sites (7.42 total error). PERMANOVA analysis of otolith shape revealed multivariate significant differences between north versus south locations (p < 0.0001). The results obtained show that the spatial structure of O. argentinensis presents a North–South gradient with marked differences between the extreme localities of the north (Mar del Plata, Quequén) with more elliptical shapes than those in the south (San Blas, San Antonio Este) and an isolated group conformed by Puerto Lobos.

Graphical Abstract

1. Introduction

Marine coastal and euryhaline species have different ecological strategies to survive in dynamic environments. These strategies include a wide range of diet, reproductive alternatives and, especially, organization at the level of stock spatial structure [1].
The term “stock” as it refers to fish has been variously defined [2,3]. In summary, fish stock mainly describes the characteristics of a population unit with genetic integrity within which some particular type of management is carried out [3]. Common stock assessment techniques and management strategies assume discrete populations [4]; this type of population structure is the exception more than the rule [5]. It is now clear that the population structure of marine species falls along a continuum with different arrangements within the range of distribution, depending on the species and the environmental characteristics [6,7,8,9]. Migration and mixing generate complex stock spatial structures and so caution is called for in seeking correct management strategies regarding spatial structure and its complexity within the species [4].
There are different methods to identify fish stocks, such as catch–recapture, population parameters, size structure, morphometric and meristic characteristics, genetic identification, otoliths, among others (e.g., Park and Moran [10]; Volpedo and Cirelli [11]). The otoliths of teleost fish are complex polycrystalline bodies composed mainly of calcium carbonate in the form of aragonite and small amounts of other minerals immersed in an organic matrix [12,13]. In recent years, the use of otolith morphometry, morphology and the geometric morphometric methods (commonly known as “otolith shape analysis”) has allowed the identification of breeding areas and fish stocks, as well as the migratory routes of different commercial species [7,14,15,16,17].
Atherinopsids are an important group of coastal fishes for artisanal and/or recreational fisheries, and have a great inter-population phenotypic plasticity, presenting morphological, morphometric and meristic differences along the marine coast [18,19,20,21] and in continental environments [22,23,24]. Due to its complexity, this group has been studied in different aspects of its biological cycle, but very few authors have established the identification of stocks of this group [14,18,25,26], and even less so in marine atherinids.
Among the Atherinopsids, Odontesthes argentinensis, commonly known as silverside, is an euryhaline species, distributed along the southwest coast of the Atlantic Ocean, between Rio de Janeiro, Brazil (22° S) and Rawson, Argentina (43° S) [27,28], These fish are found in estuaries, brackish coastal lagoons and shallow marine waters [29]. It is considered one of the most ecologically and economically important species in the area. It is a significant economic resource for local fisheries in southern Brazil, Uruguay and Argentina [30,31,32,33,34].
In Argentina, O. argentinensis is exploited by recreational and artisanal fisheries along the coast of Buenos Aires province [35], and in the North of Patagonia [34].
Studies show how the otoliths of this species change during growth, using morphology and geometric morphometry [36,37]. Levy et al. [26], using the parasitic community of O. argentinenesis specimens caught in the Mar del Plata area (38°02′ S, 57°31′ W) and in the San Matías Gulf (40°50′ S, 64°50′ W), found that the evaluated individuals belonged to two different stocks. However, little is known about the stock spatial structure of these species in the rest of their distribution in the Argentinian Sea, where there are important fisheries for this resource; both in the coastal province of Buenos Aires and in northern Patagonia [34].
This study is guided by two central hypotheses: first, that there are at least two different stocks in the analyzed area, as proposed by Levy et al. [26], and, second, that there is a spatial structure to these stocks, and the oceanographic barrier that structures them is the area known as El Rincón. In this context, the objective of this study is to evaluate, for the first time, the stock spatial structure of O. argentinensis in a great portion of its distributions in the Argentinian Sea (>1000 km). The aim was to establish the amount of stock present in the area, their spatial distribution and the relations between them, taking into account the ones considered by Levy et al. [26], so as to generate management recommendations of the correct scale, with a focus on local fisheries of the area.

2. Materials and Methods
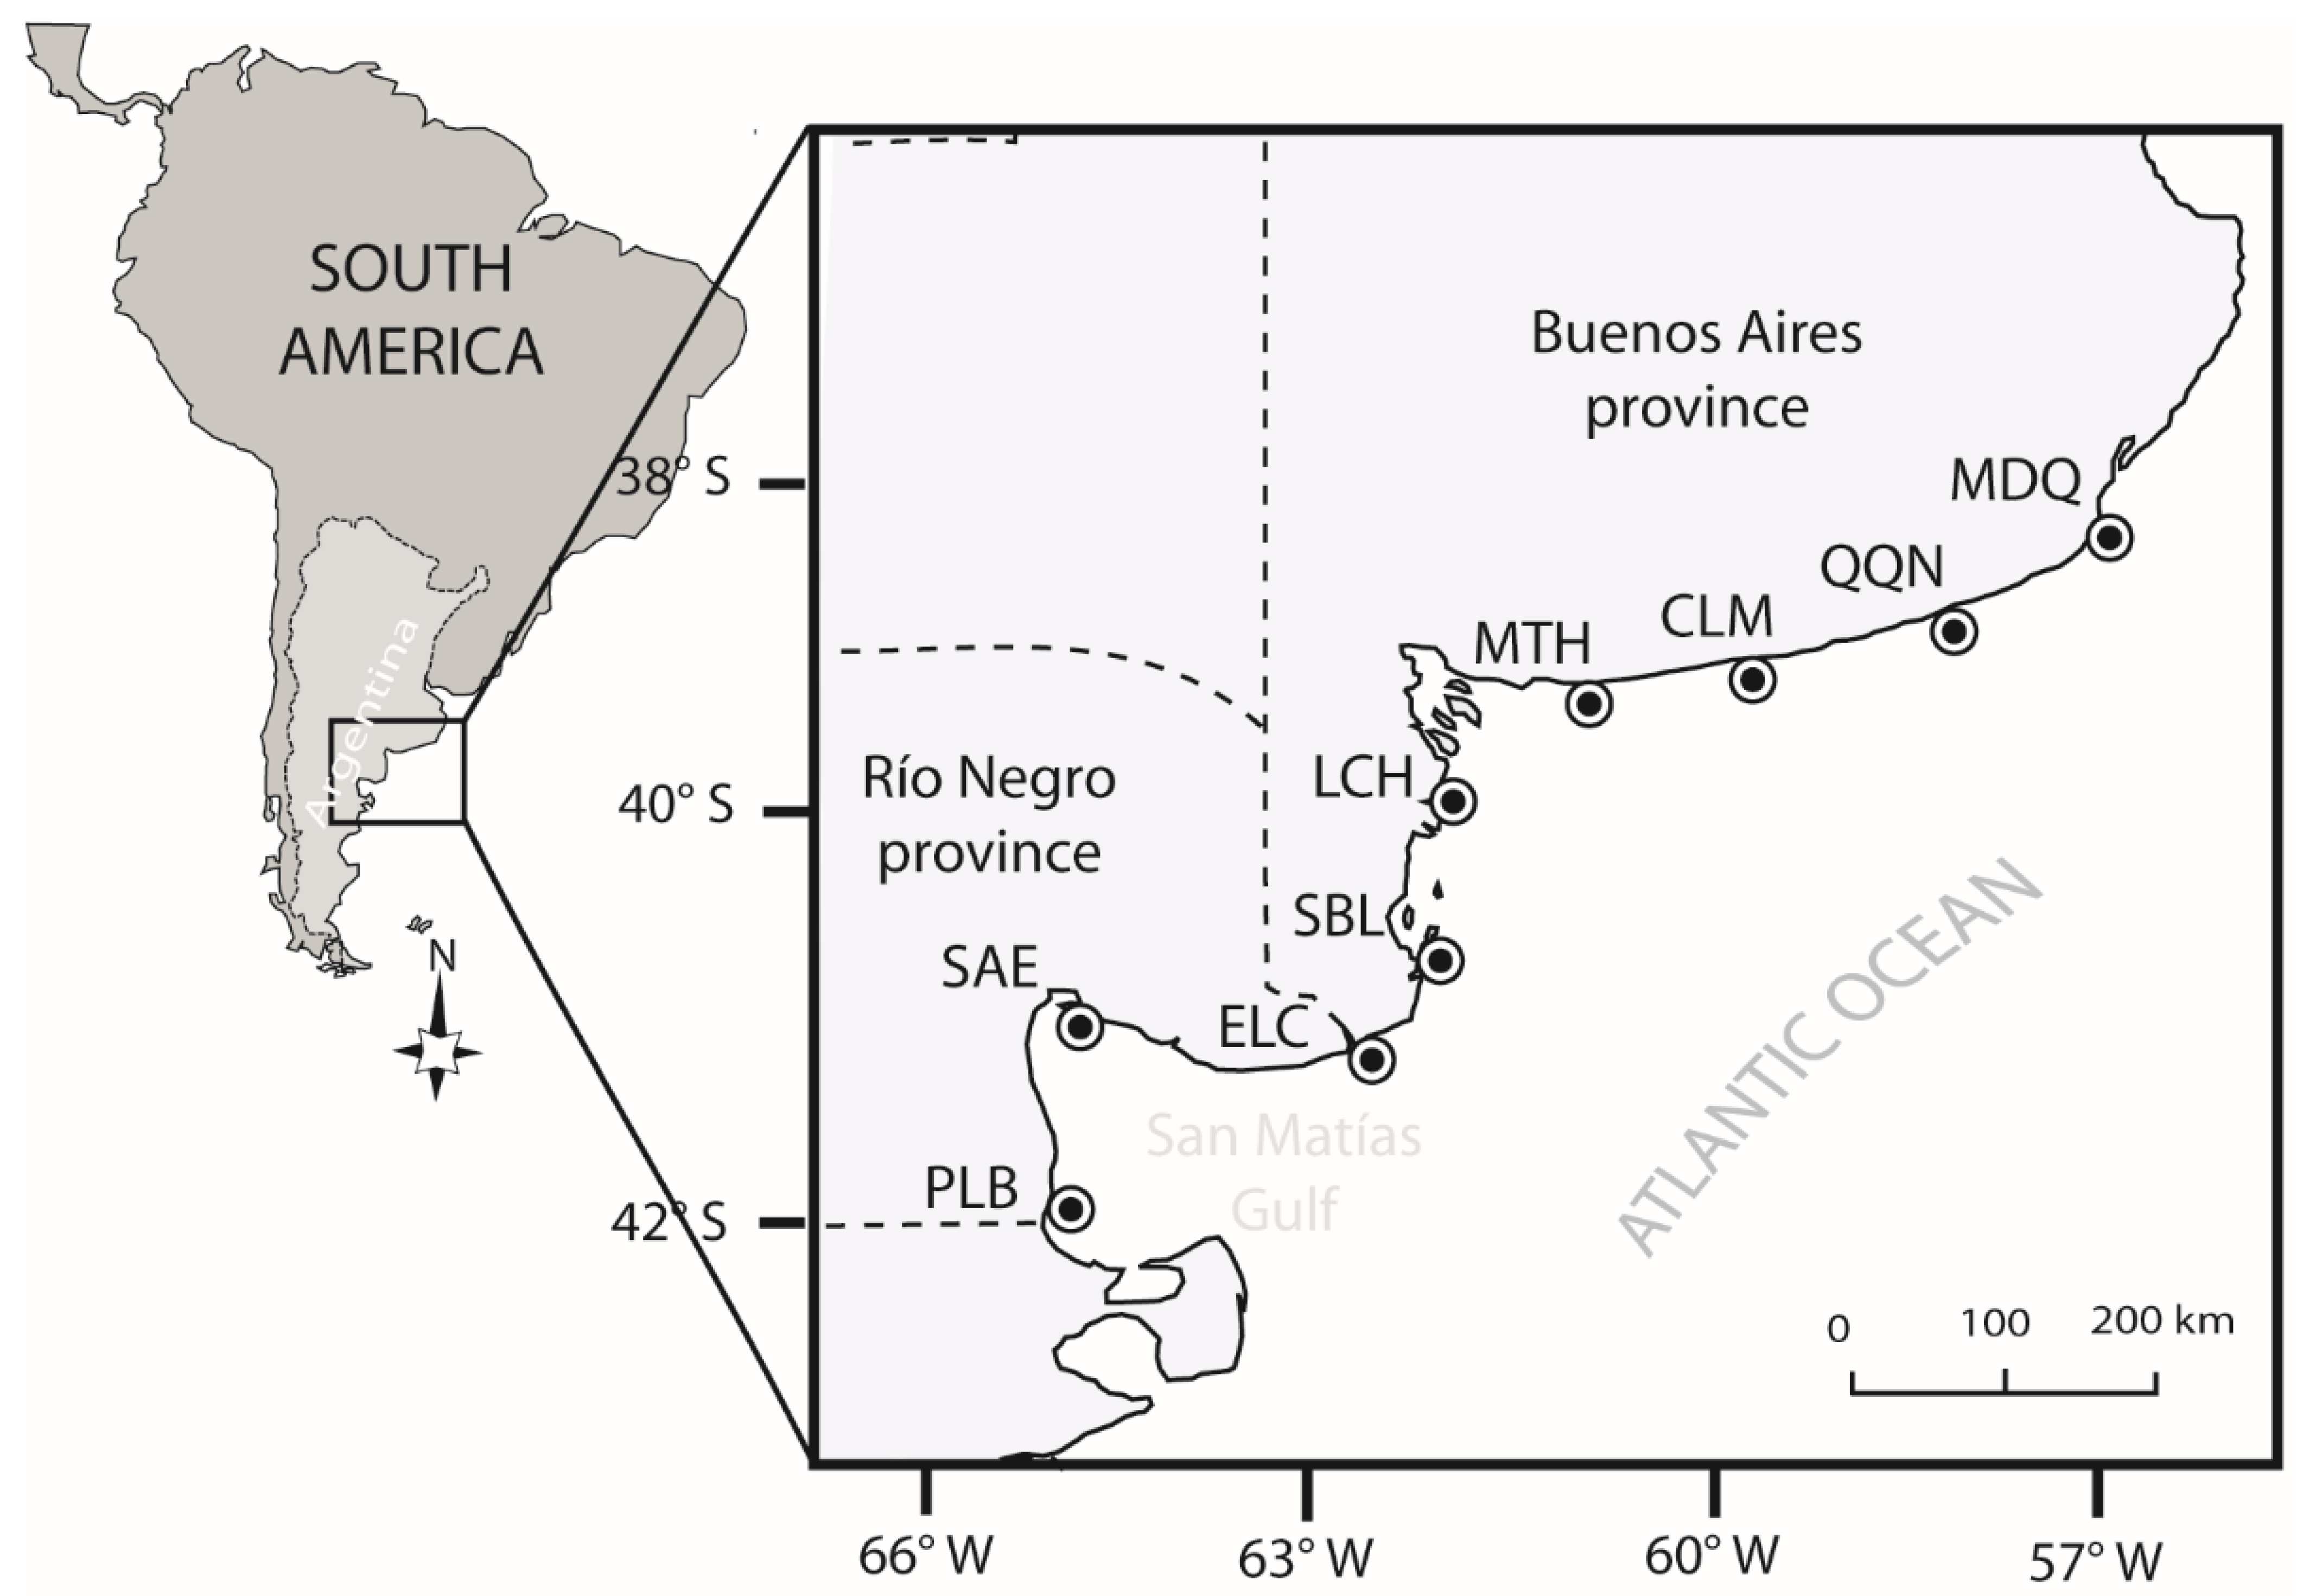
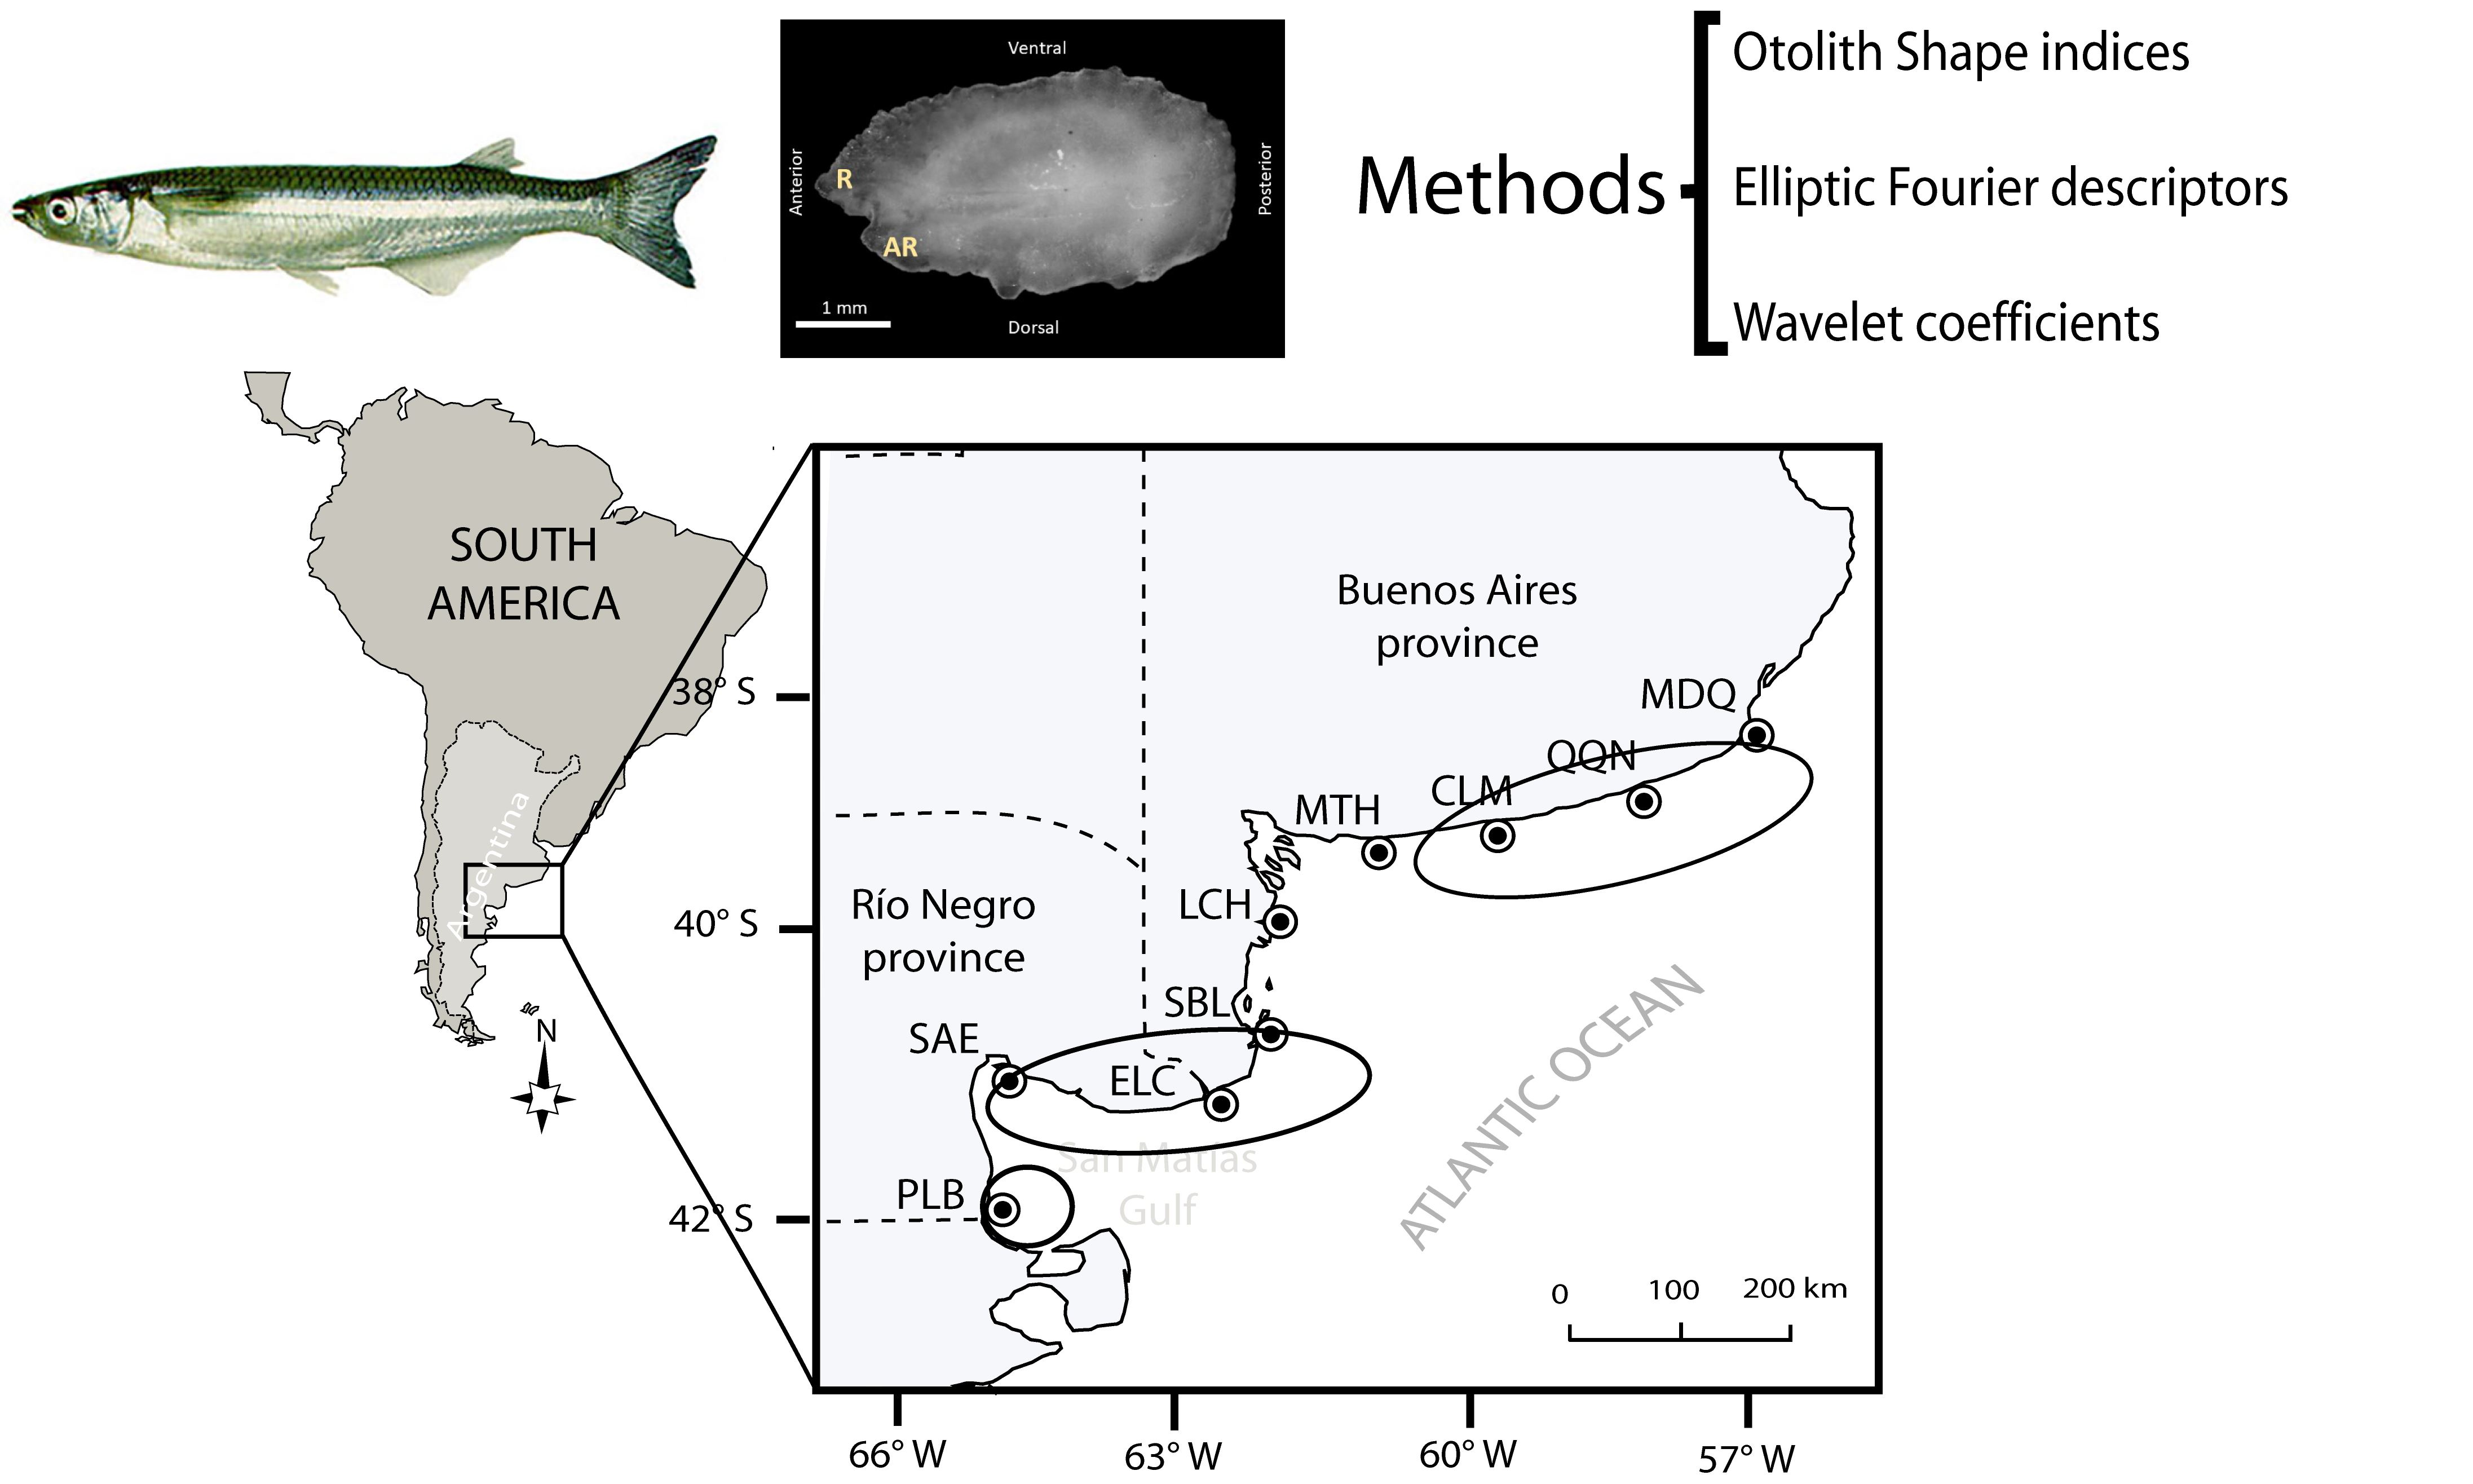
2.1. Study Area

The study area extends 1000 km over the coast of the Argentinian Sea and includes nine sampling sites approximately 150 km apart (Figure 1). The sites are located from north to south in Buenos Aires province: Mar del Plata (MDQ), Quequén (QQN), Claromecó (CLM) Monte Hermoso (MTH), La Chiquita (LCH), San Blas (SBL), and in Río Negro province: El Cóndor (ELC), San Antonio Este (SAE) and Puerto Lobos (PLB), (Figure 1).
The sites in Buenos Aires province are dominated primarily by extensive sandy beaches with fields of coastal dunes, which are interrupted by estuaries, such as those of the Quequén River, Colorado and the estuary of Bahía Blanca. Blanca and Anegada bays represent wide environments dominated by strong sludge deposits [38]. SBL and LCH are located within the coastal area denominated El Rincón (39°–41°30′ S), an area where the characteristics of water mass (temperature, salinity, density) differ from the rest of the coast of the province of Buenos Aires, due to the conjunction of inland waters from the Negro and Colorado rivers, high salinity waters from the San Matías Gulf and the typical shelf waters [39,40].
ELC is located on the estuary of the Negro River, at the entrance of the San Matias Gulf, and it is characterized by wide sandy beaches and large cliffs [34]. The localities PLB and SAE are located in the interior of the San Matías Gulf (Figure 1). This area has oceanographic characteristics different from the rest of the coastal area of the Argentinian Sea, because its geomorphology restricts the exchange of water with the open sea [40].

2.2. Sampling

Sampling was carried out during the months of September 2018 and March 2019 using different fishing gear (gillnets having mesh sizes of 30, 40 and 50 mm, and 25 m long, coastal trawl and with rod by the contribution of sport fishing participants). The individuals were identified according to the taxonomic keys proposed by Dyer [27] and Mancini et al. [41]. First, 354 fish were collected and frozen (−18 °C) until laboratory analysis. Each individual’s weight (W) in g, total length (TL) and standard length (SL) in mm were recorded (Table 1). The fishes were adults and the TL of all the sampling sites showed high overlap sizes.
Sagittae otoliths were extracted and cleaned with Milli-Q water with a resistivity of 18.2 mΩ cm (Merck Millipore) and dried.
The left sagitta otolith of each specimen was photographed on a dark background (Figure 2) with a Leica® MC170HD camera mounted on a Schönfeld stereoscopic magnifier® and the Leica Application Suite software (LAS version 4.5). The left otolith was used since both otoliths are morphologically equal [36].

2.3. Shape Analysis

Otolith contours were analyzed using the ShapeR package [42] of the statistical software R. The “detect. outline” function was used to extract the contour of all the otoliths (threshold = 0.15) and to eliminate the pixel noise around the contours that could impair the analyses; the “smooth out” function was used [42,43].
The Fourier descriptors (FD) and Wavelet coefficients (WC), respectively, were extracted from the digital images using the Wave thresh package [42,44]. The deviation of the reconstructed otolith’s outline from the original outline was evaluated with the ShapeR package [42] to determine the number of FD and WC needed for the analysis, with 45 FD and 64 WC; an accuracy rate higher than 98.5% was obtained. The contour coefficients that showed a relationship with the length of the fish (p < 0.05) were discarded from the analysis [45,46]. Among the 45 FD and 64 WC integrated within the ShapeR package, only 24 FD and 44 WC met our assumptions and were, therefore, used in the following statistical analysis.
The mean otoliths reconstructed by normalized WC for each group of samples were plotted and the differences among the groups visually evaluated.
To estimate which part of the otolith outline contributed most to the difference between the potential stocks, mean shape coefficients and their standard deviation (SD) were plotted against the angle of the outline from where the coefficients were extracted, using the function plotCI from the plots package [47].

2.4. Morphometric Analysis

Morphometric variables, such as otolith length (OL mm), width (OW mm), area (OA mm2) and perimeter (OP) in mm, were obtained from the contours of otoliths using ShapeR [42]. Four morphometric indices (MI) were calculated: (i) Circularity (OP2/OA) [37,48,49]; (ii) rectangularity (OA/(OW × OL)) [37,48,49]; (iii) aspect ratio (OW/OL), [37]; (iv) roundness (4 × OA)/(π × OL2) [13]. All morphometrical variables fitted a normal distribution and homogeneity of variance (Shapiro–Wilk, p > 0.05; Levene, p > 0.05). The morphometric indices were then analyzed by ANOVA, and Bonferroni contracts were used to evaluate the differences among sampling areas.
Indices were corrected to eliminate possible allometry effects in otolith shape related to fish body size, for a proper comparison between groups; the formula: y’ = yi × (x0/xi)b was used, in which y’ is the corrected predictive variable, yi is the original value of the obtained index, x0 is a referential standard length (SL) value (SL minimum = 142 mm), xi is the original SL value, and b is the Huxley coefficient of each regression index to SL [37,49,50].

2.5. Multivariate Analysis

A Linear Discriminant Analysis (LDA) using morphometric indices, Fourier descriptors, and Wavelet coefficients separately and together was performed using the R “MASS” [51]. The overall power of the discriminant function analysis was evaluated by Wilks’ λ test [52]. The success of classification among the different groups was evaluated using a Jackknifed classification matrix [52]. Comparisons among sample locations, as well as among the groups retrieved from the LDA, were conducted using a permutational multivariate analysis of variance [PERMANOVA; [53], based on the Bray–Curtis dissimilarity measure (4999 random permutations)].
Statistical analyses were performed with R (R Core Team, 2021) using ShapeR packages ShapeR [42], Vegan [54], ipred [55] and MASS [51].

3. Results

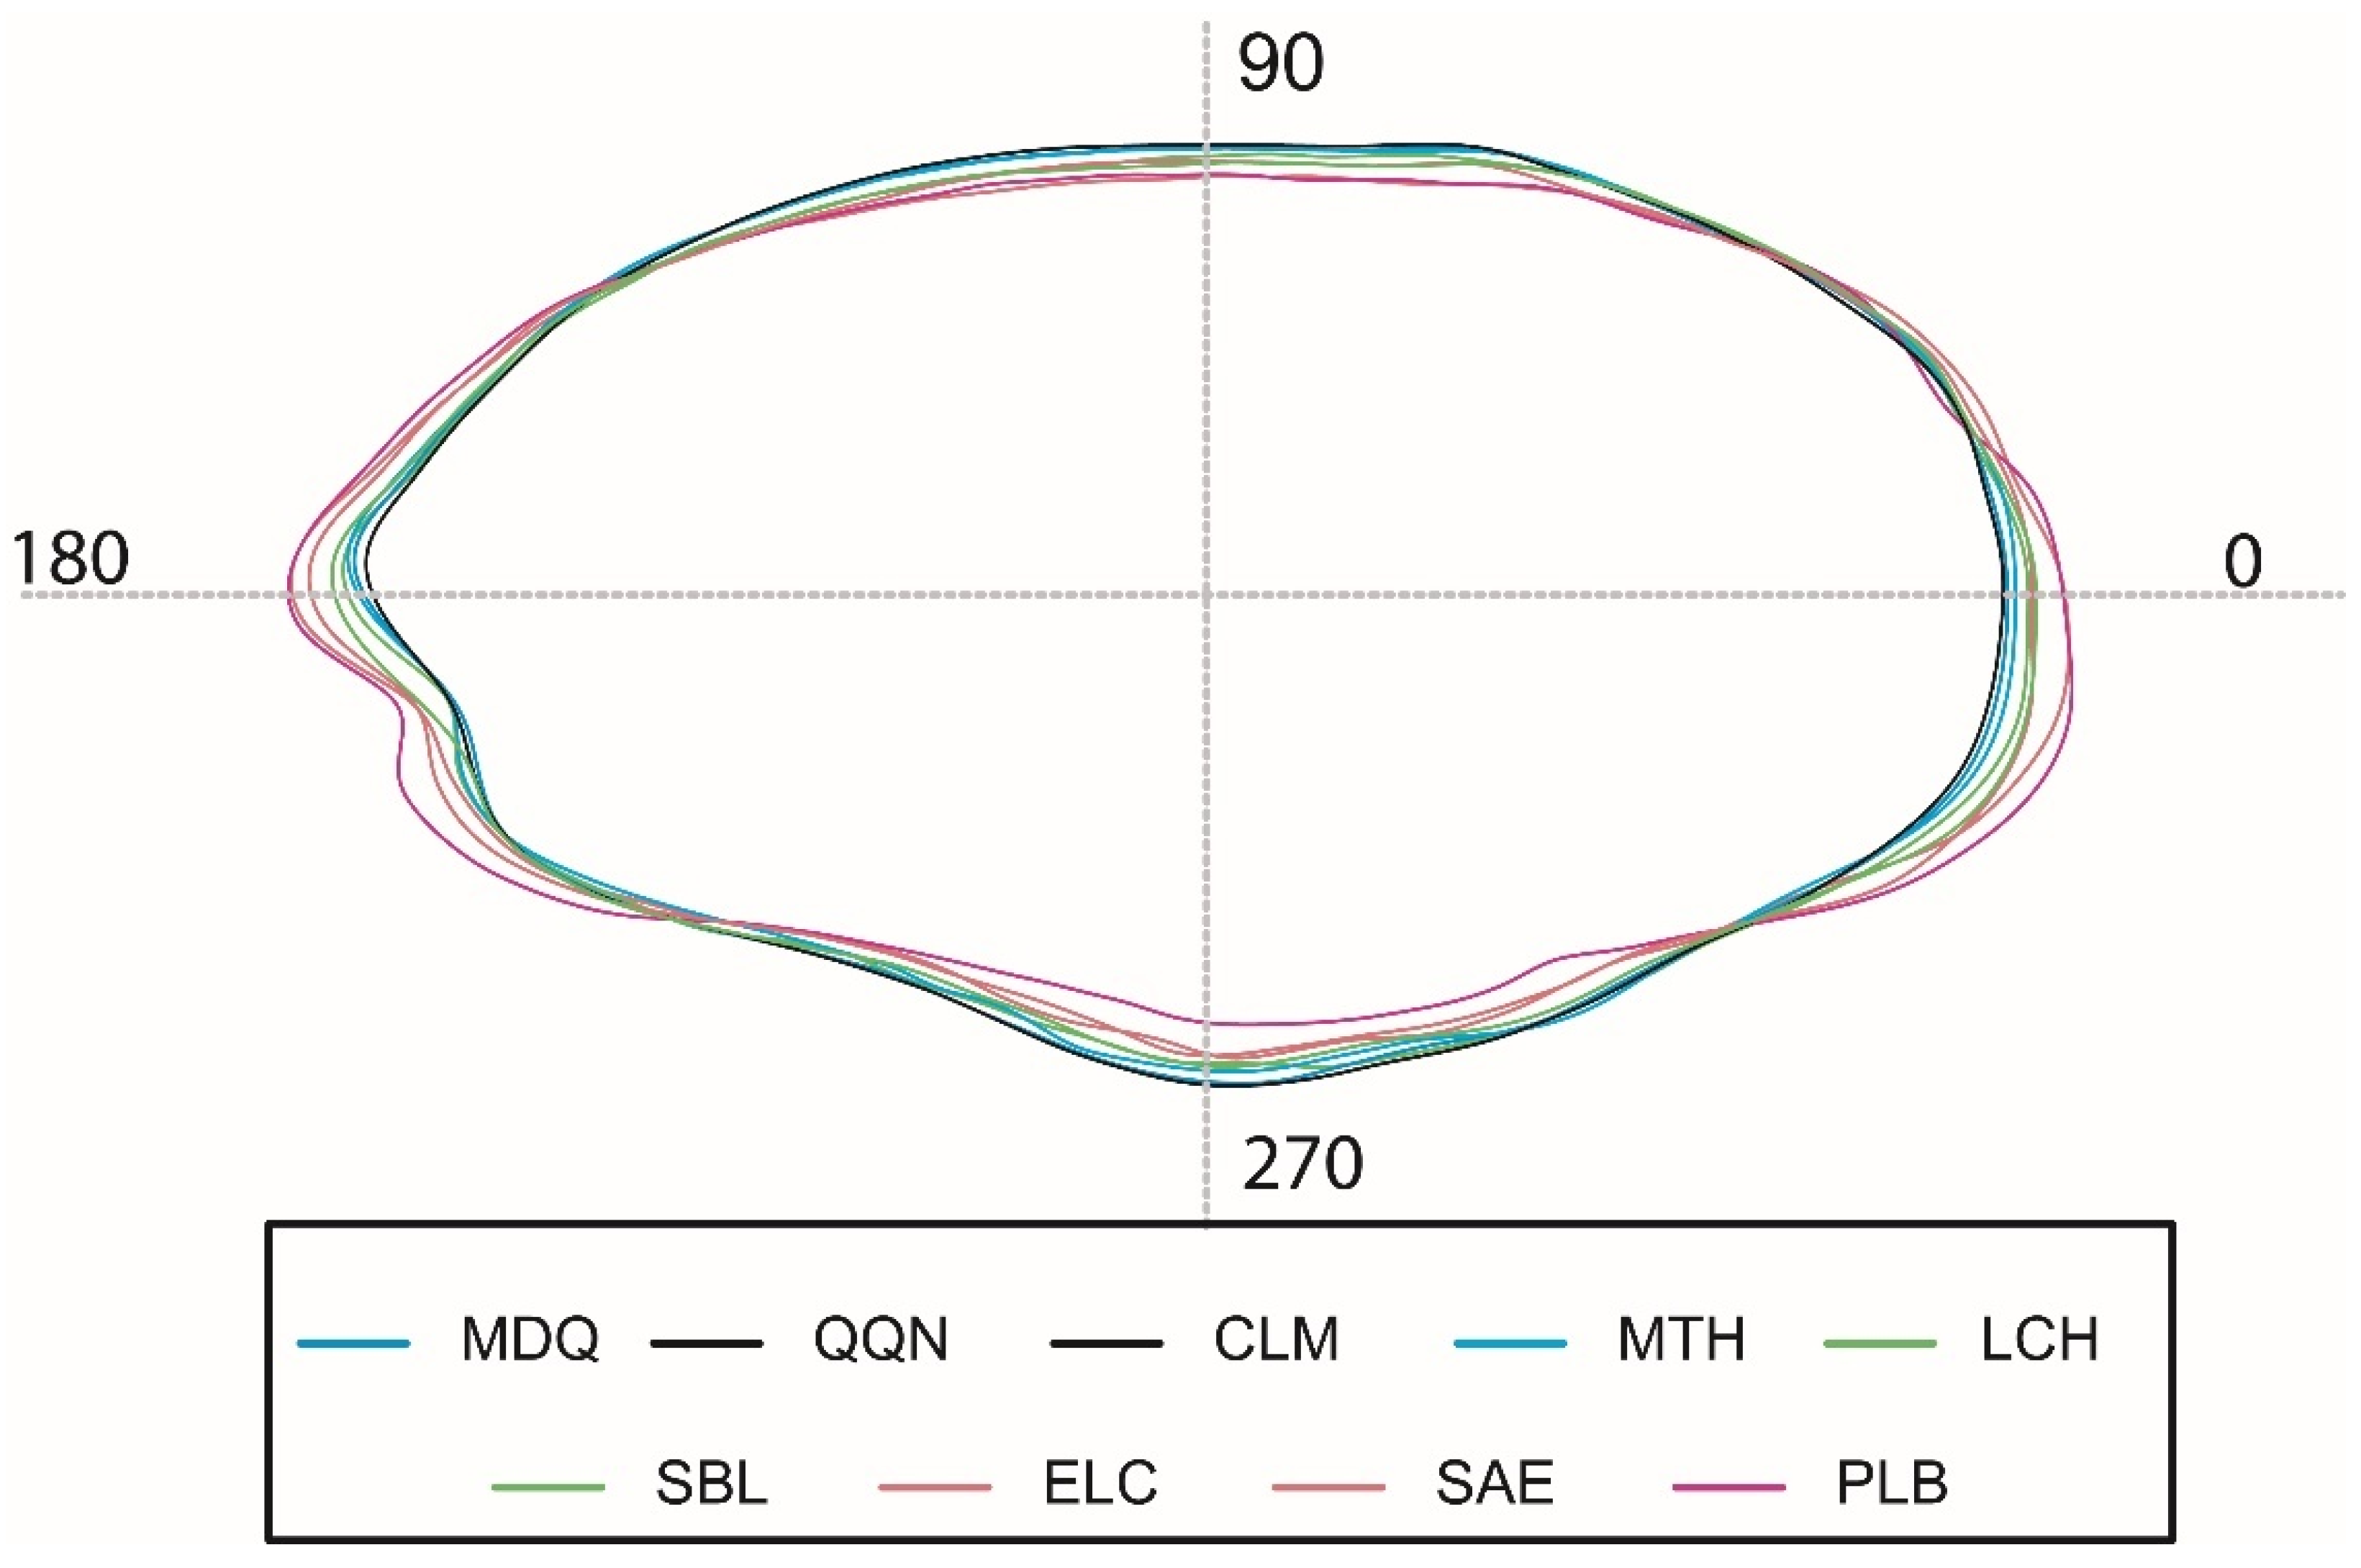
3.1. Mean Shape Features

Otolith contours of the fish from the different studied localities presented differences in mean shape (Figure 3). The morphometry of the otoliths presented modifications in the rostrum-antirostrum, the dorsal margin and the posterior end (Figure 4). These modifications were displayed in the wavelet coefficients (ICC) for these regions on the otolith outline at 170°–200°, 260°–290° and 320°–20° (Figure 4).
The otoliths of the fish show a gradient from the northern localities (MDQ, QQN, CLM) that have a more elliptical shape, unlike the otoliths of the fish caught in the localities of the extreme south (PLB and SAE). The otoliths of the fish caught in MTH, LCH, SBL and ELC presented intermediate forms.

3.2. Shape Indices

The shape indices obtained from the variables OL, OW and OP showed higher values of circularity towards the south of the spatial distribution studied, while higher values of Aspect ratio and Roundness towards the North were observed. The rectangularity values did not show major latitudinal changes (Table 2).

3.3. Multivariate Analysis

The results of the Linear Discriminant Analysis showed different percentages of errors in the classification of individuals, depending on the variables used in the analysis (Table 3).
The highest percentage of total error presented in the cross-classification was obtained by using only the MI as a variable (72, 25% of poorly classified individuals) (Table 3a). The poorly classified individuals were from the localities of LCH, SAE, SBL and MTH. This is also shown in Figure 5a, where no defined clusters are observed between the localities, although there is a North–South gradient. In relation to Fourier descriptors (FDs) the percentage of error in the classified individuals was reduced to 25.27%, (Table 3c). The locality with the highest percentage of classification error was SBL with 48%. Figure 5b–d show that the locality of PLB was separated from the rest by canonical axis 1, while the remaining localities did not form a clear grouping on canonical axis 2. The QQN and MDQ localities were at opposite points of the point cloud (Figure 5c).
The results of the application of wavelet coefficients (WCs), show that the percentage of error in the classified individuals was less than 17.86 (Table 3b). The locality with the highest percentage of classification error was SBL (33%). Figure 5c shows that the otoliths of PLB fish were separated from the rest of the samples by canonical axis 1. In addition, a North–South gradient of the localities of origin of the samples was also observed in the canonical axis 2 (Figure 5c).
The lowest percentage of classification error (7.42%) was obtained by applying the MI, FD and WC together (Table 3d). Figure 5d shows that the locality of PLB was separated from the rest on canonical axis 1, showing a North–South gradient on canonical axis 2 (Figure 5d). This analysis, including the three types of variables, presented a classification more in line with the geographical reality of the localities evaluated, showing, in addition, the lowest percentage of misclassification (Table 3).
PERMANOVA tests were performed on different groups, considering ADL classification errors (Table 2) and groups in the ADL figures (Figure 5). The tests were done over all standardized variables (SI + DF + WC). The PERMANOVA tests showed significant differences among the proposed aggrupation’s North (MDQ, QQN, CLM) against South (MTH, LCH, SBL, ELC, SAE, PLB) (pseudo-f: 36.76, p < 0.0001); also, with North (MDQ, QQN, CLM) against South (MTH, LCH, SBL, ELC, SAE) and PLB alone (pseudo-f: 28.54 p < 0.0001) and between North localities against PLB and South localities versus PLB (Table 4).

4. Discussion

Marine and euryhaline coastal species inhabit dynamic environments so they generally show high plasticity [56], such as atherinids, mugilids and sardines [17,37,57,58,59]. This plasticity can be reflected in otoliths.
The results obtained show that the spatial structure of O. argentinensis presents a North–South gradient (38° S–41°51′ S), where three stocks can be accounted for: one in the north with the localities of MDQ, QQN and CLM, another in the south/center with MTH, LCH, SBL, ELC and SAE and the third in the south of the San Matias Gulf in PLB. The latter should be further studied to have more conclusive evidence of its relations. This latitudinal gradient marked differences between the extreme localities of the north (MDQ, QQN), the south/center (SBL, SAE) and the isolated location of PLB. This also coincides with what was recently found by González-Castro et al. [60] when studying molecular diversity. These authors determined the existence of different populations: an isolated population of silversides in the Mar Chiquita lagoon, a population in the coastal area of Mar del Plata, that coincides with the northern group of this study, and another population in San Blas Bay, that would be included in the south/center group of the localities we studied.
On the other hand, González-Castro et al. [60] also found low frequency of haplotypes in the population of Mar del Plata area, which is also consistent with the gradient found in this study using the morphometry of the otoliths. In this sense, Levy et al. [26] found two different stocks of O. argentinensis when studying parasite communities: one in Mar del Plata and the other in San Antonio. Their findings agree with the stock spatial structure we propose in this study.
Furthermore, we can establish that the limit between the two stocks is in the zone of MTH, which is consistent with the limits of the El Rincon area and oceanographic region, where the characteristics of the water mass differ from the rest of the coast of the province of Buenos Aires [39,40]. It is worth mentioning that the Puerto Lobos specimens can be established as another stock that was unknown until this study. The Puerto Lobos stock is inside the San Matias gulf, in its southern zone; for example, the gulf has its own isolated stock of Argentinian Hake [61,62]. These findings should be confirmed by more studies with the O. argentinensis inside the gulf and further south, because no studies of characteristics were done with the fish, knowing that the distribution of the species continues till Rawson (43°19′ S; 65°02′ W) [27].
Environmental conditions produce a rapid variation in the morphometric and meristic characteristics of other species of silversides, such as O. regia [63], which could also generate variations in the morphometry of the otoliths reflected in the morphometric indices of shape of the otoliths.
The plasticity and flexibility of the life history of O. argentinensis are manifested in different conditions of salinity and temperature inhabited by the fish, which allows this species to be found in freshwater environments, such as the Uruguay River [64] or the Salada de Pedro Luro [24]. This particularity may occur due to the fact that evolutionarily they come from an ancestral plastic marine population [65].
Heras and Roldán [66], by analyzing the genetics of individuals from different localities of the Argentinian Sea, proposed that O. argentinensis may be a model of divergent adaptive selection associated with reproductive events of isolation. This fact could also explain the separation of the shape of the otoliths from the Puerto Lobos specimens studied in this work which is very different from the rest. This could be due to an isolation produced by oceanographic barriers, such as the different bodies of water or the ocean fronts of this locality. This type of oceanographic barrier also affects the spatial distribution of other coastal species, like sciaenids [11,67]. These results coincide with the particular characteristics that the species present in incipient speciation processes in specific areas like those described by Levy et al. [29] and González-Castro et al. [60], applying molecular genetics in silversides of the Mar Chiquita Lagoon. It is important to note that speciation processes in this species can occur on a small geographical scale (<20 km) even without marked geographical barriers [26], so groups that are isolated in particular coastal environments, such as coastal lagoons or areas of different oceanographic features, may be able to differentiate themselves from the rest, as happens with PLB fish.
The values of the morphometric indices of otolith shape obtained by Biolé et al. [37] in silversides of La Lucila del Mar are different in relation to those obtained in this work. These differences may be due to the existence of a latitudinal gradient in the species. The otolith shapes that we found were similar to those referred to by Biolé et al. [37] and Tombari et al. [36], in La Lucila del Mar, Punta Rasa (36°22′ S–56°45′ W) and Miramar (38°16′S–57°50′ W).
The increase in the rate of circularity towards higher latitudes shows the increase in the complexity of otoliths [13,49] towards higher latitudes. This could be caused by environmental changes and the trophic habits of the species.
The shape of the otolith depends on the ecological, evolutionary and phylogenetic characteristics of each species [67,68,69,70,71,72]. This can be evident in coastal species that inhabit dynamic environments, as is the case with O. argentinensis, and can be reflected in the morphometry of the otoliths.
Biolé et al used traditional morphometry and shape analysis by Fourier descriptors [37] in specimens of O. argentinensis from La Lucila del Mar in a wider range of sizes than those studied in this work. In this study, as in Biolé et al., Stage III of O argentinensis [37], the focus was on sexually mature adult fish. Adults of marine silversides make habitat movements to reproduce which could be reflected in the shape of otoliths as in other fish species [17,58,73].
Methodologically, the application of the analysis of morphometric indices, Fourier descriptors and wavelet coefficients was used in different species of the southwest Atlantic Ocean coast, such as Coryphaena hippurus [74], Menticirrhus americanus [17,71], Pagrus pagrus [75]. The joint application of the three methods referred to by Sadighzadeh et al. [76] was used for the first time regarding this species, with different results for the methods.
Tuset et al. [69] demonstrated that the application of wavelet coefficients on otoliths is a more appropriate methodological option to classify specimens from different localities than morphometric indices. These results are consistent with what was found in this work, since when the wavelet coefficients were incorporated, the percentage of the classification error decreased, while when only the morphometric indices were considered, the classification error was high. This would suggest that the application of joint methodologies (morphometric indices, wavelet coefficients, Fourier descriptors and even otolith chemistry) would be more efficient in otoliths of species that inhabit very environmentally dynamic areas, as has been shown for Lutjanus spp and Chaetodipterus faber [76,77].
Finally, it is important to highlight that the spatial distribution of the stocks in this study showed three stocks that are under differential fishing pressures. On one hand, the northern stock is found within the fishing area of the most important coastal cities of Argentina, such as Mar del Plata and Necochea, where the fishing for the species is carried out constantly throughout the year, in shores and docks used for this activity. For the south/center stock, fishing takes place mainly in fishing tourism areas, such as San Blas and La Chiquita. In these fishing villages, the fishery is seasonal and the influx of tourism during summer is most important, especially in San Blas [35,78]. On the other hand, the last stock falls under two different jurisdictions, the Province of Buenos Aires, where management measures are carried out by the coastal fishing regulations of Buenos Aires, and minimum catch size and number of pieces for silverside are set, and the southern part, in the localities of El Cóndor, San Antonio Este and also Puerto Lobos, in the Province of Río Negro, which does not have any regulations governing marine recreational fishing [79]. This spatial analysis should be incorporated in the management scenario of silverside fisheries of the marine coast of Argentina [4].

5. Conclusions

The results of this paper allow us to conclude that the spatial structure of O. argentinensis in the study area presents three stocks: one includes fish from MDQ localities; QQN and CLM, the second stock includes fish from the localities of MTH, LCH, SBL, ELC and SAE and the third concerns south of the Gulf of San Matías (PLB). This last stock should be studied further, expanding the sampling to the southern region and increasing the number of individuals in order to strengthen the evidence found in this work. On the other hand, it is important to consider that the limits of these groups of fish are between the localities of MTH and CLM for the north and south/center stock and between SAE and PLB, for the south/central and south stocks.
In relation to management applications of these findings, the three stocks have different problems. The north stock is located under the fishing zone of major coastal cities of Argentina, such as Mar del Plata and Necochea, which implies that this stock could be under larger fishing pressure than the other stocks of this species. On the other hand, the south/center stock is distributed in two jurisdictions, Buenos Aires in the north and Río Negro in the south, and these locales have different management measures; Río Negro does not have any measurement for the management of silverside fishing. In this context, fishery management must be carried out by the two jurisdictions, considering that they share the same resources.

Author Contributions

S.M., conceptualization, methodology, software, data analysis, writing—original draft, writing—review and editing, sampling; P.J.S., conceptualization, methodology, writing—original draft, writing—review and editing, sampling; A.V.V., conceptualization, data analysis, writing—original draft, writing—review and editing. All authors have read and agreed to the published version of the manuscript.

Funding

CONICET (PIP 11220200103264CO, PUE 22920180100047CO), Agencia Nacional de Promoción Científica y Tecnológica (PICT 2019-03888), Universidad de Buenos Aires (UBACYT 20020190100069BA), Universidad Nacional de Rio Negro (PI (40-C-683); PI (40-C-790)).

Institutional Review Board Statement

Not applicable.

Informed Consent Statement

Not applicable.

Data Availability Statement

The data belong to the Ph. Thesis of S. Morawicki and are available in the Centro de Investigaciones y Transferencia de Río Negro repository.

Acknowledgments

Authors thanks to CONICET, Agencia Nacional de Promoción Científica y Tecnológica, Universidad de Buenos Aires, Universidad Nacional de Rio Negro and to the group “Pescadores de Necochea”, Daniel Sframeli, Bruno Rodriguez, Eze Duckardt and Marcello Saez, for field support and some of the fish.

Conflicts of Interest

The authors declare no conflict of interest.

References

  1. Carr, M.H.; Robinson, S.P.; Wahle, C.; Davis, G.; Kroll, S.; Murray, S.; Schumacker, E.J.; Williams, M. The Central Importance of Ecological Spatial Connectivity to Effective Coastal Marine Protected Areas and to Meeting the Challenges of Climate Change in the Marine Environment. Aquat. Conserv. Mar. Freshw. Ecosyst. 2017, 27, 6–29. [Google Scholar] [CrossRef] [Green Version]
  2. Dizon, A.E.; Lockyer, C.; Perrin, W.F.; Demaster, D.P.; Sisson, J. Rethinking the Stock Concept: A Phylogeographic Approach. Conser. Biol. 1992, 6, 24–36. [Google Scholar] [CrossRef]
  3. Begg, G.A.; Waldman, J.R. An Holistic Approach to Fish Stock Identification. Fish. Res. 1999, 43, 35–44. [Google Scholar] [CrossRef]
  4. Stephenson, R.L. Stock Complexity in Fisheries Management: A Perspective of Emerging Issues Related to Population Sub-Units. Fish. Res. 1999, 43, 247–249. [Google Scholar] [CrossRef]
  5. Kerr, L.A.; Hintzen, N.T.; Cadrin, S.X.; Clausen, L.W.; Dickey-Collas, M.; Goethel, D.R.; Hatfield, E.M.C.; Kritzer, J.P.; Nash, R.D.M. Lessons Learned from Practical Approaches to Reconcile Mismatches between Biological Population Structure and Stock Units of Marine Fish. ICES J. Mar. Sci. 2017, 74, 1708–1722. [Google Scholar] [CrossRef] [Green Version]
  6. Côté, C.L.; Gagnaire, P.A.; Bourret, V.; Verreault, G.; Castonguay, M.; Bernatchez, L. Population Genetics of the American Eel (Anguilla rostrata): FST = 0 and North Atlantic Oscillation Effects on Demographic Fluctuations of a Panmictic Species. Mol. Ecol. 2013, 22, 1763–1776. [Google Scholar] [CrossRef] [PubMed]
  7. Abaunza, P.; Murta, A.G.; Campbell, N.; Cimmaruta, R.; Comesaña, A.S.; Dahle, G.; García Santamaría, M.T.; Gordo, L.S.; Iversen, S.A.; MacKenzie, K.; et al. Stock Identity of Horse Mackerel (Trachurus trachurus) in the Northeast Atlantic and Mediterranean Sea: Integrating the Results from Different Stock Identification Approaches. Fish. Res. 2008, 89, 196–209. [Google Scholar] [CrossRef]
  8. Cadrin, S.X.; Bernreuther, M.; Daníelsdóttir, A.K.; Hjörleifsson, E.; Johansen, T.; Kerr, L.; Kristinsson, K.; Mariani, S.; Nedreaas, K.; Pampoulie, C.; et al. Population Structure of Beaked Redfish, Sebastes mentella: Evidence of Divergence Associated with Different Habitats. ICES J. Mar. Sci. 2010, 67, 1617–1630. [Google Scholar] [CrossRef] [Green Version]
  9. Smedbol, R.K.; Wroblewski, J.S. Metapopulation Theory and Northern Cod Population Structure: Interdependency of Subpopulations in Recovery of a Groundfish Population. Fish. Res. 2002, 55, 161–174. [Google Scholar] [CrossRef]
  10. Park, L.; Moran, P. Developments in Molecular Genetic Techniques in Fisheries. Rev. Fish Biol. Fish. 1994, 4, 272–299. [Google Scholar] [CrossRef]
  11. Volpedo, A.V.; Fernández Cirelli, A. Otolith Chemical Composition as a Useful Tool for Sciaenid Stock Discrimination in the South-Western Atlantic. Sci. Mar. 2006, 70, 325–334. [Google Scholar] [CrossRef]
  12. Campana, S.E. Chemistry and Composition of Fish Otoliths: Pathways, Mechanisms and Applications. Mar. Ecol. Prog. Ser. 1999, 188, 263–297. [Google Scholar] [CrossRef] [Green Version]
  13. Tuset, V.M.; Lozano, I.J.; Gonzĺez, J.A.; Pertusa, J.F.; García-Díaz, M.M. Shape Indices to Identify Regional Differences in Otolith Morphology of Comber, Serranus cabrilla (L., 1758). J. Appl. Ichthyol. 2003, 19, 88–93. [Google Scholar] [CrossRef]
  14. Avigliano, E.; Martinez, C.F.R.; Volpedo, A.V. Combined Use of Otolith Microchemistry and Morphometry as Indicators of the Habitat of the Silverside (Odontesthes bonariensis) in a Freshwater-Estuarine Environment. Fish. Res. 2014, 149, 55–60. [Google Scholar] [CrossRef]
  15. Biolé, F.G.; Thompson, G.A.; Vargas, C.V.; Leisen, M.; Barra, F.; Volpedo, A.V.; Avigliano, E. Fish Stocks of Urophycis brasiliensis Revealed by Otolith Fingerprint and Shape in the Southwestern Atlantic Ocean. Estuar. Coast. Shelf Sci. 2019, 229, 106406. [Google Scholar] [CrossRef]
  16. Tracey, S.R.; Lyle, J.M.; Duhamel, G. Application of Elliptical Fourier Analysis of Otolith Form as a Tool for Stock Identification. Fish. Res. 2006, 77, 138–147. [Google Scholar] [CrossRef]
  17. de Carvalho, B.M.; Volpedo, A.V.; Fávaro, L.F. Ontogenetic and Sexual Variation in the Sagitta Otolith of Menticirrhus americanus (Teleostei; Sciaenidae) (Linnaeus, 1758) in a Subtropical Environment. Pap. Avulsos Zool. 2020, 60, 1–12. [Google Scholar] [CrossRef] [Green Version]
  18. O’Reilly, K.M.; Horn, M.H. Phenotypic Variation among Populations of Atherinops affinis (Atherinopsidae) with Insights from a Geometric Morphometric Analysis. J. Fish Biol. 2004, 64, 1117–1135. [Google Scholar] [CrossRef]
  19. Tombari, A.D.; Gosztonyi, A.E.; Echeverria, D.D.; Volpedo, A.V. Otolith and Vertebral Morphology of Marine Atherinid Species (Atheriniformes, Atherinopsidae) Coexisting in the Southwestern Atlantic Ocean. Ciencias Mar. 2010, 36, 213–223. [Google Scholar] [CrossRef]
  20. Lattuca, M.E.; Lozano, I.E.; Brown, D.R.; Renzi, M.; Luizon, C.A. Natural Growth, Otolith Shape and Diet Analyses of Odontesthes nigricans Richardson (Atherinopsidae) from Southern Patagonia. Estuar. Coast. Shelf Sci. 2015, 166, 105–114. [Google Scholar] [CrossRef]
  21. Thompson, G.A.; Volpedo, A.V. Diet Composition and Feeding Strategy of the New World Silverside Odontesthes argentinensis in a Temperate Coastal Area (South America). Mar. Coast. Fish. 2018, 10, 80–88. [Google Scholar] [CrossRef]
  22. Strüssmann, C.A.; Akaba, T.; Ijima, K.; Yamaguchi, K.; Yoshizaki, G.; Takashima, F. Spontaneous Hybridization in the Laboratory and Genetic Markers for the Identification of Hybrids between Two Atherinid Species, Odontesthes bonariensis (Valenciennes, 1835) and Patagonina hatcheri (Eigenmann, 1909). Aquac. Res. 1997, 28, 291–300. [Google Scholar] [CrossRef]
  23. Conte-Grand, C.; Sommer, J.; Ortí, G.; Cussac, V. Populations of Odontesthes (Teleostei: Atheriniformes) in the Andean Region of Southern South America: Body Shape and Hybrid Individuals. Neotrop. Ichthyol. 2015, 13, 137–150. [Google Scholar] [CrossRef] [Green Version]
  24. Colautti, D.C.; Miranda, L.; Gonzalez-Castro, M.; Villanova, V.; Strüssmann, C.A.; Mancini, M.; Maiztegui, T.; Berasain, G.; Hattori, R.; Grosman, F.; et al. Evidence of a Landlocked Reproducing Population of the Marine Pejerrey Odontesthes argentinensis (Actinopterygii; Atherinopsidae). J. Fish Biol. 2020, 96, 202–216. [Google Scholar] [CrossRef]
  25. Avigliano, E.; Miller, N.; Volpedo, A.V. Silversides (Odontesthes bonariensis) Reside within Freshwater and Estuarine Habitats, Not Marine Environments. Estuar. Coast. Shelf Sci. 2018, 205, 123–130. [Google Scholar] [CrossRef] [Green Version]
  26. Levy, E.; Canel, D.; Rossin, M.A.; Hernández-Orts, J.S.; González-Castro, M.; Timi, J.T. Parasites as Indicators of Fish Population Structure at Two Different Geographical Scales in Contrasting Coastal Environments of the South-Western Atlantic. Estuar. Coast. Shelf Sci. 2019, 229, 106400. [Google Scholar] [CrossRef]
  27. Dyer, B.S. Systematic Revision of the South American Silversides (Teleostei, Atheriniformes). Biocell 2006, 30, 69–88. [Google Scholar]
  28. Di Dario, F.; Macedo dos Santos, V.L.; Maia de Souza Pereira, M. Range Extension of Odontesthes argentinensis (Valenciennes, 1835) (Teleostei: Atherinopsidae) in the Southwestern Atlantic, with Additional Records in the Rio de Janeiro State, Brazil. J. Appl. Ichthyol. 2014, 30, 421–423. [Google Scholar] [CrossRef]
  29. Levy, E.; Canel, D.; Rossin, M.A.; González-Castro, M.; Timi, J.T. Parasite Assemblages as Indicators of an Incipient Speciation Process of Odontesthes argentinensis in an Estuarine Environment. Estuar. Coast. Shelf Sci. 2021, 250, 107168. [Google Scholar] [CrossRef]
  30. De Buen, F. Los Pejerreyes (Familia Atherinidae) En La Fauna Uruguaya, Con Descripción de Nuevas Especies. Bol. do Inst. Ocean. 1953, 4, 3–80. [Google Scholar] [CrossRef] [Green Version]
  31. Sampaio, L.A. Production of “Pejerrey” Odontesthes argentinensis Fingerlings: A Review of Current Techniques. Biocell 2006, 30, 121–123. [Google Scholar] [PubMed]
  32. Llompart, F.M.; Colautti, D.C.; Maiztegui, T.; Cruz-Jiménez, A.M.; Baigún, C.R.M. Biological Traits and Growth Patterns of Pejerrey Odontesthes argentinensis. J. Fish Biol. 2013, 82, 458–474. [Google Scholar] [CrossRef]
  33. Llompart, F.M.; Colautti, D.C.; Baigún, C.R.M. Conciliating Artisanal and Recreational Fisheries in Anegada Bay, Argentina. Fish. Res. 2017, 190, 140–149. [Google Scholar] [CrossRef]
  34. Guidi, C.; Baigún, C.R.M.; Ginter, L.G.; Soricetti, M.; Rivas, F.J.G.; Morawicki, S.; Quezada, F.; Bazzani, J.L.; Solimano, P.J. Characteristics, Preferences and Perceptions of Recreational Fishers in Northern Patagonia, Argentina. Reg. Stud. Mar. Sci. 2021, 45, 101828. [Google Scholar] [CrossRef]
  35. Llompart, F.M.; Colautti, D.C.; Baign, C.R.M. Assessment of a Major Shore-Based Marine Recreational Fishery in the Southwest Atlantic, Argentina. N. Z. J. Mar. Freshw. Res. 2012, 46, 57–70. [Google Scholar] [CrossRef]
  36. Tombari, A.D.; Volpedo, A.V.; Echeverria, D.D. Desarrollo de La Sagitta En Juveniles y Adultos de Odontesthes argentinensis (Valenciennes, 1835) y O. bonariensis (Valenciennes, 1835) de La Provincia de Buenos Aires, Argentina (Teleostei: Atheriniformes). Rev. Chil. Hist. Nat. 2005, 78, 623–633. [Google Scholar] [CrossRef] [Green Version]
  37. Biolé, F.G.; Callicó Fortunato, R.; Thompson, G.A.; Volpedo, A.V. Application of Otolith Morphometry for the Study of Ontogenetic Variations of Odontesthes argentinensis. Environ. Biol. Fishes 2019, 102, 1301–1310. [Google Scholar] [CrossRef]
  38. Kjerfve, B.; Perillo, G.M.E.; Gardner, L.R.; Rine, J.M.; Dias, G.T.M.; Mochel, F.R. Morphodynamics of Muddy Environments along the Atlantic Coasts of North and South America. In Muddy Coasts of the World: Processes, Deposits and Function; Healy, T., Wang, Y., Healy, J.A., Eds.; Elsevier: Amsterdam, The Netherlands, 2002. [Google Scholar]
  39. Acha, E.; Orduna, M.; Rodrigues, K.; Militelli, M.; Braverman, M. Caracterización de La Zona de “El Rincón” (Provincia de Buenos Aires) Como Área de Reproducción de Peces Costeros. Rev. Invest. Desarr. Pesq. 2012, 21, 31–43. [Google Scholar]
  40. Piola, A.R.; Rivas, A.L. Corrientes En La Plataforma Continental. El Mar Argentino y sus Recur. Pesq. 1997, 1, 119–132. [Google Scholar]
  41. Mancini, M.; Grosman, F.; Dyer, B.; García, G.; Ponti, O.; Sanzano, P.; Salinas, V. Pejerreyes Del Sur de América: Aportes Al Estado de Conocimiento Con Especial Referencia a Odontesthes Bonariensis; UniRío Editora: Río Cuarto, Argentina, 2016; ISBN 9789876881968. [Google Scholar]
  42. Libungan, L.A.; Pálsson, S. ShapeR: An R Package to Study Otolith Shape Variation among Fish Populations. PLoS ONE 2015, 10, e0121102. [Google Scholar] [CrossRef]
  43. John Haines, A.; Crampton, J.S. Improvements to the Method of Fourier Shape Analysis as Applied in Morphometric Studies. Palaeontology 2000, 43, 765–783. [Google Scholar] [CrossRef]
  44. Nason, G. Wavethresh: Wavelets Statistics and Transforms, R Package. 2016. Available online: https://CRAN.R-project.org/package=wavethresh (accessed on 25 December 2021).
  45. Longmore, C.; Fogarty, K.; Neat, F.; Brophy, D.; Trueman, C.; Milton, A.; Mariani, S. A Comparison of Otolith Microchemistry and Otolith Shape Analysis for the Study of Spatial Variation in a Deep-Sea Teleost, Coryphaenoides rupestris. Environ. Biol. Fishes 2010, 89, 591–605. [Google Scholar] [CrossRef]
  46. Agüera, A.; Brophy, D. Use of Saggital Otolith Shape Analysis to Discriminate Northeast Atlantic and Western Mediterranean Stocks of Atlantic Saury, Scomberesox saurus saurus (Walbaum). Fish. Res. 2011, 110, 465–471. [Google Scholar] [CrossRef]
  47. Warnes, G.R.; Bolker, B.; Bonebakker, L.; Gentleman, R.; Liaw, W.H.A.; Lumley, T.; Maechler, M.; Magnusson, A.; Moeller, S.; Schwartz, M.; et al. Gplots: Various R Programming Tools for Plotting Data. R Package Version 2.13.0. 2014. Available online: https://CRAN.R-project.org/package=gplots (accessed on 25 December 2021).
  48. Volpedo, A.V.; Vaz-dos-Santos, A.M. Métodos de Estudios Con Otolitos: Principios y Aplicaciones; INPA CONICET UBA: Ciudad Autónoma de Buenos Aires, Argentina, 2015. [Google Scholar]
  49. Tuset, V.M.; Lombarte, A.; Assis, C.A. Otolith Atlas for the Western Mediterranean, North and Central Eastern Atlantic. Sci. Mar. 2008, 72, 7–198. [Google Scholar] [CrossRef]
  50. Lleonart, J.; Salat, J.; Torres, G.J. Removing Allometric Effects of Body Size in Morphological Analysis. J. Theor. Biol. 2000, 205, 85–93. [Google Scholar] [CrossRef] [PubMed]
  51. Ripley, B.; Venables, B.; Bates, D.M.; Hornik, K.; Gebhardt, A.; Firth, D. Package ‘MASS’: Support Functions and Datasets for Venables and Ripley’s “Modern Applied Statistics with S”. 2021. Available online: https://CRAN.R-project.org/package=MASS (accessed on 23 November 2021).
  52. Neves, J.; Silva, A.A.; Moreno, A.; Veríssimo, A.; Santos, A.M.; Garrido, S. Population Structure of the European Sardine Sardina pilchardus from Atlantic and Mediterranean Waters Based on Otolith Shape Analysis. Fish. Res. 2021, 243, 106050. [Google Scholar] [CrossRef]
  53. Anderson, M.J. Permutational Multivariate Analysis of Variance (PERMANOVA). In Wiley StatsRef: Statistics Reference Online; Balakrishnan, N., Colton, T., Everitt, B., Piegorsch, W., Ruggeri, F., Teugels, J.L., Eds.; John Wiley & Sons, Ltd.: Hoboken, NJ, USA, 2017; pp. 1–15. ISBN 9781118445112. [Google Scholar]
  54. Oksanen, J.; Blanchet, F.G.; Kindt, R.; Legendre, P.; Minchin, P.; O’Hara, R.B. Vegan: Community Ecology Package, Version 2.0–7. R Package. 2021. Available online: https://CRAN.R-project.org/package=vegan (accessed on 25 December 2021).
  55. Peters, A.; Hothorn, T.; Ripley, B.D.; Therneau, T.; Atkinson, B. Ipred: Improved Predictors. R Package. 2021. Available online: https://CRAN.R-project.org/package=ipred (accessed on 25 December 2021).
  56. Donelson, J.M.; Sunday, J.M.; Figueira, W.F.; Gaitán-Espitia, J.D.; Hobday, A.J.; Johnson, C.R.; Leis, J.M.; Ling, S.D.; Marshall, D.; Pandolfi, J.M.; et al. Understanding Interactions between Plasticity, Adaptation and Range Shifts in Response to Marine Environmental Change. Philos. Trans. R. Soc. B Biol. Sci. 2019, 374, 20180186. [Google Scholar] [CrossRef] [Green Version]
  57. Callicó Fortunato, R.; Benedito Durà, V.; Volpedo, A.V. Otolith Morphometry and Microchemistry as Habitat Markers for Juvenile Mugil cephalus Linnaeus 1758 in Nursery Grounds in the Valencian Community, Spain. J. Appl. Ichthyol. 2017, 33, 163–167. [Google Scholar] [CrossRef]
  58. Callicó Fortunato, R.; González-Castro, M.; Reguera Galán, A.; García Alonso, I.; Kunert, C.; Benedito Durà, V.; Volpedo, A. Identification of Potential Fish Stocks and Lifetime Movement Patterns of Mugil liza Valenciennes 1836 in the Southwestern Atlantic Ocean. Fish. Res. 2017, 193, 164–172. [Google Scholar] [CrossRef]
  59. Thompson, G.; Callico Fortunato, R.; Chiesa, I.; Volpedo, A. Trophic Ecology of Mugil liza at the Southern Limit of Its Distribution (Buenos Aires, Argentina). Brazilian J. Oceanogr. 2015, 63, 271–278. [Google Scholar] [CrossRef]
  60. González-Castro, M.; Rosso, J.J.; Delpiani, S.M.; Mabragaña, E.; Díaz de Astarloa, J.M. Inferring Boundaries among Fish Species of the New World Silversides (Atherinopsidae; Genus Odontesthes): New Evidences of Incipient Speciation between Marine and Brackish Populations of Odontesthes argentinensis. Genetica 2019, 147, 217–229. [Google Scholar] [CrossRef] [PubMed]
  61. Di Giácomo, E.E.; Calvo, J.; Perier, M.R.; Morriconi, E. Spawning Aggregations of Merluccius hubbsi, in Patagonian Waters: Evidence for a Single Stock? Fish. Res. 1993, 16, 9–16. [Google Scholar] [CrossRef]
  62. Sardella, N.H.; Timi, J.T. Parasites of Argentine Hake in the Argentine Sea: Population and Infracommunity Structure as Evidence for Host Stock Discrimination. J. Fish Biol. 2004, 65, 1472–1488. [Google Scholar] [CrossRef]
  63. Deville, D.; Sanchez, G.; Barahona, S.; Yamashiro, C.; Oré-Chávez, D.; Bazán, R.Q.; Umino, T. Morphological Variation of the Sea Silverside Odontesthes regia in Regions with Dissimilar Upwelling Intensity along the Humboldt Current System. Ocean Sci. J. 2020, 55, 33–48. [Google Scholar] [CrossRef]
  64. D’Anatro, A.; González-Bergonzoni, I.; Vidal, N.; Tesitore, G.; de Mello, F.T. Confirmation of the Occurrence of Odontesthes argentinensis (Valenciennes, 1835) (Atheriniformes, Atherinopsidae) in the Rio Uruguay. Panam. J. Aquat. Sci. 2020, 15, 100–105. [Google Scholar]
  65. Hughes, L.C.; Cardoso, Y.P.; Sommer, J.A.; Cifuentes, R.; Cuello, M.; Somoza, G.M.; González-Castro, M.; Malabarba, L.R.; Cussac, V.; Habit, E.M.; et al. Biogeography, Habitat Transitions and Hybridization in a Radiation of South American Silverside Fishes Revealed by Mitochondrial and Genomic RAD Data. Mol. Ecol. 2020, 29, 738–751. [Google Scholar] [CrossRef]
  66. Heras, S.; Roldán, M.I. Phylogenetic Inference in Odontesthes and Atherina (Teleostei: Atheriniformes) with Insights into Ecological Adaptation. C. R.—Biol. 2011, 334, 273–281. [Google Scholar] [CrossRef]
  67. Volpedo, A.V.; Miretzky, P.; Fernández-Cirelli, A. Stocks Pesqueros de Cynoscion guatucupa y Micropogonias furnieri (Pisces, Sciaenidae ), En La Costa Atlántica de Sudamérica: Comparación Entre Métodos de Identificación. Mem. De La Fund. La Salle De Cienc. Nat. 2007, 2007, 115–130. [Google Scholar]
  68. Tuset, V.M.; Farré, M.; Otero-Ferrer, J.L.; Vilar, A.; Morales-Nin, B.; Lombarte, A. Testing Otolith Morphology for Measuring Marine Fish Biodiversity. Mar. Freshw. Res. 2016, 67, 1037–1048. [Google Scholar] [CrossRef] [Green Version]
  69. Tuset, V.M.; Otero-Ferrer, J.L.; Siliprandi, C.; Manjabacas, A.; Marti-Puig, P.; Lombarte, A. Paradox of Otolith Shape Indices: Routine but Overestimated Use. Can. J. Fish. Aquat. Sci. 2021, 78, 681–692. [Google Scholar] [CrossRef]
  70. Volpedo, A.; Echeverría, D.D. Ecomorphological Patterns of the Sagitta in Fish on the Continental Shelf off Argentine. Fish. Res. 2003, 60, 551–560. [Google Scholar] [CrossRef]
  71. De Carvalho, B.M.; Spach, H.L.; Vaz-Dos-Santos, A.M.; Volpedo, A.V. Otolith Shape Index: Is It a Tool for Trophic Ecology Studies? J. Mar. Biol. Assoc. U. K. 2019, 99, 1675–1682. [Google Scholar] [CrossRef]
  72. Assis, I.O.; da Silva, V.E.L.; Souto-Vieira, D.; Lozano, A.P.; Volpedo, A.V.; Fabré, N.N. Ecomorphological Patterns in Otoliths of Tropical Fishes: Assessing Trophic Groups and Depth Strata Preference by Shape. Environ. Biol. Fishes 2020, 103, 349–361. [Google Scholar] [CrossRef]
  73. de Carvalho, B.M.; Vaz-dos-Santos, A.M.; Spach, H.L.; Volpedo, A.V. Ontogenetic Development of the Sagittal Otolith of the Anchovy, Anchoa tricolor, in a Subtropical Estuary. Sci. Mar. 2015, 79, 409–418. [Google Scholar] [CrossRef] [Green Version]
  74. Almeida, P.R.C.; Monteiro-Neto, C.; Tubino, R.A.; Costa, M.R. Variations in the Shape of the Sagitta Otolith of Coryphaena hippurus (Actinopterygii: Coryphaenidae) in a Resurgence Area on the Southwest Coast of the Atlantic Ocean. Iheringia—Ser. Zool. 2020, 110, 1–11. [Google Scholar] [CrossRef]
  75. Kikuchi, E.; García, S.; da Costa, P.A.S.; Cardoso, L.G.; Haimovici, M. Discrimination of Red Porgy Pagrus pagrus (Sparidae) Potential Stocks in the South-Western Atlantic by Otolith Shape Analysis. J. Fish Biol. 2021, 98, 548–556. [Google Scholar] [CrossRef] [PubMed]
  76. Sadighzadeh, Z.; Tuset, V.M.; Valinassab, T.; Dadpour, M.R.; Lombarte, A. Comparison of Different Otolith Shape Descriptors and Morphometrics for the Identification of Closely Related Species of Lutjanus spp. from the Persian Gulf. Mar. Biol. Res. 2012, 8, 802–814. [Google Scholar] [CrossRef]
  77. Soeth, M.; Spach, H.L.; Daros, F.A.; Adelir-Alves, J.; de Almeida, A.C.O.; Correia, A.T. Stock Structure of Atlantic Spadefish Chaetodipterus faber from Southwest Atlantic Ocean Inferred from Otolith Elemental and Shape Signatures. Fish. Res. 2019, 211, 81–90. [Google Scholar] [CrossRef]
  78. Colautti, D.; Suquele, P.; Calvo, S. La Pesca Artesanal En La Zona Sur de La Bahía Anegada, Provincia de Buenos Aires; Ministerio de Asuntos Agrarios Dirección Provincial de Pesca: La Plata, Argentina, 2009. [Google Scholar]
  79. Venerus, L.A.; Cedrola, P.V. Review of Marine Recreational Fisheries Regulations in Argentina. Mar. Policy 2017, 81, 202–210. [Google Scholar] [CrossRef]
Figure 1. Sampling sites. MDQ: Mar del Plata; QQN: Quequén; CLM: Claromecó; MTH: Monte Hermoso; LCH: La Chiquita; SBL: San Blas; ELC: El Cóndor; SAE: San Antonio Este; PLB: Puerto Lobos.
Fishes 07 00155 g001
Figure 2. Left sagitta otolith of Odontesthes argentinensis. Features variables. AR: Anti rostrum. R: Rostrum.
Fishes 07 00155 g002
Figure 3. Mean shape of otolith shapes of silverside from nine localities. MDQ: Mar del Plata; QQN: Quequén; CLM: Claromecó; MTH: Monte Hermoso; LCH: La Chiquita; SBL: San Blas; ELC: El Cóndor; SAE: San Antonio Este; PLB: Puerto Lobos.
Fishes 07 00155 g003
Figure 4. Mean and Standard deviation (SD) of the wavelet coefficients representing shape for all combined otoliths and the proportion of variance among silverside of different localities or interclass correlation (ICC, black solid line). The central axis shows the angle in degrees (°) based on polar coordinates where the centroid of the otolith is the central point of the polar coordinates.
Fishes 07 00155 g004
Figure 5. Linear Discriminant Analysis (a) Morphometric indices (MI); (b) Wavelets coefficients (WC); (c) Fourier descriptors (FD); (d) MI + WC + FD. MDQ: Mar del Plata; QQN: Quequén; CLM: Claromecó; MTH: Monte Hermoso; LCH: La Chiquita; SBL: San Blas; ELC: El Cóndor; SAE: San Antonio Este; PLB: Puerto Lobos. The centroid of each study area is shown as a larger symbol.
Fishes 07 00155 g005
Table 1. Sampling locations ordered from north to south. Mean values of Total Length (TL) and Standard Length (STL) ± Standard Deviation. N: sample number.
Localities LatitudeLongitudeNTL (mm)STL (mm)
Mar Del PlataMDQ38°02′57°31′57209 ± 30175 ± 25
QuequénQQN38°24′58°40′75200 ± 30168 ± 25
ClaromecóCLM38°51′60°04′47208 ± 67178 ± 57
Monte HermosoMTH38°59′61°15′39226 ± 68191 ± 60
La ChiquitaLCH39°35′62°05′13255 ± 99214 ± 85
San BlasSBL40°31′62°16′64269 ± 45227 ± 36
El CóndorELC41°00′62°48′20317 ± 53267 ± 49
San Antonio EsteSAE40°50′64°50′30280 ± 46245 ± 41
Puerto LobosPLB41°51′65°02′19334 ± 17285 ± 14
Table 2. Median values ± standard deviation of shape indices by locality, (ANOVA statistical analysis: F [statistic] and p [significance]). MDQ: Mar del Plata; QQN: Quequén; CLM: Claromecó; MTH: Monte Hermoso; LCH: La Chiquita; SBL: San Blas; ELC: El Cóndor; SAE: San Antonio Este; PLB: Puerto Lobos.
Shape IndicesMDQQQNCLMMTHLCHSBLELCSAEPLBFp
Circularity15.06 ± 0.6 a,b14.73 ± 0.47 a14.81 ± 1.1 a,b15.31 ± 0.89 b,c14.88 ± 1.02 b,c,d15.82 ± 0.67 c,d,e16.42 ± 1.04 f16.19 ± 0.88 d,e,f16.49 ± 0.6 e,f23.69<0.001 **
Rectangularity0.73 ± 0.02 a0.74 ± 0.01 a0.74 ± 0.02 a0.73 ± 0.02 a0.73 ± 0.01 a0.74 ± 0.02 a0.72 ± 0.03 a0.74 ± 0.02 a0.74 ± 0.02 a1.930.0544
Aspect ratio0.63 ± 0.04 a0.64 ± 0.03 a0.63 ± 0.05 a0.62 ± 0.05 a0.65 ± 0.08 a,b0.59 ± 0.04 b0.56 ± 0.06 b,c0.53 ± 0.05 b0.53 ± 0.03 c20.41<0.001 **
Roundness0.59 ± 0.04 a0.59 ± 0.03 a0.6 ± 0.05 a0.58 ± 0.05 a0.61 ± 0.08 a,b0.55 ± 0.04 b0.52 ± 0.05 b,c0.53 ± 0.04 b0.5 ± 0.03 c20.06<0.001 **
** Significant p value. Different letters show significant differences (p < 0.05).
Table 3. Cross-classification table of Linear Discriminant Analysis. MDQ: Mar del Plata; QQN: Quequén; CLM: Claromecó; MTH: Monte Hermoso; LCH: La Chiquita; SBL: San Blas; ELC: El Cóndor; SAE: San Antonio Este; PLB: Puerto Lobos. ** Significant p value.
LocalitiesMDQQQNCLMMTHLCHSBLELCSAEPLBError (%)Total Error (%)
(a) Morphometric Indices (MI) (Wilks’ λ = 0.652, p < 0.001 **)
MDQ14191044041175
QQN9421840110044
CLM3231020042379
MTH67861153285
LCH22300040210072.25
SBL737837137989
ELC21011272465
SAE32212283790
PLB000021401237
(b) Wavelet coefficients (WC) (Wilks’ λ = 0.059, p < 0.001 **)
MDQ453121401021
QQN367210200011
CLM024110102013
MTH002341101013
LCH0001120000817.86
SBL620444323033
ELC101011151025
SAE201031023023
PLB00000000190
(c) Fourier descriptors (FD) (Wilks’ λ = 0.016, p < 0.001 **)
MDQ470141202018
QQN063034401016
CLM023812202019
MTH230264301033
LCH0000912103125.27
SBL1121433346048
ELC001012160020
SAE032202021030
PLB00000000190
(d) MI + FD + WC (Wilks’ λ = 0.002, p < 0.001 **)
MDQ55000010104
QQN07200030004
CLM00450010104
MTH10036020008
LCH0000112000157.42
SBL200215702011
ELC000004160020
SAE001102026013
PLB00000000190
Table 4. Overall PERMANOVA comparison among groups for combined silverside otolith shape indices, Fourier descriptors and Wavelet coefficients, including pairwise comparisons between groups. MDQ: Mar del Plata; QQN: Quequén; CLM: Claromecó; MTH: Monte Hermoso; LCH: La Chiquita; SBL: San Blas; ELC: El Cóndor; SAE: San Antonio Este; PLB: Puerto Lobos. ** Significant p value.
VariablesLocalities GroupsF. Modelp Value
Combined
Morphometric indices, Fourier descriptors and
Wavelet coefficients
MDQ, QQN, CLM vs. MTH, LCH, SBL, ELC, SAE, PLB36.76<0.0001 **
MDQ, QQN, CLM vs. MTH, LCH, SBL, ELC, SAE vs. PLB28.54<0.0001 **
MDQ, QQN, CLM vs. MTH, LCH, SBL, ELC, SAE29.57<0.0001 **
MDQ, QQN, CLM vs. PLB44.95<0.0001 **
MTH, LCH, SBL, ELC, SAE vs. PLB15.28<0.0001 **
Publisher’s Note: MDPI stays neutral with regard to jurisdictional claims in published maps and institutional affiliations.

