1. Introduction
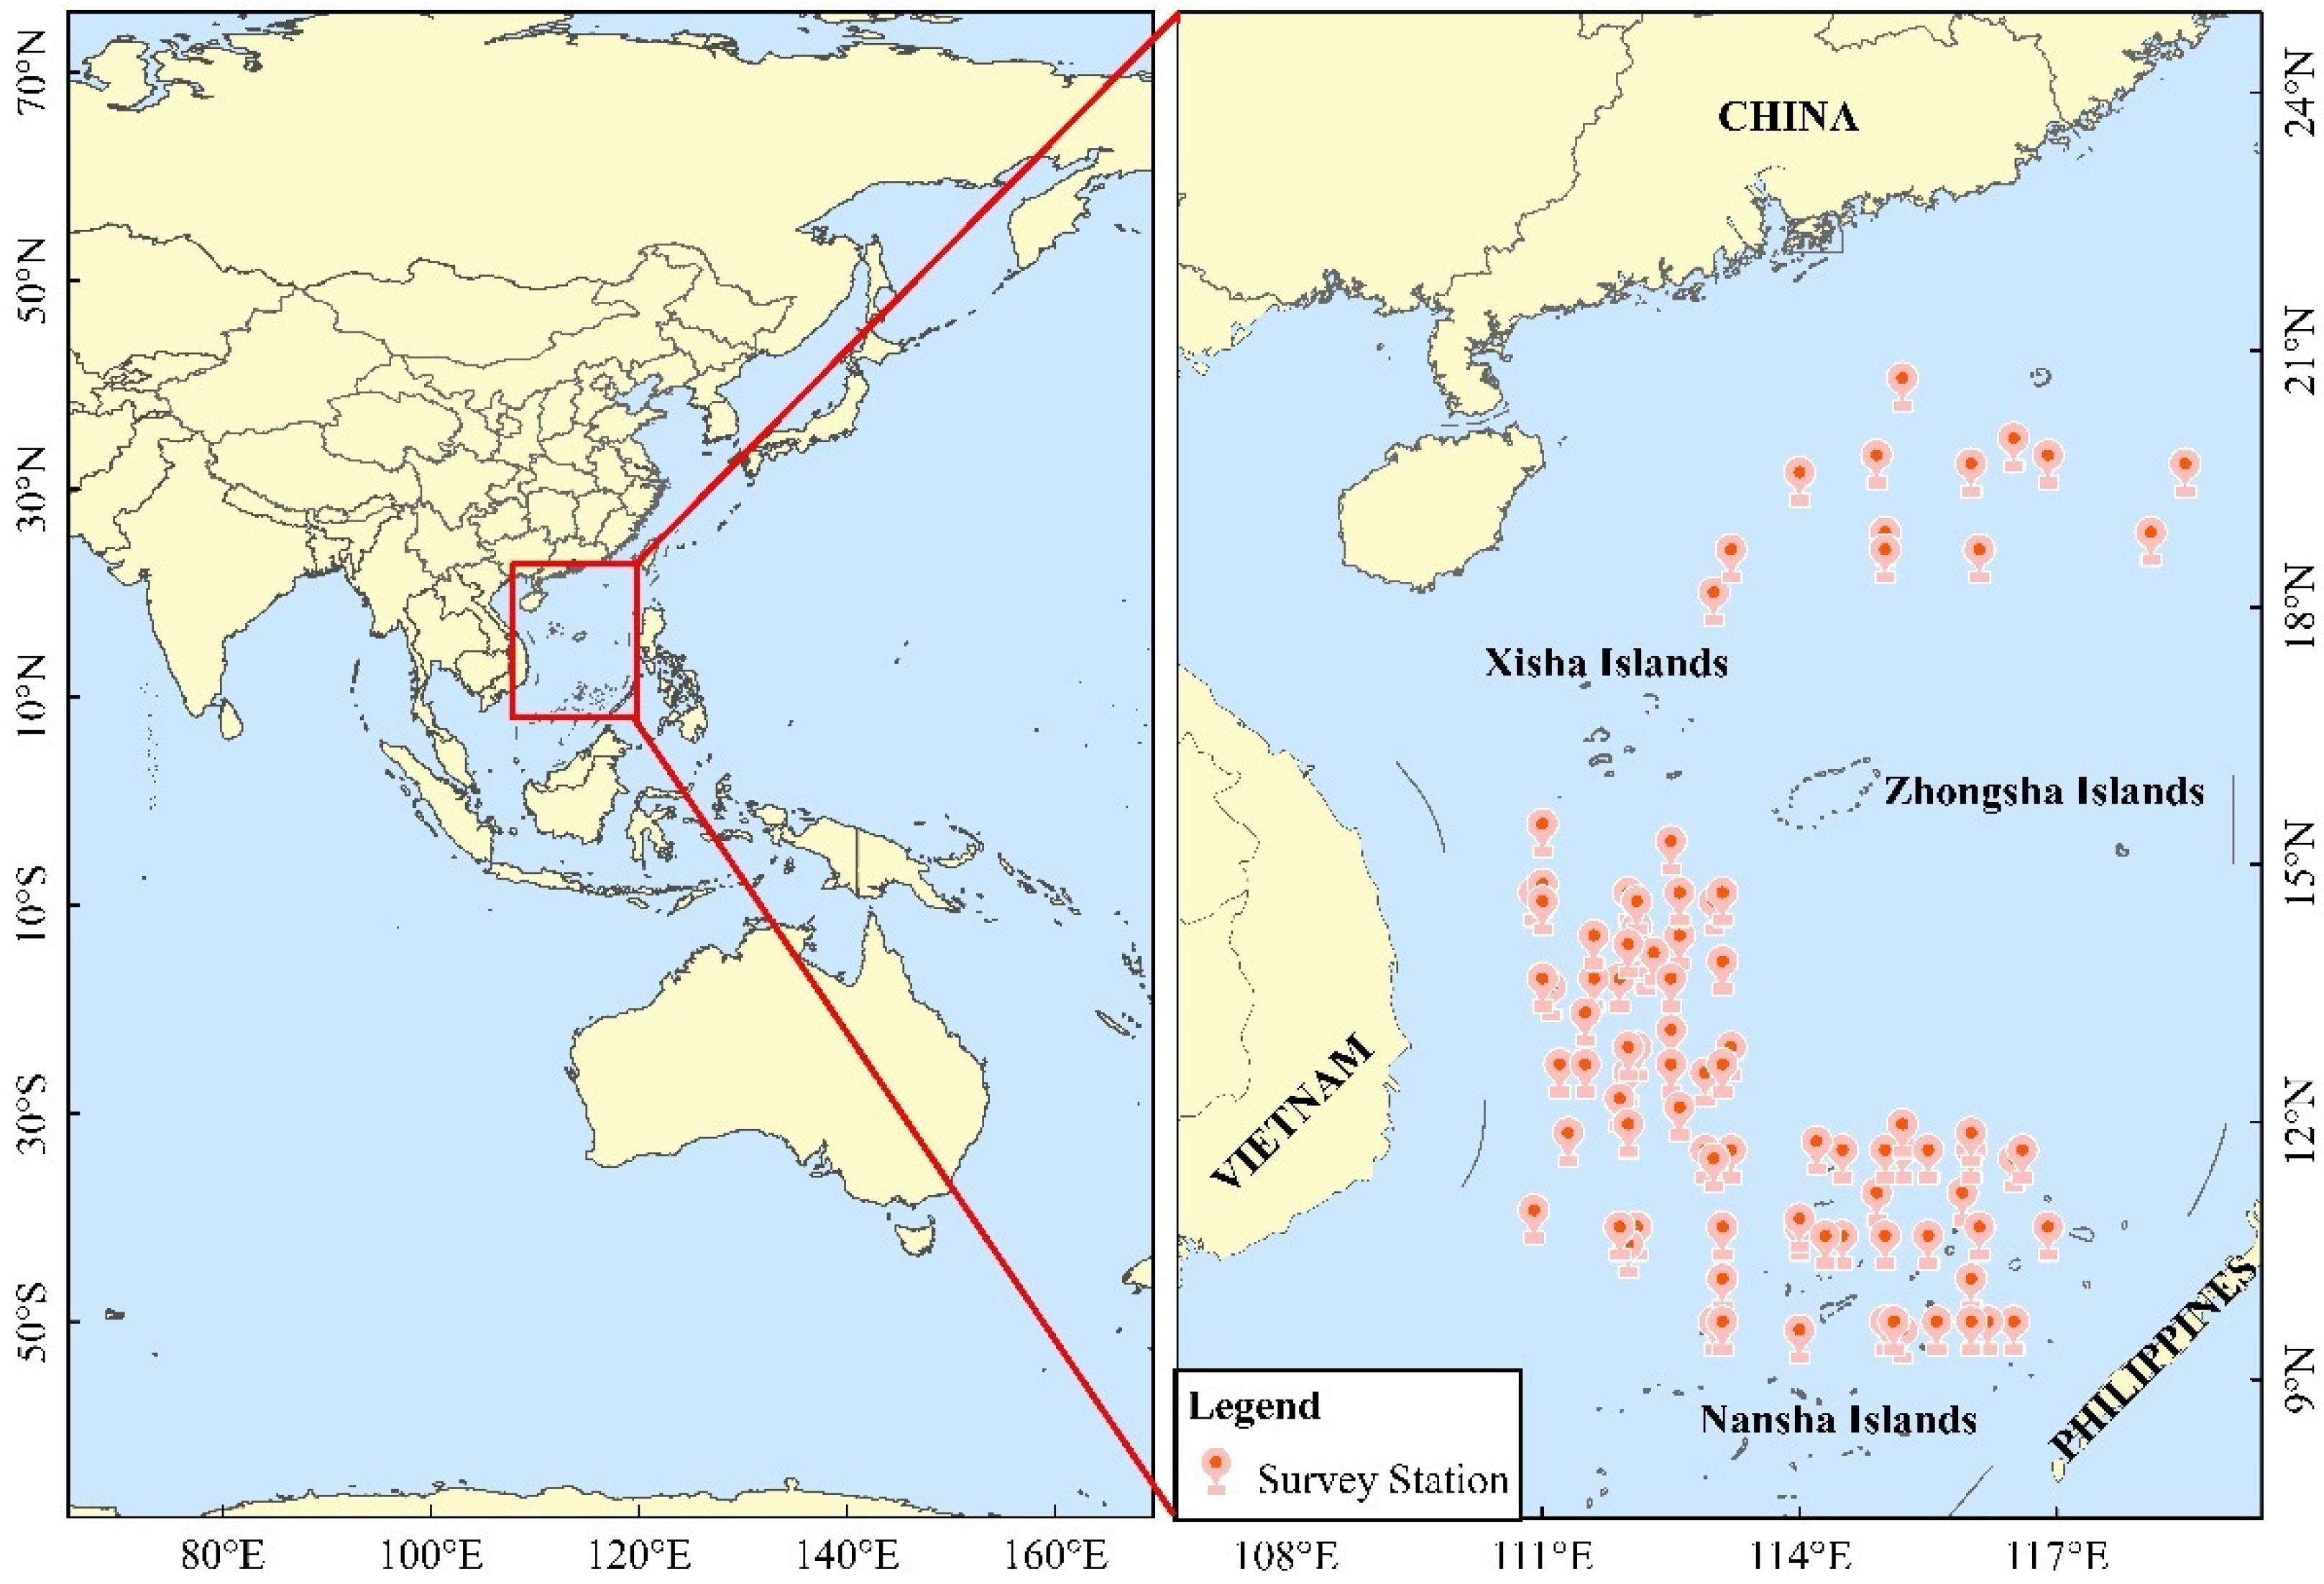
Fishing grounds in the South China Sea (SCS) are diverse, including waters on the continental shelf, slope, in Beibu Gulf, and around coral reefs northeast of Hainan Island. Because of its unique geographical location, the fauna of the SCS has a tropical marine biota and high species diversity [
1]. Most fishery resources of economic value in the SCS have been exploited, with resources in many traditional fishing grounds having declined [
2]. In response to overfishing and coastal ecosystem degradation, the Chinese government introduced a series of measures aimed to rebuild marine fisheries, including input and output controls, technical limits such as gear specifications and restrictions, spatial and temporal closures, and other ecological instruments [
3].
Auxis thazard (Thunnidae) is a warm-water tuna that is widely distributed in the tropical and subtropical seas, including the East China seas and South China seas [
4]; it is harvested using a wide variety of gear, including small-scale artisanal fisheries, light falling-net, and purse seine. In the SCS, the density of
A. thazard in spring and summer is higher than that in autumn, and exhibits a patchy spatial distribution. According to the latest research, there are about 850,000 tonnes of small tuna species in the SCS, of which the
A. thazard accounts for about 30% [
5]. The development of a new, offshore tuna fishery in the SCS could relieve some fishing pressure from inshore waters.
Because habitats represent a collection of environmental conditions that are suitable for species’ survival, the marine environment factor can be used to speculate habitat distribution [
6]. Understanding the temporal and spatial dynamics of fish habitat can greatly improve ecosystem-based fisheries management, and an understanding of the distribution of fish resources [
7]. The habitat suitability index (HSI) model is a framework model that describes the quality of fish and wildlife habitats [
8]. It provides one method for linking the abundance of wild animals with habitat conditions [
9] and can be used in combination with geographic information system (GIS) technology to create maps significant for research on fish habitat [
10]. Because the HSI performs well and its predictions in ecological research are reliable [
11,
12], it has been widely used to predict the spatial and temporal distribution of suitable fish habitats, such as for the identification of environmental conditions that affect the distribution of Chilean jack mackerel (
Trachurus murphyi), and to quantify suitable habitat area (using SST, SSH and Chl-a) for this species in the southeast Pacific [
13], and to detect habitat of yellowfin tuna in the western and central Pacific Ocean based on remote sensing data [
9].
Relationships between habitat and the marine environment are complex. With increased fishing intensity, and changes in the ecological environment and global climate, the resource amount and spatial distribution of many marine species have recently changed, profoundly affecting their habitats and ecosystems [
14]. To develop a sustainable fishery for
A. thazard it is important to identify relationships between the marine environment and this species’ catch, and to screen the main environmental factors that affect the distribution of resources required by this species.
Generalized additive models (GAM) provide a flexible method to explore nonlinear relationships between fishery resources and the marine environment. They can be used for different species and different sea areas, and when combined with a variety of environmental factors, can better reveal relationships between the environment and the spatial and temporal distribution of fishery resources [
15,
16,
17,
18,
19,
20]. Using GAM, SST was better than the other environmental factors (SSHA and chlorophyll-a concentration) as an oceanographic predictor to explore the relationship of environmental parameters of
Bigeye Tuna in the eastern Indian Ocean off Java [
21]. For
Thunnus atlanticus in the Gulf of Mexico, the most influential oceanographic conditions were salinity, temperature and sea surface height [
22].
While the morphology, biology, spatial and temporal distribution of fishing grounds, population structure, and stock estimates of
A. thazard have been investigated [
23,
24,
25,
26]. In this study, we use GAMs to analyze environmental factors associated with the spatial and temporal distribution of
A. thazard in the SCS during spring and summer, and construct an integrated HSI model based on these environmental factors. Our objectives are to explore the relationship between
A. thazard and its environment, and to identify the main temporal and spatial distribution characteristics of habitat suitable for it, to provide a scientific basis for rational development and management of regional
A. thazard resources. In the SCS, the fishing periods of
A. thazard are especially common from spring to autumn, spring is the breeding season for
A. thazard, studying the spawning habitat of
A. thazard can help to understand the distribution of this species’ larval and juvenile and its relationship to the environment [
26]. Since 1999, China has implemented the summer fishing moratorium from May to August each year, which prohibits fishing to operate except for fishing gear. Therefore, both main fishing methods for
A. thazard (light falling-net and purse seine) are banned. During the summer fishing moratorium, decreased fishing intensity reduces human impacts on habitat distribution. So, we select the spring-summer period for the analyses.
4. Discussion
March–May (spring) is the breeding date of
A. thazard [
25,
39,
40,
41]. The effect of water temperature on fish is especially obvious during pre-oviposition and oviposition periods. Generally speaking, suitable temperature ranges for spawning are narrower than those for survival, with temperatures below or above these ranges limiting gonad development or maturation [
42]. Rising water temperatures during spring would theoretically reduce the reproductive capacity of
A. thazard in southern areas. Changed currents and high nutrient loadings in more northern waters might explain the migration of
A. thazard to them because of their increased suitability for larval and juvenile growth [
43]. During this time the southwest monsoon drives surface waters rich in nutrients and plankton northeast to the continental shelf and slope, providing suitable conditions for
A. thazard larval growth and development [
44,
45].
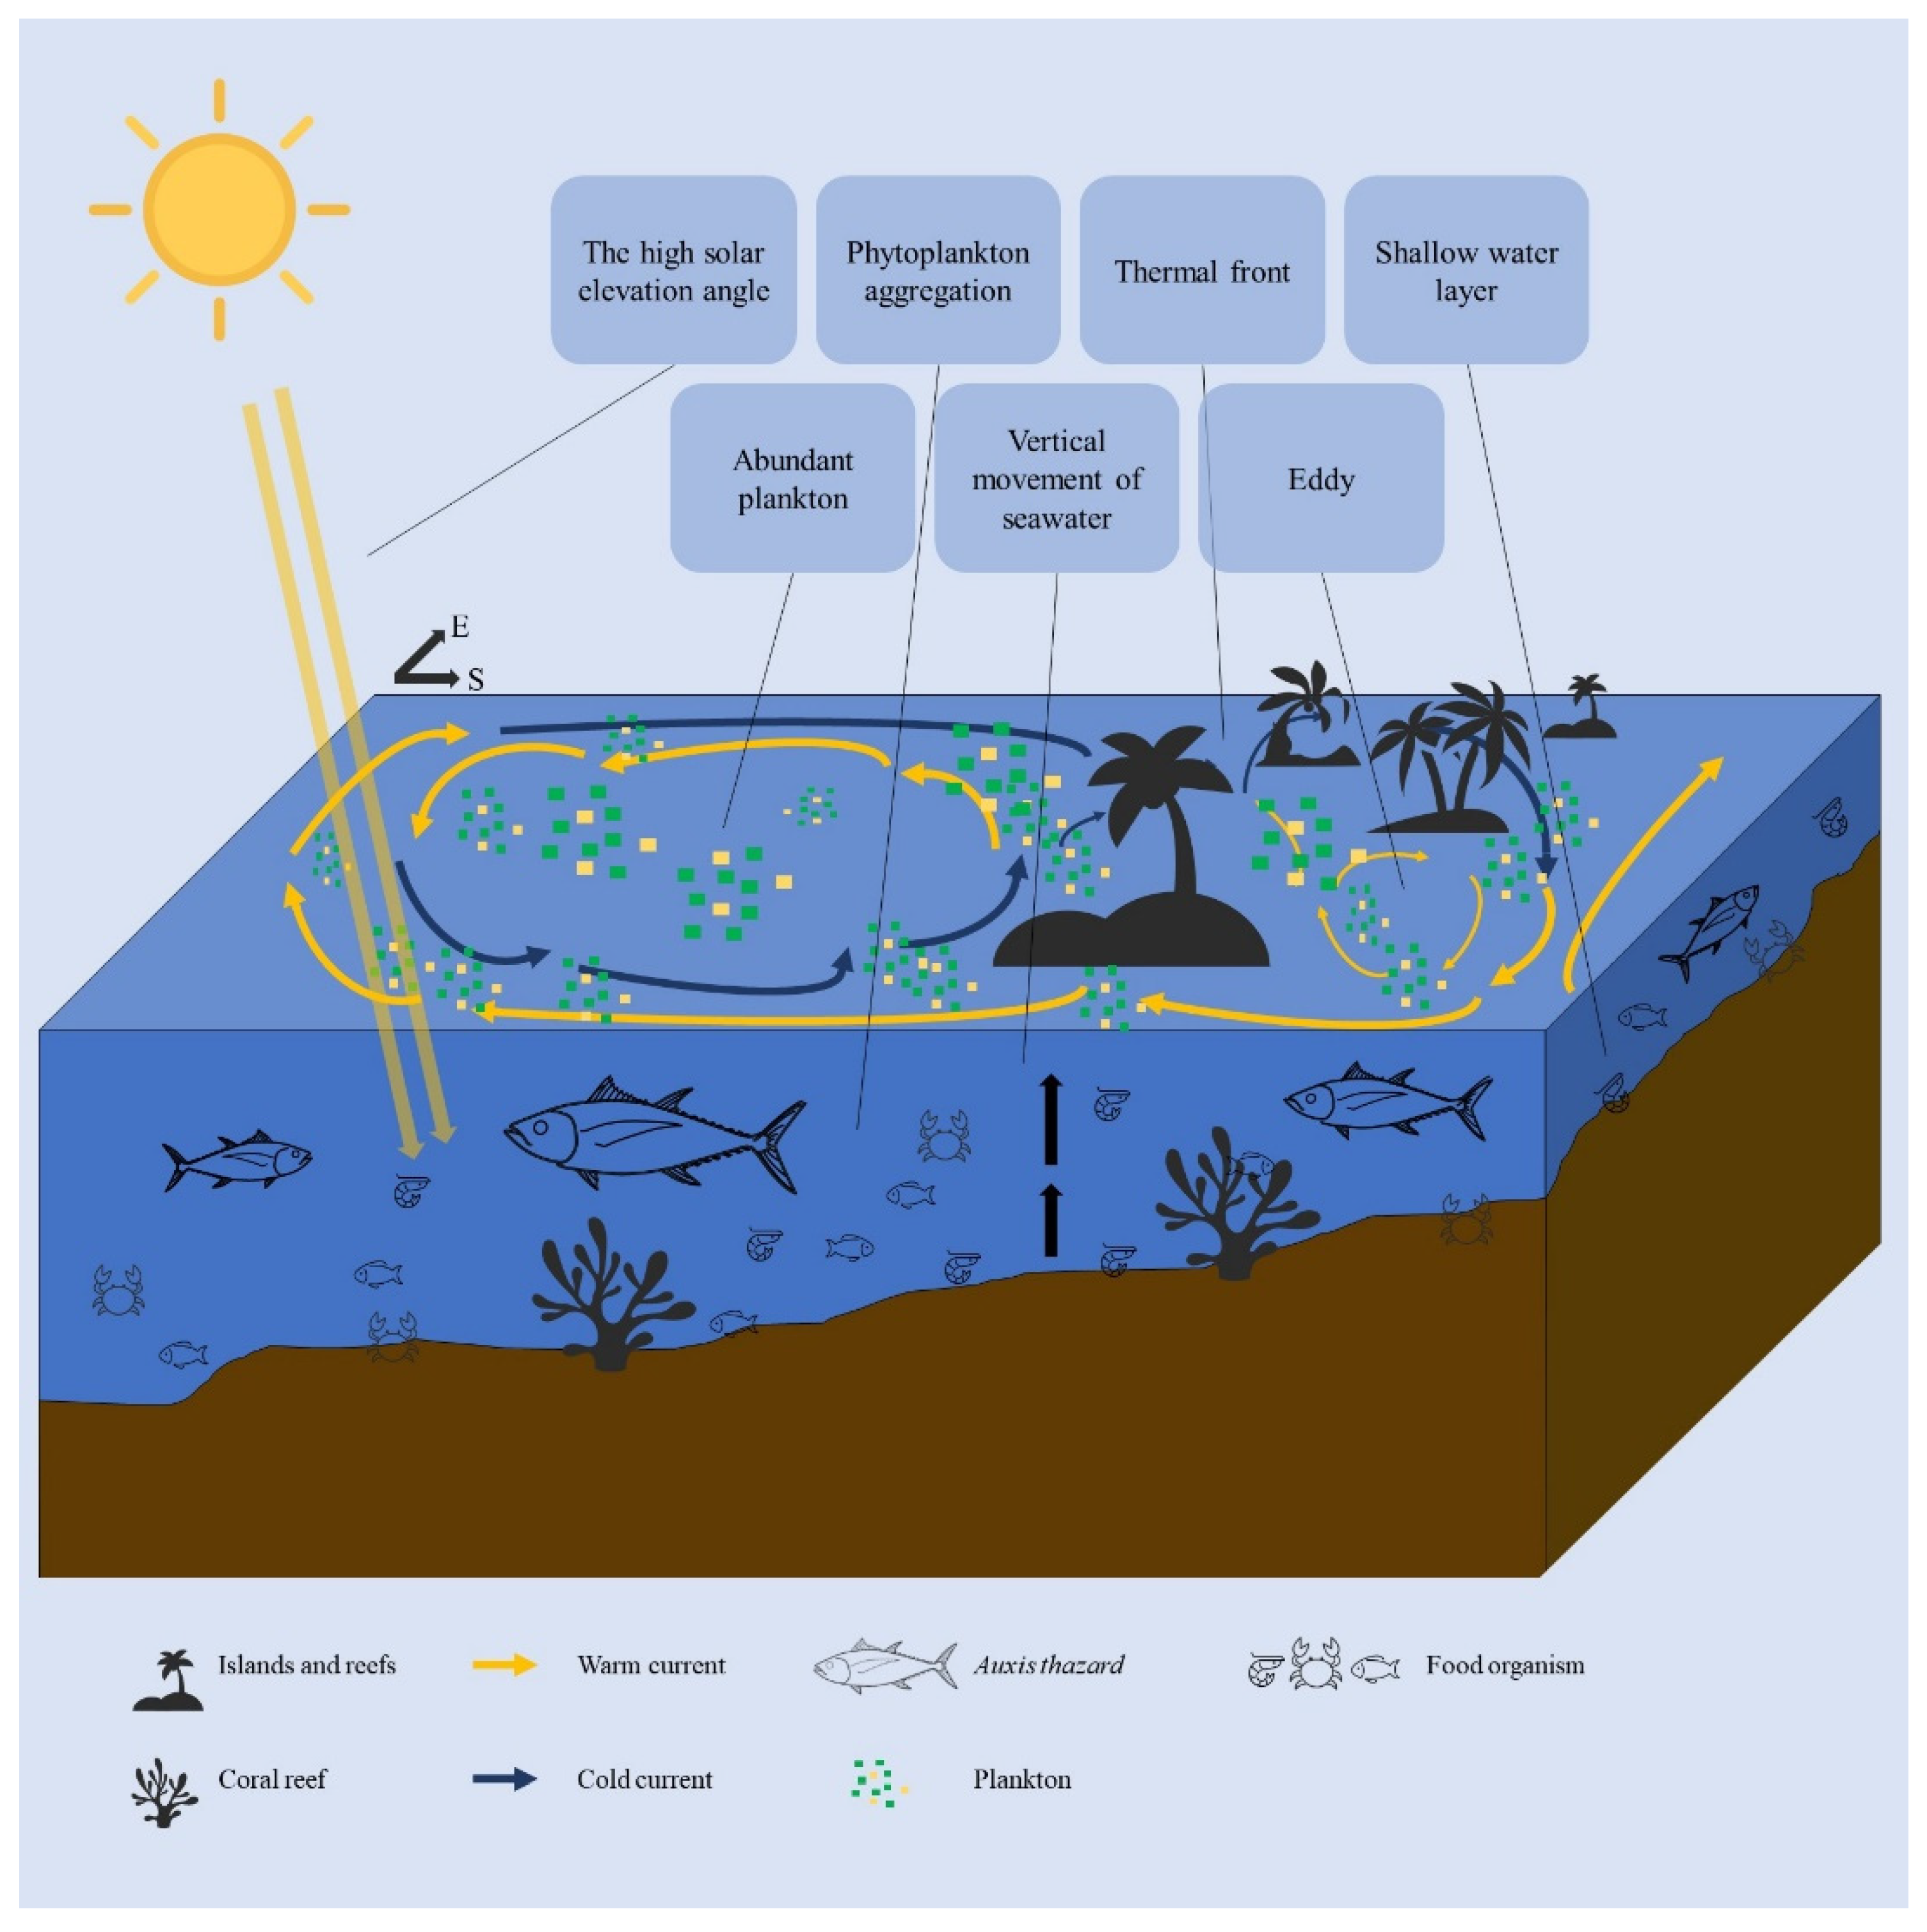
From August–September (summer), the size of the
A. thazard population experiencing spawning migration and reproduction increases rapidly, and larva and juveniles drifted to each distribution area with the current and monsoon [
45]. Adult fish migrate to areas with abundant food and gain conditions [
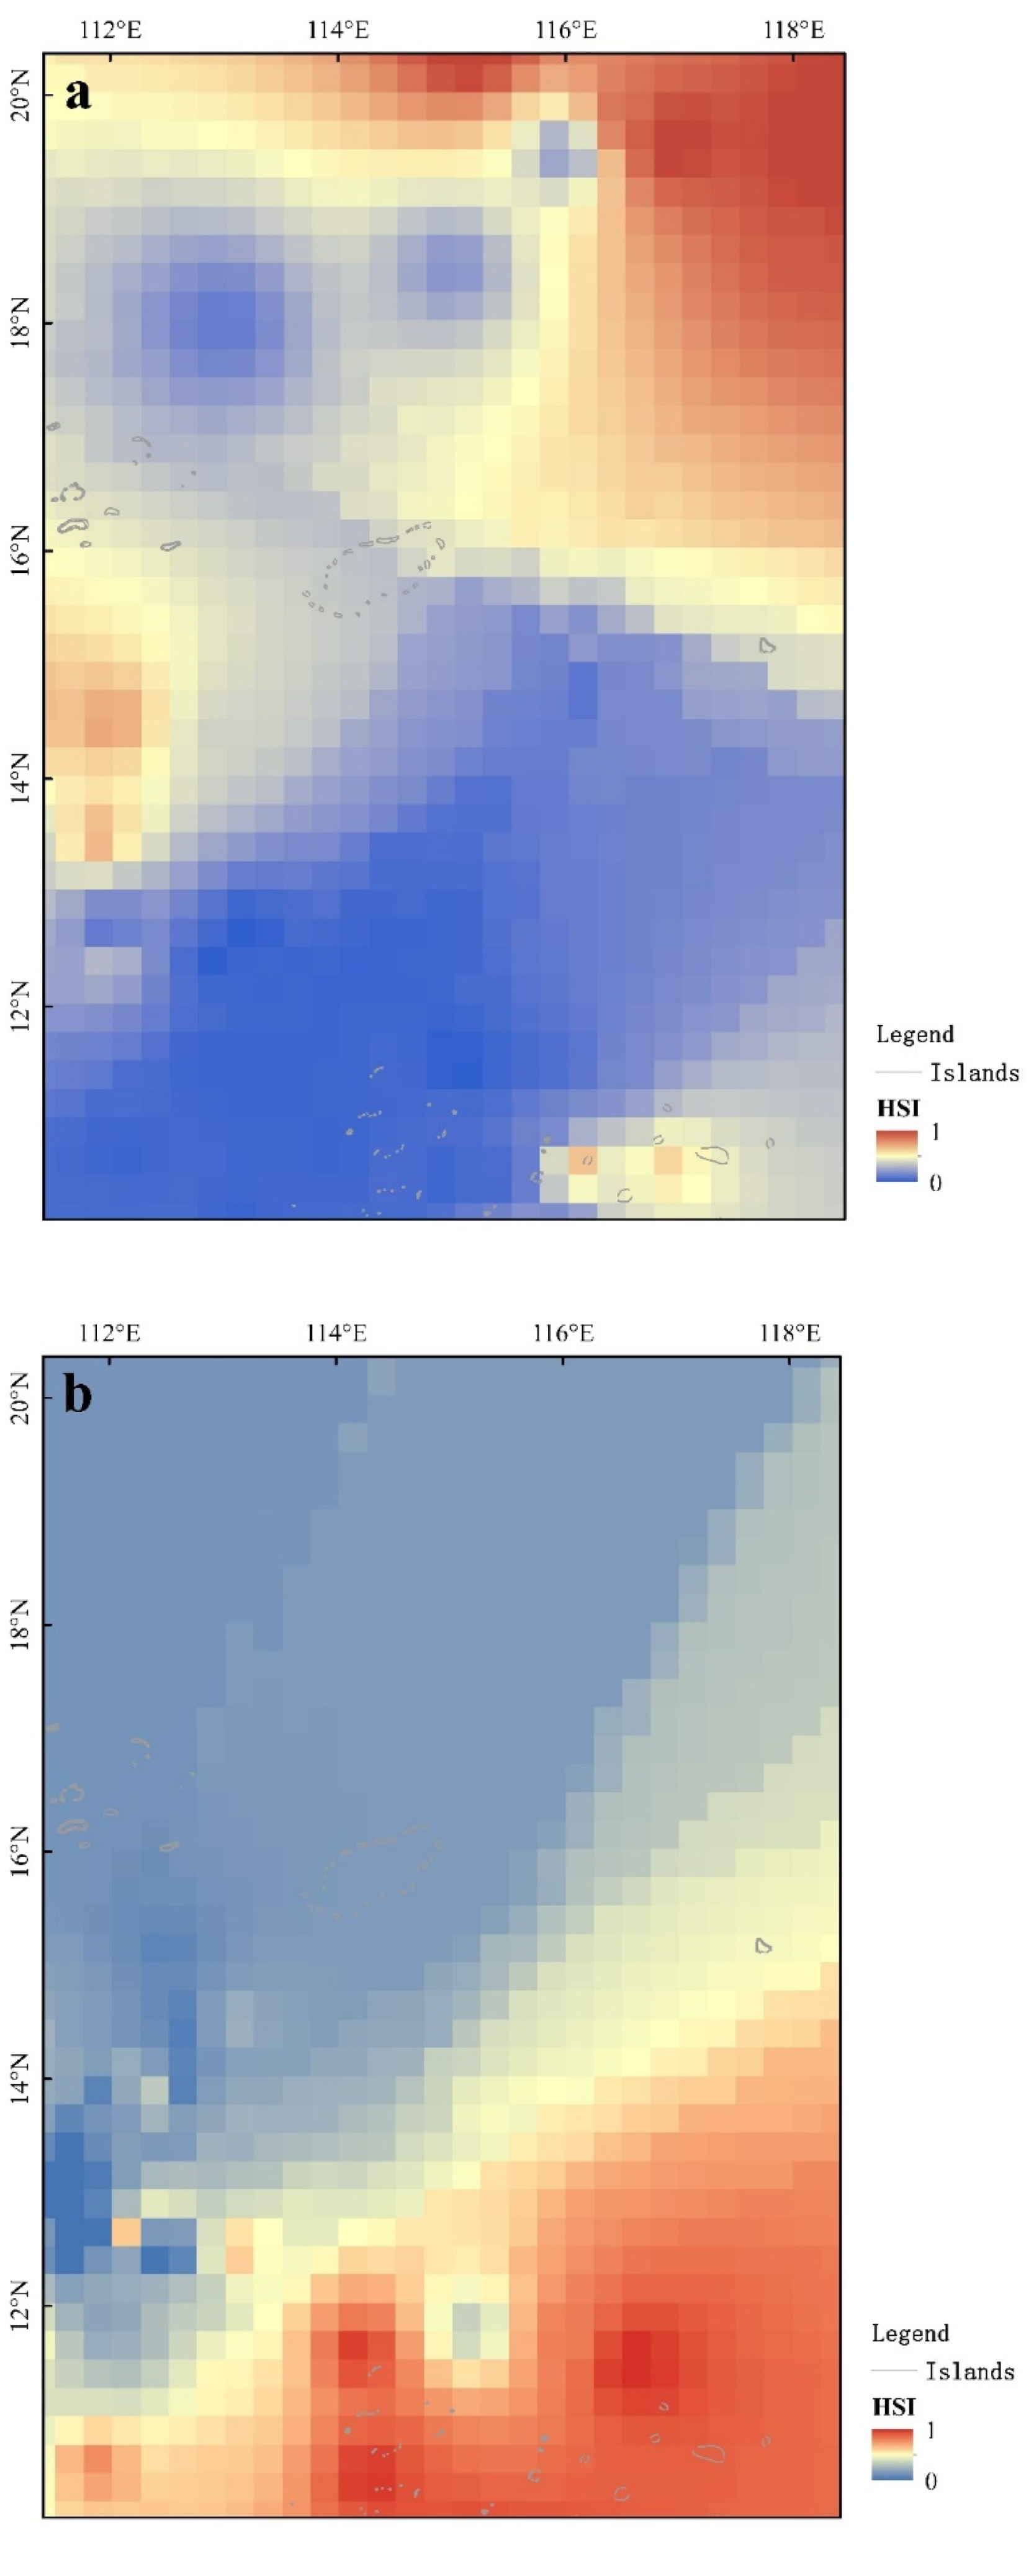
40]. Suitable habitat for
A. thazard occurs mostly near the Nansha Islands from August to September (summer) (
Figure 5). In the shallow waters of Nansha Islands, where the sun is high at noon, daylight hours are long, and water temperatures are high. Water currents in the SCS are complex from August to September. There are many islands and reefs around the Nansha Islands, and the water flow is affected by topographical obstacles. The Nansha Islands are located in the confluence of different flow systems and water masses, with the flow around the Nansha Islands also affected by terrain, creating many eddies [
46,
47]. The eddy tends to cause strong vertical movements of seawater, resulting in the bottom water surging upwards and the surface water sinking downwards. Movements of seawater can promote the mixing of seawater and bring high-nutrient subsurface water to the surface layer, which can boost plankton growth and increase the aggregation of prey organisms [
48]. Thus, the Nansha Islands area is the important habitat of
A. thazard (
Figure 7).
An accurate and precise species abundance index (AI) is generally considered to be most important for fisheries forecasting and stock assessment, and represents the most important input for a fishery model. Catch AI, CPUE AI, and Effort AI are common indicators of resource abundance when building fishery models [
49,
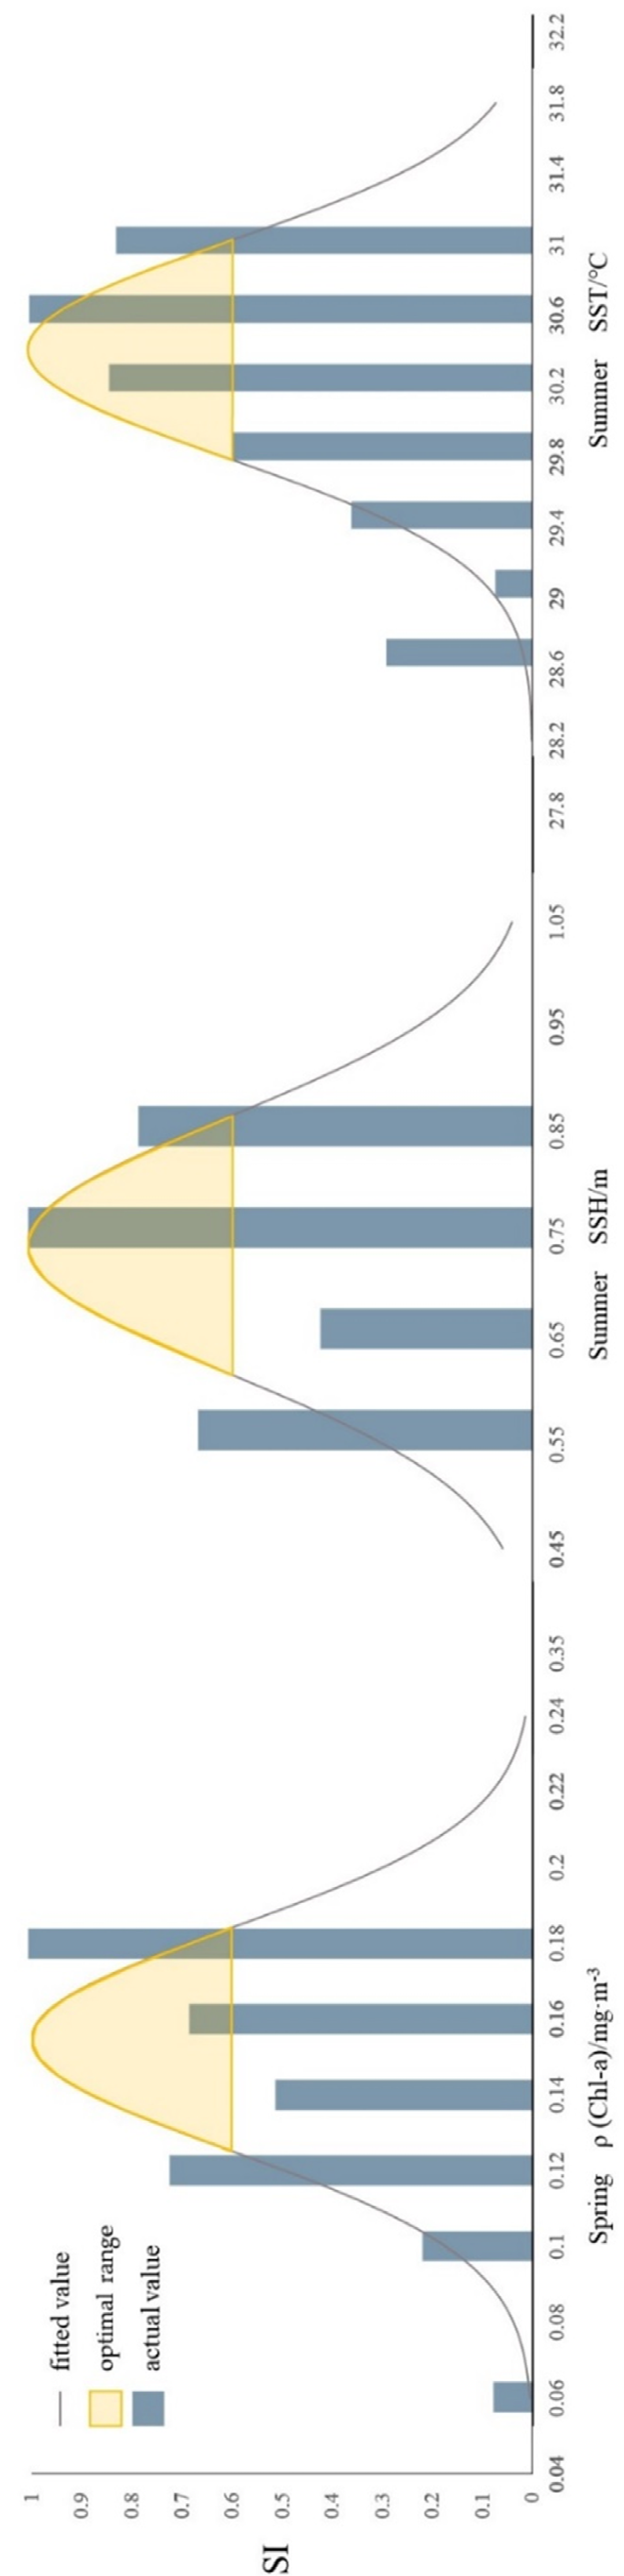
50]. We use Catch AI to construct an HSI model. From the SI curve, we determine that catch data are closely related to environmental conditions. High catch data indicate that
A. thazard is concentrated within a region, indicating that environmental conditions are conducive to its survival. Another important reason to use these catch data is that they were obtained during scientific investigation rather than from commercial fisheries. Not only do catch levels not affect fishing behavior, but fishery data are collected using standard gear and protocols over a long time period, at defined spatial and/or temporal scales. Thus, these data theoretically provide an unbiased estimate of fish population parameters [
51]. In a study on the neon flying squid
Ommastrephes bartramii, fishery models based on three AIs were compared, and results showed that for both simulated and real datasets, Catch AI was more accurate, consistent, and had better spatial representational ability at all spatial scales when compared with CPUE AI and Effort AI [
52]. Accordingly, Catch AI-based fishery models are important tools for assessing the impacts of environmental change on marine species habitat, and provide a scientific basis for resource management.
Obvious seasonal and spatial variations exist in environmental conditions and habitat patterns for
A. thazard. Favorable environmental conditions play an important role in regulating the range and distribution of suitable habitats. In fact, for habitats, environmental factors affecting habitat distribution of different species, regions, and seasons all differ [
53]. When modeling fisheries, the fewer environmental variables used the better. Therefore, choosing fewer, more appropriate environmental variables can avoid overfitting and improve model interpretation. Common methods to statistically screen variables include stepwise regression (forward, backward, and forward–backward hybrid methods) and complete subset regression. In stepwise regression, each iteration can only follow the direction of the previous iteration [
54]. However, complete subset regression can fit the possible combination models of all variables, and select the optimal model with variable combinations according to R-squared, Mallows’ Cp, Adjusted R-squared, AIC (Akaike Information Criterion), or other standards [
55]. For accurate prediction of habitat distribution, the selection of appropriate environmental factors is important. For example, through stepwise regression, the most important environmental factors affecting the distribution of bigeye tuna (
Thunnus obesus) in southern Java–Bali waters were SST, SSC, and SSHD [
56], but off western Guangdong, water depth had the greatest impact on the distribution of Japanese scad
Decapterus maruadsi [
38]. Although variable screening through stepwise regression can establish a good model, it cannot guarantee that the constructed model is the best, because not every possible model is evaluated. To overcome this problem, we use complete subset regression to screen variables. Compared with stepwise regression, complete subset regression is computationally more complex, but it ensures that the selected combination of variables is optimal. According to Mallows’ Cp and Adjusted R-squared, we selected the best model, environmental factors were statistically (objectively) screened, and we obtained a simple and effective model.
Statistically optimal combination of catch variables and significant environmental variables can be obtained through full subset regression methods. However, this does not mean that variables that are not screened out have no effect on habitat. For example, some studies showed that MLD had an important effect on tuna habitat distribution [
57]. In our study, the environmental data were all derived from satellite remote sensing, which is the secondary product of remote sensing data such as remote sensing images and radar data, and has certain limitations. Water depth, water turbidity, clouds, and reanalysis models will all affect the quality of secondary product, which in turn will affect the results of variable screening and model construction [
58]. Compared with traditional walk-around sampling and monitoring, remote sensing satellite have many irreplaceable advantages in constructing habitat models, such as quick access of information, consecutive data, and ability to cover large areas. Our study area is mainly located in the sea beyond the 200 m depth, where the water is relatively high-transparent and has relatively little influence on the inversion results of satellite remote sensing, enabling it to construct a credible habitat model.


 ,
, 


