Article

Using Merged Pre-Fishery Abundance as a Parameter Evaluating the Status of Atlantic Salmon and Anadromous Brown Trout Populations: A Norwegian Case Study

by
Anders Lamberg
1 and
Albert Kjartansson D. Imsland
2,3,*
1
Skandinavisk Naturovervåking, Ranheimsvegen 281, 7055 Ranheim, Norway
2
Akvaplan-niva Iceland Office, Akralind 4, 201 Kópavogur, Iceland
3
Department of Biological Sciences, University of Bergen, High Technology Centre, 5020 Bergen, Norway
*
Author to whom correspondence should be addressed.
Fishes 2022, 7(5), 264; https://doi.org/10.3390/fishes7050264
Submission received: 3 September 2022 / Revised: 25 September 2022 / Accepted: 26 September 2022 / Published: 28 September 2022
(This article belongs to the Section Sustainable Aquaculture)

Abstract

:
Methods used to monitor variation in population sizes in both Atlantic salmon and anadromous brown trout (sea trout) have been widely used in Norway the last 20 years. However, a national management regime, based on population data, has only been established for one of the two species, the Atlantic salmon. One prerequisite for using this “one species” model is that there is negligible interspecific competition between salmon and trout in the rivers. This may, however, be an oversimplification of the real situation. The pre-fishery abundance (PFA), monitored with combination of underwater video systems, snorkelling counts, and catch statistics will, in most rivers, include both salmon and Sea Trout. In the present study, we estimated a total PFA for rivers, or groups of rivers, in eight regions in Norway in 2019. The total size of each river system was measured by abiotic factors such as river area, river length, annual mean water flow, and size of precipitation field; additionally, one biotic factor, smolt age, was used to standardise PFA data across regions. A comparison shows that the standardised total PFA of salmon and trout varies across regions where the highest estimated PFA was four times higher than the lowest. Compared to the traditional one-species approach, the merged PFA data show a different population status in the eight regions. The difference in the two approaches was mainly linked to the variation in size in anadromous brown trout populations. Merging data from salmon and trout populations in defined regions may be a better input in a management model than the current model used by the Norwegian Scientific Committee for Salmon Management (VRL).

1. Introduction

Anadromous brown trout (Salmo trutta L., Sea Trout is the common name usually applied to anadromous forms of brown trout) and Atlantic salmon (Salmo salar L.) migrate between freshwater and marine environments. To survive, thrive, and reproduce, their habitats must meet several physical, chemical, and biological requirements [1]. Changes in both the freshwater environment [2,3] and the marine environment, either due to natural causes or human activities [4,5], may affect salmonid populations. The impact on wild salmonid populations due to human activities has received significant attention over recent decades, and several impact factors are well documented [6,7,8]. Atlantic salmon has, throughout its distribution area, been in a general decline in terms of reduced productivity, both in freshwater and the marine environment [8,9,10]. Since the early 1990s, the farming of Atlantic salmon has intensified, leading to the establishment of net pens that are distributed throughout the Norwegian fjords and coast. Concurrently, wild Atlantic salmon and brown trout populations experienced a general decline from the late 1980s, according to catch statistics in Norway [11]. However, from 2007 to 2019, the estimated pre-fishery abundance (i.e., the numbers of fish stock (here, salmon) alive prior to any fisheries, PFA) [12] and spawning populations—measured mainly through catch statistics—shows increasing Atlantic salmon populations [11]. The situation for the trout is still unclear. In the marine phase, salmon farming has an impact on both wild anadromous populations, particularly through infection by the salmon louse [7,13,14]. The impact level depends on several factors, such as the density of salmon farms, water temperature, migration routes, and duration of migration in the fjord. If the anadromous brown trout can be seen as a proxy for the severity of the lice situation [15] in the fjord system, then one would expect an increased population growth if the lice situation were to improve. Measuring population size variation is, therefore, important.
The most useful population measure is not necessarily the number of spawning fish, but rather the PFA. Through the last 30 years there has been a variation in the number of caught anadromous salmonids from year to year. In the same period limitations on catches have been introduced. The active use of a spawning target (ST, number of spawned eggs per area of riverbed) as a management tool for Atlantic salmon was stepped up from 2009 in Norway [8]. It has always been a challenge using catch statistics as a measurement of spawning populations’ size, since catch rate and fishing intensity are often unknown variables. On the other hand, the increasing use of video surveillance, traps, and snorkelling counts are used to estimate both the PFA and spawning populations, which have increased precision in the estimates. A comparison of population status between periods is, therefore, not straight forward. There is also a variation in population development between regions in Norway. Using estimates of the PFA and spawning populations to measure anthropogenic factors affecting wild fish to be able to solve problems and introduce measures to create effective management strategies is therefore challenging. Another challenge is how to define a population. In the spawning target model, presently used in managing Atlantic salmon populations in Norway, one important assumption in the model is that a salmon population is specific for one river. However, recent surveillance data obtained by our research group indicate that this is not always correct [16,17]. Atlantic salmon individuals starting their life in one river can, after sea sojourn and maturation, spawn in a different river. In particular, this may hold for individuals growing up to smolt stage in small rivers [18,19]. This phenomenon is even more pronounced in anadromous brown trout [20,21]. In the present study, we suggest merging population data from several rivers within a region as a better way of describing wild population development in that area.
Finally, there is a question of what a sustainable population size is. If mitigations can lead to increasing the size of populations, how is it possible to define when we have reached acceptable levels? For Atlantic salmon, the Norwegian government has decided to use the spawning target as one qualifying parameter [8]. Genetic integrity is another and harvesting potential is a third. One problem with the spawning population size is that the Atlantic salmon and anadromous brown trout are living in the same or in overlapping areas [15]. There is an unknown component of competition between the two species [22], which is not directly considered in the spawning target models. Physical environmental factors can also favour one or the other of the two, and these factors may vary over time. To bypass this obstacle, we suggest merging data from the two species and measure total production as one number. The third factor to consider when trying to establish what is “a sufficient number” of returning salmon and trout to a river, is that both species (especially trout), have a relatively high age at maturity [2–3 summers at sea], [23]. Additionally, both have few large eggs and show, to some extent, parental care via protecting eggs by burying them in the river gravel. They also often reproduce in more than one season. Such populations, when not harvested and not affected by other anthropogenic factors, will most likely grow to a far higher population size than that experienced in Norway in the last century, where practically no population in Norway has been unaffected by harvesting [8].
Anadromous brown trout perform marine migrations of variable durations, with migrations being generally shorter in the north than in the south [19,24]. Some fish return to fresh water in autumn following only a few summer months at sea and continue to spend their subsequent summers at sea and winters in fresh water. Some individuals may remain at sea during the following winter also and stay at sea until they mature and then return to fresh water to spawn [25]. In northern Norway, anadromous brown trout usually spend one to three summer months at sea to feed [24]. Maturity usually occurs after two to four marine migrations [26]. In this study, we collected data from eight river regions from several areas of Norway, where the southernmost is Bjerkreimselva (58.6° N) and the northernmost is Målselva (69.0° N). In all eight regions, sea trout overwinter in fresh water. It is impossible to prove that some individuals cannot stay in the sea in winter, but the stable numbers of sea trout inflow each year in each region indicate that sea trout stay in fresh water during winter. Additionally, those who take a pause year in spawning [27] can stay in fresh water. The Atlantic salmon leave the rivers as first-time migrants (smolt) during late spring in this study. From April in the south to June in the North; they return to fresh water after one year (one-sea-winter salmon) or after two to four years (multi-sea-winter salmon). All returning salmon are mature and will try to spawn in fresh water. Some will even migrate to sea after the spawning and then return as repeat spawners [28].
By use of data from underwater video surveillance systems monitoring river PFA, snorkelling surveys of spawning populations, and catch statistics in 27 rivers located to eight different small coastal regions in Norway in 2019, we have compared the total merged PFA for salmon and trout among regions. The combined use of hydrogeographic information and the average smolt age of multiple river systems in order to standardise the merged PFA of competing species in a stock assessment framework—is an important first step towards establishing a method for measuring the effects of anthropogenic factors, in general, and to salmon farming activity in the fjords, in particular.

2. Materials and Methods
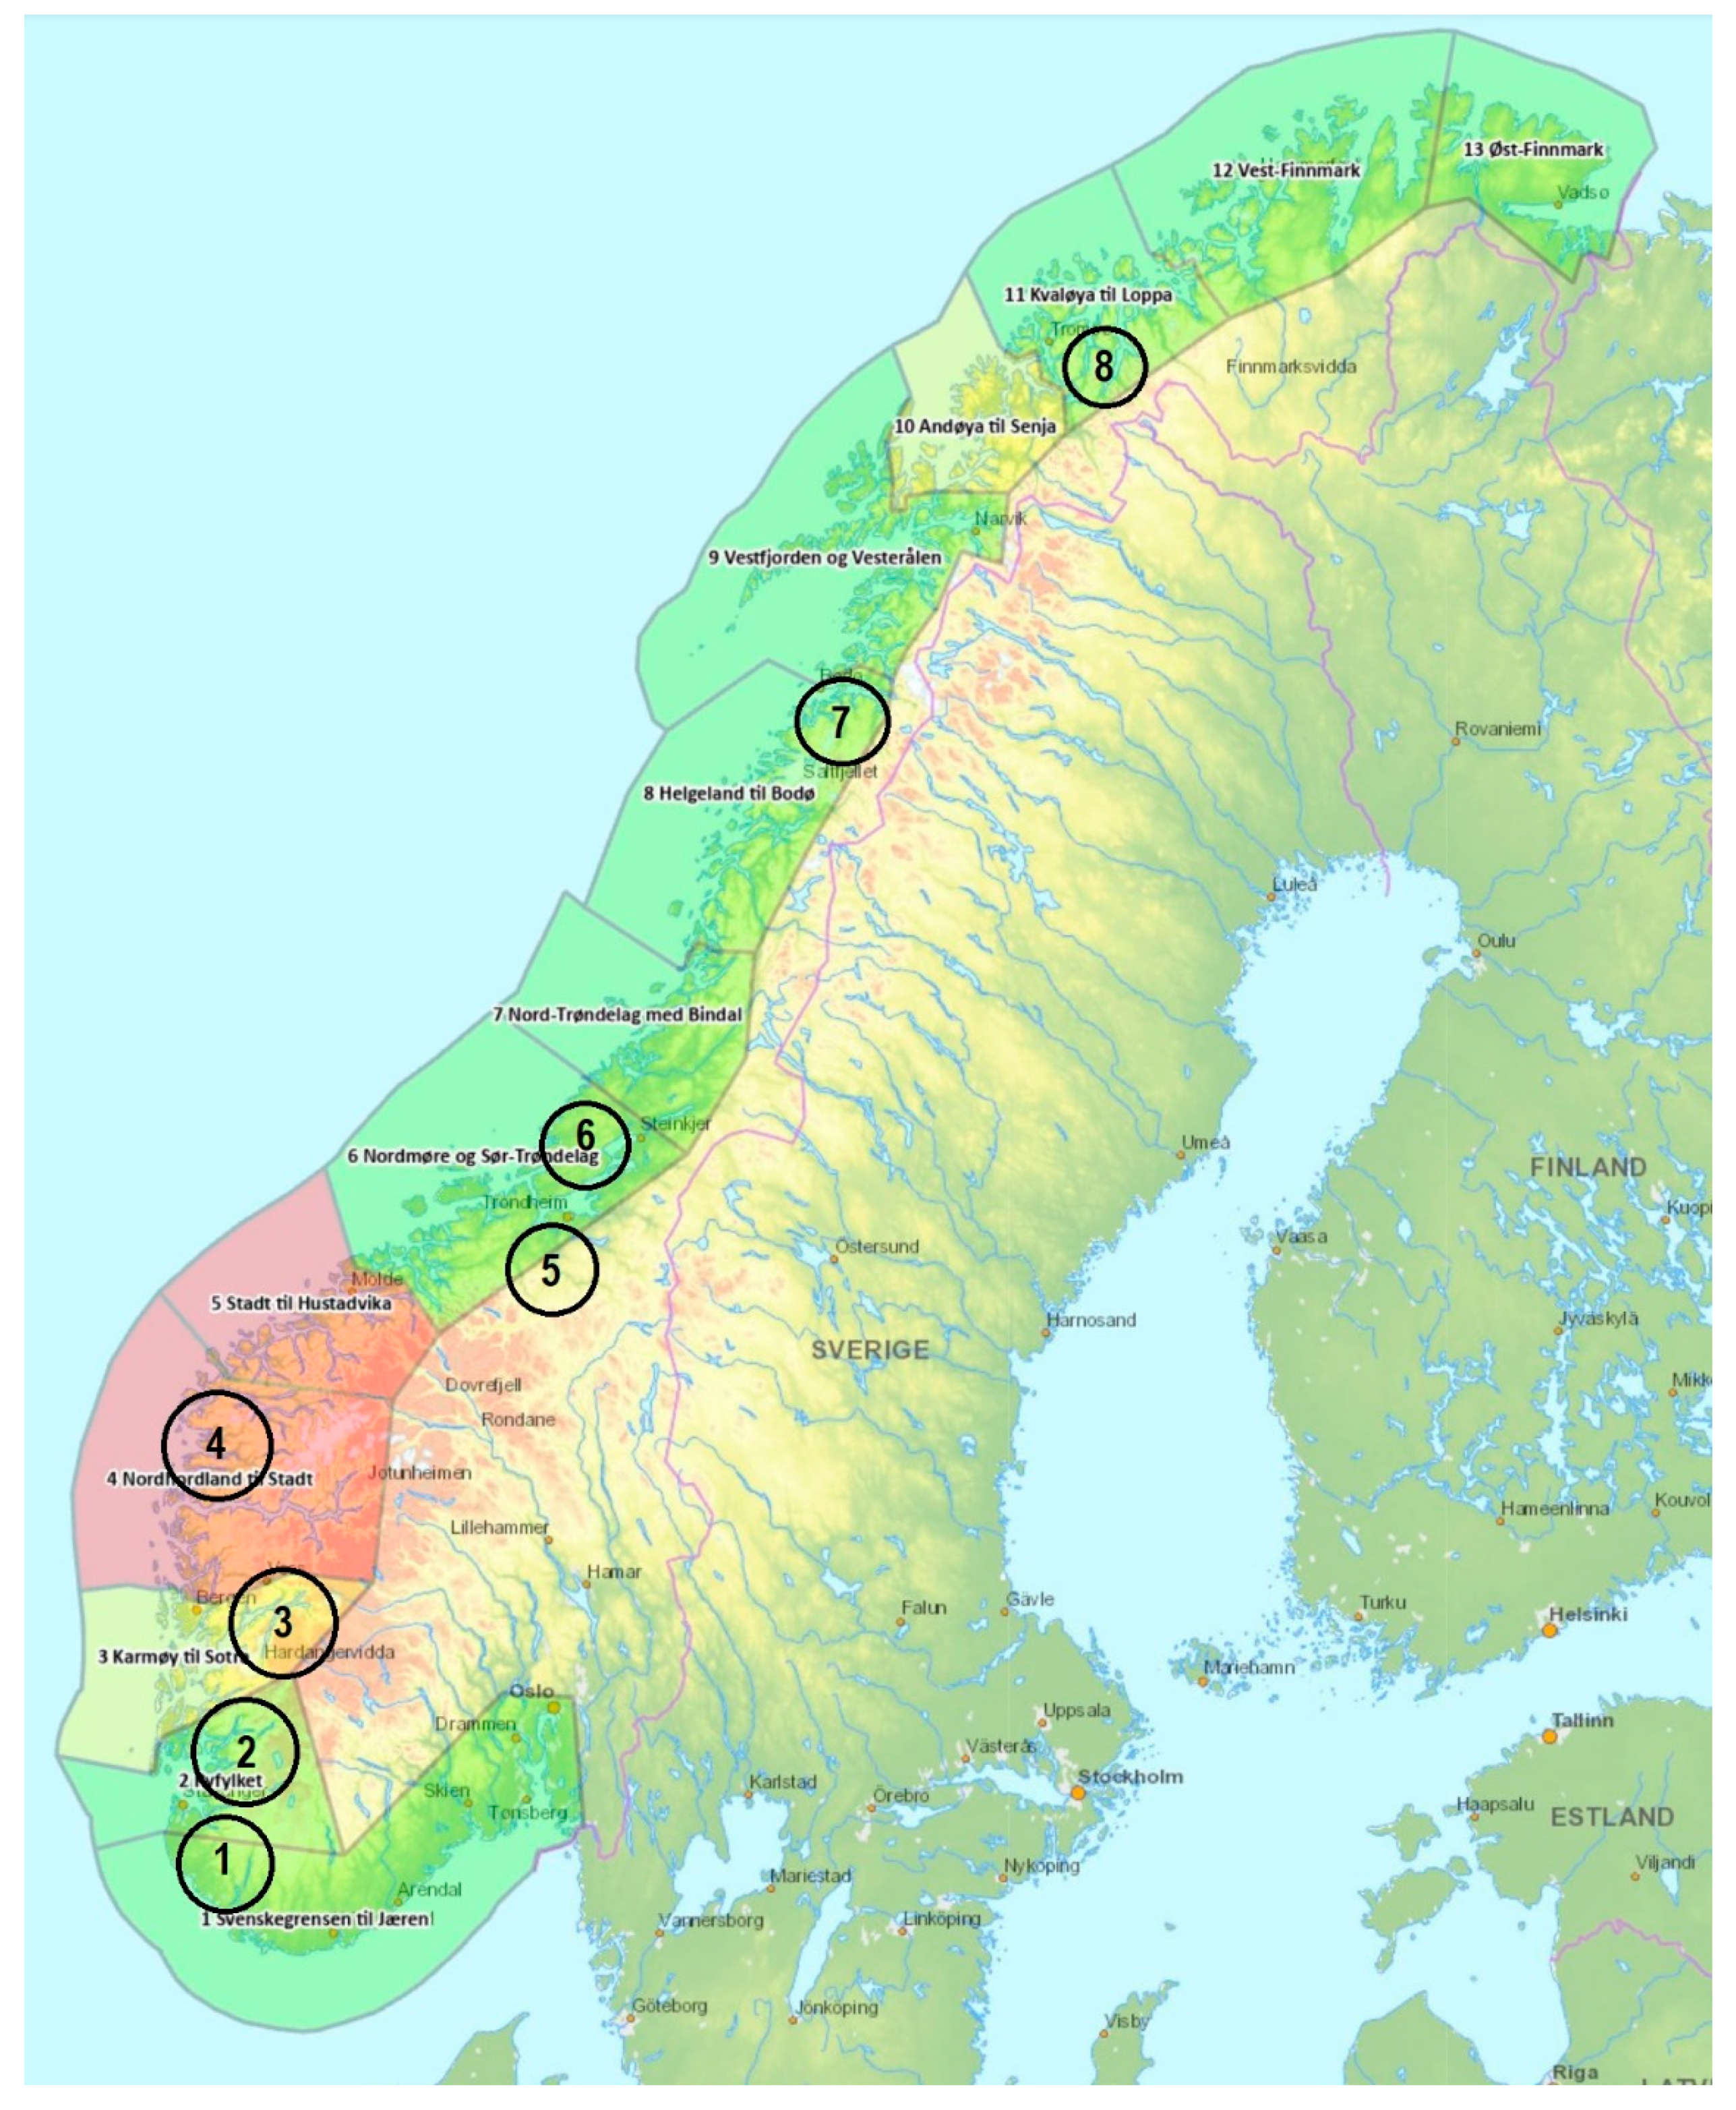
2.1. Study Area

Firstly, population data were collected from 27 rivers distributed in eight river regions (Table 1, Figure 1, Figures S1 and S2). Data were collected using either underwater video systems or snorkelling surveys (Table 1). The eight regions were chosen primarily due to the population data that were available from rivers in the regions (Figures S1 and S2). Secondly, the regions should be approximately the same size in terms of anadromous fish production area, length, combined length of rivers (river stretch accessible to anadromous fish, Table 2), and comparable combined mean water discharge (Table 2). The combined river area accessible to anadromous fish (Table 2), precipitation area (Table 2), and theoretical spawning target for Atlantic salmon were also used to compare the regions.

2.2. Physical River Data

The lengths of rivers accessible to anadromous species were measured both from satellite photos (www.norgeibilder.no (accessed on 1 June 2022)) and, for some rivers, from data that were published earlier [30,31]. The corresponding area was found in several sources. For the Hardangerfjord area (region 3) areas were found in [30,32,33]. In addition, the areas of Orkla and Bjerkreimsvassdraget were measured from www.norgeibilder.no (accessed on 1 June 2022). The precipitation field and mean water flow were found on www.nevina.nve.no (accessed on 1 June 2022).

2.3. Average Smolt Age

To control region data for differences in smolt age, it was assumed that the yearly mortality of salmon and trout parr older that two years was 50% [28]. The deviation for the from-smolt age of two years was calculated by the difference between observed average smolt age (ASA) minus two years. Further, this was used as a correction factor on PFA data (PFA*correction factor + PFA). It was assumed that trout and salmon smolts had the same average age in each river.

2.4. Salmon Populations’ Spawning Target

Data on spawning targets (i.e., conservation limit) for each of the 27 salmon populations in this study (Figure S2) were obtained from data of the Norwegian Directorate for the Environment [11]. There are, currently, no spawning targets for trout.

2.5. Estimating PFA

The total PFA for salmon and sea trout in the regions is the sum of fish caught in the fjord outside the rivers and the river PFA. Catch data from the sea fisheries were found at www.ssb.no (accessed on 15 May 2022). Since catch data from gill nets contain a mix of fish from different rivers in a region, it is difficult to define how large a part of the total PFA from a specific river or region is caught in the sea fisheries. For our eight river regions we used estimated data developed by the Norwegian Scientific Advisory Committee for Atlantic salmon [11]. In these estimates, the number of Atlantic salmon in the sea fisheries are calculated as a proportion of the spawning population that is estimated in each river the same year.
The river PFA is the number of both species ascending the river in a season. This number can be monitored by a combination of snorkelling counts in the spawning season and the river catches (killed fish) that same year, or by video surveillance close to the mouth of the river in the sea.

2.6. Snorkelling

The drift snorkelling observations were conducted similar to those described earlier [31,34,35]. In short, the snorkelling teams consist of divers equipped with a wet suit, diving mask, snorkel, fins, and neoprene gloves. The snorkellers drift in parallel and make frequent stops to discuss the observations. Each person in the team notes the number of fish and position of the observations with reference to a waterproof map. To avoid double counting, the count only includes fish that pass the observer in the upstream direction or fish that are holding their position and thereby passed by the diver. Standardisation among rivers is obtained by only using trained personnel for snorkelling and by adjusting the numbers of divers to the size and width of the river, i.e., varying from one to three divers in each team.
Snorkelling is conducted during low discharge periods from mid-September to mid-November. This period is chosen to encounter the spawning population, as both sea trout and salmon spawn in the autumn [23]. In addition, this represents the time after recreational fishing and the count, therefore, represents an estimate of the spawning population. Within this period, the date varied between rivers and over years according to changing ambient conditions. The data in the present study are part of larger regional studies in Norway [36,37,38].

2.7. River Catch Data

Data on river catches was achieved from recreational fishing for both species in all the studied rivers during the study period. The data are extracted from www.fangstrapp.no, www.ssb.no, www.scanatura.no and local river administrations (Orkla and Målselv).

2.8. Underwater Video Surveillance

Underwater video surveillance is a method that was first tested in 1995, but had increased use from 2005 to 2020. The basic principle differs between rivers and the size of cross sections, which range from the small narrow to fish ladders to open river cross sections more than 40 m wide. A sufficient number of cameras were used to cover all possible parts of the water volume in the specific locations, where fish can pass within the camera sector. See [35] for further description of the method.

2.9. Statistical Methods

Statistical analyses were performed using XLSTAT 19.5 by Addinsoft. The total biomass of spawning females based on the ST approach and the PFA approach were ranked from 1 (highest) to 8 (lowest). The ranking was compared using Spearman’s non-parametric correlation [39]. Possible correlation of smolt age against latitude (south to north) was tested with a non-parametric correlation (as region are categorial values).

3. Results

3.1. Comparing the Salmon Spawning Target in the Eight River Regions in 2019

According to the estimated region-merged spawning target for Atlantic salmon, the total weight of female spawners, when corrected for river areas, varied between the eight river regions. The highest value was found for region 5, Orkla, and the lowest for region 7 (Figure 2). In 2019 the recorded biomass of females in the spawning populations that year were measured in a proportion (%) of the spawning target (conservation limit = 100%). Of the eight regions the proportion was highest in regions 1, 2, and 6 and lowest in region 5 (Figure 3).

3.2. Comparing the Total PFA in the Eight Geographical Regions in 2019

The comparison of the eight regions shows a varying number of salmon and trout entering the coast outside the rivers in 2019 (Figure 4). Three of the river regions, i.e., regions 1, 3, and 6 have a total PFA that is in the range of two to four times higher than in the other regions.

3.3. Comparing the ST and the PFA Approach in 2019

Comparing the ranks of the eight regions for the ST approach and the PFA approach in 2019 show that one region is given the same rank (river region 1). In some regions, the PFA approach gives higher ranks (regions 3, 6, and 5). In the other regions the PFA approach results in a lower rank than the ST approach (regions 2, 4, 7, and 8) (Figure 5). There was no correlation between the PFA rank and the ST rank (Spearman: rs = −0.071, n = 8, p = 0.882, Figure 5).

3.4. Average Smolt Age

The average smolt age registered in the eight studied regions varied from 2.3 to 4.1 years (Table 2). It was not possible to find data on smolt age for both salmon and trout in all rivers. Where data from both species were available, smolt age seemed to be the same for salmon and trout in most cases, but not always. Smolt age will also vary over time within rivers but there is a general increase in smolt age with latitude due to the decreasing temperatures when going from south to north (Figure 6).

4. Discussion

This study was based on the monitoring of population sizes by using video counts of individuals entering rivers (river PFA) or via snorkelling counts on the spawning grounds. Together with catch reports, both from the sea and from the rivers, it was possible to estimate a total PFA that was controlled for a total river smolt production area and smolt age in one single, or several merged rivers, draining out into a defined part of a fjord. The study was performed on the basis of the 2019 PFA data in the studied eight such regions or parts of fjords. The use of methods aiming at the total count of individuals within populations, to a greater extent, remove the problem of large confidence intervals linked to methods using sampling techniques (e.g., catch statistics). However, the ambition of counting all individuals in populations by means of methods relying on visual identification also introduces some potential uncertainty [40]. The use of a total PFA as a parameter is still partly dependent on some uncertainty in catch statistics. However, by linking the effect from unreported catches alone, there is only a one-sided uncertainty and therefore not the two-sided uncertainty of the confidence intervals combined with the unreported catch, as was the case earlier.
The study shows that—of the total 2019 PFA for all of the eight selected fjord regions with corresponding rivers—there was a variation of more than four times when comparing the region with the lowest estimated total PFA to the region with the highest. This large variation indicates that some anthropogenic factor is affecting the populations. The expected result would be to see similar PFA values to a much greater extent that has been shown in the eight studied regions due to a standardisation by means of smolt production area and smolt age.
The rankings of the eight regions using the ST approach and the PFA approach were not the same. This is most likely due to the introduction of sea trout in the analysis. Since 2009, the state of many of the over 400 salmon populations in Norwegian rivers have been evaluated by use of the concept spawning target [10]. Theoretical models made for eight different populations/rivers have been used as a benchmark for a varying number of the more than 400 Norwegian salmon rivers each year [11]. Theoretical models often simplify the real world and real ecosystems. That is also the case with the spawning target model. One such simplification is that there are no input data in the salmon model concerning the size of the sympatric sea trout population in the same river. It is suspected that there is a density-dependent competition between salmon and trout [41], especially in all the stages from swim up to the smolt stage [23,42]. If the salmon spawning target model does not involve population data on trout, it only tells a part of the story. That is why our study tests the use of both species in a combined total PFA. A region where both species thrive may be a sign of less anthropogenic effects on the fish, compared to regions where the populations are small when controlled for total river area. Since we do not know if there is a constant number balance between the two species, a better approach may be to merge the two data sets.
In regions/fjords made up of many small rivers that are located close to each other, there is a question of whether there are unique salmon and trout populations in each river or whether there is more of a mix [43,44]. Both video surveillance [34,35,45] and snorkelling projects [36], especially in region three of our study, show that there is a relatively high proportion of adipose fin-clipped fish in many rivers where no such tagging method is used. This indicates that there are both trout and salmon entering rivers where they have not grown up to the smolt stage. These are individuals from foreign rivers that are possible to detect with our visual methods. The ones that are not tagged and still come from other rivers are not singled out in the same way, a fact that indicate that there may be a mix of fish from several populations in many of the small rivers. It is suspected that many of the adipose fin-clipped individuals may have altered migration behaviour due to the tagging process; this may serve as an alternative explanation. In several of the 27 rivers assessed in this study, the water course contains one, or more, lakes or large water volumes where sea trout—both immature and mature—may stay over winter. In our study, we have chosen to merge data from several rivers within a region, since there is most likely a large proportion of the sea trout that will spawn in a different river than the one where it will stay over for winter. Moreover, it must be noted that sea trout migrations between rivers have been indicated in several studies [20,21,45,46].
In the last few years, commercial Atlantic salmon sea fisheries’ activity has been reduced on both sides of the Atlantic [47], including Norway [11]. In general, relatively few trout end up in sea catches [29]. The recreational fishing for salmon and trout in the sea, however, has increased in the same period. Since the catch from this type of activity is not reported, there is no good documentation to refer to for this increase. In this kind of fishing, learning techniques from others can change the success rate. The introduction of social media, discussion groups, and video sharing apps on the internet have probably increased the interest in sea salmon, and trout, recreational fishing as well as the skills of the individual practitioner. An increasing part of the total number of salmon and sea trout removed in the fjords, on the coast, and not reported will result in a lower measured total PFA. Obtaining an exact total salmon and trout PFA for rivers, or aggregations of rivers (merged numbers), could be a method for evaluating the overall situation for the two species. A new production controlling system for salmon farming was implemented in Norway in 2017 [48]. The new production management regime is based on 13 production zones where future growth is determined by the colour of a traffic light. The colour of the traffic light is determined by the environmental situation, as measured by the number of adult female sea lice per fish and assessments of the lice-induced mortality for wild fish stocks, devised by an appointed scientific committee [48,49]. The basic idea of the new regime is that the farmers will know in advance, when and where further expansion is possible. They will also know how much growth can be anticipated, and how often the situation will be evaluated. Since the Norwegian national farmed salmon production regulation system [48,50,51] reports the state for each of the 13 regions, a verification of the status of wild anadromous fish in each of these regions could work as a verification tool for the theoretical models. Bringing in the sea trout PFA in the models can be an important step to measure the effect of sea lice, since the trout spends more time in the fjords than the salmon.
Methods for monitoring variation in population size through the estimation of pre-fishery abundance for both Atlantic salmon and anadromous brown trout have been widely used in Norway, especially in the last 20 years [11,32,37]. The use of traps covering whole river cross sections, snorkelling, and underwater video surveillance have improved the data on the PFA when compared to earlier years where sampling methods were more common. Of these sampling methods, catch reports and statistics, were dominating. Sampling data will be inherently imprecise due to often small sampling sizes and in the lack of required random sampling procedures [52]. To be able to use catch data to estimate total population sizes, knowing the catch rate is a prerequisite. However, the catch rate varies between rivers and over years and will be influenced by, among other factors, fishing conditions, fishing rules, and river morphology. Another problem with catch statistics of the last 20 years, is that an increasing number of rivers have been closed for recreational fishing [53], so there are no catch reports available to estimate their population size. The introduction of methods which aim at counting all individuals in a population, or more correctly, all the individuals returning to a river each year, has improved the data on population development for both Atlantic salmon and anadromous brown trout [35]. A more precise description of these methods is that they aim at counting all individuals above a certain age and life history stage.
In small rivers where salmon and trout are not able to stay over winter, due to small water volumes in the cold part of the year, the fish often show a “hit and run” strategy [43]. They will enter the small river when water levels are sufficient in the time frame of spawning and, after spawning, return to sea water or another river for the winter stay. The use of the snorkelling method may produce underestimations of the PFA in such small rivers and in water courses with lakes. This is especially the case for anadromous brown trout where large numbers of the individuals are either immature or having a resting year from spawning. Both groups will, when a lake is available, stay in a large volume of water, where it is not possible to perform a snorkelling count. Even if data on the variation in population size can be relevant for evaluating the impact from anthropogenic factors, in general, there still remains a question of how to define a population. Measuring the PFA involves catch data from the sea, a catch that involves mixed populations. In addition, the fish entering the rivers are also, in many cases, a mix of populations. One way of bypassing this obstacle is to merge data from several populations in an area and treat them as one, as is done in the present study.
During their stay in the sea, the Atlantic salmon from the eight regions are probably experiencing the same level of predators and access to food. In contrast to this “common garden”, the geographical spread of the rivers where they live as juveniles can differ both in regard to predators and food [24]. The difference in river productivity [41] is probably reflected among the river variation in smolt age [54] and is thus partly accounted for in our model. There are several predators known to be feeding on juvenile Atlantic salmon and anadromous brown trout. Some of the most common predators, the Eurasian otter (Lutra lutra), Eurasian goosander (Mergus merganser), red-breasted merganser (Mergus serrator) are, however, distributed in all of the eight regions [55,56,57] and are most likely not responsible for the observed differences in the PFA among regions. Unlike the Atlantic salmon, the anadromous brown trout have relatively short sea migrations [24,58], and are restricted to the fjords close to the rivers where they were hatched and grew up to smolt stage. Across the eight reference regions in this study, the availability of food for the trout may, therefore, vary, both in space and time. Thus, we were not able to control for this effect since this variation was not monitored.

5. Conclusions

In this study, using the PFA estimates from 2019, it is suggested that a merged (merging salmon and trout over groups of rivers) PFA may be a more relevant parameter to separate the effects of different anthropogenic factors, especially the effects of sea lice. In addition to video surveillance and snorkelling, measuring the PFA depends on correct catch statistics. Correct statistics may be achievable in the rivers, but presently not from the sea. Increasing unregistered trolling catches from the coast and the fjords, for both anadromous species, in the recent years will influence the PFA estimates. The ambition of monitoring whole ecosystems is, at present, most likely unrealistic. However, the introduction of a reporting system for all of the catch of Atlantic salmon and anadromous brown trout in sea water will improve the possibilities of measuring other anthropogenic factors that affect these two species. Present data indicate that including anadromous brown trout in the stock assessment calculations produce different conclusions from those of the current management regime [11]. We suggest that anadromous brown trout are likely to compete with Atlantic salmon and present examples from the eight regions in 2019 suggest that bringing sea trout into the equation makes a difference.

Supplementary Materials

The following supporting information can be downloaded at: https://www.mdpi.com/article/10.3390/fishes7050264/s1, Figure S1: Number of returning salmon to the fjords (gill net catch) and re-turning salmon and anadromous trout (mature and immature trout) to the rivers in the eight regions studied in 2019. For comparison purposes numbers are corrected for merged area of the rivers in each region; Figure S2: Merged spawning target (estimated weight of spawning females) of Atlantic salmon in the rivers in each of the eight regions (data originates from [11]).

Author Contributions

A.L. conducted the experiment and analysed the data, A.K.D.I. and A.L. wrote the article and reviewed the manuscript. All authors have read and agreed to the published version of the manuscript.

Funding

Financial support was provided by the Norwegian Seafood Research fund (SALT2020, 901575), Vestland Fylkeskommune (306-2020) and POP-Kunnskapsinkubator (Salmon Tracking 2020).

Institutional Review Board Statement

The present field trials were approved by the local responsible laboratory animal science specialist under the surveillance of the Norwegian Animal Research Authority (NARA) and registered by the Authority.

Data Availability Statement

Not applicable.

Acknowledgments

We thank Sigurd Olav Stefansson for valuable comments on a previous draft of the manuscript.

Conflicts of Interest

There are no conflict of interest in relation to this study.

References

  1. Verspoor, E.; de Leániz, C.G.; McGinnity, P. Genetics and habitat management. In The Atlantic Salmon. Genetics, Conservation and Management; Verspoor, E., Stradmeyer, L., Nielsen, J., Eds.; Blackwell Publishing: Oxford, UK, 2007; pp. 399–424. [Google Scholar]
  2. Ferguson, A.; Reed, T.E.; Cross, T.F.; McGinnity, P.; Prodöhl, P.A. Anadromy, potamodromy and residency in brown trout Salmo trutta: The role of genes and the environment. J. Fish Biol. 2019, 95, 692–718. [Google Scholar] [CrossRef]
  3. Thorstad, E.B.; Økland, F.; Aarestrup, K.; Heggberget, T.G. Factors affecting the within-river spawning migration of Atlantic salmon, with emphasis on human impacts. Rev. Fish Biol. Fish. 2007, 18, 345–371. [Google Scholar] [CrossRef]
  4. Ford, J.S.; Myers, R.A. A Global Assessment of Salmon Aquaculture Impacts on Wild Salmonids. PLoS Biol. 2008, 6, e33. [Google Scholar] [CrossRef]
  5. Gargan, P.; Forde, G.; Hazon, N.; Russell, D.; Todd, C. Evidence for sea lice-induced marine mortality of Atlantic salmon (Salmo salar) in western Ireland from experimental releases of ranched smolts treated with emamectin benzoate. Can. J. Fish. Aquat. Sci. 2012, 69, 343–353. [Google Scholar] [CrossRef]
  6. Skaala, Ø.; Sjøtun, K.; Dahl, E.; Husa, V.; Bjørge, A.; Uiblein, F. Interactions between salmon farming and the ecosystem: Lessons from the Hardangerfjord, western Norway. Mar. Biol. Res. 2014, 10, 199–202. [Google Scholar] [CrossRef]
  7. Skaala, Ø.; Johnsen, G.H.; Lo, H.; Borgstrøm, R.; Wennevik, V.; Hansen, M.M.; Merz, J.E.; Glover, K.A.; Barlaup, B.T. A conservation plan for Atlantic salmon (Salmo salar) and anadromous brown trout (Salmo trutta) in a region with intensive industrial use of aquatic habitats, the Hardangerfjord, western Norway. Mar. Biol. Res. 2014, 10, 308–322. [Google Scholar] [CrossRef]
  8. Forseth, T.; Barlaup, B.T.; Finstad, B.; Fiske, P.; Gjøsæter, H.; Falkegård, M.; Hindar, A.; Mo, T.A.; Rikardsen, A.H.; Thorstad, E.B.; et al. The major threats to Atlantic salmon in Norway. ICES J. Mar. Sci. 2017, 74, 1496–1513. [Google Scholar] [CrossRef]
  9. Hindar, K.; Hutchings, J.A.; Diserud, O.; Fiske, P. Stock, recruitment and exploitation. In Atlantic Salmon Ecology; Aas, Ø., Einum, S., Klementsen, A., Skurdal, J., Eds.; Blackwell Publishing: Oxford, UK, 2011; pp. 299–332. [Google Scholar]
  10. Forseth, T.; Fiske, P.; Barlaup, B.; Gjøsæter, H.; Hindar, K.; Diserud, O.H. Reference point based management of Norwegian Atlantic salmon populations. Environ. Conserv. 2013, 40, 356–366. [Google Scholar] [CrossRef]
  11. Anon. Status of Wild Atlantic Salmon in Norway 2020. Vitenskapelig råd for Lakseforvalting. In Norwegian with Summary in English. 147p. 2020. Available online: https://www.vitenskapsradet.no/ (accessed on 15 June 2022).
  12. Potter, E.C.E.; Crozier, W.W.; Schön, P.-J.; Nicholson, M.D.; Maxwell, D.L.; Prévost, E.; Erkinaro, J.; Gudbergsson, G.; Karlsson, L.; Hansen, L.P.; et al. Estimating and forecasting pre-fishery abundance of Atlantic salmon (Salmo salar L.) in the Northeast Atlantic for the management of mixed-stock fisheries. ICES J. Mar. Sci. 2004, 61, 1359–1369. [Google Scholar] [CrossRef]
  13. Krkošek, M.; Lewis, M.A.; Volpe, J.P.; Morton, A. Fish farms and sea lice infestations of wild juvenile salmon in the Broughton Archipelago—A rebuttal to Brooks (2005). Rev. Fish. Sci. 2006, 14, 1–11. [Google Scholar] [CrossRef]
  14. Kristoffersen, A.B.; Qviller, L.; Helgesen, K.O.; Vollset, K.W.; Viljugrein, H.; Jansen, P.A. Quantitative risk assessment of salmon louse-induced mortality of seaward-migrating post-smolt Atlantic salmon. Epidemics 2018, 23, 19–33. [Google Scholar] [CrossRef] [PubMed]
  15. Klemetsen, A.; Amundsen, P.A.; Dempson, J.B.; Jonsson, B.; Jonsson, N.; O’Connell, M.F.; Mortensen, E. Atlantic salmon Salmo salar L., brown trout Salmo trutta L. and Arctic charr Salvelinus alpinus (L.): A review of aspects of their life histories. Ecol. Freshw. Fish 2003, 12, 1–59. [Google Scholar] [CrossRef]
  16. Lamberg, A.; Strand, R.; Kanstad-Hanssen, Ø. Videoovervåking av Laks og Sjøørret i Granvinsvassdraget i 2017. SNA-Rapport 01/2020; 33p. 2020. (In Norwegian). Available online: http://skandnat.no/wp-content/uploads/2021/01/SNA-rapport-01-2020.pdf (accessed on 1 June 2022).
  17. Lamberg, A.; Bjørnbet, S.; Berdal, M.; Gjertsen, V.; Strand, R.; Hanssen, K.Ø. Videoovervåking av Laks og Sjøørrret i Orkla i årene 2013 til 2017. SNA-Rapport 11/2018. 69p. 2018. (In Norwegian). Available online: https://skandnat.no/wp-content/uploads/2018/10/Orkla-SNA-rapport-11-2018.pdf (accessed on 1 June 2022).
  18. Skaala, Ø.; Johnsen, G.H.; Barlaup, B. Prioriterte Strakstiltak for Sikring av Ville Bestander av Laksefisk i Hardangerfjordbassenget i Påvente av Langsiktige Forvaltningstiltak. Report fra Havforskningen. Institute of Marine Research, Bergen, 10/2010, 39p. 2010. (In Norwegian with Abstract in English). Available online: https://www.hi.no/hi/nettrapporter/rapport-fra-havforskningen/2010/hi-rapp_10-2010 (accessed on 25 May 2022).
  19. Jonsson, B.; Jonsson, N.; Hansen, L.P. Atlantic salmon straying from the River Imsa. J. Fish Biol. 2003, 62, 641–657. [Google Scholar] [CrossRef]
  20. Källo, K.; Baktoft, H.; Kristensen, M.L.; Birnie-Gauvin, K.; Aarestrup, K. High prevalence of straying in a wild brown trout (Salmo trutta) population in a fjord system. ICES J. Mar. Sci. 2022, 79, 1539–1547. [Google Scholar] [CrossRef]
  21. Birnie-Gauvin, K.; Thorstad, E.B.; Aarestrup, K. Overlooked aspects of the Salmo salar and Salmo trutta lifecycles. Rev. Fish Biol. Fish. 2019, 29, 749–766. [Google Scholar] [CrossRef]
  22. Van Zwol, J.A.; Neff, B.D.; Wilson, C.C. The effect of competition among three salmonids on dominance and growth during the juvenile life stage. Ecol. Freshw. Fish 2012, 21, 533–540. [Google Scholar] [CrossRef]
  23. Jonsson, B.; Jonsson, N. Ecology of Atlantic Salmon and Brown Trout. Habitat as a Template for Life Histories; Springer: New York, NY, USA, 2011. [Google Scholar]
  24. Jensen, A.J.; Diserud, O.H.; Finstad, B.; Fiske, P.; Thorstad, E.B. Early-season brown trout (Salmo trutta) migrants grow and survive better at sea. J. Fish Biol. 2022, 100, 1419–1431. [Google Scholar] [CrossRef]
  25. Thorstad, E.B.; Todd, C.D.; Uglem, I.; Bjørn, P.A.; Gargan, P.G.; Vollset, K.W.; Halttunen, E.; Kålås, S.; Berg, M.; Finstad, B. Marine life of the sea trout. Mar. Biol. 2016, 163, 47. [Google Scholar] [CrossRef]
  26. Jensen, A.J.; Finstad, B.; Fiske, P. The cost of anadromy: Marine and freshwater mortality rates in anadromous Arctic char and brown trout in the Arctic region of Norway. Can. J. Fish. Aquat. Sci. 2019, 76, 2408–2417. [Google Scholar] [CrossRef]
  27. Rideout, R.M.; Tomkiewicz, J. Skipped Spawning in Fishes: More Common than You Might Think. Mar. Coast. Fish. Dyn. Manag. Ecosyst. Sci. 2011, 3, 176–189. [Google Scholar] [CrossRef] [Green Version]
  28. Flemming, I.A. Reproductive strategies of Atlantic salmon: Ecology and evolution. Rev. Fish Biol. Fish. 1996, 6, 379–416. [Google Scholar] [CrossRef]
  29. Arnekleiv, J.V.; Kjærstad, G.; Rønning, L.; Davidsen, J.G.; Sjursen, A.D. Studies on Freshwater Biology in the River Stjørdalsvassdraget in 2009–2013. NTNU Vitenskapsmuseet Naturhistorisk Rapport 2014-3, 82p. 2014. (In Norwegian with Abstract in English). Available online: https://www.ntnu.no/documents/10476/401393002/2014-3+Rapport+Stj%C3%B8rdalsvassdraget.pdf/8ea46943-9794-4382-b1e7-fa9c7f68fec6 (accessed on 24 April 2022).
  30. Hindar, K.; Diserud, O.; Fiske, P.; Forseth, T.; Jensen, A.J.; Ugedal, O.; Jonsson, N.; Sloreid, S.-E.; Arnekleiv, J.V.; Saltveit, S.J.; et al. Spawning Targets for Atlantic Salmon Populations in Norway. NINA Report 226. 78p. 2007. (In Norwegian with English summary). Available online: http://www.nina.no/archive/nina/pppbasepdf/rapport/2007/226.pdf (accessed on 20 May 2022).
  31. Vollset, K.W.; Skoglund, H.; Barlaup, B.T.; Pulg, U.; Gabrielsen, S.-E.; Wiers, T.; Skår, B.; Lehmann, G.B. Can the river location within a fjord explain the density of Atlantic salmon and sea trout? Mar. Biol. Res. 2014, 10, 268–278. [Google Scholar] [CrossRef]
  32. Skoglund, H.; Wiers, T.; Normann, E.S.; Stranzl, S.; Landro, Y.; Pulg, U.; Postler, C.; Velle, G.; Gabrielsen, S.-E.; Lehmann, G.B.; et al. Gytefisktelling av Laks og Sjøaure og Uttak av Rømt Oppdrettslaks i Elver på Vestlandet Høsten 2018. LFI-Report nr 359. 19p. 2018. (In Norwegian). Available online: https://norceresearch.brage.unit.no/norceresearch-xmlui/bitstream/handle/11250/2647900/LFI_359.pdf?sequence=4 (accessed on 20 May 2022).
  33. Hellen, B.A.; Kambestad, M.; Johnsen, G.H. Habitatkartlegging og Forslag til Tiltak for Sjøaure i Utvalgte Vassdrag ved Hardangerfjorden. Rådgivende Biologer AS Rapport nr. 1781. 251p. 2013. (In Norwegian). Available online: https://www.radgivende-biologer.no/rapporter/ar-2013/habitatkartlegging-og-forslag-til-tiltak-for-sjoaure-i-utvalgte-vassdrag-ved-hardangerfjorden/ (accessed on 10 May 2022).
  34. Orell, P.; Erkinaro, J.; Karppinen, P. Accuracy of snorkelling counts in assessing spawning stock of Atlantic salmon, Salmo salar, verified by radio-tagging and underwater video monitoring. Fish. Manag. Ecol. 2011, 18, 392–399. [Google Scholar] [CrossRef]
  35. Svenning, M.-A.; Lamberg, A.; Dempson, B.; Strand, R.; Hanssen, Ø.K.; Fauchald, P. Incidence and timing of wild and escaped farmed Atlantic salmon (Salmo salar) in Norwegian rivers inferred from video surveillance monitoring. Ecol. Freshw. Fish 2016, 26, 360–370. [Google Scholar] [CrossRef]
  36. Kanstad-Hanssen, Ø.; Gjertsen, V.; Bentsen, V.; Lamberg, A. Oppvandring av Sjøvandrende Laksefisk i Fisketrappa i Målselvfossen i 2016. Ferskvannsbiologen Rapport 2017-06; 15p. 2017. (In Norwegian). Available online: http://skandnat.no/wp-content/uploads/2021/05/Rapport-2017-06-Malselv-2016-Endelig.pdf (accessed on 25 April 2022).
  37. Skoglund, H.; Vollset, K.W.; Barlaup, B.; Lennox, R. Gytefisktelling av Laks og Sjøaure på Vestlandet—Status og Utvikling i Perioden 2004–2018. (Estimation of Spawning Population of Atlantic Salmon and Sea Trout in Western Norway—Status and Development in the Period 2004–2018). NORCE Report nr. 357, Bergen, Norway, 44p. 2019. (In Norwegian with Abstract in English). Available online: https://norceresearch.brage.unit.no/norceresearch-xmlui/bitstream/handle/11250/2647898/LFI_357.pdf?sequence=4 (accessed on 27 April 2022).
  38. Holte, E.; Skoglund, H.; Solem, Ø.; Kanstad-Hanssen, Ø.; Kambestad, M.; Lamberg, A.; Muladal, R.; Sollien, P.V.; Hellen, B.A.; Ulvan, E.M. Overvåking av Gytebestander av Laks og Sjøørret i Norge, 2019. NINA Rapport 1849, 226p. 2020. (In Norwegian with Abstract In Norwegian). Available online: https://brage.nina.no/nina-xmlui/handle/11250/2657851 (accessed on 1 June 2022).
  39. Zar, J.H. Biostatistical Analysis, 2nd ed.; Prentice-Hall, Inc.: Englewood Cliffs, NJ, USA, 1984; p. 718. [Google Scholar]
  40. Stien, L.H.; Nilsson, J.; Bui, S.; Fosseidengen, J.E.; Kristiansen, T.S.; Øverli, Ø.; Folkedal, O. Consistent melanophore spot patterns allow long-term individual recognition of Atlantic salmon Salmo salar. J. Fish Biol. 2017, 91, 1699–1712. [Google Scholar] [CrossRef]
  41. Pulg, U.; Vollset, K.W.; Lennox, R.J. Linking habitat to density-dependent population regulation: How spawning gravel availability affects abundance of juvenile salmonids (Salmo trutta and Salmo salar) in small streams. Hydrobiologia 2019, 841, 13–29. [Google Scholar] [CrossRef]
  42. Einum, S. Salmonid population dynamics: Stability under weak density dependence? Oikos 2005, 110, 630–633. [Google Scholar] [CrossRef]
  43. Hindar, K.; Tufto, J.; Sættem, L.M.; Balstad, T. Conservation of genetic variation in harvested salmon populations. ICES J. Mar. Sci. 2004, 61, 1389–1397. [Google Scholar] [CrossRef]
  44. Hansen, M.M.; Skaala, Ø.; Jensen, L.F.; Bekkevold, D.; Mensberg, K.-L.D. Gene flow, effective population size and selection at major histocompatibility complex genes: Brown trout in the Hardanger Fjord, Norway. Mol. Ecol. 2007, 16, 1413–1425. [Google Scholar] [CrossRef]
  45. Lamberg, A.; Kvitvær, T. Videoovervåking av laks og sjøørret i Mundheimselva i 2018. NA Report 14/2018, 68p. 2018. (In Norwegian). Available online: https://skandnat.no/2022/01/20/videoovervaking-av-laks-og-sjoorret-i-mundheimselva-i-2018/ (accessed on 1 June 2022).
  46. Degerman, E.; Leonardsson, K.; Lundqvist, H. Coastal migrations, temporary use of neighbouring rivers, and growth of sea trout (Salmo trutta) from nine northern Baltic Sea rivers. ICES J. Mar. Sci. 2012, 69, 971–980. [Google Scholar] [CrossRef] [Green Version]
  47. Limburg, K.E.; Waldman, J.R. Dramatic Declines in North Atlantic Diadromous Fishes. BioScience 2009, 59, 955–965. [Google Scholar] [CrossRef]
  48. Hersoug, B. Why and how to regulate Norwegian salmon production?–The history of Maximum Allowable Biomass (MAB). Aquaculture 2021, 545, 737144. [Google Scholar] [CrossRef]
  49. Misund, A.U. From a natural occurring parasitic organism to a management object: Historical perceptions and discourses related to salmon lice in Norway. Mar. Policy 2019, 99, 400–406. [Google Scholar] [CrossRef]
  50. Vollset, K.W.; Dohoo, I.; Karlsen, Ø.; Halttunen, E.; Kvamme, B.O.; Finstad, B.; Wennevik, V.; Diserud, O.H.; Bateman, A.; Friedland, K.D.; et al. Disentangling the role of sea lice on the marine survival of Atlantic salmon. ICES J. Mar. Sci. 2017, 75, 50–60. [Google Scholar] [CrossRef]
  51. Myksvoll, M.S.; Sandvik, A.D.; Albretsen, J.; Asplin, L.; Johnsen, I.A.; Karlsen, Ø.; Kristensen, N.M.; Melsom, A.; Skardhamar, J.; Ådlandsvik, B. Evaluation of a national operational salmon lice monitoring system—From physics to fish. PLoS ONE 2018, 13, e0201338. [Google Scholar] [CrossRef]
  52. Diserud, O.H.; Fiske, P.; Karlsson, S.; Glover, K.A.; Næsje, T.; Aronsen, T.; Bakke, G.; Barlaup, B.T.; Erkinaro, J.; Florø-Larsen, B.; et al. Natural and anthropogenic drivers of escaped farmed salmon occurrence and introgression into wild Norwegian Atlantic salmon populations. ICES J. Mar. Sci. 2022, 79, 1363–1379. [Google Scholar] [CrossRef]
  53. Stensland, S.; Dugstad, A.; Navrud, S. The Recreational value of Atlantic salmon angling under different fishing regulations. Fish. Manag. Ecol. 2021, 28, 362–372. [Google Scholar] [CrossRef]
  54. Jensen, A.J.; Finstad, B.; Fiske, P.; Hvidsten, N.A.; Rikardsen, A.H.; Saksgård, L. Timing of smolt migration in sympatric populations of Atlantic salmon (Salmo salar), brown trout (Salmo trutta), and Arctic char (Salvelinus alpinus). Can. J. Fish. Aquat. Sci. 2012, 69, 711–723. [Google Scholar] [CrossRef]
  55. Råd, O. Breeding distribution and habitat selection of Red-breasted Mergansers in freshwater in western Norway. Wildfowl J. 1980, 31, 53–56. [Google Scholar]
  56. Svenning, M.-A.; Fagermo, S.E.; Barrett, R.T.; Borgstrøm, R.; Vader, W.; Pedersen, T.; Sandring, S. Goosander predation and its potential impact on Atlantic salmon smolts in the River Tana estuary, northern Norway. J. Fish Biol. 2005, 66, 924–937. [Google Scholar] [CrossRef]
  57. Landa, A.; Guidos, S. Bycatch in local fishery disrupts natural reestablishment of Eurasian otter in western Norway. Conserv. Sci. Pract. 2020, 2, e208. [Google Scholar] [CrossRef] [Green Version]
  58. Berg, O.K.; Berg, M. The duration of sea and freshwater residence of the sea trout, Salmo trutta, from the Vardnes River in northern Norway. Environ. Biol. Fishes 1989, 24, 23–32. [Google Scholar] [CrossRef]
Figure 1. The eight smaller river regions (black circles 1–8) studied in the present study. The 13 larger production zones established for regulating farmed salmon production in Norway [29] are denoted with small numbers and names. The basic map with production areas is copied from the Norwegian Directorate of Fisheries’ website: https://www.fiskeridir.no/Akvakultur (accessed on 1 June 2022).
Fishes 07 00264 g001
Figure 2. Spawning target (ST) (modelled conservation limit) summed for all rivers in each of eight studied regions. The ST is corrected for total river smolt production area.
Fishes 07 00264 g002
Figure 3. Estimated total biomass of spawning females merged for all rivers in each of the eight regions in 2019 expressed as a proportion (%) of the modelled spawning target (ST = 100%). (Data from [11]).
Fishes 07 00264 g003
Figure 4. Total pre-fishery abundance (PFA), corrected for river area and smolt age merging data, for Atlantic salmon and anadromous brown trout (sea trout) in the eight studied regions in 2019.
Fishes 07 00264 g004
Figure 5. The ranking of the eight regions from rank 1 (highest) to 8 (lowest) for the total biomass of spawning females in 2019 (spawning target, ST) or the number of salmon and trout merged pre-fishery abundance (PFA) in the same year.
Fishes 07 00264 g005
Figure 6. Average smolt age in the eight studied river regions.
Fishes 07 00264 g006
Table 1. The methods used for measuring in-river population size in each of the 27 rivers in the eight regions.
RegionRiverMethodNumber of LakesWinter Habitat Sea Trout
1BjerkreimselvaVideo in two fish ladders6Yes
2FrafjordelvaSnorkelling1Yes
2DirdalselvaSnorkelling
2EspedalselvaSnorkelling2Yes
2ForsandånaSnorkelling
2ÅrdalselvaSnorkelling1Yes
2HålandselvaSnorkelling
2VikedalselvaSnorkelling
2Rødneelva (Sandeid)Snorkelling
3EidfjordvassdragetSnorkelling1Yes
3EtneelvaSnorkelling/trap1Yes
3GranvinsvassdragetSnorkelling/video1Yes
3JondalselvaSnorkelling
3KinsoSnorkelling
3OmvikelvaSnorkelling/video
3RosendalselveneSnorkelling
3SimaSnorkelling
3SteinsdalelvaSnorkelling1 (estuary)
3UskedalselvaSnorkelling
4NaustaVideo in fish ladder/snorkelling
4Gaula (Sunnfjord)Video in fish ladder
5OrklaVideo/snorkelling Yes
6StordalselvaVideo1Yes
6NorddalselvaVideo Yes
7SaltdalslevaSnorkelling1Yes
7BeiarelvaSnorkelling Yes
8MålselvaVideo in fish ladder/snorkelling Yes
Table 2. Hydrogeographic information and average smolt age of the eight studied regions of the present study.
RegionRiver Length (km) Accessible to Anadromous FishAnnual Mean Water Discharge (m³/s)River Area (m²) Accessible to Anadromous FishPrecipitation Field (km²)Smolt Age
(Years)
152.0541.774.4137032.3
256.81082.602.49112532.7
374.01311.542.33617222.7
426.4761.833.0109082.6
588.0674.522.77030513.5
636.8171.724.5953742.7
7101.21004.728.82023964.1
8112.21715.000.00030154.0
Publisher’s Note: MDPI stays neutral with regard to jurisdictional claims in published maps and institutional affiliations.

