Abstract
The selection of artificial feed is critical to the success of larviculture of fin fish and requires knowledge of the varied species-specific dietary and nutritional requirements. With the emergence of commercial aquaculture of giant kōkopu, Galaxias argenteus, there is a need to understand the species-specific needs for artificial feeds in larviculture. Consequently, this study compares three commercial artificial dry feeds; Otohime, Artemac and O.range on the growth of recently weaned giant kōkopu. Larvae fed with Otohime outperformed both Artemac and O.range treatments by achieving the highest wet weight after 67 days, greater by at least 47% on average than both Artemac and O.range. These differences in larval performance are likely to be due to the higher protein:energy ratio and EPA content of Otohime. High DHA and ARA in the diets in absolute terms or in relation to EPA did not result in added benefit for growth performance. This study provides an important first step in identifying the nutritional needs of larval giant kōkopu which can assist in improving their commercial aquaculture production.
1. Introduction
Reliable larviculture to produce high quality juvenile fin fish in large quantities is one of the greatest challenges facing the aquaculture industry currently [1,2]. Low survival rates and poor growth of fin fish larvae are frequently major contributing factors to this production bottleneck [3,4]. Poor outcomes from larviculture is often the result of a combination of factors, such as a lack of knowledge of larval nutritional requirements, difficulties in supplying feeds that can be processed by rudimentary larval digestive systems, providing husbandry of small and fragile larval fish, as well as the appropriate management of the rapid and complex changes that fish undergo during this early phase of development [1,2,3,5,6,7]. The preparation and provision of appropriate feed is particularly critical for successful fish larviculture and typically accounts for 30–70% of total production costs [8], so that the optimization of larval nutrition and feeding regimes are priority targets for research in early stage aquaculture businesses [9].
Generally, feeding regimes for the larviculture of fin fish begin with several weeks of live food provision, followed by a period of co-feeding with live and artificial diets before larvae can be fully weaned to artificial diets [3,6,10]. Rotifers and Artemia are the most commonly used live feeds, but while these organisms have unlocked the potential for aquaculture of a multitude of fin fish species in the last few decades, they still impose limitations to successful commercial larviculture [7]. These limitations include their high costs, from both their purchase and the infrastructure and resources required to culture or prepare them [10]. Furthermore, the nutritional condition of live feeds can vary widely, with poor nutritional condition resulting in inferior survival and growth performance in cultured larvae [10,11]. As a result, significant effort is focus on identifying optimal artificial diets to replace live feeds.
Artificial diets provide several key advantages over live prey for larviculture. Most importantly, they can be customized to the species and age-specific nutritional needs of the animal in culture and are reliably uniform in composition [6,10]. This allows the reliability that is required for consistently delivering optimal survival and growth in commercial larviculture. Artificial diets are also far more practical, in that they are easily stored, require far fewer resources for preparation than live feeds, and are immediately dispensable when required [6].
Issues remain in preparing artificial larval feeds which provide for nutrient stability, as well as perceptibility, palatability, digestibility and nutritional value [5,6,12]. Of critical importance is identifying the specific needs of the species in culture, such that the optimal feed can be provided and economical production be achieved [13]. The provision of essential fatty acids are especially critical for larval marine fin fish [14,15,16]. The absolute and relative requirements of essential fatty acids, particularly EPA (eicosapentaenoic acid), ARA (arachidonic acid) and DHA (docosahexaenoic acid), are highly species-specific due to differences in their metabolic capabilities and nutritional requirements for development [13,15,17,18,19,20,21].
Galaxiid fishes are a family of freshwater fishes, found in cool-temperate southern hemisphere [22]. Most galaxiids maintain an entirely freshwater life cycle, however, amphidromy is common, such as in the case of the giant kōkopu (Galaxias argenteus) which is endemic to New Zealand [23,24]. The eggs of this species are deposited on river-banks, incubating terrestrially, until flooding rain events stimulate hatching, washing the larvae down rivers and out to sea [25,26,27,28]. After 3–6 months, giant kōkopu larvae, along with larvae from four other galaxiid species, undertake a mass migration back into the freshwater habitats occupied by adults [27,29]. These mass migrations occurring in confined fresh waterways provide the opportunity for targeting their harvesting to provide e highly prized “whitebait” [30,31]. Increasingly, studies show that the abundance of the species which make up this fishery are in decline due to habitat loss and predation by introduced species, with the giant kōkopu now considered threatened [31,32,33].
Protection of these galaxiid species largely involves increasing regulatory controls on wild fisheries activities, however, larviculture of giant kōkopu is in the early stages of commercialisation and is proposed to reduce the reliance on harvesting threatened wild populations [28,34,35]. Optimum diet selection for larvae is a significant issue impeding further commercialisation of giant kōkopu aquaculture. Recent work on this species has developed knowledge on their morphometry and energetic demands, indicating the benefits of earlier provision of larger feed particles [36,37]. Still, a significant portion of the larval production cycle (approximately 30 of 77 days) expensive live feeds are required, in large part due to the unknown nutritional of requirements of the larvae. Some early research that has been undertaken on the closely related inanga, Galaxias maculatus, identified that its larval diet requires high levels of alpha-linolenic fatty acid under certain salinity culture conditions [38]. However, these studies were undertaken at much lower salinities (0 and 15 ppt) than those in which giant kōkopu are reared.
This study aims to improve knowledge of the nutritional requirements of larval giant kōkopu through the comparison of the growth performance of larvae fed on three different commercially available artificial dry feeds. The results have the potential to be useful for improving the efficiency of larviculture, which is important for securing the future commercial success of the giant kōkopu aquaculture industry.
2. Materials and Methods
2.1. Experimental Animals
Gametes from 80 female and 20 male giant kōkopu were stripped and fertilized before being subjected to a 4 week incubation period in UV treated freshwater filtered to 1 µm at 4 °C. On 4 July 2016, approximately 1.2 million giant kōkopu were hatched directly into one 2500 L conical commercial larval rearing tank containing UV treated water, 35 ppt and ambient temperature < 18 °C. At 2 DAH (days after hatching) around 9000 fish were randomly selected from the commercial tank and split evenly among nine 20 L experimental tanks. This was achieved by estimating the total number of fish per liter in the transfer vessel by careful mixing and taking random 200 mL samples and then counting the number of fish in each sample to produce a mean estimate of the total number of fish.
2.2. Tank Design and Recirculation System
Experimental tanks were made from 20 L plastic (HDPE), round, blue pails, 270 mm in diameter and 380 mm in height. The water outflow pipe was set 80 mm below the rim of the pail so that each tank held 18 L. For the first 4 weeks the outflow pipe was fitted with a banjo filter using 600 µm filter mesh to prevent the escape of giant kōkopu larvae while allowing the passage of suspended particles. For the remainder of the experiment, banjo filters with 1 mm mesh were used. Surfboard wax was applied in a thick, 40 mm width strip around the inside of the tank at the water level to inhibit the climbing ability of the fish larvae.
The experimental tanks were connected to a recirculation system with the outflow from each tank being directed to a filter basket for removal of insoluble particles by a 5 µm filter mat. After passing through the filter mat, the water entered a 300 L sump containing 40 L of plastic Kaldnes-K3 media (Krüger Kaldnes AS, Norway) for biological filtration which had been preconditioned in a commercial giant kōkopu RAS system for at least six months immediately prior to experimental use. Protein was skimmed from the sump manually, as required. Each day the filter mat was changed, and 100 L of seawater was removed from the sump and replaced with natural seawater, 35 ppt, filtered to 5 µm and UV sterilized.
From the sump seawater was pumped through a UV filter and then distributed into each experimental tank using 4 mm tubing connected at the surface and bottom of the tank. Water flow to each tank was 0.28 L min−1 over the first 14 days of the experiment. However, inflow was suspended for 30 min during feeding events for the first 7 days. Flow rate was increased to 0.37 L min−1 from 15–28 days before increasing to 0.49 L min−1 for the following 14 days, and finally to 0.62 L min−1 for the remainder of the experiment.
Tanks were aerated by an air-stone at the bottom of the tank producing two medium sized (0.5 mm diameter) bubbles per second for the first 28 days of the experiment. The air-stone was then changed to provide a high number of very fine bubbles for the remaining experimental period.
Illumination of experimental tanks was provided by three 58 W fluorescent tubes, suspended 100 cm above the top edge of the tanks. Light reaching the tanks was dimmed by hanging shade cloth over the tanks for 30 min either side of the lights coming on at 0745 h and off at 1800 h.
Seawater temperature was not controlled, but was measured every 6 h with a glass thermometer (Aqua One) during the experimental period and found to vary between 14 and 18 °C, and was consistent among all tanks. Nitrate (<5 mg/L), nitrite (<0.25 mg/L), ammonia (NH3/NH4+) (<0.25 mg/L), carbonate hardness and pH (7–8) were measured every second day using API® test kits to ensure water treatment was maintaining suitable conditions for the larvae and was within the acceptable ranges reported for the rearing of larvae [39,40,41,42]. Water quality was never found to be outside these acceptable ranges for rearing larvae from set up through to the conclusion of the experiment and was consistent among experimental tanks due to the recirculation system.
2.3. Experimental Design
Three commercially available artificial dry feeds for larval giant kōkopu were tested. Larvae were provided solely live food for the first 14 days before a prolonged weaning period after which (from 45 DAH) only artificial food was provided (Table 1).

Table 1.
Experimental feeding regime for giant kōkopu larvae showing the feed provision of each feeding event and number of feeding events per day by larvae age. Instar-I Artemia (in–I), instar–II Artemia (in–II), small particle (SP), medium particle (MP), large particle (LP). * Indicates that for the period 36–44 DAH a ration of 2 g of instar–II Artemia were also administered with the fourth feed of the day only.
The first feeding treatment “OTO” used the Otohime products A (75–250 µm), B1 (250–360 µm) and B2 (360–650 µm) (Marubeni Nisshin Feed Co., Ltd., Tokyo, Japan) and are referred to as Small Particle, Medium Particle and Large Particle or “SP”, “MP”, and “LP”, respectively (Table 2).
Table 2.
Percent dry matter feed composition, energy content, and fatty acid profiles of the three larval diets tested in the present study.
The second treatment “ART” made use of the Artemac products 2 (100–200 µm), 3 (200–300 µm) and 4 (300–500 µm) (Aquafauna Bio-Marine, Inc., Hawthorne, CA, USA), again referred to as “SP”, “MP”, and “LP”, respectively (Table 2).
The final feed treatment “ORA” used O.range products START-S (100–200 µm), WEAN-S (200–400 µm) and WEAN–L (300–500 µm) (INVE Aquaculture Inc., Salt Lake City, UT, USA) also referred to as “SP”, “MP”, and “LP”, respectively (Table 2).
2.4. Live Food Production
Artemia cysts used to produce live feed throughout this experiment were GSL Sep-Art (INVE Aquaculture Inc., Salt Lake City, UT, USA) from the same batch.
Live feeds were administered by total wet weight, with Artemia being harvested and poured through a 100 µm sieve that was allowed to drip dry on a towel for 1 min and measured with electronic scales to the nearest 0.1 g.
Instar-I Artemia were produced by incubating cysts in natural seawater 35 ppt for 17 h at 29 °C with constant, vigorous aeration while exposed to light in 250 l Artemia cones. Instar-I Artemia were separated from unhatched cysts and husks with a magnet before rinsing in a 100 µm sieve with clean 35 ppt water. Instar-I Artemia were fed out immediately after harvesting from cysts.
Instar-II Artemia were produced and prepared for feeding under the same conditions, however, received a 27 h incubation with enrichment. After separation live animals were enriched in a 400 L tank for between 23–31 h using a proprietary enrichment formula that combines the commercially available instant algae products—Rotigrow Plus, Nanno 3600 and Tetraselmis 3600 (Reed Mariculture Inc., Salt Lake City, UT, USA). At the beginning of enrichment and 23 h later an aliquot of 60 mL of enrichment formula was added to the enrichment tank.
2.5. Sampling of Larvae
Two sampling events of larval giant kōkopu took place in this experiment. The initial sampling took place on 27 July 2016 when larvae were 23 DAH, once larvae had been exposed to SP weaning diets for the first week to establish if initial weaning performance may set a foundation for subsequent outcomes. The second sampling was at the conclusion of the experiment on 9 September 2016 when larvae were 67 DAH to determine the overall outcome of the comparative weaning treatments.
At both sampling events, randomly sampled larvae were euthanized by placing in ice water (0 °C) for 20 min, measured for total length (i.e., snout to tip of tail) and body depth (i.e., center of body at the anus across to the dorsal surface) from each tank. Measurements were conducted by placing fish on 46 µm grid plastic sheets and photographing fish under a microscope using an Olympus TG-4 camera. Images were later processed using ImageJ (ver. 1.53, National Institutes of Health) to derive measurements.
For the initial sampling event from each tank three samples of 50 fish were taken at random by gently swirling the tank, collecting fish with a small jar and pouring through 300 µm mesh. Mean wet weight (WW) of fish was determined by weighing followed by mean dry weight (DW) after freeze drying, re-weighing and dividing by the total number of fish. These lyophilized samples were then used to determine total lipid and total protein content. A further 20 fish were randomly sampled from each tank to measure total length and body depth.
For the final sampling event 20 fish were randomly sampled to total length and body depth measurements. Due to reduced numbers of fish from mortality amongst all treatments early in the experiment resulting from stress of transfer of larval into the experimental tanks, three samples of 20 fish per sample were taken from each tank to undertake WW and DW measurements. These same sampled fish were then also lyophilized and used for protein and lipid analyses. The ORA treatment was an exception where one tank had sufficient numbers for only 20, 20 and 19 fish per replicate sample and another tank with only 15 fish per replicate sample. Unfortunately, it was not possible to accurately recover and record respective mortalities of larvae throughout the experiment.
2.6. Specific Growth Rate
The mean specific growth rate (SGR) for WW was determined for each treatment tank across the duration of the 44 day experimental period between initial and final sampling events using Equation (1) [49].
where: g = (lnfinal mass − lninitial mass)/(number of days between sampling events).
2.7. Lipid and Protein Composition
Lipid was extracted from larval fish samples using a modified Bligh and Dyer [50] solvent extraction method [51]. A 1.9 mL aliquot of chloroform, methanol and deionized water mixture (ratios 2:1:0.4) was added to the lyophilized samples before being vortexed for 30 s and then left to stand for 16 h. An aliquot of 0.5 mL of 0.7% sodium chloride and 0.5 mL of chloroform were added, followed by 30 s of vortexing, then centrifuging for 10 min at 1000 rpm. The chloroform-lipid layer was removed and placed in a pre-weighed glass vial. The residual layer was washed with 1 mL of chloroform, followed by 30 s vortexing, centrifuging for 10 min at 1000 rpm and the chloroform-lipid removed and added to pre-weighed glass vial. This step was repeated again using only 0.5 mL of chloroform. The glass vials were then placed in a thermal evaporator held at 39 °C under flowing nitrogen gas to remove the chloroform. The glass vials were then re-weighed to determine lipid mass which was then divided by the total larval sample dry mass and multiplied by 100 to provide lipid content as a percentage of dry weight (%DW). The total lipid (per larva) was determined by multiplying the lipid proportion (%DW) by the mean DW of individual larvae in the respective sample. For both the three replicate lipid proportion measures and the three replicate total lipid measurements per replicate tank were then used to determine the tank average, with the results from the three tanks per treatment averaged to give the treatment mean.
The protein content of larvae was measured using a bicinchoninic acid (BCA) assay (Micro BCA™ Protein Assay Kit, ThermoFisher Scientific, Auckland, New Zealand). After removing the lipid content the residual larval tissues were freeze dried and ground before the addition of sodium hydroxide and incubation in a water bath at 50 °C for 16 h. Samples were diluted and then centrifuged at 4000 rpm for 10 min at 4 °C. The resulting samples and a set of bovine serum albumin standards were placed into a 96 well-plate and reagents added to each well followed by reading absorbance at 562 nm. The protein content of the larvae was calculated using the standard curve as a percentage of dry weight (%DW). The mean total protein (per larva) was determined by multiplying the protein proportion (%DW) by the mean DW of larvae in the respective sample.
2.8. Fatty Acid Profiles
Fatty acid analyses were conducted on an aliquot of the total lipid previously extracted gravimetrically. The derivatization process was based on Lepage & Roy [52]. Laboratory controls were included during the derivatization process. This comprised a positive control containing 52 reference standards of FAs all with different concentrations and a negative control containing C19 and C23 FAs in the same concentration range as the samples. An extraction solution of 2 mL of methanol:toluene (4:1 v/v, Analytical Grade, Merck) containing internal standards (C19: nonadecanoic acid 0.083 mg mL−1 and C23: tridecanoic acid 0.082 mg mL−1, Nu-Chek Prep., Elysian, MN, USA) was added to each sample and transferred to borosilicate tubes with Teflon-lined screw caps. Magnetic stirring bars were added to each tube. Acetyl chloride (200 mL, ECP) was added slowly, dropwise to each sample over a period of 1 min. The tubes were placed in a heating and stirring dry block at 100 °C for 1 h. After 1 h, the tubes were cooled in water and 5 mL of an aqueous solution of 6% potassium carbonate were added to each tube. The tubes were vortexed, then centrifuged at 3500× g (5 min at room temperature). The upper toluene phase was recovered and transferred to a gas chromatography (GC) vial with an insert, and a further 25% dilution was done using toluene, for analysis by GC-mass spectrometry (GC–MS) at the Auckland Science Analytical Services, at the University of Auckland. GC–MS instrument parameters were based on Kramer et al. [53]. The instrument used was an Agilent 7890B gas chromatograph coupled to a 5977C mass spectrometer with a split/splitless inlet [54]. A sample of 1 µL was injected using a CTC PAL autosampler into a glass 4 mm ID straight inlet liner packed with deactivated glass wool (Restek Sky®). The inlet temperature was 250 °C, in splitless mode, and the column flow was set at 1 mL min−1, with a column head pressure of 62 kPa, giving an average linear velocity of 19 cm s−1. Purge flow was set to 50 mL min−1 at 1 min after injection. Column selection was based on the recommendations from the official methods for the determination of trans fat (American Oil Chemists Society—[55]). The column was a fused silica Rtx-2330, which was 100 m long, 0.25 mm internal diameter, 0.2 μm highly polar stationary phase (90% biscyanopropyl and 10% cyanopropylphenyl polysiloxane, Shimadzu). Carrier gas was instrument grade helium (99.99%, BOC). The GC oven temperature programming started isothermally at 45 °C for 2 min, increased by 10 °C min−1 to 215 °C, held for 35 min and then increased by 40 °C min−1 to 250 °C and held for 10 min. The transfer line to the mass spectrometric detector (MSD) was maintained at 250 °C, the MSD source at 230 °C and the MSD quadropole at 150 °C. The detector was turned on 14.5 min into the run. The detector was run in positive-ion, electron-impact ionization mode, at 70 eV electron energy, with electron multiplier set with no additional voltage relative to the autotune value. Data were acquired at 1463 amu s−1 in scan mode from 41 to 420 amu, with a detection threshold of 100 ion counts. Resulting GC-MS peaks were identified on fatty acid methyl ester mass spectral library and each FA peak was quantified using an inhouse R package (RStudio, ver. 1.2.1335). The data were screened for chromatographic retention time drift, and manual correction/integration was carried out where necessary. The data set was normalized by the response of the internal standard (nonadecanoic acid), and a blank treatment was applied to correct the baseline response. The resulting normalized peak area values were used to quantify the total of each FA using linear calibration information obtained from seven calibration curve standards. The total amount of FA measured in the lipid aliquot was then adjusted for the total lipid extract to calculate the proportional contribution of each FA to the total FAMEs.
2.9. Statistical Analyses
The initial and final mean DW, WW, total length, body depth, total lipid and protein, percent lipid and protein, fatty acids, and SGR were compared among treatments using ANOVA where parametric data assumptions were satisfied. Initial and final lipid and protein concentrations as well as fatty acid profiles and SGR were arc-sine transformed prior to analysis to correct for any data distribution bias associated with percentage data [56]. Normality and equality of variance of data were tested and confirmed using the Shapiro–Wilk’s and Levene’s tests prior to analyses. Where data conformed to parametric assumptions a linear mixed model ANOVA was fitted to control the random effects of the tanks in each analysis. When ANOVA identified overall experimental treatment effects the differences between pairs of individual means were identified with a Tukey’s test with adjustment for false discovery. Estimated mean difference and 95% confidence intervals were calculated and are presented.
Data requirements for performing parametric tests were not met for the mean final total length and depth variables for giant kōkopu larvae. Consequently, Kruskal–Wallis tests were used to compare these data and where significant differences were found, then Mann–Whitney-Wilcox post hoc comparison tests were used to compare means between treatment groups.
All statistical analyses were performed using R (RStudio, ver. 1.2.1335). All measures of variability of sampled means is reported as standard error of the mean.
3. Results
3.1. Weight
There was no difference among treatments for mean initial WW of larval fish (F(2,6) = 0.38, p = 0.70); i.e., OTO 7.45 ± 0.13 mg, ART 7.52 ± 0.24 mg and ORA 7.21 ± 0.10 mg (Figure 1a). However, at the final sampling the mean WW of the fish was different among the treatments (F(2,6) = 15.99, p < 0.01). Fish in the OTO treatment had a greater mean final WW (73.23 ± 3.14 mg), between 12.70 and 34.60 mg greater than ART (49.58 ± 2.15 mg, p < 0.01), and between 19.10 and 41.00 mg greater than ORA (43.16 ± 1.74 mg, p < 0.01) (Figure 1b). The mean final WW of the ART and ORA treatment groups were not different (p = 0.30).
Figure 1.
(a) Mean initial wet weight (WW) and dry weight (DW) for larval giant kōkopu from three different feed treatments; OTO (Otohime), ART (Artemac) and ORA (O.range) (mean ± SE). Means with different superscripts are significantly different among treatments for WW and among treatment for DW (p < 0.05). (b) Mean final wet weight (WW) and dry weight (DW) for larval giant kōkopu from three different feed treatments; OTO (Otohime), Artemac (ART) and ORA (O.range) (mean ± SE). Means with different superscripts are significantly different among treatments for WW and among treatment for DW (p < 0.05).
The mean initial DW of the fish larvae was not different among treatments (F(2,6) = 1.03, p = 0.41), OTO 1.39 ± 0.03 mg, ART 1.32 ± 0.03 mg and ORA 1.34 ± 0.02 mg (Figure 1a). However, at the final sampling there were significant differences among treatments for DW (F(2,6) = 20.84, p < 0.01). OTO mean final DW (15.05 ± 0.62 mg), was between 0.26 and 0.59 times greater than ART (9.83 ± 0.42 mg, p < 0.01), and between 0.35 and 0.69 times greater than ORA (8.95 ± 0.37 mg, p < 0.01). There was no significant difference in the mean final DW between ART and ORA (p = 0.32) (Figure 1b).
3.2. Length and Depth
At the initial sampling the total length of the giant kōkopu larvae was not significantly different among treatments (F(2,6) = 0.11, p = 0.90); i.e., OTO 15.05 ± 0.21 mm, ART 15.02 ± 0.21 mm and ORA 14.87 ± 0.18 mg (Figure 2). However, at final sampling the mean total length of larvae was different among treatments (X2 = 8.52, p = 0.01); i.e., OTO 27.97 ± 0.55 mm, ART 24.85 ± 0.44 mm and ORA 25.74 ± 0.58 mm (Figure 2). Mean final total length was greater in the OTO treatment than ART (p < 0.01), while there was no difference between OTO and ORA (p = 0.10), and between ART and ORA (p = 0.13).
Figure 2.
Mean initial and final total length of larval giant kōkopu from three different feed treatments; OTO (Otohime), ART (Artemac) and ORA (O.range) (mean ± SE). Means with different superscripts are significantly different among treatments for mean initial total length and among treatments for mean final total length (p < 0.05).
The mean initial depth of the body of the larval fish was the same among treatments (i.e., 23 DAH) (F(2,6) = 0.02, p = 0.98); i.e., OTO 1.09 ± 0.02 mm, ART 1.09 ± 0.02 mm and ORA 1.10 ± 0.02 mm (Figure 3). At the final sampling there was a significant difference in mean body depth among treatments (X2 = 22.08, p < 0.01); i.e., OTO 2.55 ± 0.06 mm, ART 2.11 ± 0.06 mm and ORA 2.23 ± 0.07 mm (Figure 3). Mean final total body depth was greater in the OTO treatment than both ART (p < 0.01) and ORA (p < 0.01). There was no difference in final total body depth between ART and ORA (p = 0.13).
Figure 3.
Mean initial and final body depth for larval giant kōkopu in three different feed treatments; OTO (Otohime), ART (Artemac) and ORA (O.range) (mean ± SE). Means with different superscripts are significantly different among treatments for mean initial body depth and among treatments for mean final body depth (p < 0.05).
3.3. Specific Growth Rate
There was a significant difference in the SGR among the three feed treatments (F(2,6) = 29.88, p < 0.01). The OTO treatment achieved a greater SGR, 5.59 ± 0.10%, than both ART, 4.42 ± 0.06% (p < 0.01) and ORA, 4.14 ± 0.09 % (p < 0.01) (Figure 4). No difference was found in the SGR between ORA and ART treatments (p = 0.20).
Figure 4.
Mean specific growth rate (SGR) for larval giant kōkopu for three different feed treatments; OTO (Otohime), ART (Artemac) and ORA (O.range) (mean ± SE). Means with different superscripts are significantly different (p < 0.05).
3.4. Lipid and Protein
At the initial sampling there was no difference in proportional lipid content of the larvae among the three feed treatments (F(2,6) = 1.30, p = 0.34); i.e., OTO 16.1 ± 0.2% DW, ART 15.8 ± 0.2% DW and ORA 16.0 ± 0.4% DW (Figure 5). There was no significant difference in proportional lipid content of the larvae among treatments at the final sampling (F(2,6) = 0.21, p = 0.82); i.e., OTO 17.0 ± 0.6% DW, ART 15.5 ± 0.8% DW and ORA 16.7 ± 0.6% DW (Figure 5).
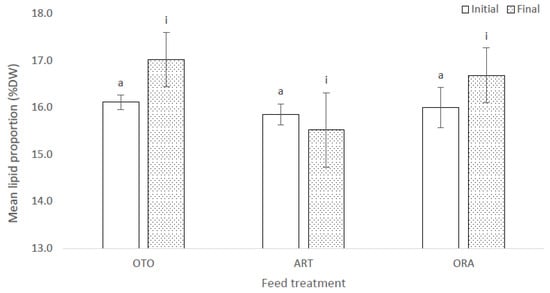
Figure 5.
Mean proportional lipid content of larval giant kōkopu as a percentage of dry weight (DW) for at the initial and final sampling events for three different feed treatments; i.e., OTO (Otohime), ART (Artemac) and ORA (O.range) (mean ± SE). Means with different superscripts are significantly different within each of the set of three treatment means for each sampling event (p < 0.05).
There was also no difference in total lipid among treatments at the initial sampling (F(2,6) = 3.08, p = 0.12); i.e., OTO 0.24 ± 0.00 mg, ART 0.20 ± 0.00 mg and ORA 0.22 ± 0.00 mg (Figure 6). However, there was a significant difference in mean total lipid among the three feed treatments at the final sampling event (F(2,6) = 17.72, p < 0.01); i.e., OTO 2.43 ± 0.10 mg, ART 1.56 ± 0.05 mg and ORA 1.43 ± 0.01 mg (Figure 6). OTO accumulated between 0.51 and 1.23 mg more lipid than ART (p < 0.01) and between 0.64 and 1.35 mg more lipid than ORA (p < 0.01). There was no difference in the total lipid content of larvae between the ART and ORA treatments (p > 0.1).
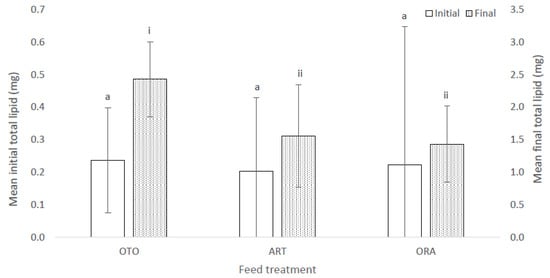
Figure 6.
Mean initial and final total lipid for larval giant kōkopu in three different feed treatments; i.e., OTO (Otohime), ART (Artemac) and ORA (O.range) (mean ± SE). Means with different superscripts are significantly different within each of the set of three treatment means for each sampling event (p < 0.05).
At the initial sampling there was no difference in the proportional protein content of the larval giant kōkopu among the three feed treatments (F(2,6) = 2.29, p = 0.18), i.e., OTO 76.8 ± 2.3% DW, ART 77.7 ± 1.5% DW and ORA 72.0 ± 1.6% DW (Figure 7). Likewise, there was no difference in the proportional protein content of larvae among the three feed treatment groups at the final sampling (F(2,6) = 0.22, p = 0.81); i.e., OTO 73.5 ± 2.5% DW, ART 77.6 ± 4.7% DW and ORA 73.8 ± 1.9% DW (Figure 7).
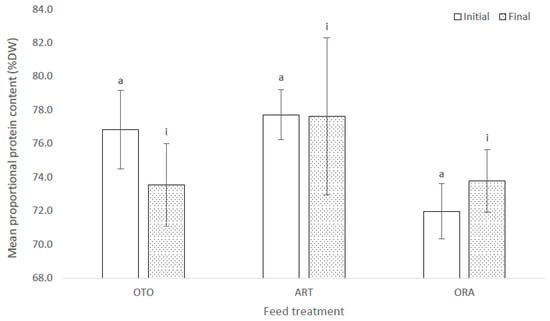
Figure 7.
Mean proportional protein content measured as a percentage of dry weight (DW) for larval giant kōkopu at initial and final sampling for three feed treatments; i.e., OTO (Otohime), ART (Artemac) and ORA (O.range) (mean ± SE). Means with different superscripts are significantly different within each of the set of three treatment means for each sampling event (p < 0.05).
There were no differences among treatments in the mean initial total protein of the larvae (F(2,6) = 1.17, p = 0.37); i.e., OTO 1.07 ± 0.04 mg, ART 1.03 ± 0.03 mg and ORA 0.96 ± 0.03 mg (Figure 8). However, there was a significant difference in the total protein of larval fish at the final sampling (F(2,6) = 13.82, p < 0.01) (Figure 8). The mean final total protein for OTO was 10.65 ± 0.67 mg, between 1.92 and 5.18 mg more than for ART (7.42 ± 0.11 mg, p = 0.01), and between 2.45 and 5.98 mg more than for ORA (6.77 ± 0.17 mg, p = 0.01) (Figure 8). There was no difference in mean final total protein between ART and ORA (p = 0.50) (Figure 8).
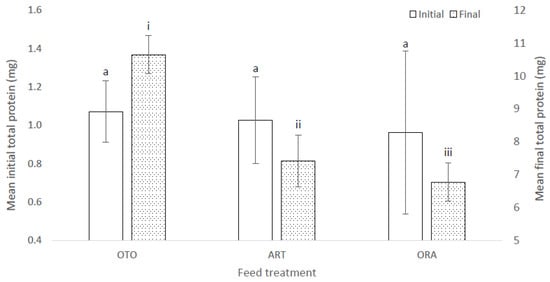
Figure 8.
Mean initial and final total protein content of larval giant kōkopu for three feed treatments; i.e., OTO (Otohime), ART (Artemac) and ORA (O.range) (±SE). Means with different superscripts are significantly different within each of the set of three treatment means for each sampling event (p < 0.05).
3.5. Fatty Acid Profiles
Thirty one fatty acids were identified across the three treatment groups with 18 fatty acids being present as >1% of total fatty acids (Table 3).
Table 3.
Mean initial and final percent fatty acid composition (±SE) of larval giant kōkopu for three feed treatments. Only fatty acids that are present at >1% are included, “Other” is the sum of all other fatty acids present at <1% (12:0, 15:0, 16:0, 16:1n-7t, 17:1-7c, 18:1n-9t, 18:3n-6c, 20:0, 20:2n-6c, 20:3n-6c, 21:0, 22:0, 24:0, 24:1n-9c). Different superscripts indicate significant differences along the row. There were no differences among initial fatty acids. ARA: arachidonic acid; DHA: docosahexaenoic acid; EPA: eicosapentaenoic acid; PUFA: polyunsaturated FA; HUFA: highly unsaturated FA.
For the initial sampling of larvae at the outset of the experiment, there were no differences for the proportion of any individual fatty acid detected among treatments (Table 3).
For the final sampling the proportions of some fatty acids differed among treatments (Table 3). ARA (F(2,6) = 6.15, p = 0.04) was higher in ORA (1.33% ± 0.03) than OTO (1.11% ± 0.03, p = 0.04) but not greater than in ART (1.27% ± 0.05, p = 0.41), while ART did not have a higher proportion of ARA than OTO (p = 0.07). EPA (F(2,6) = 56.21, p < 0.01) was higher in OTO (10.08% ± 0.08) than ART (7.73% ± 0.05, p < 0.01) and ORA (7.55 ± 0.06%, p < 0.01). DHA (F(2,6) = 21.37, p < 0.01) was proportionately higher in larvae from the ORA treatment (14.86% ± 0.11) compared to ART (11.00 ± 0.15, p < 0.01) and OTO (11.07% ± 0.08, p < 0.01).
Larvae in the ORA treatment had a higher proportion of PUFA (F(2,6) = 58.55, p < 0.01) (48.19% ± 0.12) than OTO (40.09% ± 0.08, p < 0.01) and ART (37.8% ± 0.08, p < 0.01). Likewise, HUFA (F(2,6) = 19.13, p < 0.01) were proportionately more abundant in ORA (26.66% ± 0.12), followed by OTO (24.76% ± 0.08, p < 0.05) and ART (22.11% ± 0.11, p < 0.01).
Ratios of EPA, DHA and ARA were different among treatments EPA:ARA (F(2,6) = 66.21, p < 0.01) and DHA:APA (F(2,6) = 62.97, p < 0.01), but not differ for DHA:ARA EPA (F(2,6) = 4.14, p = 0.07). OTO had the highest EPA:ARA ratio (9.15% ± 0.11), greater than that of ART (6.13% ± 0.07) (p < 0.01) and ORA (5.69% ± 0.03). ORA DHA:EPA (1.97% ± 0.03) was greater than OTO (1.10% ± 0.04) (p < 0.01) and ART (1.43 ± 0.06) (p < 0.01).
4. Discussion
The results from this experiment demonstrate the effectiveness of the artificial dry food (Otohime) for the rearing of larval giant kōkopu compared to two other commercially available artificial dry foods, ART and ORA. The OTO treatment produced giant kōkopu larvae with the greatest WW, DW, SGR, total body length and depth when compared to the ART and ORA treatments. The artificial dry food treatments did not have any influence on the proportions of either lipid or protein of the larvae at the end of the experiment. However, both the total lipid and protein content of the larvae were greater for the OTO treatment as a result of the larger overall size of the fish, than for fish provided with the ART and ORA feed treatments. At the end of the experiment there were no differences in any of the morphometric or biochemical parameters between the larvae provided with the ART and ORA treatments.
The intake of food particles is a crucial determining factor of the suitability of a feed products for larval fish and is affected by several characteristics. Perceptibility, capture/handling and palatability can impact the intake and the effectiveness of a feed item on the growth performance of larval fin fish [6]. Despite similar size and color of the different feed particles, perceptibility may have impacted on growth performances among the different dietary treatments in this experiment. The visual attractiveness of the feed, the speed at which feed particles sink through the water column of the tank and any chemical attractant can influence differences in the feeding response by the larvae [6]. Larval eyes are pigmented at hatch in giant kōkopu and relative eye size throughout the first 77 DAH of development indicate have good visual acuity [36]. However, weaning experiments show artificial feed intake is very low in the first 21 DAH indicating that these larvae are not able to recognize these feed particles [37]. Given that the current experiment included a weaning period, the non-nutritional characteristic of the artificial feed products used will have had an impact on the growth performance of larvae, potentially to the benefit of the darker colored and wider size range of Otohime. Future experiments should seek to separate out the weaning period and the artificial only period so as to determine both the best feeds by non-nutritional and nutritional characteristics and include larger feed particle items which giant kōkopu larvae have proven well adept at capturing [36,37]. The incremental increases in feed particle sizes and rates of water flow during the experiment, although kept consistent among all treatments, may have influenced food availability through affecting the period that food particles remained in suspension and available for consumption. The density and sinking rate of feed particles and their suspension via water turbulence are collectively important factors that influence feeding intake but are difficult to measure in practice [57,58].
Nutritional value is a key consideration in the selection of feed in fin fish aquaculture and is likely to have influenced the variation in growth performance amongst the feed treatments in this experiment. Formation of musculature accounts for the majority of mass increase in larval fish with dietary protein providing the amino acids required for muscle construction [59]. Dietary lipid is thought to be the primary source of energy, which is in significant demand in rapidly developing larval fish [59]. In order to realize maximal growth rates the optimum balance between the two macronutrients must be achieved [60]. The protein to energy ratio (P:E) is species-specific, with diets providing P:E ratios either side of the optimum will typically result in reduced growth. A low P:E can incur inadequate protein intake because consumption is also regulated by energetic requirements [8,44], while excessive dietary P:E lacks the energy required for catabolic and anabolic activity [8,44,61]. Despite the OTO feed treatment containing the lowest total protein (i.e., 51–51% versus 57% for ORA and 56% for ART) it is possible that the 123 mg kcal−1 P:E is most suitable or more readily available to meet the requirements of larval giant kōkopu as this treatment group achieved the greatest final mass and total protein. The ART diet has a lower P:E of 113 mg kcal−1 and corresponding with lower growth in the larvae. However, the ORA diet has a similar P:E (i.e., 124 mg kcal−1) to that of OTO, but resulted in significantly lower growth performance. This outcome exemplifies the difficulty of larval fin fish diet selection due to the complex and interacting factors characteristics of aquaculture feeds where proximate analyses and ratios alone cannot be used in isolation to determine the optimum larval diet.
Generally, the fatty acid composition of a fish is a reflection of its diet [62,63,64,65]. However, digestive capability in larval fin fish is generally poor, limited by the lack of development of organs and physiological activities required to break down feed into usable nutrients [66,67,68]. Digestibility is fundamental to the transformation of food into utilizable nutrients and subsequently biomass and it is likely that this has had a material impact on the growth performance of larvae in this trial.
The delivery of sufficient essential PUFAs through the diet is critical during larviculture because they are utilized in tissue construction, especially for vital nervous and optic tissues [14,69]. The levels of EPA, DHA and ARA in each of the treatment diets did not always correlate directly with levels of accumulation in larval tissues. Otohime and O.Range have equally high levels of DHA in the feed particles but larvae in the ORA treatment accumulated more DHA as a proportion of total fatty acids. Although Otohime has almost twice as much DHA as Artemac, larvae from the OTO and ART treatments accumulated similar relative levels of this fatty acid. Subsequently, DHA was likely not the limiting factor to growth in these feed treatment. However, for each treatment Final DHA levels were two orders of magnitude greater than respective Initials indicating the demand and possible lack of DHA in the early diet which largely consisted with Artemia nauplii. This is consistent with earlier studies where DHA appears to be absent from these live feeds and a limiting factor to growth [37]. Furthermore, it has been highlighted that, current weaning protocols in the commercial hatchery have little effect on growth performance, and that weaning could be undertaken earlier as a result may in fact also reflect the improved nutritional provision of the artificial over the live feeds [36,37].
ARA content in the three larval diets is an order of magnitude lower in the diet than EPA and DHA, and was accumulated in larval tissues to a similarly low degree. ARA is highest in O.Range, of the three diets, with larvae in the ORA treatment accumulating a higher relative proportion of ARA in tissue when compared against the other treatments. Despite the importance of ARA to early development of larvae the differences in accumulated ARA within the tissues of the larvae of each treatment indicates that higher levels of ARA are not advantageous and that the levels found in the OTO diet appear to be sufficient [15,70]. This is contrary to previous findings for other species where higher levels of ARA and lower ratios of EPA:ARA were advantageous, further indicating the likely critical importance of EPA to larval giant kōkopu development [13,20,71]. Otohime has the highest EPA proportion of the three diets tested and larvae in the OTO treatment accumulated the highest levels of EPA relative to total fatty acid content. Both Artemac and O.Range have similar, low levels of EPA (roughly half that of Otohime) and EPA accumulated in larvae was equal at the end of the experiment for the latter two treatments. Furthermore, the larvae fed the O.Range diet which has an equal proportion of DHA to Otohime and slightly more ARA, performed as poorly as larvae fed Artemac which has much lower levels of each of these fatty acids. These observations are critical as they highlight the importance of high levels of EPA to giant kōkopu growth performance, as has been noted in many other species [14,21,69,72,73,74].
Although not measured in this study, the leaching of nutrients from feed particles (i.e., the loss of water soluble compounds out of feeds) can have negative implications for the performance of the feed for provisioning for fish growth. Upon introduction of feed particles to rearing tanks, any rapid leaching of water soluble compounds represents a subsequent loss of the nutritional value of subsequently consumed feed particles to the larvae. Due to high surface area to volume ratio of larval fish microdiets as much as 50–95% of free amino acids and protein hydrolysates can be lost through leaching within minutes of being fed into water [5,68,75,76,77,78,79]. Any differences in nutrient leaching of the feeds among the three treatments may have resulted in differing biomass growth rates between feed treatments with the OTO treatment potentially being more stable and therefore better able to provide nutrients to larvae after their consumption. A further study should determine the differences in the nutrient leaching among these three weaning diets.
The experimental set up may have had an impact on the performance on the artificial feeds due to stress caused due to initially transferring larvae from the commercial tanks in which they hatched. The majority of mortality occurred in the first 48 h after larvae were transferred into the experimental tanks as has been previously observed in prior experiments with this species [80]. Furthermore, recent studies have shown that the predominance of instar-I Artemia is not optimal as a first feed for giant kōkopu larvae, potentially compounding the post-transfer stress [80]. As such, the larvae that survived and became the subjects of this study may not best represent the performance of larvae in the commercial scale setting where the transfer in particular does not occur.
Given the scale of the experimental systems water quality was easily managed, maintaining very low ammonia levels which may not be possible at commercial scale. Closely related species Galaxias maculatus and Galaxias fasciatus have demonstrated tolerance to ammonia toxicity 1.47 and 0.80 mg/L, respectively; however, future experiments on this species should confirm the species-specific optimum ranges for giant kōkopu [42]. Furthermore, to ensure the most commercially relevant information is attained, this should focus on the early larval rearing stage [81,82]. A critical learning from this experiment is that the use of full commercial scale larviculture systems would be advantageous for future experimentation to avoid any unnecessary impact on larvae performance. As previously mentioned, larval performance may have been impacted in this study through initial handling for tank transfers, low quality live feeds as well as the small experimental scale for the tank experiment. The latter of which can impact water flow dynamics, affecting larvae behavior, as well as water quality as a result of RAS performance, all of which is likely to impact the performance of the larvae themselves [83,84,85,86]. These variations need to be removed in order to attain the most commercially relevant information possible.
This study has confirmed marked differences in performance of larval giant kōkopu fed with different commercially available feeds and that examining the differences among the nutritional status of the resulting fish and that of their diet can provide insights into basis of the observed differences. EPA appears to be more critical than DHA and ARA while a high P:E ratio is also advantageous. There are still several key aspects for future research which would lead to better understanding of the variation among these artificial diets and consequently their suitability as larval giant kōkopu diets. Nutrient leaching rate on rehydration of diets may impact whether key nutrients are still available to larvae when consumed. Furthermore, understanding differences in settling rates among diets may help to identify the characteristics of artificial diets which initiates a feeding response from larval giant kōkopu. Analyses should also be undertaken to better understand the digestive capabilities of these larvae. Furthermore, additional variables should be examined, particularly mortality rates, given the impact this has on total productivity of a larviculture system. However, the present study enables a baseline for a suitable diet from which future studies can build upon to further optimize growth performance and survival from dietary provisions. Given the paucity of information on galaxiid species in aquaculture more generally, these data should also act to inform the development of techniques for closely related species globally.
Author Contributions
Conceptualisation, W.M. and A.J.; methodology, W.M.; data analyses, W.M.; writing and editing, W.M. and A.J. All authors have read and agreed to the published version of the manuscript.
Funding
This research was funded by Callaghan Innovation under project NZPWH1501/PROP-47490-FELLOW. Logistic support was provided New Zealand Premium Whitebait Ltd.
Institutional Review Board Statement
Ethical review and approval was not required for this study under New Zealand’s Animal Welfare Act 1999 because it explicitly excludes larval stages.
Data Availability Statement
The data presented in this study are available on request from the corresponding author. The data are not publicly available due to stakeholder privacy.
Acknowledgments
We would like to thank New Zealand Premium Whitebait Ltd. for the larvae and, in particular, Paul Decker and Tagried Kurwie for sharing their experiences and expertise on the larval rearing of galaxiids.
Conflicts of Interest
The authors declare no conflict of interest.
References
- Crooks, N.; Rees, W.; Black, A.; Hide, D.; Britton, J.R.; Henshaw, A. Influence of live and dry diets on growth and survival of chub (Leuciscus cephalus) Larvae. Fish. Aquac. J. 2013, FAJ-62. [Google Scholar] [CrossRef]
- Nhu, V.C.; Dierckens, K.; Nguyen, H.T.; Hoang, T.M.T.; Le, T.L.; Tran, M.T.; Nys, C.; Sorgeloos, P. Effect of early co-feeding and different weaning diets on the performance of cobia (Rachycentron canadum) larvae and juveniles. Aquaculture 2010, 305, 52–58. [Google Scholar] [CrossRef]
- Conceição, L.E.C.; Aragão, C.; Richard, N.; Engrola, S.; Gavaia, P.; Mira, S.; Dias, J. Novel methodologies in marine fish larval nutrition. Fish Physiol. Biochem. 2010, 36, 1–16. [Google Scholar] [CrossRef] [PubMed]
- Shields, R.J. Larviculture of marine finfish in Europe. Aquaculture 2001, 200, 55–88. [Google Scholar] [CrossRef]
- Hamre, K.; Yúfera, M.; Rønnestad, I.; Boglione, C.; Conceição, L.E.C.; Izquierdo, M.S. Fish larval nutrition and feed formulation: Knowledge gaps and bottlenecks for advances in larval rearing. Rev. Aquac. 2013, 5, S26–S58. [Google Scholar] [CrossRef]
- Holt, G.J. Larval Fish Nutrition; Wiley-Blackwell: Oxford, UK, 2011; pp. 1–143. ISBN 978-0-470-95986-2. [Google Scholar]
- FAO. Manual on the Production and Use of Live Food for Aquaculture; Lavens, P., Sorgeloos, P., Eds.; FAO Fisheries Technical Paper; Food and Agriculture Organisation: Rome, Italy, 1996; ISBN 978-92-5-103934-2. [Google Scholar]
- Webster, C.D.; Lim, C.E. Nutrient Requirements and Feeding of Finfish for Aquaculture; CABI: Cambridge, UK, 2001; ISBN 978-0-85199-702-5. [Google Scholar]
- Trushenski, J.T.; Kasper, C.S.; Kohler, C.C. Challenges and opportunities in finfish nutrition. N. Am. J. Aquac. 2006, 68, 122–140. [Google Scholar] [CrossRef]
- Pousão-Ferreira, P.; Santos, P.; Carvalho, A.P.; Morais, S.; Narciso, L. Effect of an experimental microparticulate diet on the growth, survival and fatty acid profile of gilthead seabream (Sparus aurata L.) larvae. Aquac. Int. 2003, 11, 491–504. [Google Scholar] [CrossRef]
- Kolkovski, S.; Tandler, A.; Kissil, G.W.; Gertler, A. The effect of dietary exogenous digestive enzymes on ingestion, assimilation, growth and survival of gilthead seabream (Sparus Aurata, Sparidae, Linnaeus) Larvae. Fish Physiol. Biochem. 1993, 12, 203–209. [Google Scholar] [CrossRef] [PubMed]
- Jones, A.C.; Mead, A.; Kaiser, M.J.; Austen, M.C.V.; Adrian, A.W.; Auchterlonie, N.A.; Black, K.D.; Blow, L.R.; Bury, C.; Brown, J.H.; et al. Prioritization of knowledge needs for sustainable aquaculture: A national and global perspective. Fish Fish. 2015, 16, 668–683. [Google Scholar] [CrossRef]
- Hauville, M.R.; Zambonino-Infante, J.L.; Bell, G.; Migaud, H.; Main, K.L. Impacts of three different microdiets on Florida pompano, Trachinotus carolinus, weaning success, growth, fatty acid incorporation and enzyme activity. Aquaculture 2014, 422–423, 268–276. [Google Scholar] [CrossRef][Green Version]
- Izquierdo, M.S. Essential fatty acid requirements of cultured marine fish larvae. Aquac. Nutr. 1996, 2, 183–191. [Google Scholar] [CrossRef]
- Sargent, J.R.; Bell, G.; McEvoy, L.; Tocher, D.; Estevez, A. Recent developments in the essential fatty acid nutrition of fish. Aquaculture 1999, 177, 191–199. [Google Scholar] [CrossRef]
- Watanabe, T.; Kiron, V. Prospects in larval fish dietetics. Aquaculture 1994, 124, 223–251. [Google Scholar] [CrossRef]
- Benítez-Santana, T.; Masuda, R.; Juárez Carrillo, E.; Ganuza, E.; Valencia, A.; Hernández-Cruz, C.M.; Izquierdo, M.S. Dietary n-3 HUFA deficiency induces a reduced visual response in gilthead seabream Sparus aurata larvae. Aquaculture 2007, 264, 408–417. [Google Scholar] [CrossRef]
- Koven, W. Key factors influencing juvenile quality in mariculture: A review. Isr. J. Aquac. 2003, 55, 283–297. [Google Scholar] [CrossRef]
- Rodríguez, C.; Pérez, J.A.; Díaz, M.; Izquierdo, M.S.; Fernández-Palacios, H.; Lorenzo, A. Influence of the EPA:DHA ratio in rotifers on gilthead seabream (Sparus aurata) larval development. Aquaculture 1997, 150, 77–89. [Google Scholar] [CrossRef]
- Tocher, D.R. Metabolism and functions of lipids and fatty acids in teleost fish. Rev. Fish. Sci. 2003, 11, 107–184. [Google Scholar] [CrossRef]
- Bell, M.V.; Batty, R.S.; Dick, J.R.; Fretwell, K.; Navarro, J.C.; Sargent, J.R. Dietary Deficiency of cocosahexaenoic acid impairs vision at low light intensities in juvenile herring (Clupea harengus L.). Lipids 1995, 30, 443–449. [Google Scholar] [CrossRef]
- McDowall, R.M. New Zealand Freshwater Fishes; Springer Netherlands: Dordrecht, 2010; ISBN 978-90-481-9270-0. [Google Scholar]
- McDowall, R.M. Diadromy in Fishes: Migrations between Freshwater and Marine Environments; Timber Press: Portland, Oregon, USA, 1988; ISBN 978-0-88192-114-4. [Google Scholar]
- McDowall, R.M. Early Hatch: A strategy for safe downstream larval transport in amphidromous gobies. Rev. Fish Biol. Fish. 2009, 19, 1–8. [Google Scholar] [CrossRef]
- Benzie, V. Some ecological aspects of the spawning behaviour and early development of the common whitebait, Galaxias maculatus attenuatus (Jenyns). Proc. N. Z. Ecol. Soc. 1968, 15, 31–39. [Google Scholar]
- Franklin, P.A.; Smith, J.; Baker, C.F.; Bartels, B.; Reeve, K. First observations on the timing and location of giant kōkopu (Galaxias argenteus) spawning. N. Z. J. Mar. Freshw. Res. 2015, 49, 419–426. [Google Scholar] [CrossRef]
- McDowall, R.M.; Mitchell, C.P.; Brothers, E.B. Age at migration from the sea of juvenile galaxias in New Zealand (Pisces: Galaxiidae). Bull. Mar. Sci. 1994, 54, 385–402. [Google Scholar]
- Mitchell, C.P. Laboratory culture of Galaxias maculatus and potential applications. N. Z. J. Mar. Freshw. Res. 1989, 23, 325–336. [Google Scholar] [CrossRef]
- McDowall, R.M. New Zealand Freshwater Fishes: A Natural History and Guide; Revised Edition; Heinemann Reed MAF Publishing Group: Auckland, New Zealand, 1990; ISBN 978-0-7900-0022-0. [Google Scholar]
- McDowall, R.M. The New Zealand Whitebait Book; Reed: Wellington, New Zealand, 1984; ISBN 978-0-589-01533-6. [Google Scholar]
- McDowall, R.M. Conservation and Management of the Whitebait Fishery; Head Office, Department of Conservation: Wellington, New Zealand, 1991; ISBN 978-0-478-01317-7. [Google Scholar]
- Main, M.R. Factors Influencing the Distribution of Kokopu and Koaro (Pisces: Galaxiidae). Ph.D. Thesis, University of Canterbury, Christchurch, New Zealand, 1988. [Google Scholar]
- Swales, S.; West, D.W. Distribution, abundance and conservation status of native fish in some Waikato streams in the North Island of New Zealand. J. R. Soc. N. Z. 1991, 21, 281–296. [Google Scholar] [CrossRef]
- Environment Southland. Whitebait Survey Summary of Results. 2013. Available online: http://Www.Es.Govt.Nz/Document%20Library/Research%20and%20reports/Various%20reports/Whitebait_survey_summary_of_results_2013.Pdf (accessed on 6 March 2017).
- O’Brien, Q.; Cooper, D. Conservation breeding of shortfin eels (Anguilla australis) and giant kokopu (Galaxias argenteus) at Mahurangi Technical Institute using aquarium and aquaculture techniques. Int. Zoo Yearb. 2013, 47, 120–128. [Google Scholar] [CrossRef]
- McKay, W.J.G.; Jeffs, A.G. Morphometric and energetic development of artificially reared giant kōkopu (Galaxias argenteus). Aquaculture 2021, 544, 737123. [Google Scholar] [CrossRef]
- McKay, W.J.G.; Jeffs, A.G. Improving the weaning of larval giant kōkopu, Galaxias argenteus: An emerging aquaculture species. J. World Aquac. Soc. 2022, jwas.12926, Online Version of Record before inclusion in an issue. [Google Scholar] [CrossRef]
- Dantagnan, P.; Bórquez, A.; Pavez, C.; Hernández, A. Feeding ω-3 PUFA enriched rotifers to Galaxias maculatus (Jenyns, 1842) larvae reared at different salinity conditions: Effects on growth parameters, survival and fatty acids profile. Lat. Am. J. Aquat. Res. 2013, 41, 404–411. [Google Scholar] [CrossRef]
- Brownell, C.L. Water quality requirements for first-feeding in marine fish larvae. I. ammonia, nitrite, and nitrate. J. Exp. Mar. Biol. Ecol. 1980, 44, 269–283. [Google Scholar] [CrossRef]
- Brownell, C.L. Water quality requirements for first-feeding in marine fish larvae. II. pH, oxygen, and carbon dioxide. J. Exp. Mar. Biol. Ecol. 1980, 44, 285–298. [Google Scholar] [CrossRef]
- West, D.W.; Boubée, J.A.T.; Barrier, R.F.G. Responses to pH of nine fishes and one shrimp native to New Zealand freshwaters. N. Z. J. Mar. Freshw. Res. 1997, 31, 461–468. [Google Scholar] [CrossRef]
- Richardson, J. Acute Ammonia toxicity for eight New Zealand indigenous freshwater species. N. Z. J. Mar. Freshw. Res. 1997, 31, 185–190. [Google Scholar] [CrossRef]
- Bonaldo, A.; Parma, L.; Badiani, A.; Serratore, P.; Gatta, P.P. Very early weaning of common sole (Solea solea L.) larvae by means of different feeding regimes and three commercial microdiets: Influence on performances, metamorphosis development and tank hygiene. Aquaculture 2011, 321, 237–244. [Google Scholar] [CrossRef]
- Csargo, I.J.; Brown, M.L.; Ward, M.J. Evaluation of four commercial grower diets for production of largemouth bass. J. Appl. Aquac. 2013, 25, 35–49. [Google Scholar] [CrossRef]
- Jobling, M. National Research Council (NRC): Nutrient requirements of fish and shrimp. Aquac. Int. 2012, 20, 601–602. [Google Scholar] [CrossRef]
- Portz, L.; Cyrino, J.E.P. Digestibility of nutrients and amino acids of different protein sources in practical diets by largemouth bass Micropterus salmoides (Lacepéde, 1802). Aquac. Res. 2004, 35, 312–320. [Google Scholar] [CrossRef]
- Gallagher, M.L. Apparent digestibility coefficients for some carbohydrates in diets for hybrid striped bass Morone saxatilis× M. Chrysops. J. World Aquac. Soc. 1997, 28, 429–431. [Google Scholar] [CrossRef]
- Thériault, I.; Pernet, F. Lipid nutrition and settlement behaviour in American lobster Homarus Americanus. Aquat. Biol. 2007, 1, 121–133. [Google Scholar] [CrossRef]
- Ricker, W.E. Handbook of Computations for Biological Statistics of Fish Populations; The Fisheries Research Board of Canada under the Control of the Honourable the Minister of Fisheries: Ottawa ON, Canada, 1958; Volume 119, pp. 1–300. [Google Scholar]
- Bligh, E.G.; Dyer, W.J. A rapid method of total lipid extraction and purification. Can. J. Biochem. Physiol. 1959, 37, 911–917. [Google Scholar] [CrossRef]
- Wang, M.; O’Rorke, R.; Nodder, S.D.; Jeffs, A.G.; Wang, M.; O’Rorke, R.; Nodder, S.D.; Jeffs, A.G. Nutritional composition of potential zooplankton prey of the spiny lobster phyllosoma (Jasus edwardsii). Mar. Freshw. Res. 2013, 65, 337–349. [Google Scholar] [CrossRef]
- Lepage, G.; Roy, C.C. Direct transesterification of all classes of lipids in a one-step reaction. J. Lipid Res. 1986, 27, 114–120. [Google Scholar] [CrossRef]
- Kramer, J.K.G.; Hernandez, M.; Cruz-Hernandez, C.; Kraft, J.; Dugan, M.E.R. Combining results of two GC separations partly achieves determination of all cis and trans 16:1, 18:1, 18:2 and 18:3 except CLA isomers of milk fat as demonstrated using Ag-ion SPE fractionation. Lipids 2008, 43, 259–273. [Google Scholar] [CrossRef]
- Jeffs, A.G.; Phleger, C.F.; Nelson, M.M.; Mooney, B.D.; Nichols, P.D. Marked depletion of polar lipid and non-essential fatty acids following settlement by post-larvae of the spiny lobster Jasus verreauxi. Comp. Biochem. Physiol. A. Mol. Integr. Physiol. 2002, 131, 305–311. [Google Scholar] [CrossRef]
- Mossoba, M.; Kramer, J.K.G. Official Methods for the Determination of Trans Fat; AOCS Press: Champaign, IL, USA, 2009. [Google Scholar]
- Zar, J.H. Biostatistical Analysis, 4th ed.; Prentice Hall: Upper Saddle River, NJ, USA, 1999; ISBN 978-0-13-081542-2. [Google Scholar]
- Rønnestad, I.; Yúfera, M.; Ueberschär, B.; Ribeiro, L.; Sæle, Ø.; Boglione, C. Feeding behaviour and digestive physiology in larval fish: Current knowledge, and gaps and bottlenecks in research. Rev. Aquac. 2013, 5, S59–S98. [Google Scholar] [CrossRef]
- Kato, Y.; Ohshima, M.; Yamashita, Y.; Kitagawa, T.; Kimura, S. Effect of larval ontogeny, turbulence, and prey density on survival in red sea bream, Pagrus major, larvae and interspecies comparison of turbulence effect. Coast. Mar. Sci. 2012, 35, 262–268. [Google Scholar]
- Qin, J.G. Larval Fish Nutrition and Rearing Technology: State of the Art and Future. In Aquaculture Research Trends; Schwartz, S.H., Ed.; Nova Science Publishers: New York, NY, USA, 2008; pp. 113–148. [Google Scholar]
- Lucas, J.S.; Southgate, P.C. Aquaculture: Farming Aquatic Animals and Plants; Blackwell Publishing Ltd.: West Sussex, UK, 2012; ISBN 978-1-118-68793-2. [Google Scholar]
- Goddard, S. Feed Management in Intensive Aquaculture; Springer US: Boston, MA, USA, 1996; ISBN 978-1-4613-1173-7. [Google Scholar]
- Salhi, M.; Bessonart, M. Growth, survival and fatty acid composition of Rhamdia quelen (Quoy and Gaimard, 1824) larvae fed on artificial diet alone or in combination with Artemia nauplii. Aquac. Res. 2012, 44, 41–49. [Google Scholar] [CrossRef]
- Turchini, G.M.; Ng, W.-K.; Tocher, D.R. Fish Oil Replacement and Alternative Lipid Sources in Aquaculture Feeds; CRC Press: Boca Raton, FL, USA, 2010; ISBN 978-1-4398-0863-4. [Google Scholar]
- Watanabe, W.O.; Alam, S.; Ostrowski, A.D.; Montgomery, F.A.; Gabel, J.E.; Morris, J.A.; Seaton, P.J. Live prey enrichment and artificial microdiets for larviculture of Atlantic red porgy Pagrus pagrus. Aquac. Rep. 2016, 3, 93–107. [Google Scholar] [CrossRef]
- Xu, H.; Turchini, G.M.; Francis, D.S.; Liang, M.; Mock, T.S.; Rombenso, A.; Ai, Q. Are fish what they eat? A fatty acid’s perspective. Prog. Lipid Res. 2020, 80, 101064. [Google Scholar] [CrossRef]
- Cousin, J.C.B.; Baudin-Laurencin, F.; Gabaudan, J. Ontogeny of enzymatic activities in fed and fasting turbot, Scophthalmus maximus L. J. Fish Biol. 1987, 30, 15–33. [Google Scholar] [CrossRef]
- Kvåle, A.; Mangor-Jensen, A.; Moren, M.; Espe, M.; Hamre, K. Development and characterisation of some intestinal enzymes in Atlantic cod (Gadus morhua L.) and Atlantic halibut (Hippoglossus hippoglossus L.) larvae. Aquaculture 2007, 264, 457–468. [Google Scholar] [CrossRef]
- Nordgreen, A.; Tonheim, S.; Hamre, K. Protein quality of larval feed with increased concentration of hydrolysed protein: Effects of heat treatment and leaching. Aquac. Nutr. 2009, 15, 525–536. [Google Scholar] [CrossRef]
- Sargent, J.R.; Tocher, D.R.; Bell, J.G. The Lipids. In Fish Nutrition (Third Edition); Halver, J.E., Hardy, R.W., Eds.; Academic Press: San Diego, CA, USA, 2003; pp. 181–257. ISBN 978-0-12-319652-1. [Google Scholar]
- Bell, J.G.; Farndale, B.M.; Bruce, M.P.; Navas, J.M.; Carillo, M. Effects of broodstock dietary lipid on fatty acid compositions of eggs from sea bass (Dicentrarchus labtax). Aquaculture 1997, 149, 107–119. [Google Scholar] [CrossRef]
- Sargent, J.R.; McEvoy, L.; Estevez, A.; Bell, G.; Bell, M.; Henderson, J.; Tocher, D. Lipid nutrition of marine fish during early development: Current status and future directions. Aquaculture 1999, 179, 217–229. [Google Scholar] [CrossRef]
- Boglino, A.; Darias, M.J.; Ortiz-Delgado, J.B.; Özcan, F.; Estévez, A.; Andree, K.B.; Hontoria, F.; Sarasquete, C.; Gisbert, E. Commercial products for Artemia enrichment affect growth performance, digestive system maturation, ossification and incidence of skeletal deformities in Senegalese sole (Solea senegalensis) larvae. Aquaculture 2012, 324–325, 290–302. [Google Scholar] [CrossRef]
- Izquierdo, M.S.; Koven, W. Lipids. In Larval Fish Nutrition; Wiley: Hoboken, NJ, USA, 2011; pp. 47–81. [Google Scholar]
- Koven, W.; Nixon-Shtupler, O.; Lutzky, S.; Ben Atia, S.; Elkayam, A.; Tandler, A. The effect of n-3 HUFA and light intensity on hunting success in gilthead sea bream (Sparus aurata). Isr. J. Aquacult. Bamidgeh. 2012, 64, 1–8. [Google Scholar]
- Baskerville-Bridges, B.; Kling, L. Development and evaluation of microparticulate diets for early weaning of Atlantic cod Gadus morhua larvae. Aquac. Nutr. 2000, 6, 171–182. [Google Scholar] [CrossRef]
- Kvåle, A.; Yúfera, M.; Nygård, E.; Aursland, K.; Harboe, T.; Hamre, K. Leaching properties of three different micropaticulate diets and preference of the diets in cod (Gadus morhua L.) larvae. Aquaculture 2006, 251, 402–415. [Google Scholar] [CrossRef]
- Nicklason, P.M.; Johnson, R.B. Real-time measurement of protein leaching from micro-particulate larval fish feeds. Aquac. Res. 2008, 39, 1793–1798. [Google Scholar] [CrossRef]
- Önal, U.; Langdon, C. Development and characterization of complex particles for delivery of amino acids to early marine fish larvae. Mar. Biol. 2005, 146, 1031–1038. [Google Scholar] [CrossRef]
- Yúfera, M.; Kolkovski, S.; Fernández-Díaz, C.; Dabrowski, K. Free Amino acid leaching from a protein-walled microencapsulated diet for fish larvae. Aquaculture 2002, 214, 273–287. [Google Scholar] [CrossRef]
- McKay, W.J.G. Advances in Larval Development and Feed Regime Optimisation for Giant Kōkopu (Galaxias argenteus). Ph.D. Thesis, University of Auckland, Auckland, New Zealand, 2022. [Google Scholar]
- Wang, W.; Wang, H.; Yu, C.; Jiang, Z. Acute toxicity of ammonia and nitrite to different ages of Pacific cod (Gadus macrocephalus) larvae. Chem. Speciat. Bioavailab. 2015, 27, 147–155. [Google Scholar] [CrossRef]
- van der Meeren, T.; Mangor-Jensen, A. Tolerance of Atlantic cod (Gadus morhua L.) larvae to acute ammonia exposure. Aquac. Int. 2020, 28, 1753–1769. [Google Scholar] [CrossRef]
- Espmark, Å.M.; Kolarevic, J.; Åsgård, T.; Terjesen, B.F. Tank size and fish management history matters in experimental design. Aquac. Res. 2017, 48, 2876–2894. [Google Scholar] [CrossRef]
- Davidson, J.; Summerfelt, S. Solids flushing, mixing, and water velocity profiles within large (10 and 150 m3) circular ‘cornell-type’ dual-drain tanks. Aquac. Eng. 2004, 32, 245–271. [Google Scholar] [CrossRef]
- Oppedal, F.; Dempster, T.; Stien, L.H. Environmental drivers of Atlantic salmon behaviour in sea-cages: A Review. Aquaculture 2011, 311, 1–18. [Google Scholar] [CrossRef]
- Holan, A.B.; Good, C.; Powell, M.D. 9—Health management in recirculating aquaculture aystems (RAS). In Aquaculture Health Management; Kibenge, F.S.B., Powell, M.D., Eds.; Academic Press: Cambridge, MA, USA, 2020; pp. 281–318. ISBN 978-0-12-813359-0. [Google Scholar]


Publisher’s Note: MDPI stays neutral with regard to jurisdictional claims in published maps and institutional affiliations. |
© 2022 by the authors. Licensee MDPI, Basel, Switzerland. This article is an open access article distributed under the terms and conditions of the Creative Commons Attribution (CC BY) license (https://creativecommons.org/licenses/by/4.0/).