Article

Individual Characteristics and Abiotic Factors Influence Out-Migration Dynamics of Juvenile Bull Trout

by
Madeline C. Lewis
1,*,†,
Christopher S. Guy
2,
Eric W. Oldenburg
3 and
Thomas E. McMahon
4
1
Montana Cooperative Fishery Research Unit, Department of Ecology, Montana State University, P.O. Box 173460, Bozeman, MT 59717, USA
2
U.S. Geological Survey, Montana Cooperative Fishery Research Unit, Department of Ecology, Montana State University, P.O. Box 173460, Bozeman, MT 59717, USA
3
Avista, Noxon Natural Resources Office, 94 Avista Power Road, Noxon, MT 59853, USA
4
Department of Ecology, Fish and Wildlife Ecology and Management Program, Montana State University, P.O. Box 173460, Bozeman, MT 59717, USA
*
Author to whom correspondence should be addressed.
Current Address: Department of Natural Resource Ecology and Management, Iowa State University, 339 Science Hall II, Ames, IA 50011, USA.
Fishes 2022, 7(6), 331; https://doi.org/10.3390/fishes7060331
Submission received: 17 October 2022 / Revised: 2 November 2022 / Accepted: 8 November 2022 / Published: 11 November 2022
(This article belongs to the Section Biology and Ecology)

Abstract

:
Fragmentation of rivers through anthropogenic modifications poses an imminent threat to the persistence of migratory fish, necessitating direct actions such as trap-and-haul programs to restore and conserve the migratory life-history component in populations of partially migratory species such as bull trout Salvelinus confluentus. We used a PIT-tag system to assess how biological and abiotic factors influence the out-migration dynamics of juvenile bull trout in Graves Creek, Montana, USA. The largest fish within a cohort were more likely to out-migrate at age 1 when compared to smaller fish within the cohort, and this was particularly evident in a high-density year-class (2018), where large bull trout out-migrated an average of 115 days earlier than bull trout in the medium size category, and 181 days earlier than bull trout in the small size category. Relative changes in abiotic factors, including discharge, water temperature, and photoperiod, appeared to act as cues to out-migration, with the direction of change varying by season. These results highlight the complex interplay between individual characteristics, population dynamics, and environmental conditions, which influence out-migration dynamics and can be used to inform management actions to conserve the migratory component in bull trout populations.

1. Introduction

Migration is a common phenomenon observed in nature, exhibited by a variety of species at varying ecological scales. While some species are obligate migrants (i.e., requiring migration to complete their life cycle), many species demonstrate partial migration [1,2]. Partial migration is the ability of a species or population to demonstrate both migratory and resident life-history strategies [1,2]. For partially migratory species, migration represents a trade-off because migration is energetically costly; however, migration can allow individuals to maximize growth potential by exploiting a diversity of resources [1,3,4]. The presence of migratory individuals has substantial effects on the dynamics of ecosystems at multiple scales [1,3] because migratory individuals can act as vectors to transport nutrients between habitats [5], facilitate gene flow among populations [6], and repopulate areas in the event of local extirpation [7].
Habitat fragmentation due to physical and thermal barriers has reduced connectivity among many freshwater habitats, to the detriment of migratory fish [8]. In the presence of barriers, the relative success of the migratory life-history strategy in populations can decrease or may be eliminated entirely [7]. Populations become dependent on resident fish to persist as the success of migration declines [6,9,10]. Resident populations are less resilient to stochasticity in the environment and become increasingly vulnerable to extirpation the longer they remain isolated [7,11].
Bull trout Salvelinus confluentus are a species of char native to the northwestern United States and western Canada that exhibit a high degree of plasticity in life-history strategies [12]. Bull trout may be resident or migratory and life-history strategies can vary within and among populations [12,13,14,15]. Variation in life-history strategies is thought to be an evolutionary adaption to allow the species to persist in variable environments [11,12]. However, formerly large, interconnected bodies of water vital to the persistence of bull trout have become increasingly fragmented as a result of physical and thermal barriers [6,9]. Fragmentation of habitats has led to declines and losses of the migratory life-history strategy in some populations [6,9,15]. In addition, climate change is likely to further the fragmentation of large habitat areas inhabited by bull trout [16,17].
Conserving the migratory life-history strategy in bull trout populations is considered a key component to ensuring long-term persistence of the species [18]. However, as connectivity in watersheds continues to decline, management actions requiring an increased degree of human intervention may be necessary to conserve migratory bull trout by ensuring connectivity between natal streams and cold-water refuges. Examples of management actions include trap-and-haul programs [19,20], where connectivity is maintained by physically transporting bull trout between natal streams and cold-water refuges, and translocations, where bull trout may be introduced into formerly uninhabited habitat areas that remain connected and undisturbed [21]. In some cases, the success of management actions hinges on the ability to restore the migratory life-history strategy in bull trout populations where it has been eliminated. Transporting resident bull trout could lead to lower return rates and removing resident individuals may be detrimental to source populations [22]. Thus, understanding the factors that ultimately lead to a population of bull trout producing out-migrants (i.e., a number of juvenile bull trout that can be captured actively out-migrating from a stream) would enable more informed and successful management actions.
Migration of fish has been described as a behavioral response to adversity [4,23]. Interspecific and intraspecific competition for resources, predator–prey dynamics, and seasonal resource availability can cause variability in the magnitude of out-migration and the age at which fish out-migrate [24,25,26]. Trade-offs between limited resources available in tributaries and an increased risk of mortality associated with migration at a young age can lead to density-dependent responses in out-migration dynamics, with fish more likely to migrate at a younger age when densities in tributaries are high and resources are limited [26,27]. However, a complex interplay of genetic, physiological, and environmental cues may influence out-migration decisions [1,3]. In this study, we sought to answer the following questions regarding the individual characteristics and abiotic factors that influenced the out-migration dynamics of juvenile bull trout: 1) how do the individual characteristics of a fish, and inter-cohort and intra-cohort densities, relate to age-at-out-migration, magnitude of out-migration, and timing of out-migration; and 2) is relative change in water temperature, discharge, and photoperiod related to peaks in out-migration? Identifying biological characteristics of out-migrating bull trout and abiotic factors that correlate with out-migration can improve our understanding of the underlying mechanisms that ultimately lead a population to adopt a migratory life-history strategy.

2. Materials and Methods
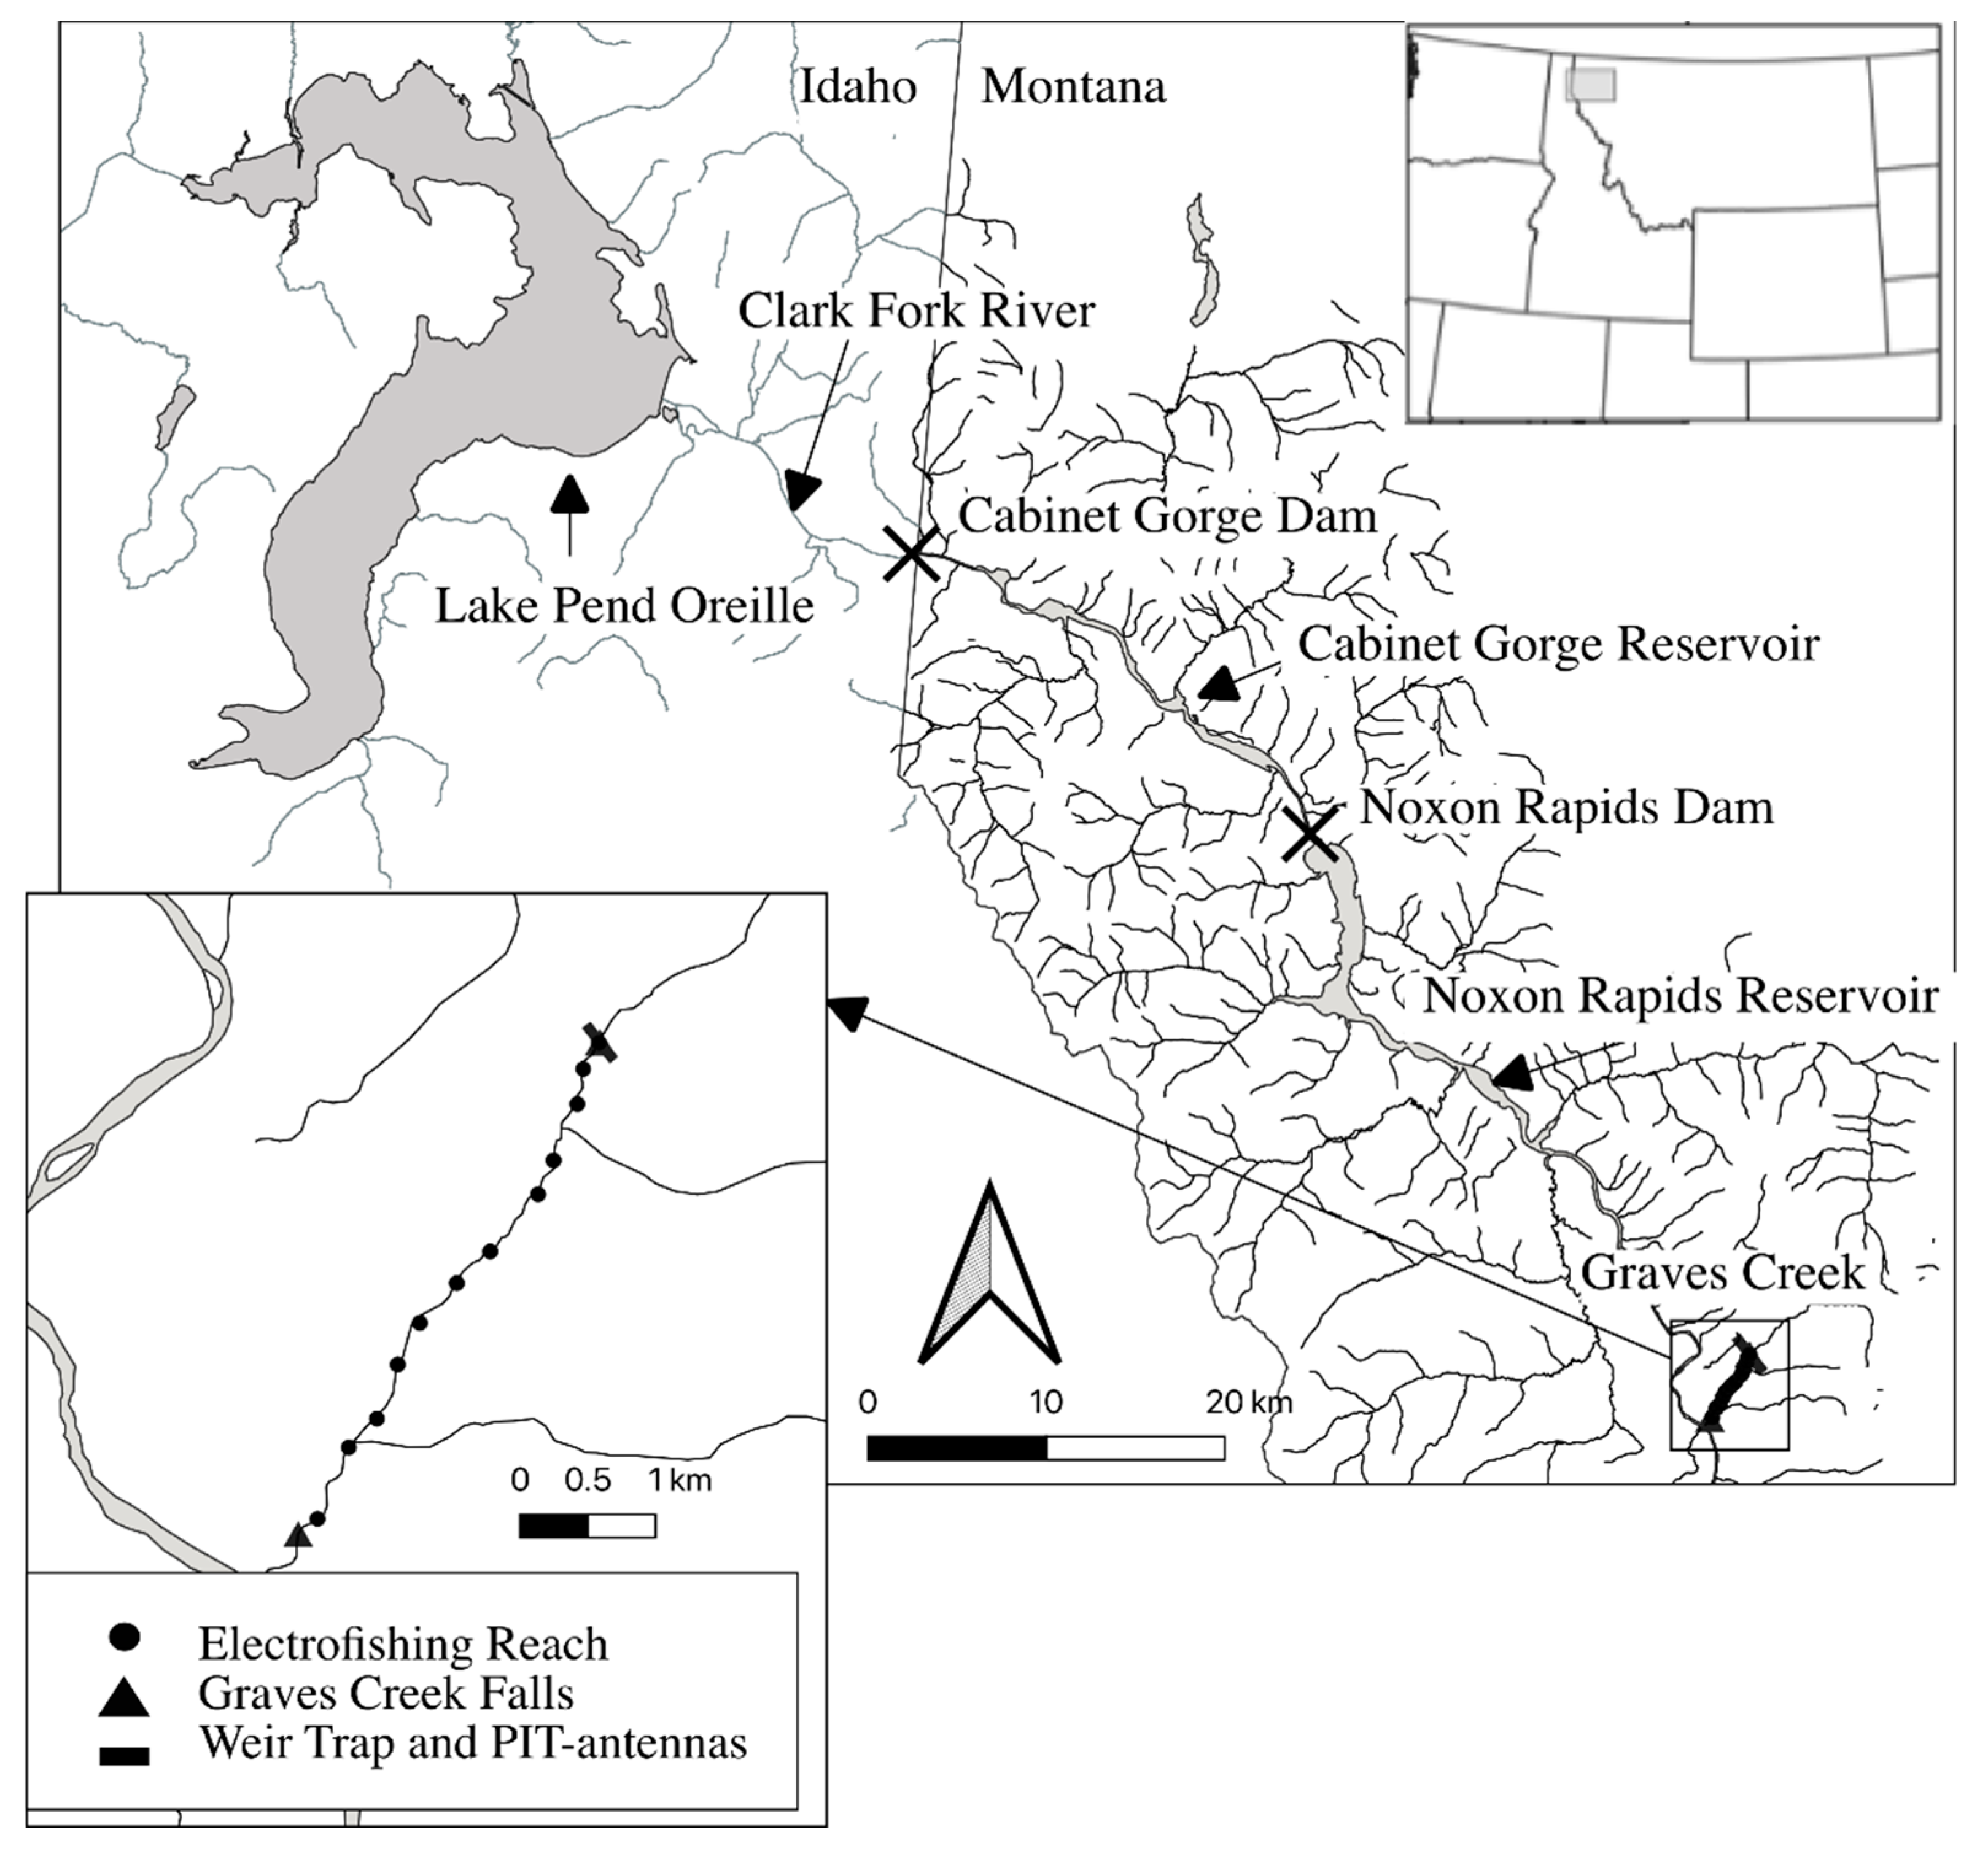
2.1. Study Area

The Clark Fork River originates near Butte, Montana, and flows in a northwest direction through western Montana before reaching Lake Pend Oreille, Idaho. The lower Clark Fork River has been altered by a series of hydropower dams and reservoirs (Figure 1). Beginning in the early 2000s, a two-way trap-and-haul program was implemented to restore connectivity between local bull trout populations in tributaries to the lower Clark Fork River and Lake Pend Oreille. Recent investments in infrastructure to better monitor the out-migration dynamics of juvenile bull trout in tributaries within the trap-and-haul program has allowed for the monitoring of out-migration year-round using PIT (passive integrated transponder) antennas. For this study, we focused on one of the primary streams within the trap-and-haul program, Graves Creek.
Graves Creek enters the north side of Noxon Reservoir as a fourth order stream with a length of about 21 km. Graves Creek Falls is a natural barrier to upstream fish passage located at river kilometer 5.2, and bull trout distribution is limited to below the falls (Figure 1). Despite the small area of habitat occupied by bull trout, Graves Creek has consistently contributed a large proportion of transports to the downstream trap-and-haul program (i.e., juvenile bull trout that are captured out-migrating and transported into Lake Pend Oreille) [20]. Bull trout and westslope cutthroat trout Oncorhynchus clarkii lewisi, are the most predominant species present below Graves Creek Falls [28]. The habitat in Graves Creek below Graves Creek Falls is primarily classified as pool–riffle stream type, with small sections of higher gradient step-pools [29]. The Graves Creek watershed is encompassed by a mix of private and public land ownership [29].

2.2. Sampling and Abundance Estimates

Juvenile bull trout were sampled once per year at twelve 100-m reaches in Graves Creek during the summer of 2019 and the summer of 2020 (Figure 1). A backpack electrofisher (Smith-Root, LR-24 model) was used in a downstream direction. All the fish sampled were measured for total length (mm), weight (g), and scanned for the presence of a PIT tag. If a PIT tag was not detected from a previous tagging event, bull trout > 100 mm were implanted with a 12-mm full duplex PIT tag. Prior to tag insertion, bull trout were anesthetized with 60–100 mg/L of MS-222 or Aqui-S. A disinfected needle or Biomark MK25 injector was used to insert the PIT tag into the anterior dorsal sinus of the bull trout. Bull trout were kept in live cars to recover before being released throughout the sampling reach. We tagged 821 juvenile bull trout in Graves Creek. The age of sampled bull trout was determined by removing scales from the area above the lateral line and below the leading edge of the dorsal fins using a clean knife. A subset of scales was aged and were used to construct a length-at-age key using the ‘FSA’ package in R [30]. The length-at-age key was used to assign ages to all the bull trout sampled, following methods outlined by Isermann and Knight [31]. Year-class was assigned based on the year that the bull trout hatched (i.e., redds in the autumn of 2017 resulted in the 2018 year-class), to enable tracking of cohorts through time.
Abundance at each electrofishing reach was estimated using a relationship derived from historical data collected from 2002 through 2018 as part of long-term monitoring in Graves Creek. Abundance estimates from historic multi-pass depletion surveys were calculated using the Zippin K-pass removal estimate with the FSA package in R [30]—surveys with a capture probability of < 0.5 were removed to avoid bias associated with low capture probabilities [32]. First pass capture numbers and subsequent abundance estimates for each survey were plotted and a linear regression model was fit to the data collected on each stream. A standardized residual cut-off of ± 3 was used to eliminate outliers. The model for Graves Creek indicated strong evidence for a relationship between the number of bull trout sampled on the first pass of a multi-pass depletion survey and the population estimate produced from that survey (b0: −0.611, b1: 1.249, r2 = 0.97, p = < 0.0001). Thus, data from the first pass were used to predict the abundance in each reach where single-pass electrofishing was used. High and low abundance estimates were based on the 95% prediction intervals from the linear model. Density (number per m2) was calculated for each reach and each year-class by reach and was the quotient from abundance and wetted area of the reach.

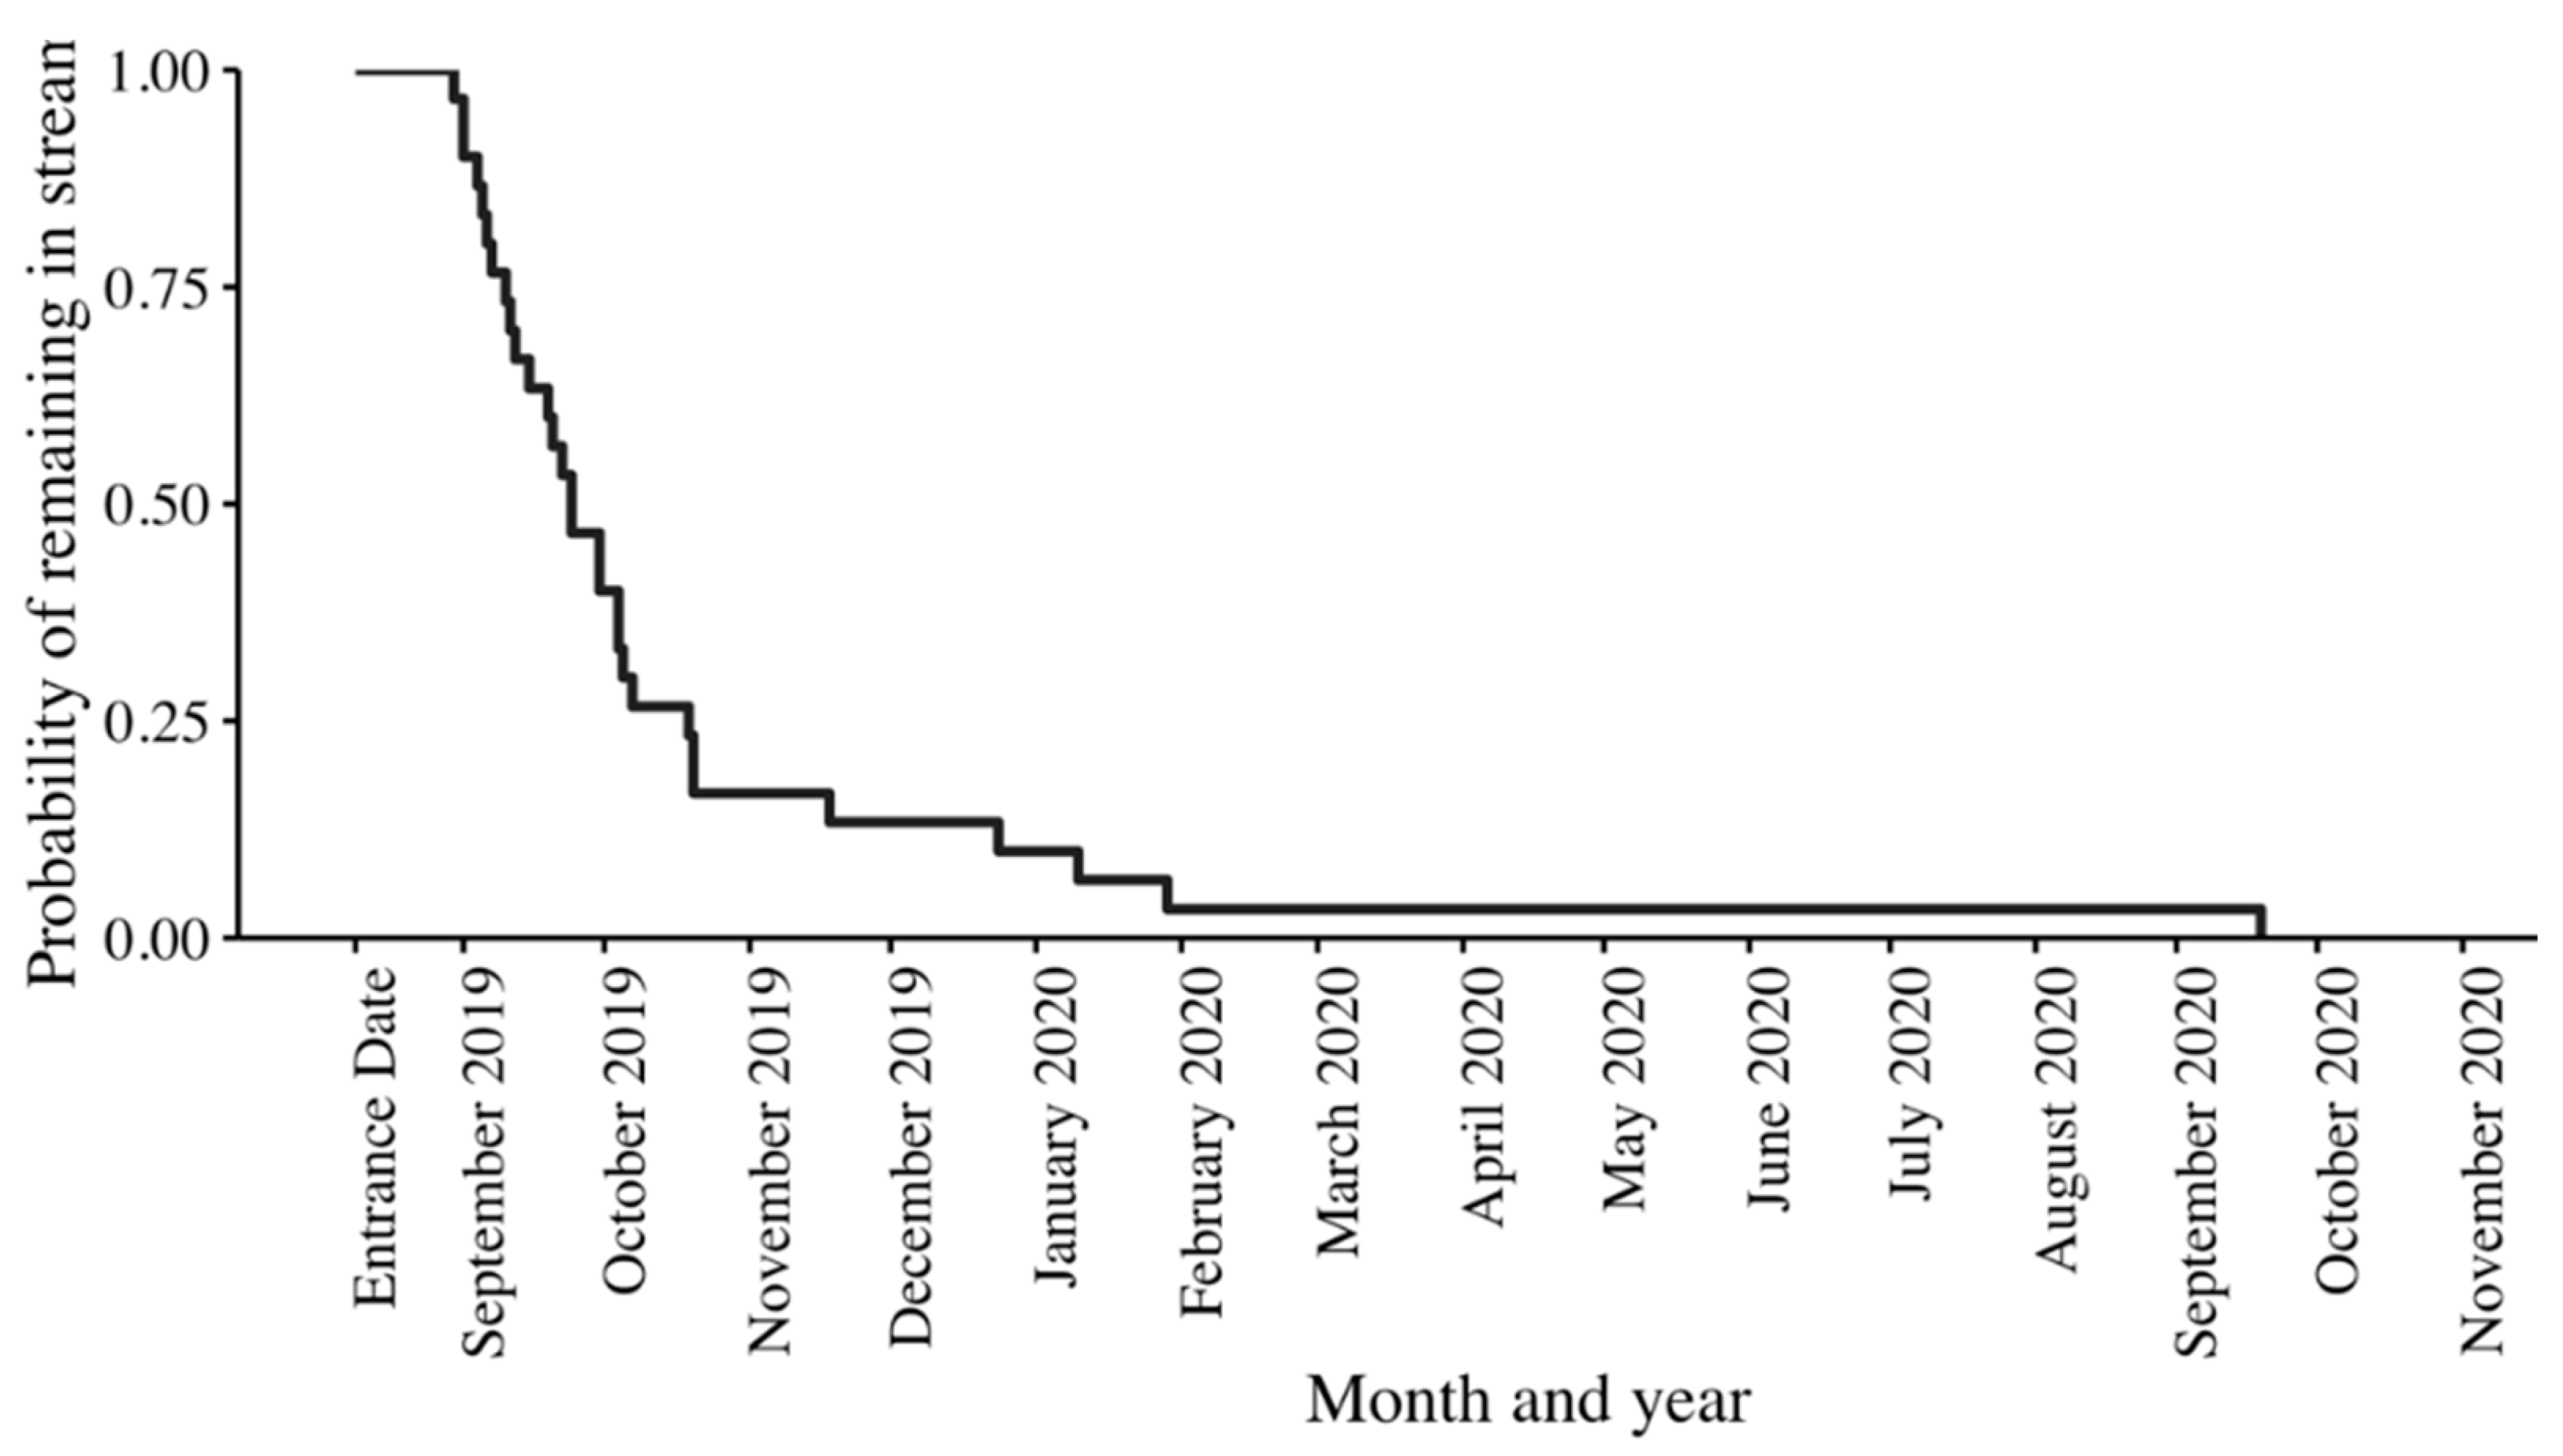
2.3. Monitoring Out-Migration

In Graves Creek, out-migration was monitored using a PIT-monitoring station located at river kilometer 0.5 (Figure 1). The PIT-monitoring station consists of four full-span antennas that are operated year-round, two upstream of the trap, two downstream of the trap, and two antennas that are integrated into the permanent weir trap. The permanent weir was constructed to capture juvenile bull trout for the trap-and-haul program, and two antennas within the trap operate when the trap is in use (September–late November and April–early July). Bull trout were considered out-migrants if detected on at least one antenna downstream of the trap, or captured in the trap, with the out-migration date considered as the last date that the fish were detected.

2.4. Abiotic Factors

Water temperature data were collected from temperature loggers (OnSet HOBO TidbiT V2) placed in each electrofishing reach that recorded water temperature (°C) at 30-min intervals. Discharge data (m3/s) were collected at a stream gauging site located near the permanent weir trap in Graves Creek. The photoperiod was estimated for the appropriate latitude and dates using the ‘geosphere’ package in R [33].

2.5. Individual Characteristics Influencing Age and Timing of Out-Migration

Time-to-event analysis was used to evaluate whether the individual characteristics of a bull trout were related to time to out-migration. Time-to-event analysis was implemented using bull trout from the 2019 year-class, initially encountered at age 1 in 2020, bull trout from the 2018 year-class, initially encountered at age 1 in 2019, and bull trout from the 2017 year-class, initially encountered at age 2 in 2019. The sample for the analysis only consisted of bull trout that out-migrated during the study. We did not include tagged fish that did not out-migrate because we could not discern whether the fish were mortalities or remained in the stream. The entrance date for time-to-event analysis was 10 August 2019, for bull trout from the 2018 and 2017 year-class, and 1 September 2020, for bull trout from the 2019 year-class.
Two variables (i.e., total length (mm), relative condition) were selected based on prior hypotheses regarding bull trout out-migration. Length at the time of summer electrofishing was included and used as a surrogate of growth rate. Relative condition factor (Kn; [34]) was calculated and included as an index to body condition. The Kaplan–Meier product limit method, a non-parametric maximum likelihood step function that evaluates the probability of an event occurring (in our case, out-migration) for a given group over time was used to evaluate the effects of each variable on time-to-out-migration [35]. To enable visualization of time-to-event curves, each variable was divided into three categories (quantiles of equal size) and fish were assigned into the categories (Table 1). Kaplan–Meier curves were fit for each category within a variable using the ‘survival’ package in R [36]. A log-rank test was performed to determine whether curves differed by category [36].

2.6. Inter-Annual Variation in Density and Magnitude of Out-Migration by Age Class

To evaluate the potential for density-dependent out-migration, we assessed interannual variation in the year-class specific density of bull trout, and the number of out-migrating bull trout by year-class. In Graves Creek, density is the mean overall density of each year-class during the summer sampling season, calculated as described above. The magnitude of out-migration by year-class and age was compared between the autumn out-migration events in 2019 (4 September 2019–27 November 2019) and 2020 (2 September 2020–20 November 2020), and the spring out-migration events in 2020 (15 April 2020–2 July 2020) and 2021 (29 March 2021–2 July 2021).

2.7. Abiotic Cues to Out-Migration

Changepoint analysis was implemented to assess whether changes in abiotic factors act as cues to juvenile bull trout out-migration in Graves Creek. Changepoint analysis identifies the points in a time series where the statistical properties of the time series demonstrate a change [37]. The ‘changepoint’ package in R was used to identify changepoints in the time series of abiotic factors, with the pruned exact linear time (PELT) method, with a minimum segment length of 30 days [37,38]. Water temperature data were summarized using the daily mean water temperature at a single reach within each stream. Reach 1, the downstream most reach, in Graves Creek was selected for water temperature data because this allowed for the longest period of time to be included in the analysis (Figure 1). Time series began two days after the temperature loggers were placed, which was 25 July 2019 for Graves Creek. Time series were created for mean daily water temperature, maximum daily discharge, and photoperiod. The time series of maximum discharge was natural log-transformed to reduce the skewness.
For water temperature and discharge, changepoints were based on the mean and variance, and for the photoperiod, changepoints were based on the mean. Changepoints were subsequently plotted with the time series of bull trout out-migrating per day to examine whether the changepoints acted as potential cues to out-migration, as evidenced by changepoints preceding major out-migration events.

3. Results

3.1. Biological Characteristics Influencing Age and Timing of Out-Migration

Length category at time of tagging influenced time-to-out-migration (log-rank test: c2 = 9.1, df = 2, p = 0.01) for bull trout from the 2019 year-class that were initially encountered at age 1 in 2020 (n = 21), with large fish more likely to out-migrate early in the study period, followed by fish from the small category, with fish in the medium category having the longest time to out-migration (Figure 2). The median time to out-migration (defined as the point when probability of remaining in the stream = 0.5) was 281.5 days for bull trout in the small category (n = 6; TL (mm): 105–111), 293 days for bull trout in the medium category (n = 7; TL (mm): 111–116), and 175 days for bull trout in the large category (n = 8; TL (mm): 116–129). Relative condition factor did not influence time to out-migration for bull trout from the 2019 year-class (log-rank test: c2 = 4.8, df = 2, p = 0.09).
Length category at time of tagging influenced time-to-out-migration (log-rank test: c2 = 83.3, df = 2, p < 0.0001) for bull trout from the 2018 year-class that were initially encountered at age 1 (n = 224), with large fish more likely to out-migrate early in the study period (Figure 3). The median time to out-migration was 338.5 days for bull trout in the small category (n = 70; TL (mm): 100–110), 262 days for bull trout in the medium category (n = 74; TL (mm): 110–118), and 76.5 days for bull trout in the large category (n = 80; TL (mm): 118–138). Relative condition factor also influenced time to out-migration for bull trout from the 2018 year-class, although the effect was less substantial than the effect of length (log-rank test: c2 = 8.8, df = 2, p = 0.01) (Figure 4). The median time to out-migration was shortest for bull trout in the high condition category (n = 74; 1.1–1.2) at 257.5 days, followed by bull trout in the medium category (n = 74; 0.99–1.0) at 264.5 days, and longest for bull trout in the low condition category (n = 74; 0.81–0.98) at 266 days (Figure 4).
None of the categories for any variable (i.e., length, condition) predicted time to out-migration for juvenile bull trout from the 2017 year-class that were initially encountered at age 2 (n = 30) (length [log-rank test: c2 = 0.1, df = 2, p = 0.97], condition [log-rank test: c2 = 0.2, df = 2, p = 0.92]). The median time-to-out-migration for bull trout from the 2017 year-class was 46 days (Figure 5).

3.2. Inter-Annual Variation in Density and Magnitude of Out-Migration by Age Class

The overall mean density of juvenile bull trout in Graves Creek was higher in 2019 compared to 2020 (Table 2). The proportion of autumn out-migrating bull trout that were age 1 varied considerably between the two autumn trapping seasons, from 74% in 2019 to 5% in 2020 (Table 2). In autumn of 2019, 90 bull trout out-migrated and 67 were age 1 from the 2018 year-class, 22 were age 2 from the 2017 year-class, with 1 fish from the 2016 year-class (Table 2). In autumn of 2020, 102 bull trout out-migrated and 5 were age-1 bull trout from the 2019 year-class, 96 were age 2 from the 2018 year-class, and 1 was age 3 (Table 2). The magnitude of spring out-migration varied considerably between 2020 and 2021 (Table 2). In the spring of 2020, a total of 86 tagged bull trout out-migrated and were age 2 from the 2018 year-class. In the spring of 2021, the overall number of out-migrants was 22, and the majority of spring out-migrants were age 2 from the 2019 year-class; however, 9 bull trout from the 2018 year-class out-migrated at age 3 (Table 2).

3.3. Abiotic Cues to Out-Migration

Changepoints in natural log of maximum discharge, water temperature, and photoperiod preceded out-migration events in Graves Creek with the direction of the changepoints varying by season. In Graves Creek, 12 changepoints were identified in the mean and variance of log-maximum discharge (Figure 6). In autumn 2019, out-migration was occurring as discharge was reaching base flows (Figure 6). In late October 2019, a small positive changepoint in discharge, increasing from a mean natural log-maximum discharge of −1.17 m3/s to −0.98 m3/s, preceded the largest peak in out-migration (Figure 6). Out-migration in April 2020 began as mean log-maximum discharge increased from −1.46 m3/s to 1.00 m3/s and peaked immediately following a large positive changepoint from a mean of 1.00 m3/s to 1.60 m3/s (Figure 6). Out-migration continued through the peak in discharge and began to taper off as discharge declined in mid-June 2019 (Figure 6). In the autumn of 2020, steady out-migration began as discharge declined to a mean of −0.79 m3/s and peaked once discharge reached −1.15 m3/s (Figure 6). In the spring of 2021, out-migration began with a large peak which coincided with a large positive change point in discharge from a mean of −0.86 m3/s to a peak of 1.19 m3/s (Figure 6).
Fourteen changepoints in the mean and variance of mean daily water temperature were identified (Figure 7). In autumn 2019, out-migration occurred prior to the first negative changepoints in water temperature (Figure 7). A large negative changepoint in water temperature occurred in late September 2019 and preceded the largest peak in out-migration, with the mean water temperature dropping from 9.9 °C to 5.4 °C (Figure 7). Immediately following the peak in out-migration, the mean water temperature dropped to 2.6 °C, and out-migration declined, with only a few out-migration events occurring in November and December 2019 (Figure 7). The mean water temperature remained near 2.6 °C, with sporadic out-migration, until mid-March 2020 when the mean water temperature increased to 4.2 °C, and out-migration began (Figure 7). Out-migration peaked as the mean water temperature increased to 5.8 °C (Figure 7). Out-migration tapered off in mid-June as the mean water temperatures increased to 7.9 °C. Similar to autumn 2019, out-migration began in autumn 2020 prior to the first negative changepoints in water temperature. Out-migration peaked following the first negative changepoint in mean water temperature, with the mean water temperature declining from 10.1 °C to 8.4 °C, and another peak in out-migration occurred at the next negative changepoint, where the mean water temperature declined to 4.5 °C (Figure 7). Out-migration tapered off following the next negative change point and remained low over the winter (Figure 7). Out-migration in the spring began with a peak following a change point to a mean temperature of 5.8 °C (Figure 7).
Twelve changepoints were identified in the mean of the photoperiod (Figure 8). Due to the smooth and cyclic nature of the photoperiod, changepoints are evenly spaced other than in the intervals of summer and winter (Figure 8). The relationship between change points in photoperiod and out-migration was inconsistent between the years. In autumn 2019 and autumn 2020, out-migration was associated with negative changepoints in photoperiod; however, out-migration peaked in the autumn of 2019 later than in 2020 (Figure 8). In the spring of 2020, positive changepoints in photoperiod preceded out-migration; however, out-migration continued through the summer solstice, and in the spring of 2021, out-migration did not begin until after the peak in mean photoperiod was reached (Figure 8).

4. Discussion

Our results highlighted that multiple interrelated processes interact to influence variation in the out-migration dynamics of juvenile bull trout. Age at out-migration was related to the individual characteristics of bull trout, and the strength of this effect varied with changes in population density and year-class strength. Changes in abiotic factors preceded the initiation of out-migration events, and peaks in out-migration during out-migration events, with the direction of change varying based on the season.
At the individual level, length (surrogate for growth rate) was correlated with time to out-migration for bull trout initially tagged at age 1 in Graves Creek. The relationship between growth and migration has been studied in anadromous, fluvial, and adfluvial salmonids [39,40,41,42,43]. It is hypothesized that migration is a behavioral response to a lack of resources needed to reach maturity in natal streams with limited resources and low productivity [4]. Within migratory populations of salmonids, growth rate can influence the age or size when a fish will out-migrate [39,42,43]. A high metabolic rate associated with fast growth may result in faster-growing individuals becoming energetically limited earlier in life than slower growing conspecifics, causing fast-growing fish to out-migrate and seek more abundant resources at a younger age and smaller size than slower growing fish in the same cohort [41,42,43]. A lower metabolic rate may enable fish to remain in their natal stream longer, allowing slow-growing fish to reach a larger size before out-migrating with less risk [4,41,42].
Our results supported the hypothesis that faster growing fish are more likely to out-migrate from the stream at a younger age. The smallest bull trout from 2018 were the most likely to remain in Graves Creek, and the largest and highest condition fish were the most likely to out-migrate at age 1. However, we found that the magnitude of the effect that growth rate may have on age-at-out-migration is likely mediated by other factors, such as density. The largest bull trout from the lower density 2019 year-class were still more likely to out-migrate at age 1; however, the overall magnitude of age-1 out-migration was substantially less in the autumn of 2020 when compared to the autumn of 2019. At high densities, both intercohort and intracohort competition may exacerbate the energetic limits of fast-growing age-1 fish, leading to increased out-migration at age 1. For the 2017 year-class of bull trout in Graves Creek, that were initially encountered in the summer of 2019 at age 2, we did not identify any biological factors that related to time to out-migration. Most out-migration occurred in the autumn, with a small number remaining in the stream to reach age 3. The out-migration of age-2 bull trout regardless of individual characteristics supports what has been found in other adfluvial bull trout populations, where the magnitude of age-1 out-migration was positively related with the density of bull trout in a stream, whereas out-migration for age-2 and older bull trout was consistently high and not correlated with density [26,27]. In small, habitat-limited streams such as Graves Creek, it is likely that once bull trout reach a certain age or size, migration becomes obligatory regardless of individual characteristics. The exact age or size of the bull trout when migration becomes obligatory likely varies among streams and temporally within streams as conditions change (e.g., resource availability or density).
Although density may be a common and easily observed driver of early out-migration, the above evidence indicates that, fundamentally, out-migration may be driven by a demand for resources (e.g., food, territory) that exceeds the supply in the stream [4]. Thus, even at low densities, it is plausible that any mechanism that reduces the supply of resources may lead to a greater majority of fish out-migrating at a young age. The mechanism could be a stochastic environmental event (e.g., drought), or a long-term trend that reduces the available habitat or resources (e.g., increasing stream temperatures). There is evidence that bull trout that out-migrate at a younger age will have reduced survival to sexual maturity [26,27,44,45]. Given the survival implications, continued monitoring of populations to discern potential drivers of early out-migration will aid in informing management strategies to maximize the probability of survival to age at maturity.
The changepoint analysis indicated that relative changes in abiotic conditions may act as cues to out-migration. While some changes may act as cues to initiate migration, others may represent conditions that are selected for after out-migration has been initiated. For example, although out-migration began as discharge declined in the autumn, small, positive changepoints in discharge in the autumn preceded peaks in out-migration. Changing abiotic factors during the spring and autumn may create periods where the supply and demand for resources is mismatched in the stream, leading to increased out-migration. We found that positive changepoints in water temperature in the spring preceded the initiation of the spring out-migration event. As ectotherms, the metabolism and energetic demands of salmonids are highly influenced by water temperature [46]. As the water temperature increases from winter to spring, salmonids can experience a significant increase in metabolic rate and growth [47]. If productivity and food availability in a stream increase at a rate that is slower than the increase in the energetic demands of bull trout, out-migration may be initiated. In other migratory salmonids, the proportion of smolts in the spring was related to food availability and fish size, with large fish that experienced reduced feed rations being the most likely to begin smolting (indicating out-migration) [48]. The proportion of smolts declined with increased food availability, and smaller fish were less likely to smolt [48], indicating support that energetic demand was the mechanism for spring out-migration. However, labratory studies have indicated that increasing water temperature alone may not lead to smolting, rather an interaction between increasing water temperature and changing photoperiod explains spring out-migration [49,50]. We found similar responses of bull trout out-migration to changepoints in time series of the photoperiod and water temperature in the spring, however the correlation between water temperature and photoperiod makes it difficult to identify an interaction in a natural setting. A small positive changepoint in maximum discharge preceded the initial out-migration during the spring in Graves Creek, and out-migration peaked as the mean maximum spring discharge was reached. Past studies have indicated that the relationship between discharge and out-migration in the spring can vary among salmonid species and among populations of salmonids [51,52]. In some populations of salmonids, increased discharge in the spring may act as a cue to out-migration [51,52]. However, in other populations, increasing discharge appears to have a negative effect on out-migration and may act as a cue to cease out-migration [51,52]. The lack of a consistent relationship between increasing discharge and out-migration of salmonids in the spring may indicate that local adaptions influence how populations respond to abiotic cues [52]. Conversely, increased discharge may not be a primary cue to initiate spring out-migration and observed relationships may be a result of seasonal correlation [51]. Spring out-migration of juvenile bull trout occurs in the Metolius River which lacks a large spring peak in discharge due to groundwater influence, providing evidence that discharge may not be a primary cue to out-migration for bull trout in the spring [27]. If other abiotic factors such as water temperature have a stronger influence on out-migration timing in the spring than discharge, changing abiotic conditions could lead to out-migration occurring before or after peak discharge. Out-migrating during periods of high discharge may increase the survival of out-migrating bull trout by reducing energetic costs and decreasing migration times [53,54], therefore, a mismatch in the timing of out-migration relative to peak discharge could potentially lead to lower survival rates of spring out-migrating bull trout.
In Graves Creek, negative changepoints in discharge preceded out-migration in the autumn. As discharge declines and approaches base flows in the autumn, the area of available habitat in streams is reduced. Although it would be expected that competition for habitat would result in smaller and less dominant fish out-migrating, the balance of survival in-stream over the winter and predation risk may explain why we observed the larger fish of a cohort out-migrating prior to winter [24]. As fish increase in size, they have increased energetic demands, making them more likely to starve in small headwater streams over winter, and they become less vulnerable to predators that may be encountered in larger, more productive environments [24]. Therefore, the risk from over wintering starvation in small, headwater streams may outweigh the risk of predation in larger, more productive [24]. Although out-migration began in the autumn following negative changepoints in discharge, a positive changepoint in discharge preceded the peaks in out-migration in the autumn 2019. Therefore, local increases in discharge may encourage out-migration by lessening the risks and energetic costs of migration [53,54]. In both summers in Graves Creek, out-migration began prior to the initial negative changepoints in water temperature. Out-migration preceding changepoints in water temperature indicates that water temperature may not be the primary cue to initiate out-migration in the autumn. However, as the season progressed, negative changepoints in water temperature did precede major out-migration events. Declining water temperatures and shortened photoperiods may act as a cue for bull trout to begin movements to overwintering habitats [55].
Given the inherent seasonality of changing environmental conditions, and thus correlation among variables, it is difficult to understand the relative importance of each individual environmental cue in an uncontrolled natural setting. An additional challenge when attempting to understand the influence that abiotic factors have on the magnitude of out-migration is that the relationship between out-migrating bull trout and abiotic factors may change throughout a season. Changes in abiotic factors can act as cues to begin out-migration; however, once all ‘eligible’ out-migrants have out-migrated, migration may decline even if the abiotic conditions remain the same [52]. However, the relative importance and potential interaction among cues have implications for the conservation of migratory bull trout. As climate change alters thermal regimes, and human development continues to alter natural flow regimes, it will be vital to understand if and how migration cues may be altered. Further research into the biological characteristics of and environmental cues to bull trout out-migration in a variety of streams, in conjunction with research conducted in controlled environments, will aid in furthering the understanding of what factors or combination of factors influence bull trout out-migration dynamics.

5. Conclusions

Our results highlight the complexity in the relationship between the biological characteristics of individual bull trout, population dynamics, and abiotic factors that ultimately lead to out-migration. We found support for the hypothesis that out-migration of bull trout is driven by density-dependent processes ([26,27,56], which has implications for the restoration of the migratory life-history strategy in bull trout populations. If the migratory life-history strategy in a population becomes less successful (i.e., migratory adults begin to return at lower numbers or fail to return), densities will decline. As density declines, the demand for resources will be lowered, therefore the remaining bull trout may begin to adopt a resident life-history strategy [44]. Due to lowered fecundity associated with smaller size-at-maturity, resident populations are likely to remain at low densities [12]. To restore the migratory life-history strategy, the density of the population would need to increase to a point at which demand for resources exceeds the supply of resources in a stream, initiating density-dependent out-migration. Increasing densities may require the translocation of large, fecund migratory adult bull trout, and active management actions such as trap-and-transport programs to ensure the continued existence of the migratory behavior of bull trout.

Author Contributions

Conceptualization, M.C.L., C.S.G., E.W.O. and T.E.M.; methodology, M.C.L., C.S.G., E.W.O. and T.E.M.; validation, M.C.L., C.S.G., E.W.O. and T.E.M.; formal analysis, M.C.L. and C.S.G.; investigation, M.C.L., C.S.G., E.W.O. and T.E.M.; resources, C.S.G. and E.W.O.; data curation, M.C.L.; writing—original draft preparation, M.C.L.; writing—review and editing, M.C.L., C.S.G., E.W.O. and T.E.M.; visualization, M.C.L.; supervision, C.S.G. and E.W.O.; project administration, C.S.G. and E.W.O.; funding acquisition, C.S.G. and E.W.O. All authors have read and agreed to the published version of the manuscript.

Funding

Funding was provided by Avista through the Clark Fork Settlement Agreement.

Institutional Review Board Statement

This study was performed under the auspices of Institutional Animal Care and Use Protocol 2018-89-78 at Montana State University.

Data Availability Statement

Data are available upon request.

Acknowledgments

We thank personnel from the Clark Fork Aquatic Implementation Team for their input and review of the study. The Montana Cooperative Fishery Research Unit is jointly sponsored by Montana State University; Montana Fish, Wildlife, and Parks; and the U.S. Geological Survey. Any use of trade, firm, or product names is for descriptive purposes only and does not imply endorsement by the U.S. Government.

Conflicts of Interest

The authors declare no conflict of interest.

References

  1. Chapman, B.B.; Brönmark, C.; Nilsson, J.-Å.; Hansson, L.-A. The Ecology and Evolution of Partial Migration. Oikos 2011, 120, 1764–1775. [Google Scholar] [CrossRef]
  2. Kerr, L.A.; Secor, D.H.; Piccoli, P.M. Partial Migration of Fishes as Exemplified by the Estuarine-Dependent White Perch. Fish. Res. 2009, 34, 114–123. [Google Scholar] [CrossRef]
  3. Chapman, B.B.; Hulthén, K.; Brodersen, J.; Nilsson, P.A.; Skov, C.; Hansson, L.-A.; Brönmark, C. Partial Migration in Fishes: Causes and Consequences. J. Fish Biol. 2012, 81, 456–478. [Google Scholar] [CrossRef] [PubMed] [Green Version]
  4. Thorpe, J.E. An Alternative View of Smolting in Salmonids. Aquaculture 1994, 121, 105–113. [Google Scholar] [CrossRef]
  5. Swanson, H.K.; Kidd, K.A.; Reist, J.D. Effects of Partially Anadromous Arctic Charr (Salvelinus alpinus) Populations on Ecology of Coastal Arctic Lakes. Ecosystems 2010, 13, 261–274. [Google Scholar] [CrossRef]
  6. Rieman, B.E.; Allendorf, F.W. Effective Population Size and Genetic Conservation Criteria for Bull Trout. N. Am. J. Fish. Manag. 2001, 21, 756–764. [Google Scholar] [CrossRef]
  7. Morita, K.; Yamamoto, S. Effects of Habitat Fragmentation by Damming on the Persistence of Stream-Dwelling Charr Populations. Conserv. Biol. 2002, 16, 1318–1323. [Google Scholar] [CrossRef]
  8. Tamario, C.; Sunde, J.; Petersson, E.; Tibblin, P.; Forsman, A. Ecological and Evolutionary Consequences of Environmental Change and Management Actions for Migrating Fish. Front. Ecol. Evol. 2019, 7, 271. [Google Scholar] [CrossRef] [Green Version]
  9. Rieman, B.E.; Lee, D.C.; Thurow, R.F. Distribution, Status, and Likely Future Trends of Bull Trout within the Columbia River and Klamath River Basins. N. Am. J. Fish. Manag. 1997, 17, 1111–1125. [Google Scholar] [CrossRef]
  10. Branco, P.; Amaral, S.D.; Ferreira, M.T.; Santos, J.M. Do Small Barriers Affect the Movement of Freshwater Fish by Increasing Residency? Sci. Total Environ. 2017, 581–582, 486–494. [Google Scholar] [CrossRef]
  11. Dunham, J.B.; Rieman, B.E. Metapopulation Structure of Bull Trout: Influences of Physical, Biotic, and Geometrical Landscape Characteristics. Ecol. Appl. 1999, 9, 642–655. [Google Scholar] [CrossRef]
  12. Rieman, B.E.; Mclntyre, J.D. Demographic and Habitat Requirements for Conservation of Bull Trout. Gen. Tech. Report. 1993, 302, 38. [Google Scholar] [CrossRef]
  13. Al-Chokhachy, R.; Budy, P. Demographic Characteristics, Population Structure, and Vital Rates of a Fluvial Population of Bull Trout in Oregon. Trans. Am. Fish. Soc. 2008, 137, 1709–1722. [Google Scholar] [CrossRef]
  14. Howell, P.J.; Colvin, M.E.; Sankovich, P.M.; Buchanan, D.V.; Hemmingsen, A.R. Life Histories, Demography, and Distribution of a Fluvial Bull Trout Population. Trans. Am. Fish. Soc. 2016, 145, 173–194. [Google Scholar] [CrossRef]
  15. Nelson, M.L.; McMahon, T.E.; Thurow, R.F. Decline of the migratory form in bull charr, Salvelinus confluentus, and implications for conservation. Environ. Biol. Fishes 2002, 64, 321–332. [Google Scholar] [CrossRef]
  16. Rieman, B.E.; Isaak, D.; Adams, S.; Horan, D.; Nagel, D.; Luce, C.; Myers, D. Anticipated Climate Warming Effects on Bull Trout Habitats and Populations Across the Interior Columbia River Basin. Trans. Am. Fish. Soc. 2007, 136, 1552–1565. [Google Scholar] [CrossRef]
  17. Al-Chokhachy, R.; Schmetterling, D.; Clancy, C.; Saffel, P.; Kovach, R.; Nyce, L.; Liermann, B.; Fredenberg, W.; Pierce, R. Are Brown Trout Replacing or Displacing Bull Trout Populations in a Changing Climate? Can. J. Fish. Aquat. Sci. 2016, 73, 1395–1404. [Google Scholar] [CrossRef]
  18. USFWS Recovery Plan for the Coterminous United States Population of Bull Trout (Salvelinus confluentus). 2015. Available online: https://ecos.fws.gov/docs/recovery_plan/Final_Bull_Trout_Recovery_Plan_092915-corrected.pdf (accessed on 1 June 2021).
  19. Neraas, L.P.; Spruell, P. Fragmentation of Riverine Systems: The Genetic Effects of Dams on Bull Trout (Salvelinus confluentus) in the Clark Fork River System. Mol. Ecol. 2001, 10, 1153–1164. [Google Scholar] [CrossRef]
  20. DeHaan, P.W.; Bernall, S.R. Spawning Success of Bull Trout Transported above Main-Stem Clark Fork River Dams in Idaho and Montana. N. Am. J. Fish. Manag. 2013, 33, 1269–1282. [Google Scholar] [CrossRef]
  21. Galloway, B.T.; Muhlfeld, C.C.; Guy, C.S.; Downs, C.C.; Fredenberg, W.A. A Framework for Assessing the Feasibility of Native Fish Conservation Translocations: Applications to Threatened Bull Trout. N. Am. J. Fish. Manag. 2016, 36, 754–768. [Google Scholar] [CrossRef]
  22. Al-Chokhachy, R.; Moran, S.; McHugh, P.A.; Bernall, S.; Fredenberg, W.; DosSantos, J.M. Consequences of Actively Managing a Small Bull Trout Population in a Fragmented Landscape. Trans. Am. Fish. Soc. 2015, 144, 515–531. [Google Scholar] [CrossRef]
  23. Thorpe, J.E. Salmon Migration. Sci. Prog. 1988, 72, 345–370. [Google Scholar]
  24. Dermond, P.; Melián, C.J.; Brodersen, J. Size-Dependent Tradeoffs in Seasonal Freshwater Environments Facilitate Differential Salmonid Migration. Mov. Ecol. 2019, 7, 40. [Google Scholar] [CrossRef] [PubMed]
  25. Dodson, J.J.; Aubin-Horth, N.; Thériault, V.; Páez, D.J. The Evolutionary Ecology of Alternative Migratory Tactics in Salmonid Fishes. Biol. Rev. 2013, 88, 602–625. [Google Scholar] [CrossRef]
  26. Paul, A.J.; Post, J.R.; Sterling, G.L.; Hunt, C. Density-Dependent Intercohort Interactions and Recruitment Dynamics: Models and a Bull Trout (Salvelinus Confluentus) Time Series. Can. J. Fish. Aquat. Sci. 2000, 57, 1220–1231. [Google Scholar] [CrossRef]
  27. Ratliff, D.; Spateholts, R.; Hill, M.; Schulz, E. Recruitment of Young Bull Trout into the Metolius River and Lake Billy Chinook, Oregon. N. Am. J. Fish. Manag. 2015, 35, 1077–1089. [Google Scholar] [CrossRef]
  28. Horn, C.; Tholl, T. Native Salmonid Abundance and Tributary Habitat Restoration Monitoring: Comprehensive Report, 2008–2010; Avista Corporation: Noxon, MT, USA, 2011. [Google Scholar]
  29. River Design Group. Graves Creek Watershed Assessment and Conceptual Design Report; River Design Group: Whitefish, MT, USA, 2005. [Google Scholar]
  30. Ogle, D.H.; Wheeler, P.; Dinno, A. FSA: Fisheries Stock Analysis 2020. R Package Version 0.8.30. Available online: https://github.com/fishR-Core-Team/FSA (accessed on 1 June 2021).
  31. Isermann, D.A.; Knight, C.T. A Computer Program for Age–Length Keys Incorporating Age Assignment to Individual Fish. N. Am. J. Fish. Manag. 2005, 25, 1153–1160. [Google Scholar] [CrossRef]
  32. Riley, S.C.; Fausch, K.D. Underestimation of Trout Population Size by Maximum-Likelihood Removal Estimates in Small Streams. N. Am. J. Fish. Manag. 1992, 12, 768–776. [Google Scholar] [CrossRef]
  33. Hijamns, R.J. Geosphere: Spherical Trigonometry 2019. R Package Version 1.5-10. Available online: https://CRAN.R-project.org/package=geosphere (accessed on 1 June 2021).
  34. Neumann, R.M.; Guy, C.S.; Willis, D.W. Length, Weight, and Associated Indices. In Fisheries Techniques; Zale, A.V., Parrish, D.L., Sutton, T.M., Eds.; American Fisheries Society: Bethesda, MD, USA, 2012; pp. 637–676. ISBN 9781934874295. [Google Scholar]
  35. Kaplan, E.L.; Meier, P. Nonparametric Estimation from Incomplete Observations. J. Am. Stat. Assoc. 1958, 53, 457–481. [Google Scholar] [CrossRef]
  36. Therneau, T. A Package for Survival Analysis in R 2020. R Package Version 3.2-7. Available online: https://github.com/therneau/survival (accessed on 1 June 2021).
  37. Killick, R.; Fearnhead, P.; Eckley, I.A. Optimal Detection of Changepoints with a Linear Computational Cost. J. Am. Stat. Assoc. 2012, 107, 1590–1598. [Google Scholar] [CrossRef]
  38. Killick, R.; Eckley, I.A. Changepoint: An R Package for Changepoint Analysis. J. Stat. Softw. 2014, 58, 1–19. [Google Scholar] [CrossRef]
  39. Metcalfe, N.B.; Huntingford, F.A.; Graham, W.D.; Thorpe, J.E. Early Social Status and the Development of Life-History Strategies in Atlantic Salmon. Proc. R. Soc. London. B. Biol. Sci. 1989, 236, 7–19. [Google Scholar] [CrossRef]
  40. Gross, M.R. Salmon Breeding Behavior and Life History Evolution in Changing Environments. Ecology 1991, 72, 1180–1186. [Google Scholar] [CrossRef]
  41. ØKland, F.; Jonsson, B.; Jensen, A.J.; Hansen, L.P. Is There a Threshold Size Regulating Seaward Migration of Brown Trout and Atlantic Salmon? J. Fish Biol. 1993, 42, 541–550. [Google Scholar] [CrossRef]
  42. Forseth, T.; Nesje, T.F.; Jonsson, B.; Harsaker, K. Juvenile Migration in Brown Trout: A Consequence of Energetic State. J. Anim. Ecol. 1999, 68, 783–793. [Google Scholar] [CrossRef]
  43. Heim, K.C.; Wipfli, M.S.; Whitman, M.S.; Seitz, A.C. Body Size and Condition Influence Migration Timing of Juvenile Arctic Grayling. Ecol. Freshw. Fish 2016, 25, 156–166. [Google Scholar] [CrossRef]
  44. Zymonas, N. Age Structure, Growth, and Factors Affecting Relative Abundance of Life History Forms of Bull Trout in the Lower Clark Fork River Drainage, Montana and Idaho. Master’s Thesis, Montana State University, Bozeman, MT, USA, 2006. [Google Scholar]
  45. Downs, C.C.; Horan, D.; Morgan-Harris, E.; Jakubowski, R. Spawning Demographics and Juvenile Dispersal of an Adfluvial Bull Trout Population in Trestle Creek, Idaho. North Am. J. Fish. Manag. 2006, 26, 190–200. [Google Scholar] [CrossRef]
  46. Enders, E.C.; Boisclair, D. Effects of Environmental Fluctuations on Fish Metabolism: Atlantic Salmon Salmo Salar as a Case Study. J. Fish Biol. 2016, 88, 344–358. [Google Scholar] [CrossRef] [Green Version]
  47. Morgan, I.J.; McDonald, D.G.; Wood, C.M. The Cost of Living for Freshwater Fish in a Warmer, More Polluted World. Glob. Change Biol. 2001, 7, 345–355. [Google Scholar] [CrossRef]
  48. Jones, D.A.; Bergman, E.; Greenberg, L. Food Availability in Spring Affects Smolting in Brown Trout (Salmo trutta). Can. J. Fish. Aquat. Sci. 2015, 72, 1694–1699. [Google Scholar] [CrossRef] [Green Version]
  49. Muir, W.D.; Zaugg, W.S.; Giorgi, A.E.; McCutcheon, S. Accelerating Smolt Development and Downstream Movement in Yearling Chinook Salmon with Advanced Photoperiod and Increased Temperature. Aquaculture 1994, 123, 387–399. [Google Scholar] [CrossRef]
  50. Bottengård, L.; Jørgensen, E.H. Elevated Spring Temperature Stimulates Growth, but Not Smolt Development, in Anadromous Arctic Charr. Comp. Biochem. Physiol. Part A Mol. Integr. Physiol. 2008, 151, 596–601. [Google Scholar] [CrossRef] [PubMed]
  51. Sykes, G.E.; Johnson, C.J.; Shrimpton, J.M. Temperature and Flow Effects on Migration Timing of Chinook Salmon Smolts. Trans. Am. Fish. Soc. 2009, 138, 1252–1265. [Google Scholar] [CrossRef]
  52. Spence, B.C.; Dick, E.J. Geographic Variation in Environmental Factors Regulating Outmigration Timing of Coho Salmon (Oncorhynchus Kisutch) Smolts. Can. J. Fish. Aquat. Sci. 2014, 71, 56–69. [Google Scholar] [CrossRef]
  53. Connor, W.; Burge, H.; Yearsley, J.; Bjornn, T. Influence of Flow and Temperature on Survival of Wild Subyearling Fall Chinook Salmon in the Snake River. N. Am. J. Fish. Manag. 2003, 23, 362–375. [Google Scholar] [CrossRef]
  54. Scheuerell, M.D.; Zabel, R.W.; Sandford, B.P. Relating Juvenile Migration Timing and Survival to Adulthood in Two Species of Threatened Pacific Salmon (Oncorhynchus spp.). J. Appl. Ecol. 2009, 46, 983–990. [Google Scholar] [CrossRef]
  55. Jakober, M.J.; McMahon, T.E.; Thurow, R.F.; Clancy, C.G. Role of Stream Ice on Fall and Winter Movements and Habitat Use by Bull Trout and Cutthroat Trout in Montana Headwater Streams. Trans. Am. Fish. Soc. 1998, 127, 223–235. [Google Scholar] [CrossRef]
  56. Johnston, F.D.; Post, J.R.; Mushens, C.J.; Stelfox, J.D.; Paul, A.J.; Lajeunesse, B. The Demography of Recovery of an Overexploited Bull Trout, Salvelinus confluentus, Population. Can. J. Fish. Aquat. Sci. 2007, 64, 113–126. [Google Scholar] [CrossRef]
Figure 1. The lower Clark Fork River watershed, with major lakes and streams in Montana (1:100,000 scale) and Idaho (1:250,000 scale). The lower left inset map depicts the study area on Graves Creek, with the location of the sampling reaches. The upper right inset map depicts the location of the study relative to the state of Montana. The maps were created using QGIS 3.4.7, with layers from the U.S. Geological Survey (USGS) National Hydrography Dataset.
Fishes 07 00331 g001
Figure 2. Probability of remaining in Graves Creek, Montana, for juvenile bull trout from the 2019 year-class, with colors delineating three size categories based on the length at time of summer electrofishing, small (TL (mm): 105–111, n = 6), medium (TL (mm): 111–116, n = 7), large (TL (mm): 116–129, n = 8), and associated 95% confidence interval.
Fishes 07 00331 g002
Figure 3. Probability of remaining in Graves Creek, Montana, for juvenile bull trout from the 2018 year-class, with color delineating three size categories based on the length at time of summer electrofishing, small (TL (mm): 100–110, n = 70), medium (TL (mm): 111–118, n = 74), large (TL (mm): 119–138, n = 80), and associated 95% confidence interval.
Fishes 07 00331 g003
Figure 4. Probability of remaining in Graves Creek, Montana, for juvenile bull trout from the 2018 year-class, with colors delineating three condition categories based on the relative body condition at time of summer electrofishing, low (0.81–0.98, n = 74), medium (0.99–1.0, n = 74), high (1.1– 1.24, n = 74), and associated 95% confidence interval.
Fishes 07 00331 g004
Figure 5. Probability of remaining in Graves Creek, Montana, for juvenile bull trout from the 2017 year-class initially encountered at age 2 (n = 30).
Fishes 07 00331 g005
Figure 6. Time series from Graves Creek, Montana, from 25 July 2019 through 1 August 2021, with light blue lines delineating time series of natural log-maximum daily discharge (cubic meters per second; m3/s) and dark blue lines delineating time series of bull trout out-migrating by day. Dotted yellow lines delineate changepoints, and green horizontal lines represent the mean for each segment between the changepoints.
Fishes 07 00331 g006
Figure 7. Time series from Graves Creek, Montana, from 25 July 2019 through 1 August 2021, with the light blue line delineating time series of mean daily water temperature (°C) and the dark blue line delineating time series of bull trout out-migrating by day. Dotted yellow lines delineate changepoints, and horizontal green lines represent the mean for each segment between the changepoints.
Fishes 07 00331 g007
Figure 8. Time series from Graves Creek, Montana, from 25 July 2019 through 1 August 2021, with the light blue line delineating time series of the photoperiod (hours) and the dark blue line delineating time series of bull trout out-migrating by day. Dotted yellow lines delineate changepoints, and horizontal green lines represent the mean for each segment between the changepoints.
Fishes 07 00331 g008
Table 1. Variables and associated category values (minimum–maximum) for the Kaplan–Meier analysis of time to out-migration for juvenile bull trout sampled from Graves Creek, Montana, in the summer of 2018 and 2019 (sample size in parentheses).
VariableCategoryYear-Class
201720182019
Total length (mm)Small151–169 (11)100–110 (70)105–111 (6)
Medium170–181 (9)111–118 (74)112–116 (7)
Large182–201 (10)119–138 (80)116–129 (8)
Relative body Condition (Kn) Low0.91–0.97 (10)0.81–0.98 (74)0.91–0.99 (8)
Medium0.98–0.99 (10)0.99–1.02 (74)1.00–1.03 (6)
High1.00–1.10 (10)1.03–1.24 (74)1.04–1.12 (7)
Table 2. Summary of the sample population of bull trout in Graves Creek, Montana, following electrofishing in the summer of 2019 and summer of 2020. Summer sampling numbers indicate the total number of bull trout sampled, with the number of tagged bull trout in parenthesis. Density is the mean overall density of each year-class during the summer sampling season. Autumn out-migrants are tagged bull trout that out-migrated during the autumn out-migration events in 2019 (4 September 2019–27 November 2019) and in 2020 (2 September 2020–20 November 2020). Spring out-migrants are bull trout that out-migrated during the spring of 2020 (15 April 2020–2 July 2020) and the spring of 2021 (29 March 2021–2 July 2021).
Age during Summer
Sampling (Year-Class)
Summer Sampling (N Tagged)Density (Mean Number/m2) [95% P.I.]Autumn Out-MigrantsSpring Out-Migrants
Graves Creek 2019/2020
Age 1 (2018)486 (451)0.0701 (±0.093)6786
Age 2 (2017)37 (37)0.059 (±0.0011)220
Age 3 (2016)4 (4)0.0007 (±0.0001)10
Total527 (492)0.0767 (±0.0103)9086
Graves Creek 2020/2021
Age 1 (2019)283 (251)0.0418 (±0.0075)513
Age 2 (2018)92 (90)0.0138 (±0.0024)969
Age 3 (2017)3 (3)0.0005 (±0.0001)10
Total378 (344)0.0561 (±0.0100) 10222
Publisher’s Note: MDPI stays neutral with regard to jurisdictional claims in published maps and institutional affiliations.

