Nonlinearity and Spatial Autocorrelation in Species Distribution Modeling: An Example Based on Weakfish (Cynoscion regalis) in the Mid-Atlantic Bight
Abstract
:1. Introduction
2. Materials and Method
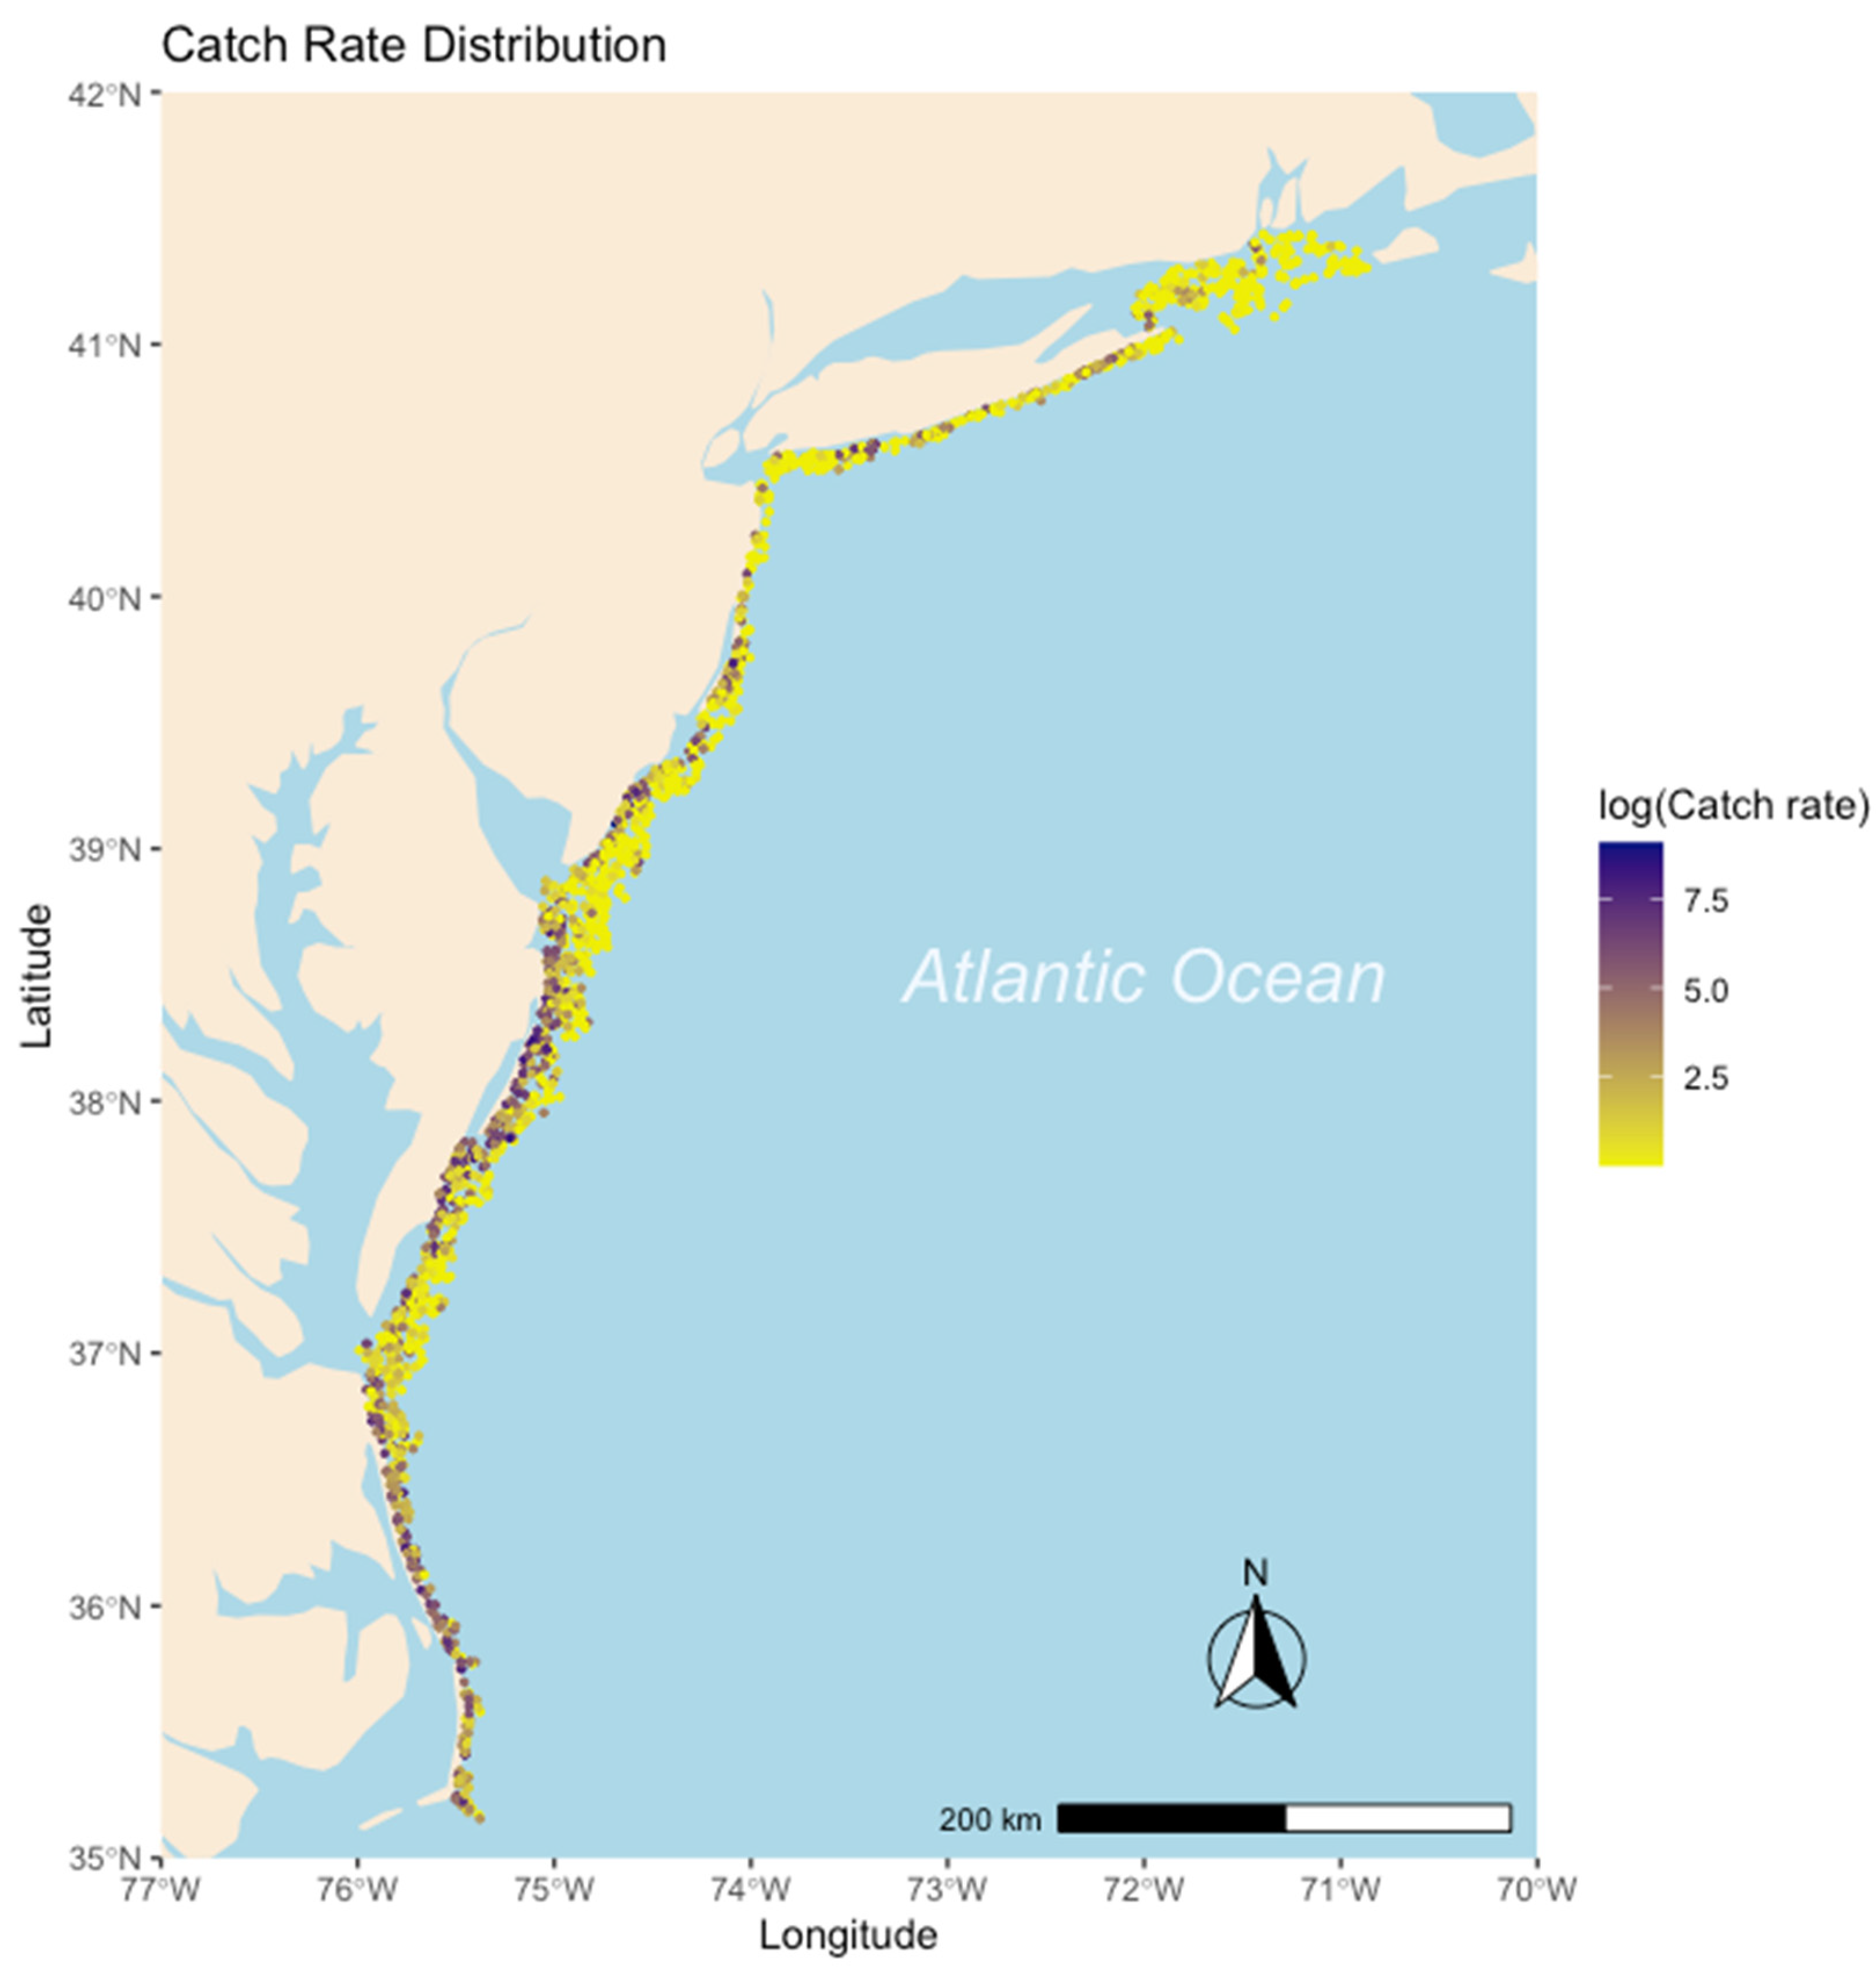
2.1. Weakfish Case Study
2.2. Models Considered
2.2.1. Generalized Linear Model (GLM)
2.2.2. Generalized Additive Model (GAM)
2.2.3. Spatial GAM
2.2.4. Autoregressive Models
2.2.5. Auto-Covariate Regression
2.2.6. Software
2.3. Simulation
2.4. Model Evaluation
2.4.1. Akaike’s Information Criterion (AIC)
2.4.2. Cross-Validation
3. Results
4. Discussion
Author Contributions
Funding
Institutional Review Board Statement
Data Availability Statement
Conflicts of Interest
Appendix A
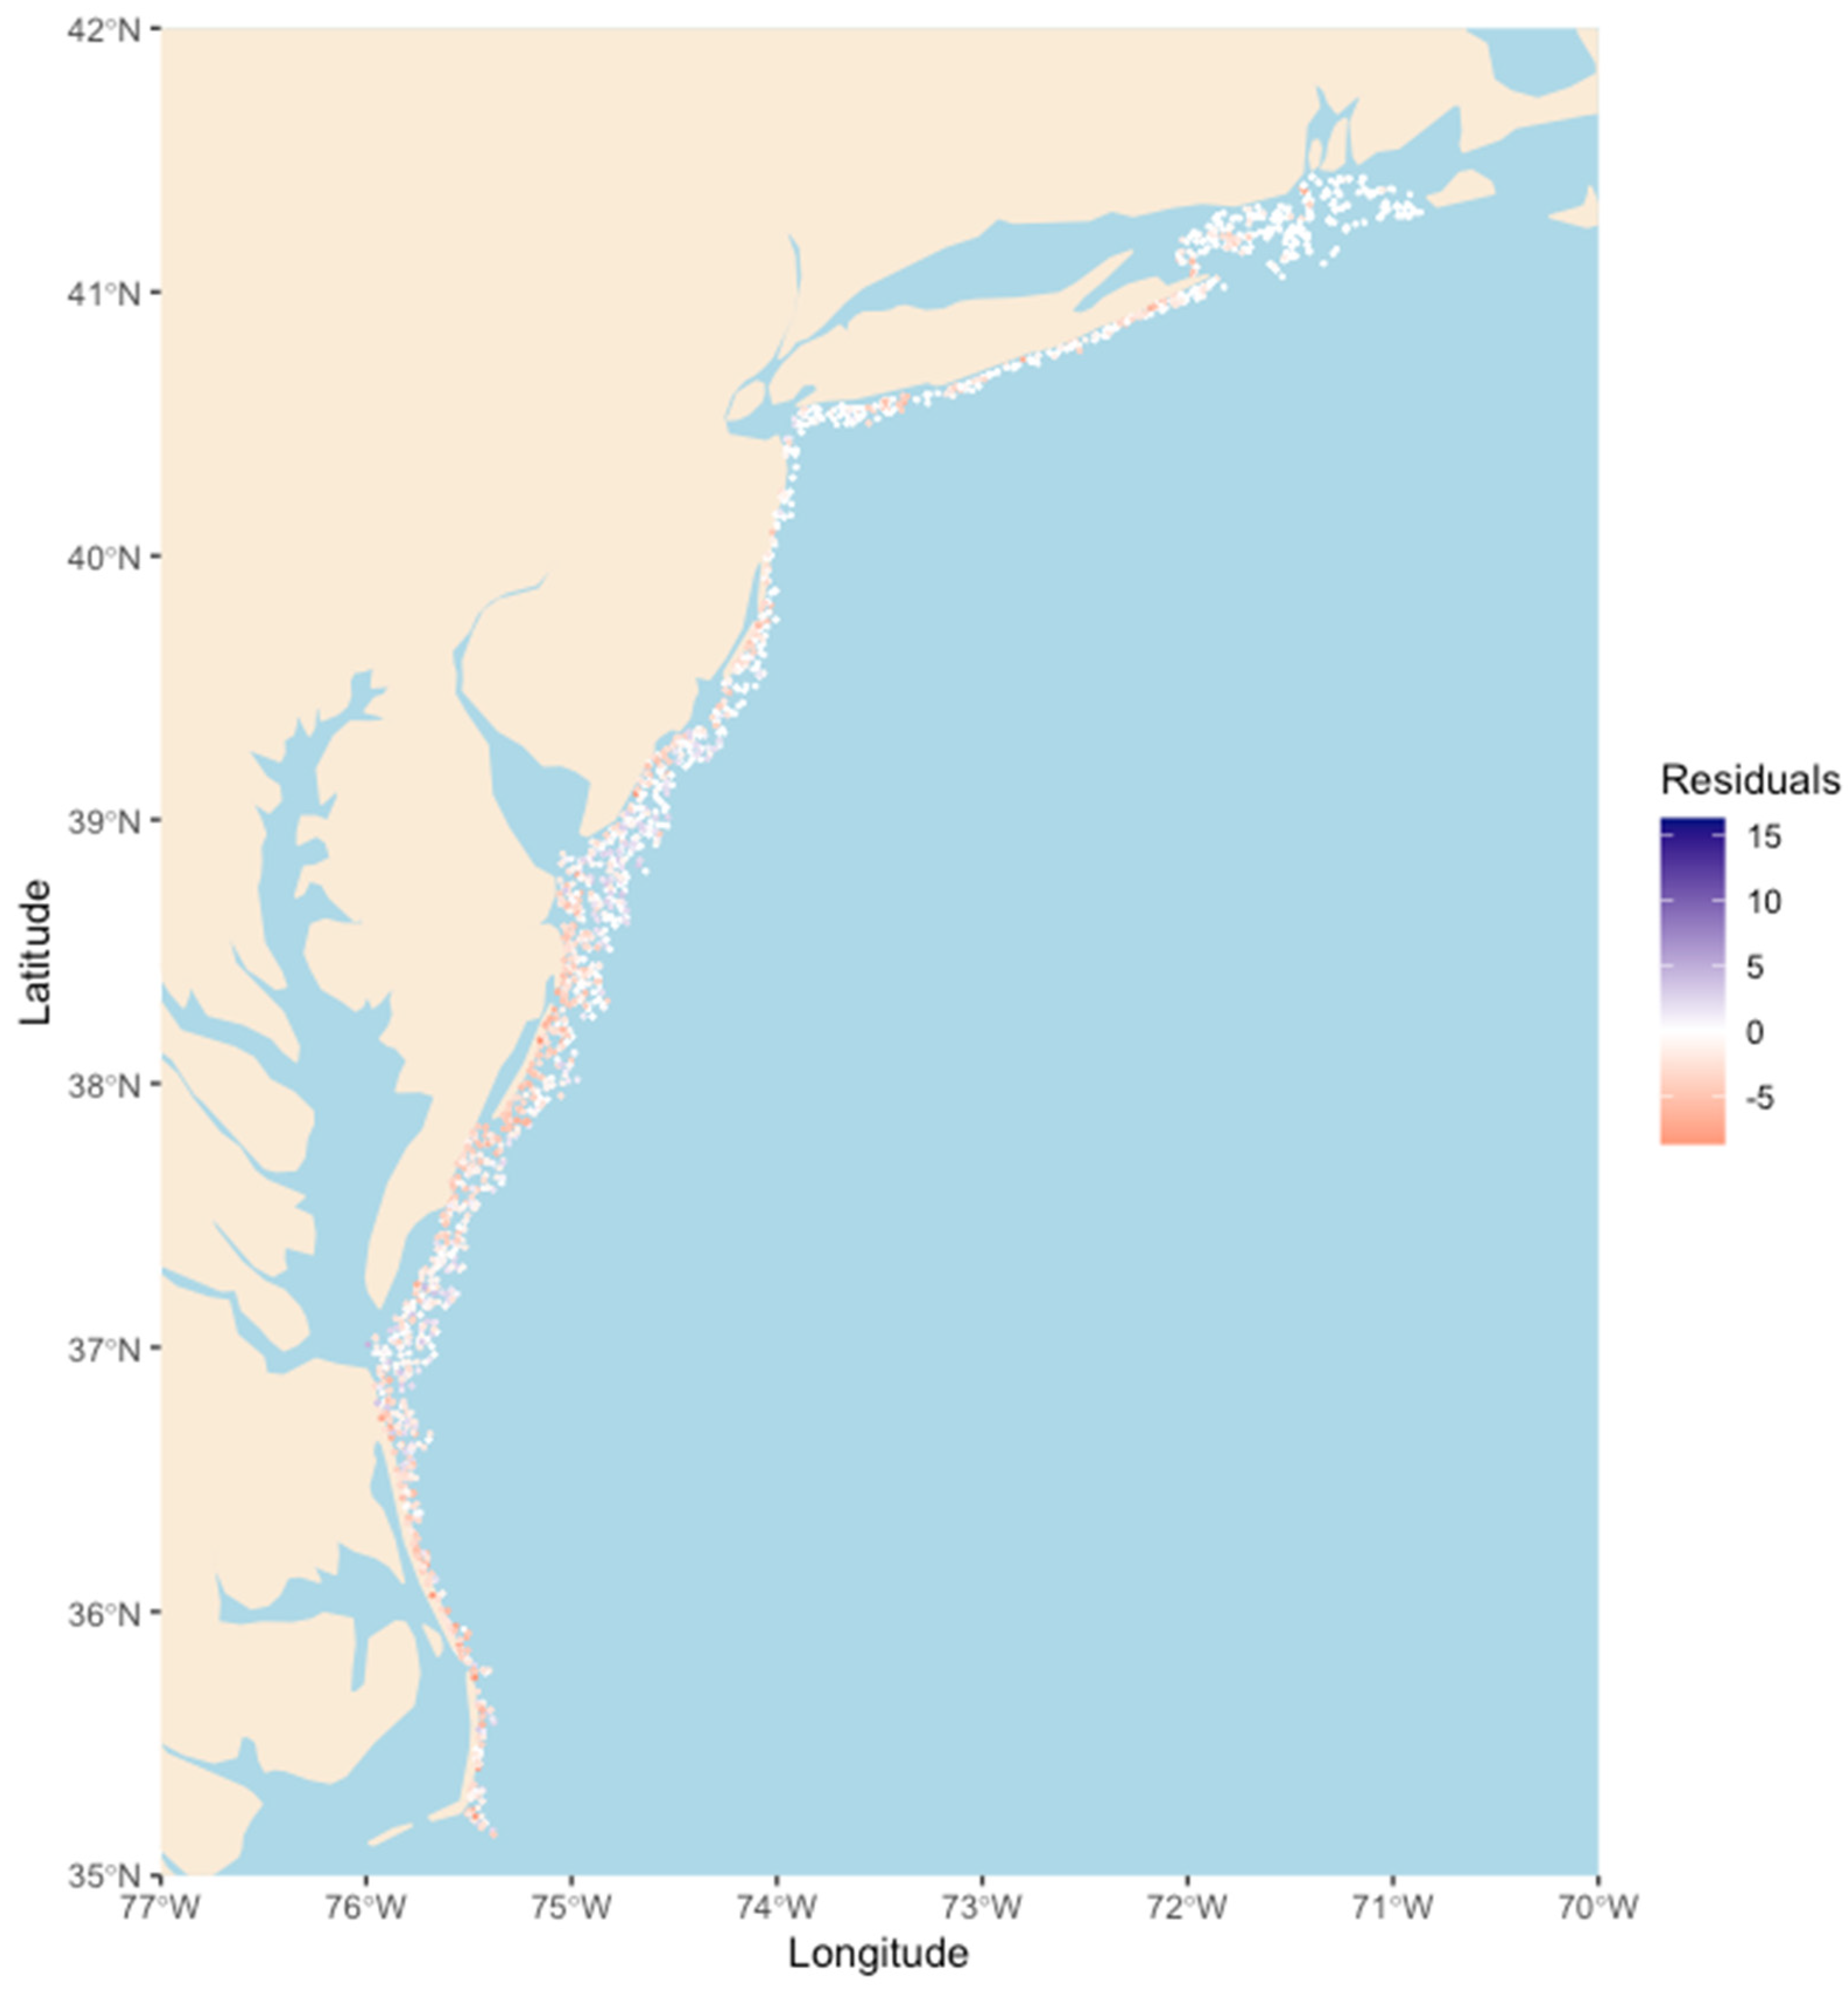
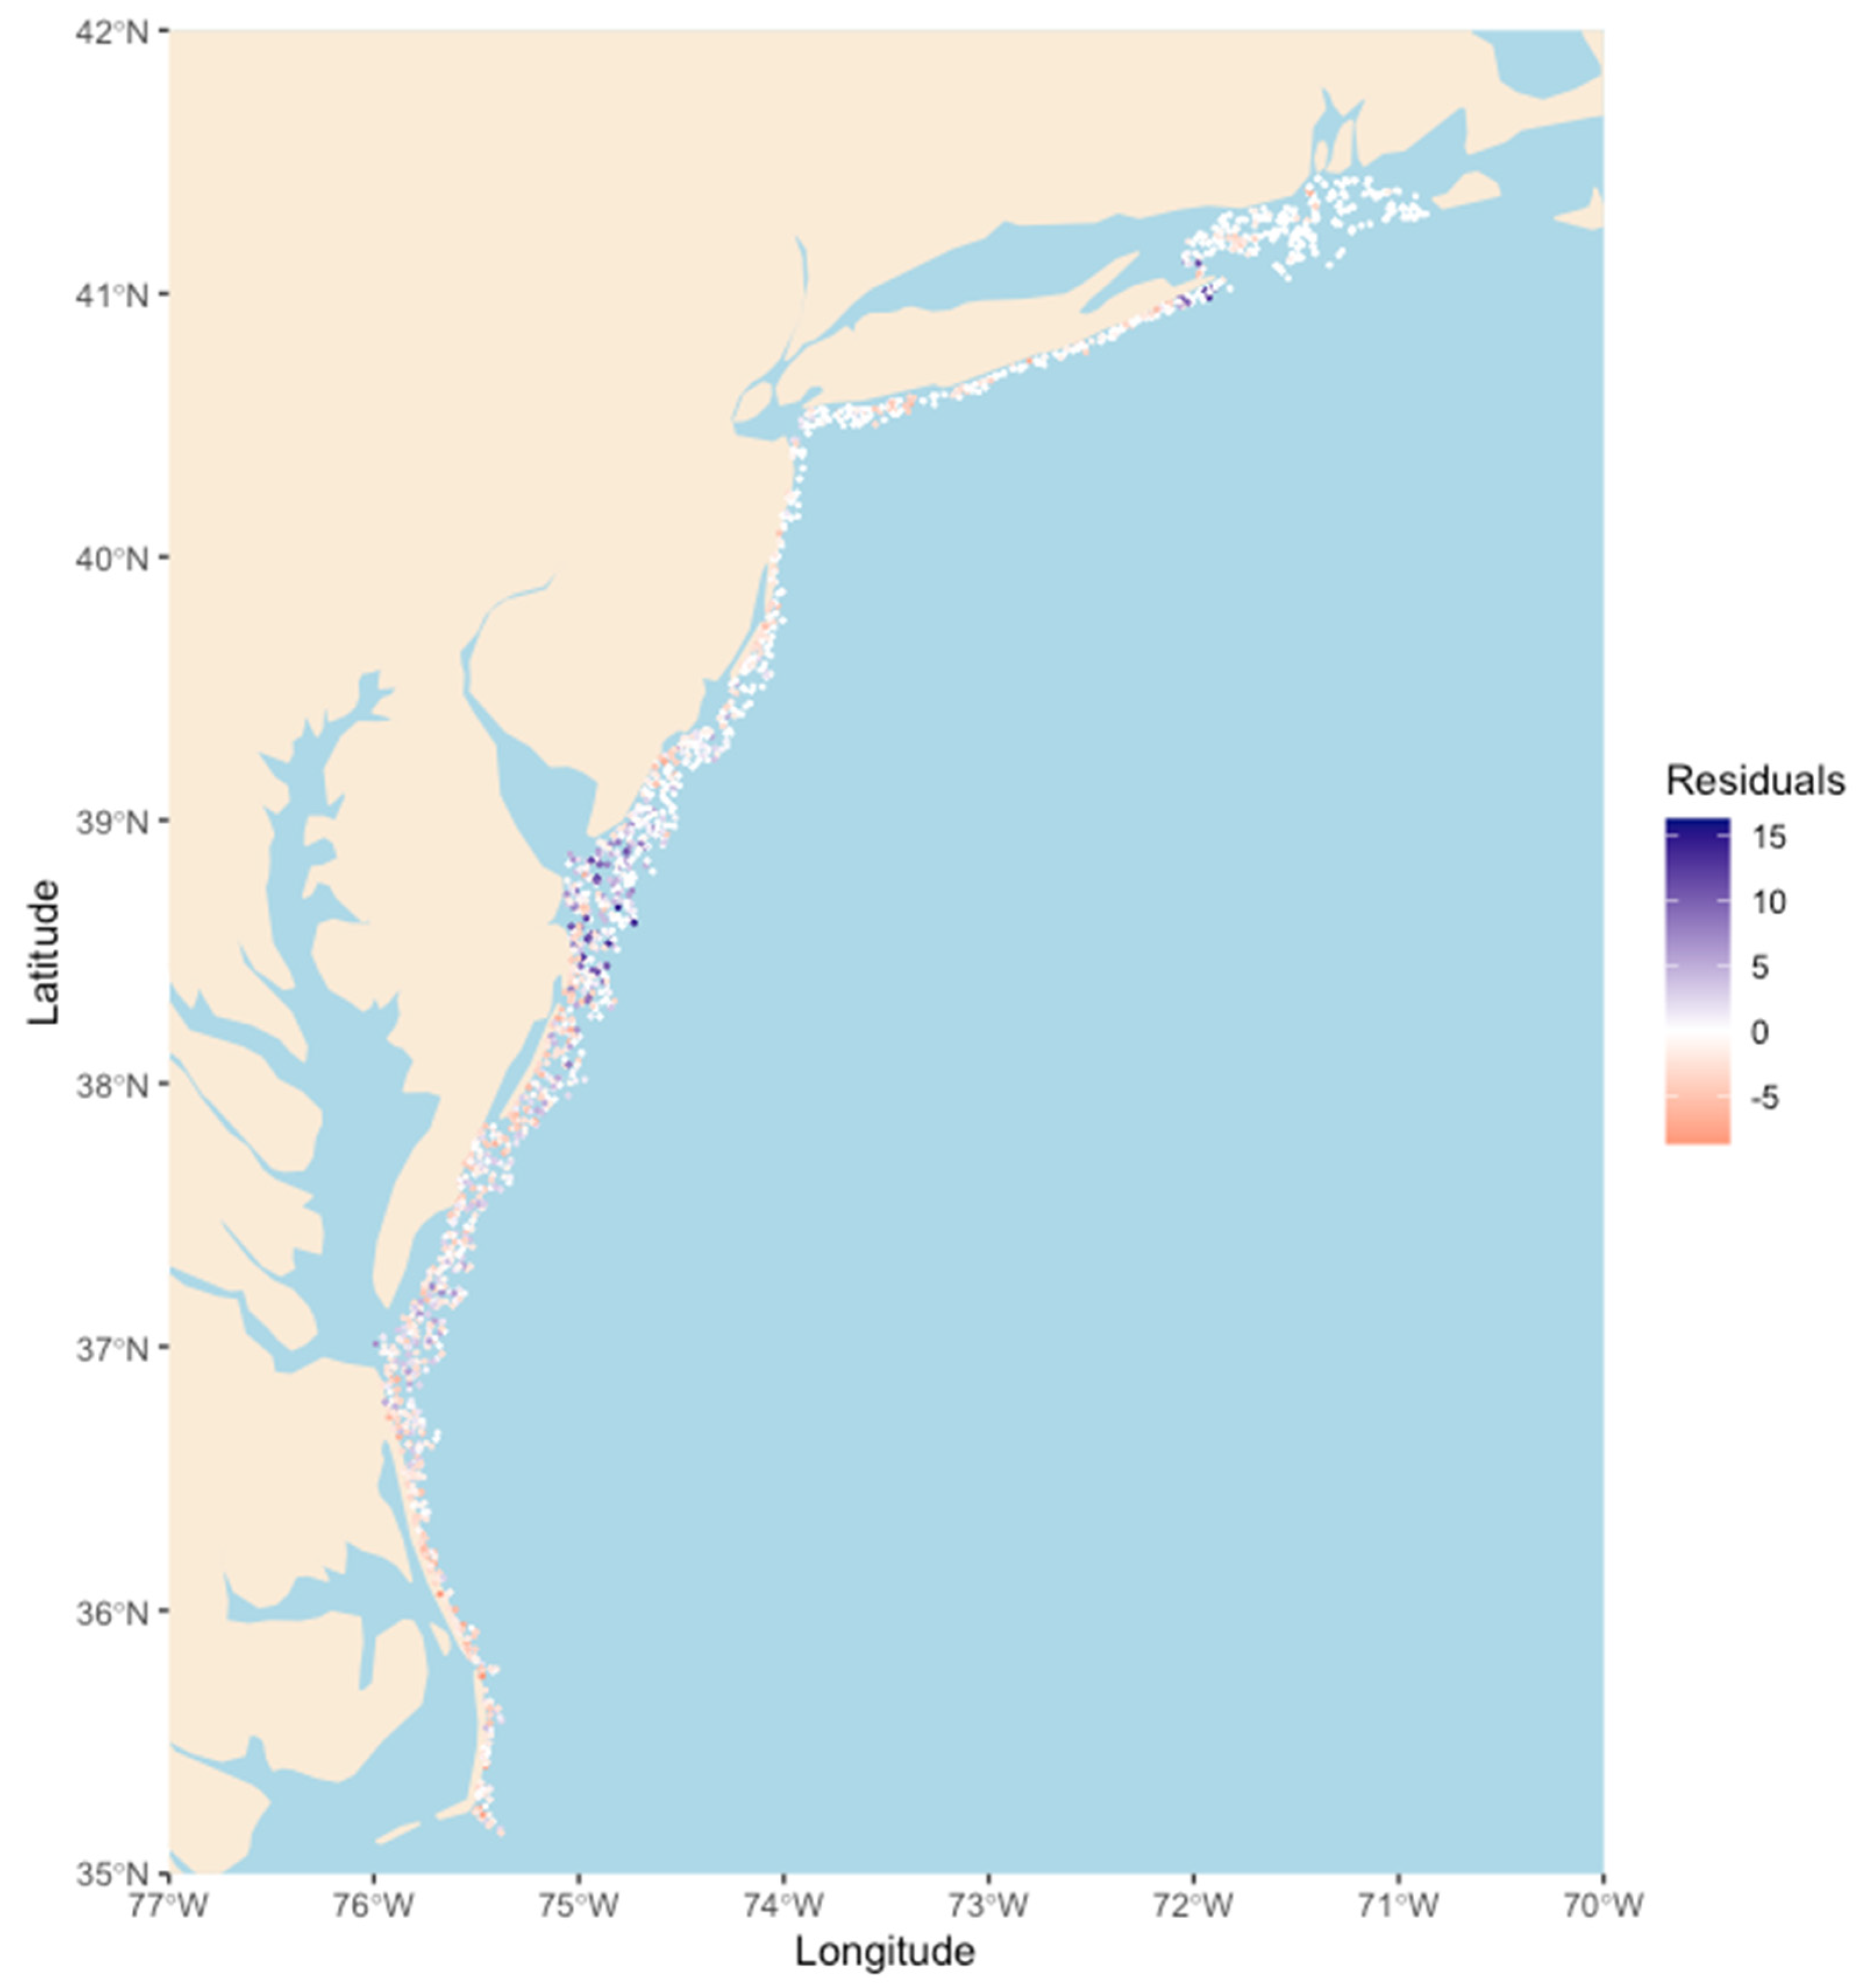
References
- Conan, G. Assessment of shellfish stocks by geostatistical techniques. ICES CM 1985, 1985, 372. [Google Scholar]
- Freire, J.; González-Gurriarán, E.; Fernández, L. Geostatistical analysis of spatial distribution of Liocarcinus depurator, Macropipus tuberculatus and Polybius henslowii (Crustacea: Brachyura) over the Galician continental shelf (NW Spain). Mar. Biol. 1993, 115, 453–461. [Google Scholar]
- Vignaux, M. Analysis of spatial structure in fish distribution using commercial catch and effort data from the New Zealand hoki fishery. Can. J. Fish. Aquat. Sci. 1996, 53, 963–973. [Google Scholar] [CrossRef]
- Walter, J.F., III; Christman, M.C.; Hoenig, J.M.; Mann, R. Combining data from multiple years or areas to improve variogram estimation. Environ. Off. J. Int. Environ. Soc. 2007, 18, 583–598. [Google Scholar] [CrossRef]
- Tobler, W.R. A Computer Movie Simulating Urban Growth in the Detroit Region. Econ. Geogr. 1970, 46, 234–240. [Google Scholar] [CrossRef]
- Yu, H.; Jiao, Y.; Winter, A. Catch-Rate Standardization for Yellow Perch in Lake Erie: A Comparison of the Spatial Generalized Linear Model and the Generalized Additive Model. Trans. Am. Fish. Soc. 2011, 140, 905–918. [Google Scholar] [CrossRef]
- Drexler, M.; Ainsworth, C.H. Generalized Additive Models Used to Predict Species Abundance in the Gulf of Mexico: An Ecosystem Modeling Tool. PLoS ONE 2013, 8, e64458. [Google Scholar] [CrossRef] [Green Version]
- Legendre, P. Spatial autocorrelation: Trouble or new paradigm? Ecology 1993, 74, 1659–1673. [Google Scholar] [CrossRef]
- Legendre, P.; Fortin, M.J. Spatial pattern and ecological analysis. Vegetatio 1989, 80, 107–138. [Google Scholar] [CrossRef]
- Legendre, P.; Legendre, L. Numerical Ecology; Elsevier: Amsterdam, The Netherlands, 2012. [Google Scholar]
- Besag, J. Spatial interaction and the statistical analysis of lattice systems. J. R. Stat. Soc. Ser. B Methodol. 1974, 36, 192–225. [Google Scholar] [CrossRef]
- Legendre, P.; Dale, M.R.; Fortin, M.J.; Gurevitch, J.; Hohn, M.; Myers, D. The consequences of spatial structure for the design and analysis of ecological field surveys. Ecography 2002, 25, 601–615. [Google Scholar] [CrossRef] [Green Version]
- McCullagh, P.; Nelder, J. Binary Data. In Generalized Linear Models; Springer: Berlin/Heidelberg, Germany, 1989; pp. 98–148. [Google Scholar]
- Maunder, M.N.; Punt, A.E. Standardizing catch and effort data: A review of recent approaches. Fish. Res. 2004, 70, 141–159. [Google Scholar] [CrossRef]
- Nelder, J.A.; Wedderburn, R.W. Generalized linear models. J. R. Stat. Soc. Ser. A Gen. 1972, 135, 370–384. [Google Scholar] [CrossRef]
- Hastie, T.; Tibshirani, R.; Friedman, J.H.; Friedman, J.H. The Elements of Statistical Learning: Data Mining, Inference, and Prediction; Springer: Berlin/Heidelberg, Germany, 2009; Volume 2. [Google Scholar]
- Zimmermann, N.E.; Edwards, T.C., Jr.; Graham, C.H.; Pearman, P.B.; Svenning, J.C. New trends in species distribution modelling. Ecography 2010, 33, 985–989. [Google Scholar] [CrossRef]
- Dormann, C.F.; McPherson, J.M.; Araújo, M.B.; Bivand, R.; Bolliger, J.; Carl, G.; Davies, R.G.; Hirzel, A.; Jetz, W.; Kissling, W.D.; et al. Methods to account for spatial autocorrelation in the analysis of species distributional data: A review. Ecography 2007, 30, 609–628. [Google Scholar] [CrossRef] [Green Version]
- Pinheiro, J.; Bates, D. Mixed-Effects Models in S and S-PLUS; Springer Science & Business Media: Berlin/Heidelberg, Germany, 2006. [Google Scholar]
- Cliff, A.D.; Ord, J.K. Spatial Processes: Models & Applications; Taylor & Francis: Abingdon-on-Thames, UK, 1981. [Google Scholar]
- Anselin, L. Spatial Econometrics: Methods and Models; Springer Science & Business Media: Berlin/Heidelberg, Germany, 1988; Volume 4. [Google Scholar]
- Anselin, L.; Bera, A.K. Spatial dependence in linear regression models with an introduction to spatial econometrics. Stat. Textb. Monogr. 1998, 155, 237–290. [Google Scholar]
- Cressie, N. Statistics for Spatial Data; John Wiley & Sons: Hoboken, NJ, USA, 1993. [Google Scholar]
- NEFSC. 48th Northeast Regional Stock Assessment Workshop (48th SAW) Assessment Summary Report, Part C: Weakfish Assessment Summary for 2009; National Marine Fisheries Service: Silver Spring, MD, USA, 2009. [Google Scholar]
- Bonzek, C.; Gartland, J.; Johnson, R.; Lange Jr, J. NEAMAP Near Shore Trawl Survey: Peer Review Documentation; A report to the Atlantic States Marine Fisheries Commission by the Virginia Institute of Marine Science; Virginia Institute of Marine Science: Gloucester Point, VA, USA, 2008. [Google Scholar]
- Damalas, D.; Megalofonou, P.; Apostolopoulou, M. Environmental, spatial, temporal and operational effects on swordfish (Xiphias gladius) catch rates of eastern Mediterranean Sea longline fisheries. Fish. Res. 2007, 84, 233–246. [Google Scholar] [CrossRef]
- Wu, H.; Huffer, F. Modelling the distribution of plant species using the autologistic regression model. Environ. Ecol. Stat. 1997, 4, 31–48. [Google Scholar] [CrossRef]
- Montgomery, D.C.; Peck, E.A.; Vining, G.G. Introduction to Linear Regression Analysis; John Wiley & Sons: Hoboken, NJ, USA, 2006. [Google Scholar]
- Ortiz, M.; Legault, C.M.; Ehrhardt, N.M. An alternative method for estimating bycatch from the US shrimp trawl fishery in the Gulf of Mexico, 1972–1995. Fish. Bull. 2000, 98, 583. [Google Scholar]
- Lo, N.C.-H.; Jacobson, L.D.; Squire, J.L. Indices of Relative Abundance from Fish Spotter Data based on Delta-Lognornial Models. Can. J. Fish. Aquat. Sci. 1992, 49, 2515–2526. [Google Scholar] [CrossRef]
- Pennington, M. Estimating the mean and variance from highly skewed marine data. Fish. Bull. 1996, 94, 498–505. [Google Scholar]
- Stefansson, G. Analysis of groundfish survey abundance data: Combining the GLM and delta approaches. ICES J. Mar. Sci. 1996, 53, 577–588. [Google Scholar] [CrossRef]
- Ye, Y.; Al-Husaini, M.; Al-Baz, A. Use of generalized linear models to analyze catch rates having zero values: The Kuwait driftnet fishery. Fish. Res. 2001, 53, 151–168. [Google Scholar] [CrossRef]
- Murray, K.T. Magnitude and distribution of sea turtle bycatch in the sea scallop (Placopecten magellanicus) dredge fishery in two areas of the northwestern Atlantic Ocean, 2001–2002. Fish. Bull. 2004, 102, 671–681. [Google Scholar]
- Lichstein, J.W.; Simons, T.R.; Shriner, S.A.; Franzreb, K.E. Spatial autocorrelation and autoregressive models in ecology. Ecological monographs 2002, 72, 445–463. [Google Scholar] [CrossRef]
- Haining, R.P.; Haining, R. Spatial Data Analysis: Theory and Practice; Cambridge University Press: Cambridge, UK, 2003. [Google Scholar]
- Dormann, C.F. Effects of incorporating spatial autocorrelation into the analysis of species distribution data. Glob. Ecol. Biogeogr. 2007, 16, 129–138. [Google Scholar] [CrossRef]
- Knapp, R.A.; Matthews, K.R.; Preisler, H.K.; Jellison, R. Developing probabilistic models to predict amphibian site occupancy in a patchy landscape. Ecol. Appl. 2003, 13, 1069–1082. [Google Scholar] [CrossRef]
- Gumpertz, M.L.; Graham, J.M.; Ristaino, J.B. Autologistic Model of Spatial Pattern of Phytophthora Epidemic in Bell Pepper: Effects of Soil Variables on Disease Presence. J. Agric. Biol. Environ. Stat. 1997, 2, 131. [Google Scholar] [CrossRef]
- R Core Team. R: A Language and Environment for Statistical Computing; R Foundation for Statistical Computing: Vienna, Austria, 2021. [Google Scholar]
- Wood, S.N. Fast stable restricted maximum likelihood and marginal likelihood estimation of semiparametric generalized linear models. J. R. Stat. Soc. Ser. B 2010, 73, 3–36. [Google Scholar] [CrossRef] [Green Version]
- Bivand, R.; Millo, G.; Piras, G. A Review of Software for Spatial Econometrics in R. Mathematics 2021, 9, 1276. [Google Scholar] [CrossRef]
- Akaike, H. Information theory and an extension of the maximum likelihood principle. In Selected Papers of Hirotugu Akaike; Parzen, E., Tanabe, K., Kitagawa, G., Eds.; Springer: New York, NY, USA, 1998; pp. 199–213. [Google Scholar]
- Li, Y.; Jiao, Y.; He, Q. Decreasing uncertainty in catch rate analyses using Delta-AdaBoost: An alternative approach in catch and bycatch analyses with high percentage of zeros. Fish. Res. 2011, 107, 261–271. [Google Scholar] [CrossRef]
- Wood, S.N. Generalized Additive Models: An Introduction with R; Chapman and Hall/CRC: Boca Raton, FL, USA, 2006. [Google Scholar]


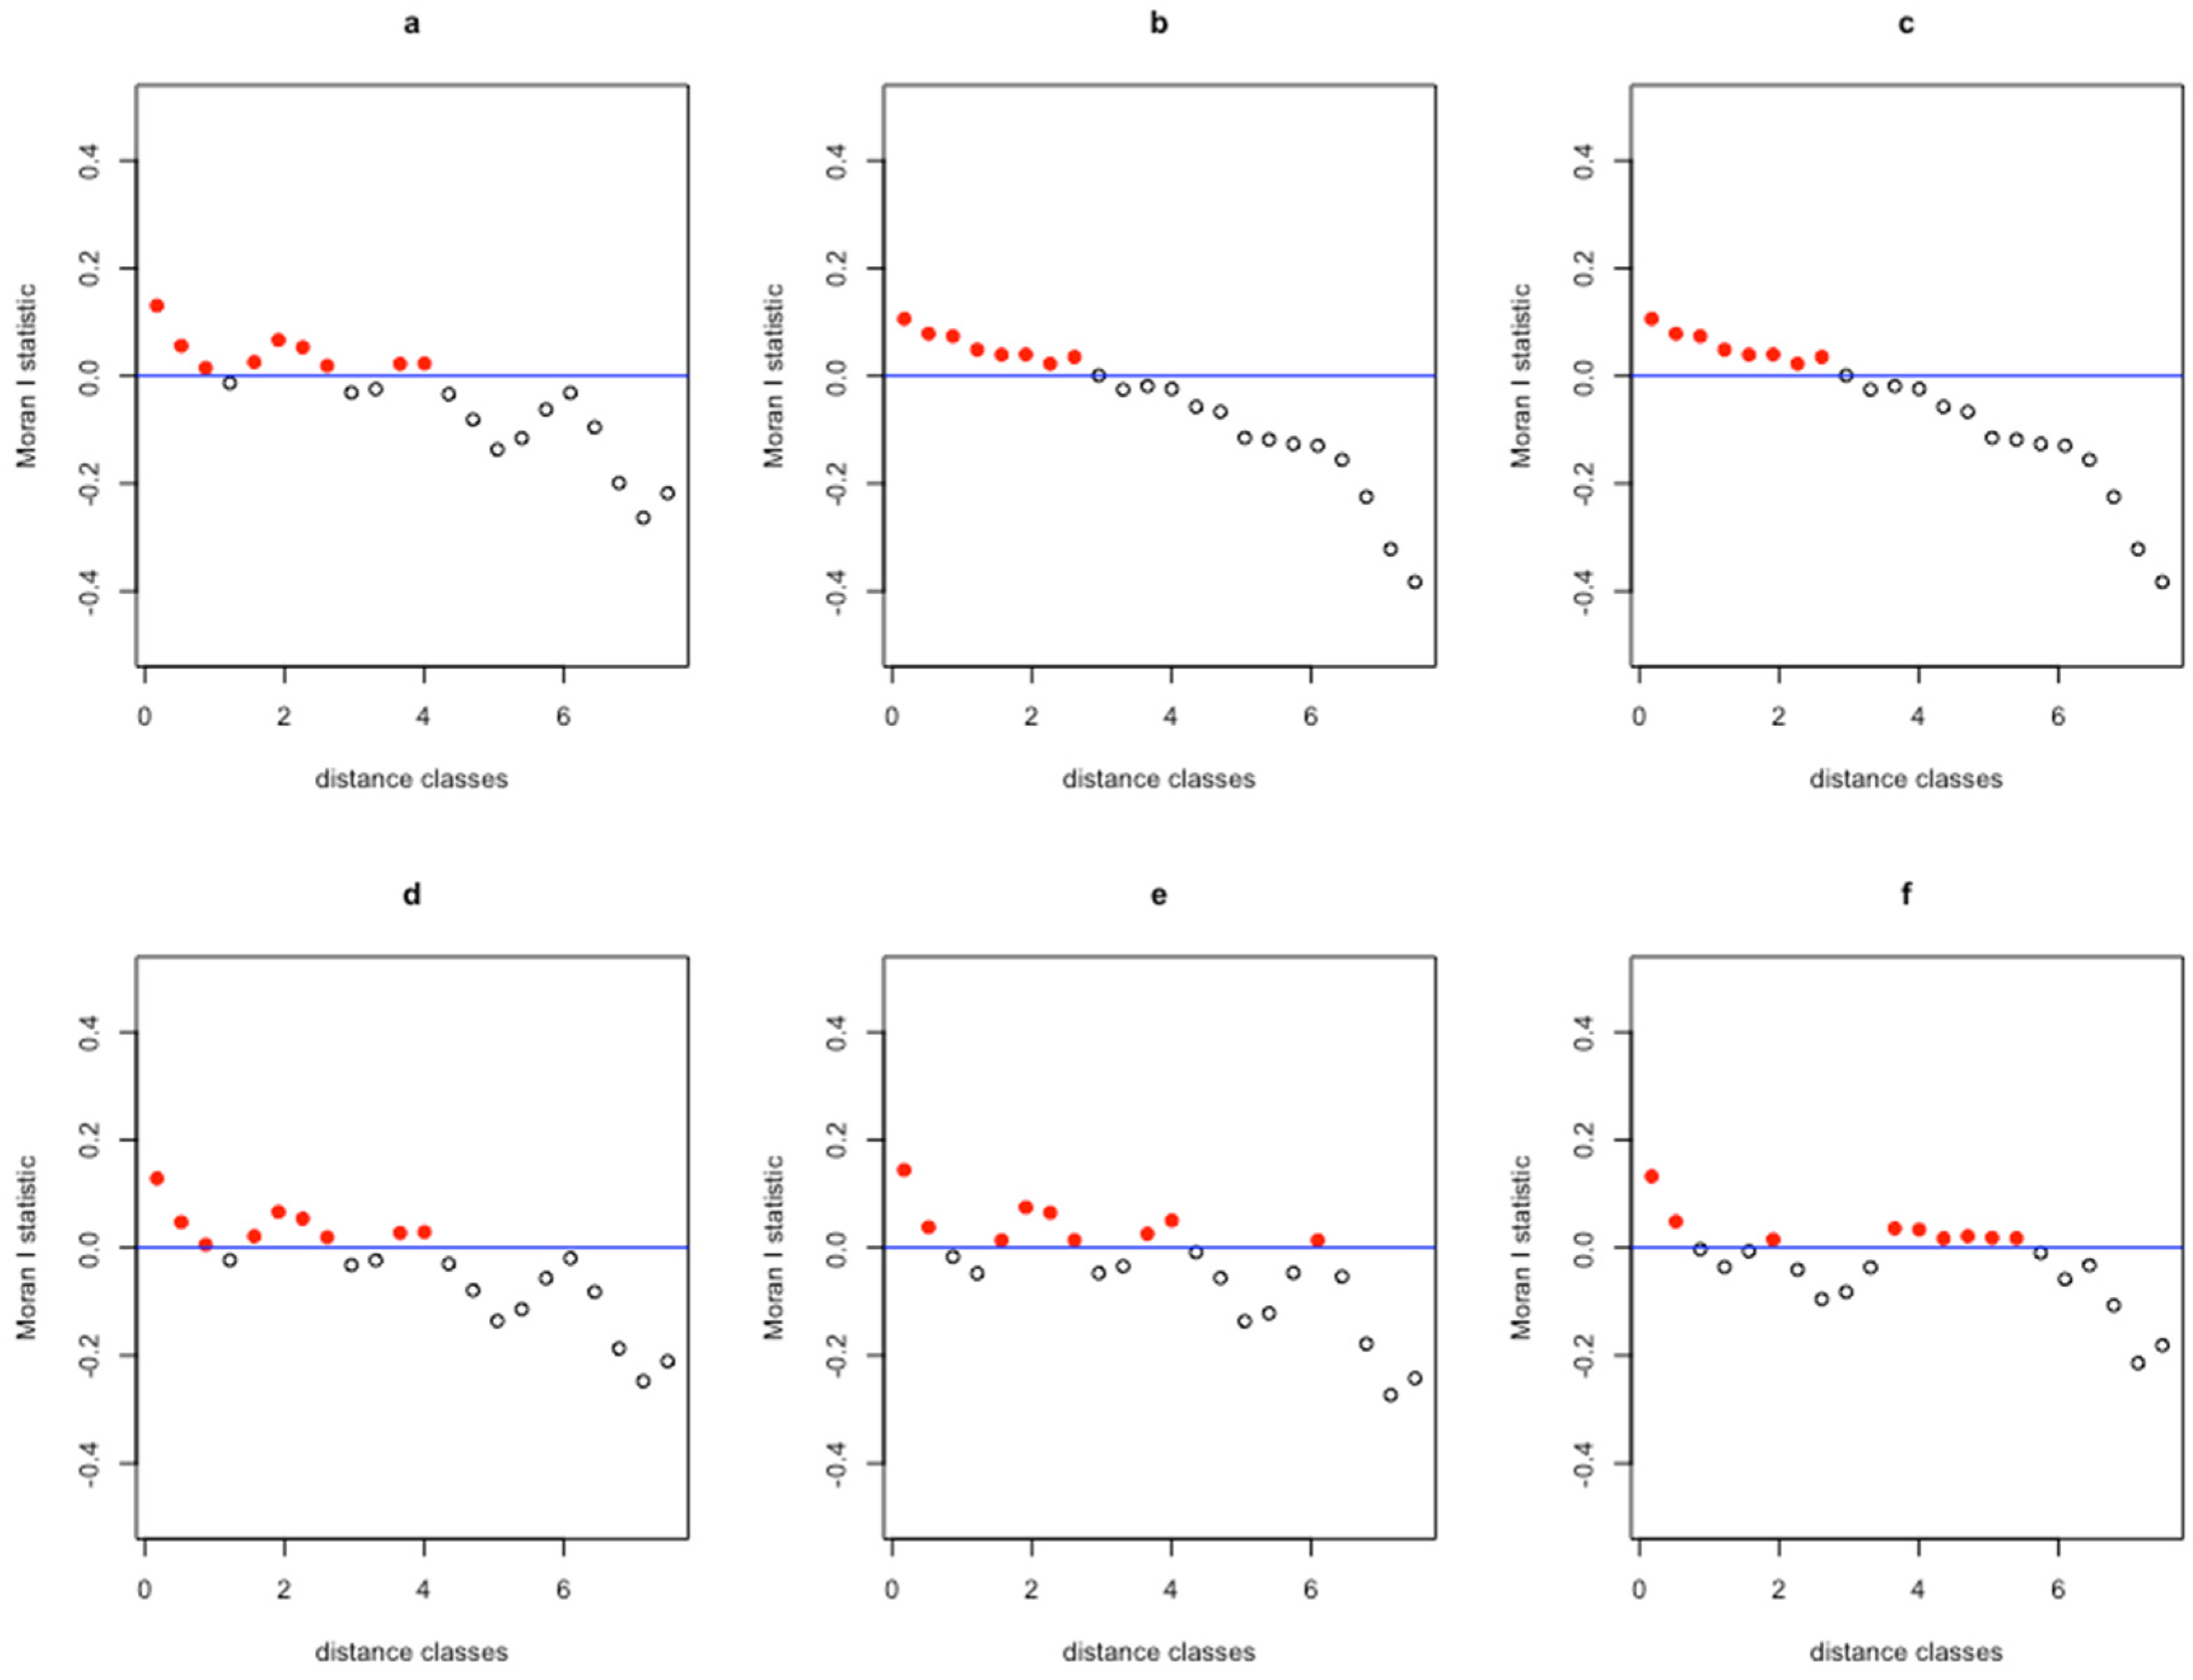
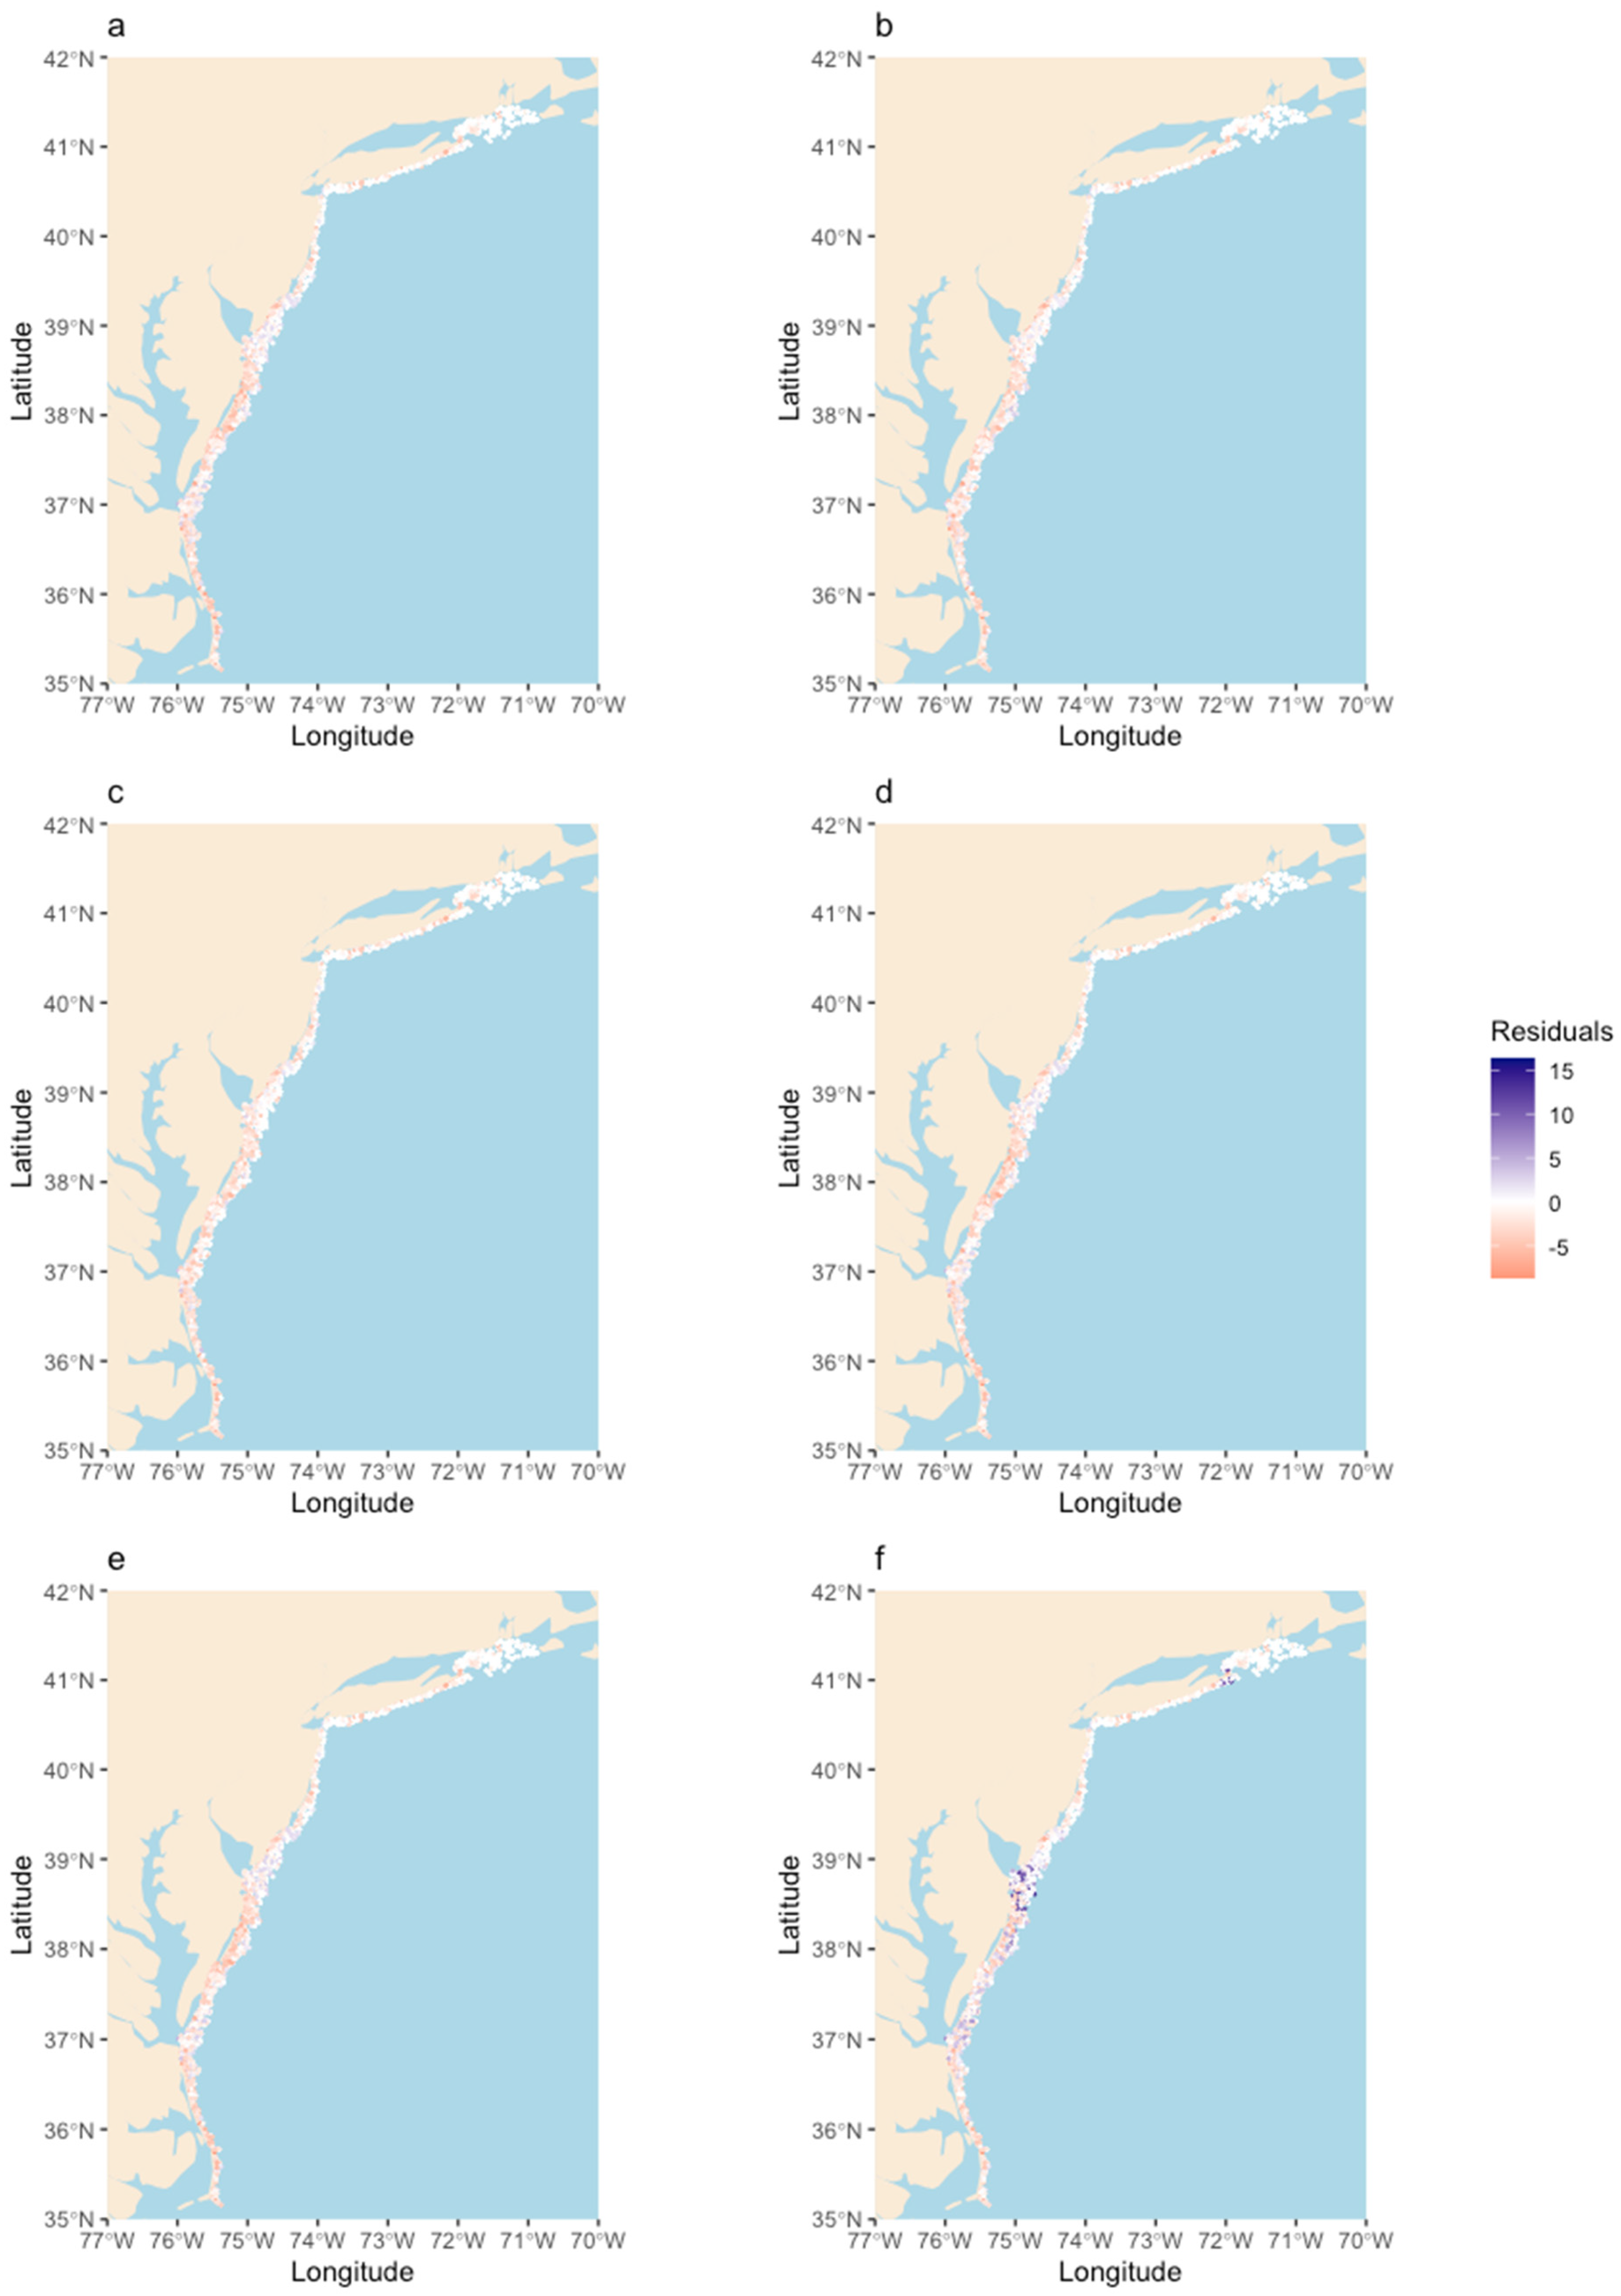

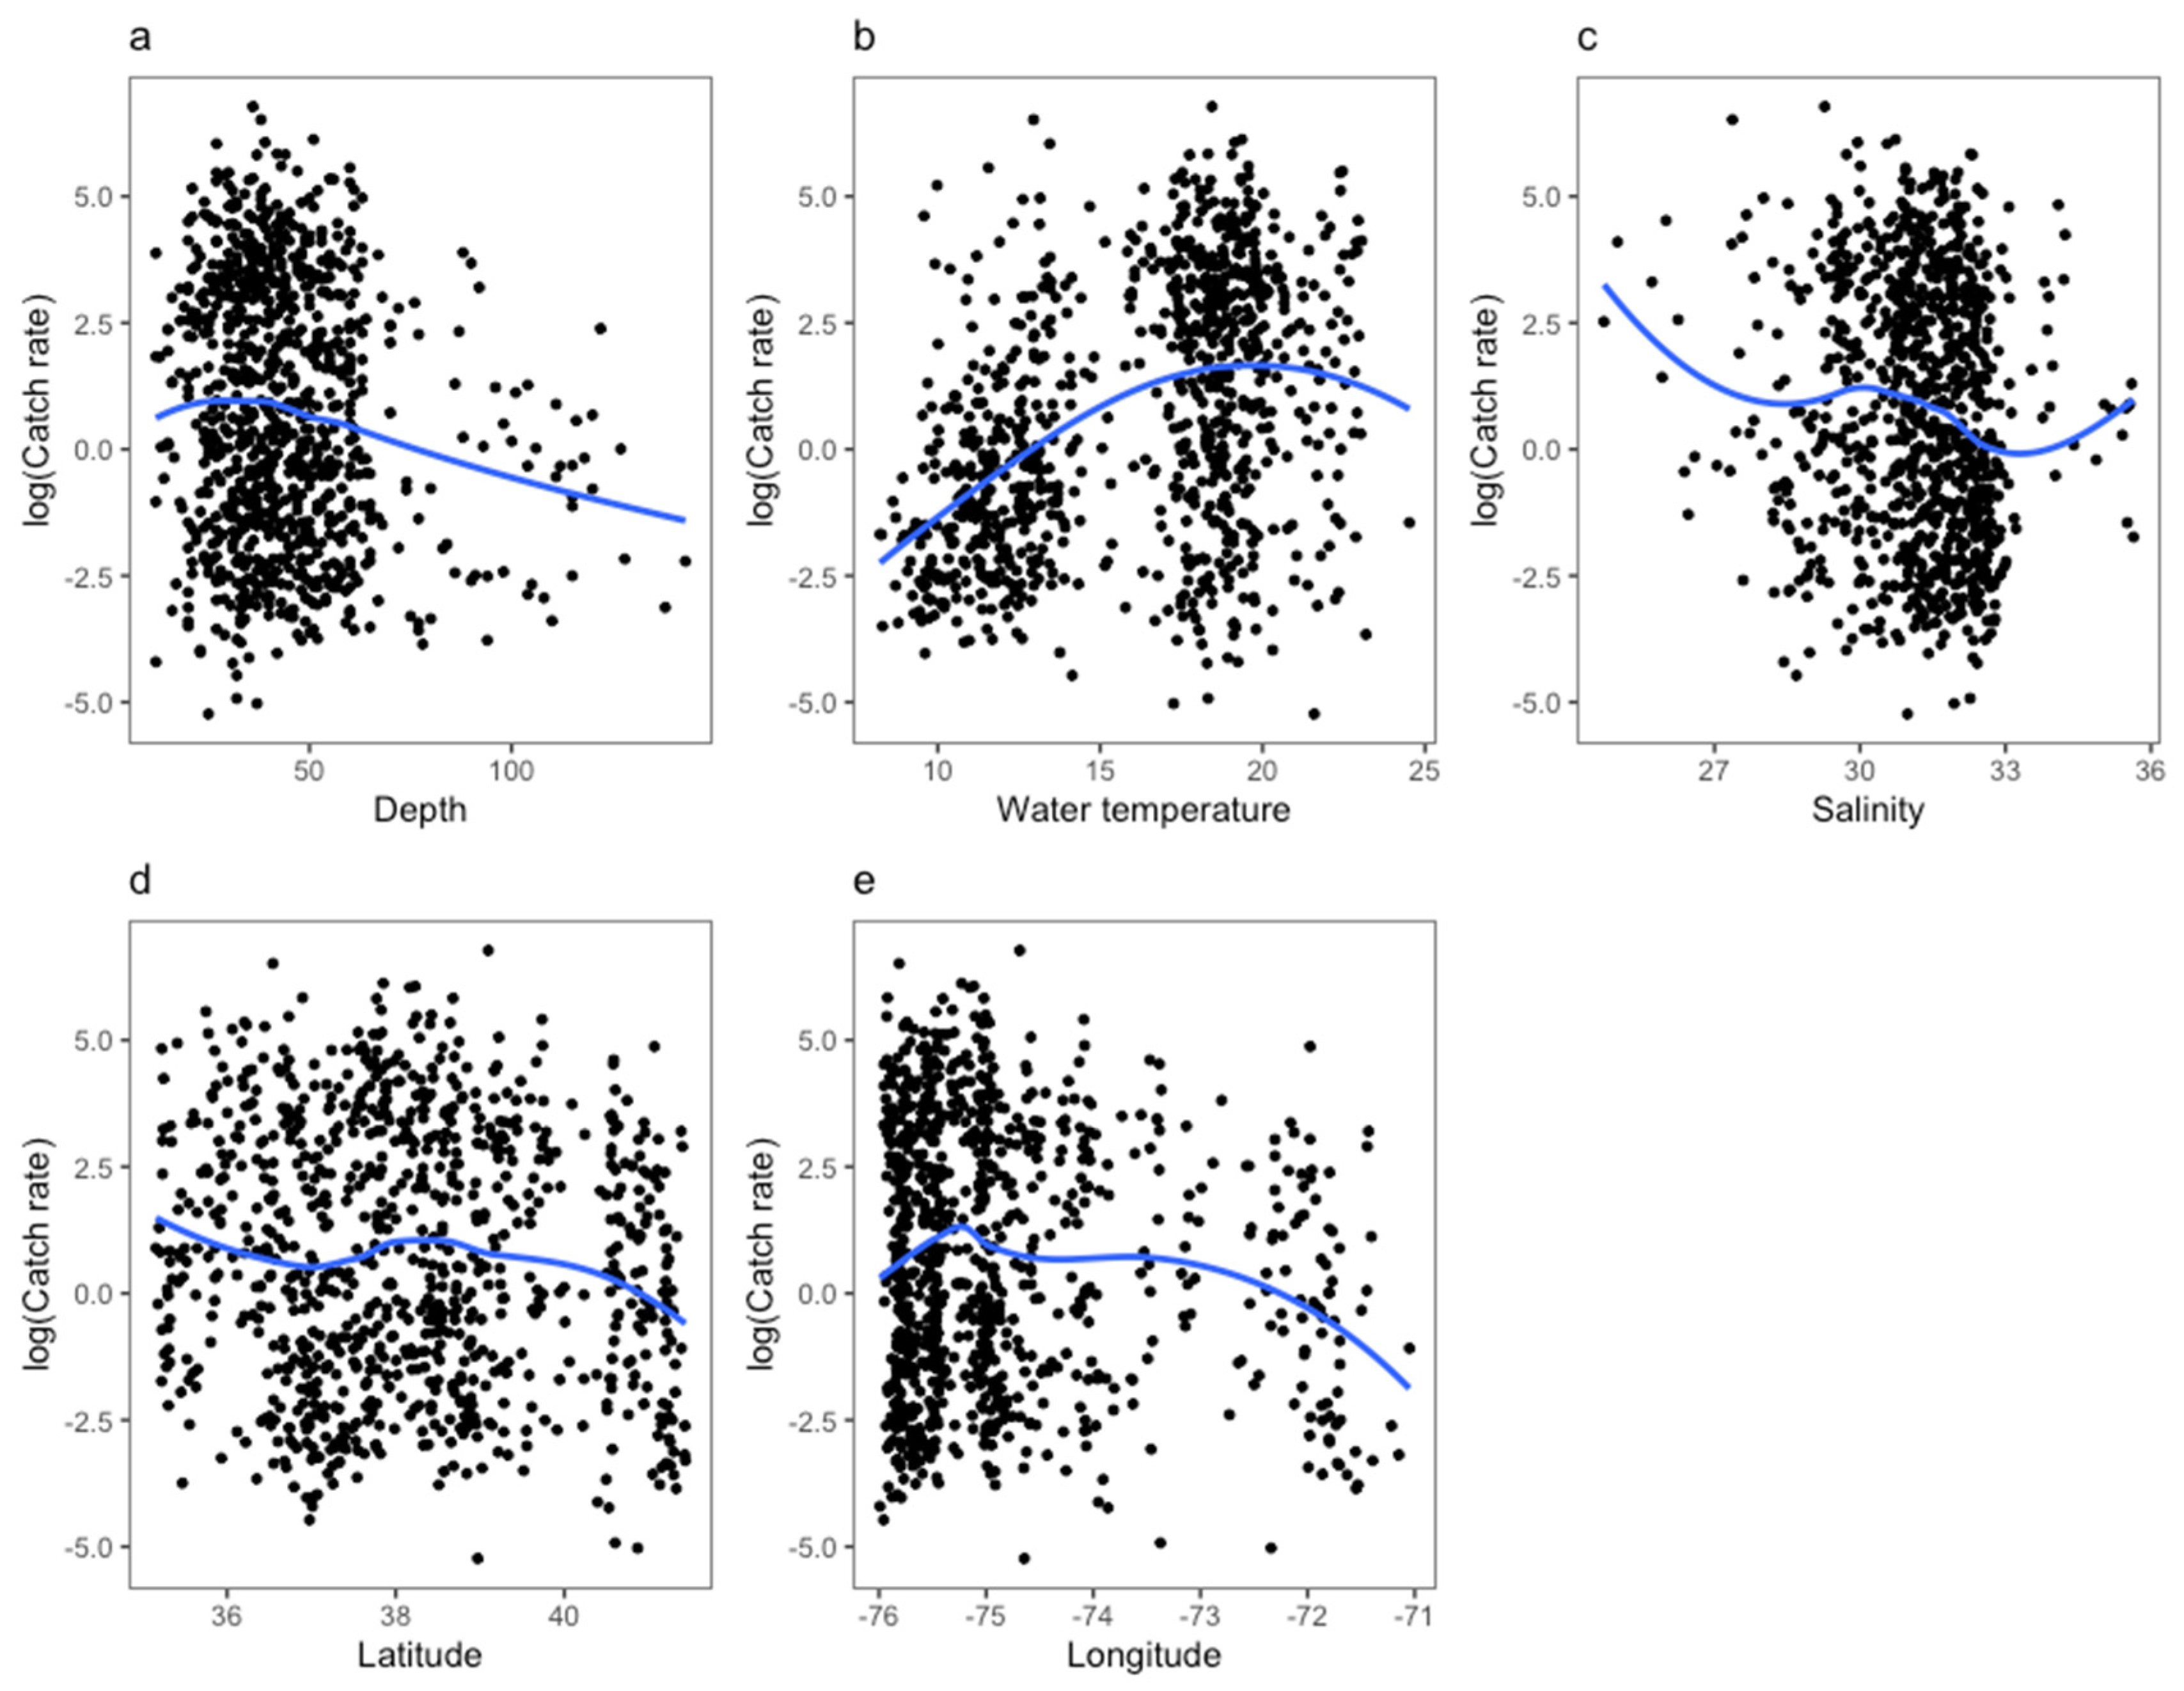
| Scenario | |||
|---|---|---|---|
| 1 | 2 | 3 | |
| Positive catch model a | |||
| GLM | 3985 | 4002 | 3983 |
| GAM | 3925 | 3886 | 3883 |
| Spatial GAM | 3886 | 3845 | 3843 |
| SAR error model | 3965 | 3976 | 3961 |
| SAR lag model | 3975 | 3989 | 3972 |
| SAR mixed model | 3962 | 3977 | 3957 |
| Presence-absence model b | |||
| GLM | 1741 | 1785 | 1717 |
| GAM | 1651 | 1602 | 1554 |
| Spatial GAM | 1487 | 1445 | 1408 |
| Auto covariate model | 1723 | 1750 | 1687 |
| Model | Delta GLM | Delta GAM | Delta Spatial GAM | Delta SAR Error Model | Delta SAR Lag Model | Delta SAR Mixed Model |
|---|---|---|---|---|---|---|
| Moran’s I | 0.21 | 0.18 | 0.20 | 0.21 | 0.22 | 0.55 |
| p-value | <0.001 | <0.001 | <0.001 | <0.001 | <0.001 | <0.001 |
| Model | Delta GLM | Delta GAM | Delta Spatial GAM | Delta SAR Error Model | Delta SAR Lag Model | Delta SAR Mixed Model |
|---|---|---|---|---|---|---|
| Training error | 5.46 | 5.03 | 4.78 | 5.40 | 6.74 | 8.03 |
| Testing error | 5.55 | 5.21 | 5.01 | 5.50 | 6.26 | 6.36 |
| “True” Model | Delta GLM | Delta GAM | Delta Spatial GAM | Delta SAR Error Model | Delta SAR Lag Model | Delta SAR Mixed Model |
|---|---|---|---|---|---|---|
| GLM | 85.75 | 85.58 | 85.51 | 85.88 | 85.93 | 86.00 |
| GAM | 191.14 | 190.97 | 190.94 | 191.31 | 191.43 | 191.91 |
| SAR error model | 99.18 | 99.07 | 99.03 | 99.34 | 99.41 | 99.56 |
Disclaimer/Publisher’s Note: The statements, opinions and data contained in all publications are solely those of the individual author(s) and contributor(s) and not of MDPI and/or the editor(s). MDPI and/or the editor(s) disclaim responsibility for any injury to people or property resulting from any ideas, methods, instructions or products referred to in the content. |
© 2022 by the authors. Licensee MDPI, Basel, Switzerland. This article is an open access article distributed under the terms and conditions of the Creative Commons Attribution (CC BY) license (https://creativecommons.org/licenses/by/4.0/).
Share and Cite
Zhang, Y.; Jiao, Y.; Latour, R.J. Nonlinearity and Spatial Autocorrelation in Species Distribution Modeling: An Example Based on Weakfish (Cynoscion regalis) in the Mid-Atlantic Bight. Fishes 2023, 8, 27. https://doi.org/10.3390/fishes8010027
Zhang Y, Jiao Y, Latour RJ. Nonlinearity and Spatial Autocorrelation in Species Distribution Modeling: An Example Based on Weakfish (Cynoscion regalis) in the Mid-Atlantic Bight. Fishes. 2023; 8(1):27. https://doi.org/10.3390/fishes8010027
Chicago/Turabian StyleZhang, Yafei, Yan Jiao, and Robert J. Latour. 2023. "Nonlinearity and Spatial Autocorrelation in Species Distribution Modeling: An Example Based on Weakfish (Cynoscion regalis) in the Mid-Atlantic Bight" Fishes 8, no. 1: 27. https://doi.org/10.3390/fishes8010027
APA StyleZhang, Y., Jiao, Y., & Latour, R. J. (2023). Nonlinearity and Spatial Autocorrelation in Species Distribution Modeling: An Example Based on Weakfish (Cynoscion regalis) in the Mid-Atlantic Bight. Fishes, 8(1), 27. https://doi.org/10.3390/fishes8010027


