Article

Transcriptome Analysis Reveals Cross-Tissue Metabolic Pathway Changes in Female Rana dybowskii during Emergence from Hibernation

1
Key Laboratory of Freshwater Aquatic Biotechnology and Breeding, Ministry of Agriculture and Rural Affairs, Heilongjiang River Fisheries Research Institute of Chinese Academy of Fishery Sciences, Harbin 150070, China
2
Key Laboratory of Molecular Cytogenetics and Genetic Breeding of Heilongjiang Province, College of Life Science and Technology, Harbin Normal University, Harbin 150025, China
*
Author to whom correspondence should be addressed.
Fishes 2023, 8(12), 569; https://doi.org/10.3390/fishes8120569
Submission received: 13 October 2023 / Revised: 15 November 2023 / Accepted: 20 November 2023 / Published: 22 November 2023
(This article belongs to the Special Issue Functional Genomics for Sustainable Aquaculture)

Abstract

:
The brown frog (Rana dybowskii) exhibits a wide distribution and is extensively cultured in northeast China. This species undergoes a prolonged period of hibernation lasting from several months to half a year. The frog’s fallopian tubes are considered a valuable tonic medicine known as “Oviducts Ranae” in traditional Chinese medicine. To enhance comprehension of the molecular mechanism underlying the process of emergence from hibernation, a transcriptome-based comparative analysis was performed on differentially expressed genes (DEGs) across various organs of female frogs during hibernation and upon emergence. The organs examined encompassed the brain, liver, spleen, fallopian tube, and ovary. Subsequently, GO and KEGG enrichment analyses were performed to gain further insights into these DEGs. A total of 51,634 transcripts were identified in all five tissues. The spleen exhibited the highest number of DEGs, with 3651 members, while the liver, brain, and fallopian tube had 3182, 3115, and 3186 DEGs, respectively. The ovary had the lowest number of DEGs, with only 1661. Interestingly, only 45 genes were found to be differentially expressed in all five tissues, and GO enrichment analysis revealed distinct functional differences among the DEGs in the various tissues. Only two meaningful DEG-enriched KEGG pathways, “00310 Lysine degradation” and “05202 Transcriptional misregulation in cancer”, were present in all five tissues, and the pathway “B 09182 Protein families: genetic information processing” was significantly enriched in four tissues except the ovary, and it had the most enriched DEGs. Our findings offer insights to grasp the factors that need to be controlled in the design of overwintering sites and offer a novel perspective for the conservation and management of the overwintering population of female R. dybowskii.
Key Contribution: The brown frog exhibits a significant economic disparity between sexes, with the female possessing high economic value and the male little commercial worth. The hibernation phase of this species can last for an extended period, and inadequate management of hibernating populations can result in substantial losses for farmers. Through the utilization of multi-tissue comparative transcriptome analysis, this study proposes potential pathways implicated in the emergence from hibernation, thereby offering a fresh outlook on the management of hibernating populations.

1. Introduction

Rana dybowskii, a widely distributed brown frog in northeast Asia, undergoes a hibernation period lasting 4–6 months during winter to endure the extreme cold and scarcity of food [1]. In China, it is commonly referred to as the “snow frog”. According to traditional Chinese medicine, the R. dybowskii‘s fallopian tubes possess the ability to combat adversity, particularly cold temperatures, and are considered a valuable tonic medicine known as “Oviductus Ranae” in the Chinese Pharmacopoeia (2020 edition) [2]. Contemporary medical research has indeed identified certain immune regulatory and anti-glioma properties associated with this product [3]. R. dybowskii holds significant ecological value within the forest ecosystem of northeast China and has a notable historical background of domestication and utilization [4]. According to statistical data from the Chinese Fisheries Administration, approximately 36,400 family farms, primarily concentrated in the three northeastern provinces and the eastern region of the Inner Mongolia Autonomous Region, engage in its cultivation, providing employment to over 520,000 individuals and yielding an annual output value of approximately 20 billion yuan (https://www.gov.cn/zhengce/2021-04/15/content_5599794.htm, accessed on 30 September 2023). R. dybowskii exhibits a significant sex-based economic disparity, with females possessing higher commercial value, while males have lower economic worth. This discrepancy arises from the female frog’s ability to produce valuable Oviductus Ranae and the delectable nature of their fallopian tubes and eggs as fresh food, whereas the monetary value of frog meat remains modest. Consequently, both researchers and industry are increasingly focusing on studying the reproductive biology of females.
Hibernation is an adaptive strategy adopted by many animals to survive the cold, foodless winter. During the winter, hibernating animals stay in their hiding places, suppressing their metabolic rate to conserve energy, water, and oxygen [5]. The underlying molecular mechanisms are different between endotherms and poikilotherms [6]. In amphibians and reptiles, hibernation is essential for the maturation of oocytes in Chinese alligators (Alligator sinensis) [7], and hibernation is essential for the spawning and fertilization of mountain yellow-legged frogs (Rana muscosa) [8]. For R. dybowskii, which lives in the long, extremely cold winters, hibernation is a protective mechanism against low temperatures and a necessary life stage for germ cells to mature, playing an important role in life history strategies that enable them to survive harsh environmental conditions [9]. Maintaining a suitable hibernation temperature helps keep the organism healthy [10]. The rapid rise in temperature in early spring causes physiological, biochemical, and hormonal changes in hibernating R. dybowskii, emergence from hibernation, and the start of chasing and mating behaviors [11]. However, the ecological effects of early emerging may also cause nutritional mismatches [12]. This may result in R. dybowskii being exposed to birds and other predators much earlier than when vegetation is thick, which directly impacts individual fitness and population dynamics. Similarly, after emerging too late from hibernation, malnutrition in particular can hinder the recovery of physical condition and reduce or delay reproduction. Understanding the physiological mechanism of emergence from hibernation has important theoretical and practical value for the proliferation of natural resources and the reproduction of farmed populations.
Differentially expressed genes (transcripts) (DEGs) refer to genes (transcripts) with significantly different expression levels under two different conditions, such as control and treatment, wild type and mutant, different time points, or different tissues [13]. Transcriptome sequencing is a useful tool for rapidly screening and targeting DEGs under different treatments or in response to environmental signals [14]. In general, DEG lists from different experiments rarely overlap under similar conditions. Many gene functions in non-model species may not be well characterized, and trying to understand and explain a large number of DEGs without a unified biological theme is challenging and has proved unsatisfying [15]. Genes perform their functions by interacting and networking to form complex pathways. The pathway-based approach involves selecting a gene set associated with a biological process when changes are observed in a specific study [16]. The enrichment probability of the DEGs set in a pathway of interest is compared to that of a randomly selected gene set with the same number of genes in this pathway, and if there is a significant difference, it indicates that this pathway should be relevant to the current change. Pathway-based approaches are beneficial because they help researchers study multiple genes by focusing on specific physiological processes and linking them to a complex trait, and these approaches also provide a logical basis for studying gene–gene interactions in the genetic architecture of complex traits or behaviors [17]. In addition, pathway functions are better studied and more stable across species in comparison and are much more robust than at the level of individual genes [18].
In the present research, transcriptome sequencing analyses of multiple tissues, including brain, liver, spleen, fallopian tube, and ovary tissue, were performed, a large number of DEGs was detected, and functional bioinformatics analysis of these genes was performed to identify metabolic pathway changes during emergence from hibernation in female R. dybowskii.

2. Materials and Methods

2.1. Animal Samples

In this study, three medium-sized (about 45 g) individuals were dissected and sampled from the treatment and control groups, respectively. Due to the group hibernation habit, a total of 30 deep-hibernating female frogs were collected from the experimental station of R. dybowskii aquaculture in Yangjiatun, Acheng District, Harbin, Heilongjiang Province, in early February 2023. All of the frogs were transferred to an indoor aquarium with a length of 80 cm, a width of 35 cm, and a height of 40 cm, which contained fully aerated distilled water with a depth of 5 cm, and continued hibernating for a week in an environment sheltered from light at 2 °C. As the control group, three medium-sized individuals with similar body shape and specifications were randomly selected, and the brain, liver, spleen, fallopian tube, and ovary tissues were dissected and stored in liquid nitrogen. Then, the aquarium was placed in a dark environment of 12 °C and 50% relative humidity, and the water temperature was recorded every 30 min. As the frogs woke up successively, the timing began when the water temperature reached 12 °C and the sampling began 12 h later. The sampling and tissue preservation methods were the same as that of the control group. After the experiment, all of the remaining frogs were released back to hibernation waters in the experimental station.

2.2. Total RNA Extraction and RNA Sequencing

Total RNA was isolated using Trizol reagent (Thermo Fisher Scientific, Waltham, MA, USA), and RNA degradation and contamination were monitored on 1% agarose gels, using the standardized protocols following the manufacturer’s instructions (Thermo Fisher Scientific, USA). RNA samples (the amount of RNA was 3 μg for each sample) were sent to the Experimental Department of BioMarker Technologies Corporation (Qingdao, China) as input material for the sample library preparations according to the manufacturer’s instructions; the indexed coded samples were clustered on the cBot Cluster generation system using the TruSeq SR Cluster Kit V3-Cbott-HS (Illumina, San Diego, CA, USA). Then, the library preparations were sequenced on an Illumina NovaSeq 6000 platform, and 150 bp paired-end reads were generated, according to the manufacturer’s recommendations (Illumina, CA, USA).

2.3. Sequence Alignment and Functional Annotation of RNA-Seq Data

The genomic information for the common frog (Rana temporaria), encompassing the genome, transcripts, and protein sequences, was obtained from the National Center for Biotechnology Information (NCBI) (https://www.ncbi.nlm.nih.gov/genome/?term=rana, accessed on 30 September 2023) [19]. First, adapter sequences and low-quality reads were eliminated from the raw sequence data of R. dybowskii. Next, the RNA-seq reads were aligned to transcripts using the Salmon method [20], and their expression levels were quantified using Salmon quant [20]. The unigenes were then subjected to a BLASTX search against the combined database of protein sequences from the UniProt database for functional annotation, with an E-value cutoff of 1 × 10⁻⁵ [21]. Subsequently, the unigenes were subjected to functional annotation by aligning them with their respective homologs in the integrated database, which encompassed Gene Ontology (GO) annotations [22].

2.4. Functional Enrichment Analysis of Differentially Expressed Genes

The matrix containing data on the number of reads mapped to each gene was imported into the R platform. The DESeq2 package was used to identify DEGs between the treatment group and control group for each tissue, respectively [23], with a significance threshold of p-value < 0.01. The genes with an expression difference greater than 2 times were identified (fold change magnitude > 2). The DEGs were then subjected to hierarchical clustering and visualized in R [24]. The annotations for DEGs and the subsequent enrichment analysis were performed using the topGO package [25]. The clusterProfiler R package v3.4.4 [26] was employed to identify the biological pathways in which the DEGs are involved in the emergence from hibernation. The statistical significance of each pathway was determined using the default criteria, and GO terms and Kyoto Encyclopedia of Genes and Genomes (KEGG) pathways with a p-value less than 0.05 were considered significantly enriched. The KEGG annotations were analyzed through the eggnog-mapper website (http://eggnog-mapper.embl.de/, accessed on 30 September 2023). All of the graphs were generated using the ggplot2 package in R [27].

2.5. Validation of Gene Expression Data by Real-Time Quantitative RT-PCR

In the above transcriptome analysis, the KEGG pathway involved in the GATA gene family was found to be highly enriched in various tissues. To confirm this result, the GATA gene family was selected for real-time quantitative PCR analysis. The protein sequence of the vertebrate GATA gene family was conserved, and we used well-studied human GATA protein sequences to search for GATA genes by homologous alignment of R. temporaria genome. The sequences of human GATA family proteins were collected from the NCBI database and used as BLAST (version 2.9.0+) query sequences to search the genome of R. temporaria [21], with an evaluation setting of 1 × 10⁻⁵, and the coverages were set as 80%. The HMM file (version 3.3) (PF00320) was downloaded from the Pfam database, and the HMMER (evalue: 0.01) [28] was used to identify and confirm the GATA DNA-binding domain, which was characterized as candidate GATA proteins. Subsequently, protein structure analysis was performed on the candidate genes to identify their GATA structural domains. Based on the amino acid sequences of the GATA gene family of R. temporaria, 16 GATA transcripts of R. dybowskii were successfully identified through multiple sequence comparisons. We designed primers for all of the transcripts of 16 GATA gene family members. Some primers scored too low in design, and some synthetic primers failed to obtain amplified fragments. Only 10 pairs of primers could be used to amplify clear PCR bands, with β-actin used as a reference control. The amplification experiment was conducted under the specified conditions, which included denaturation at 95 °C for 3 min, followed by 40 cycles of amplification at different temperatures (95 °C for 30 s, 60 °C for 30 s, and 55 °C for 45 s). The relative expression levels were determined using the delta-delta-Ct method, and the primer sequences used can be found in Table 1.

3. Results

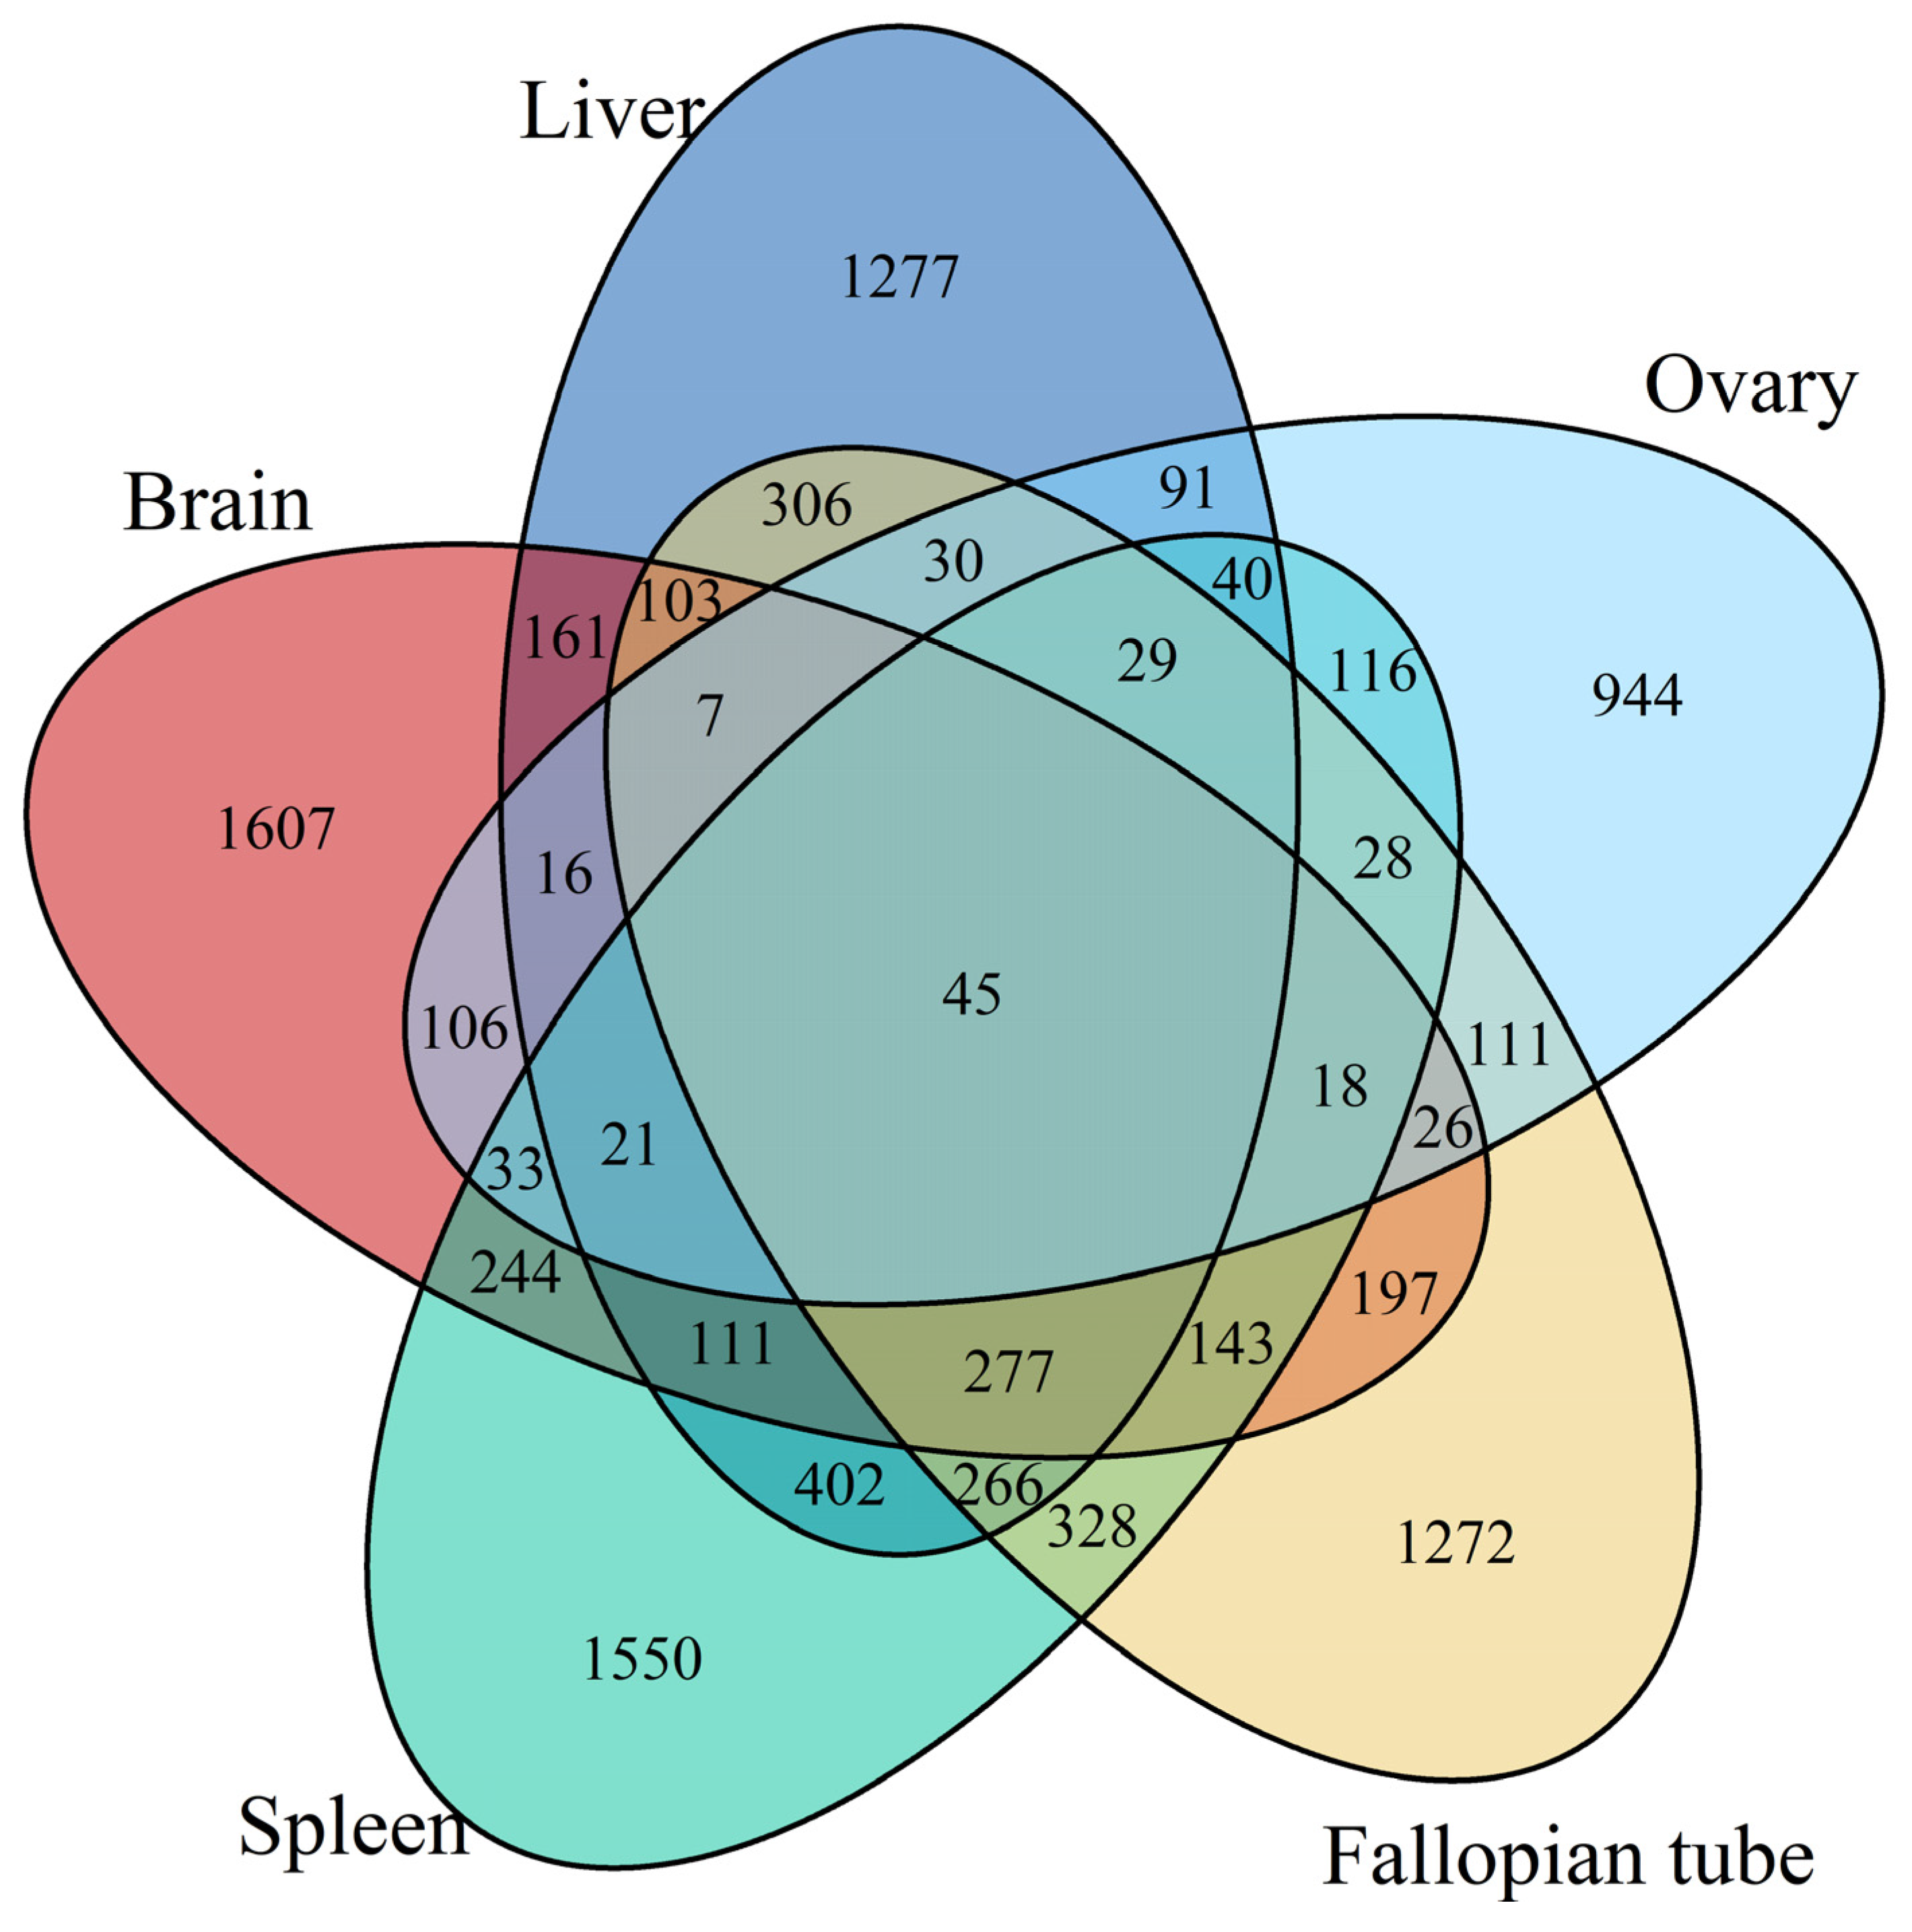
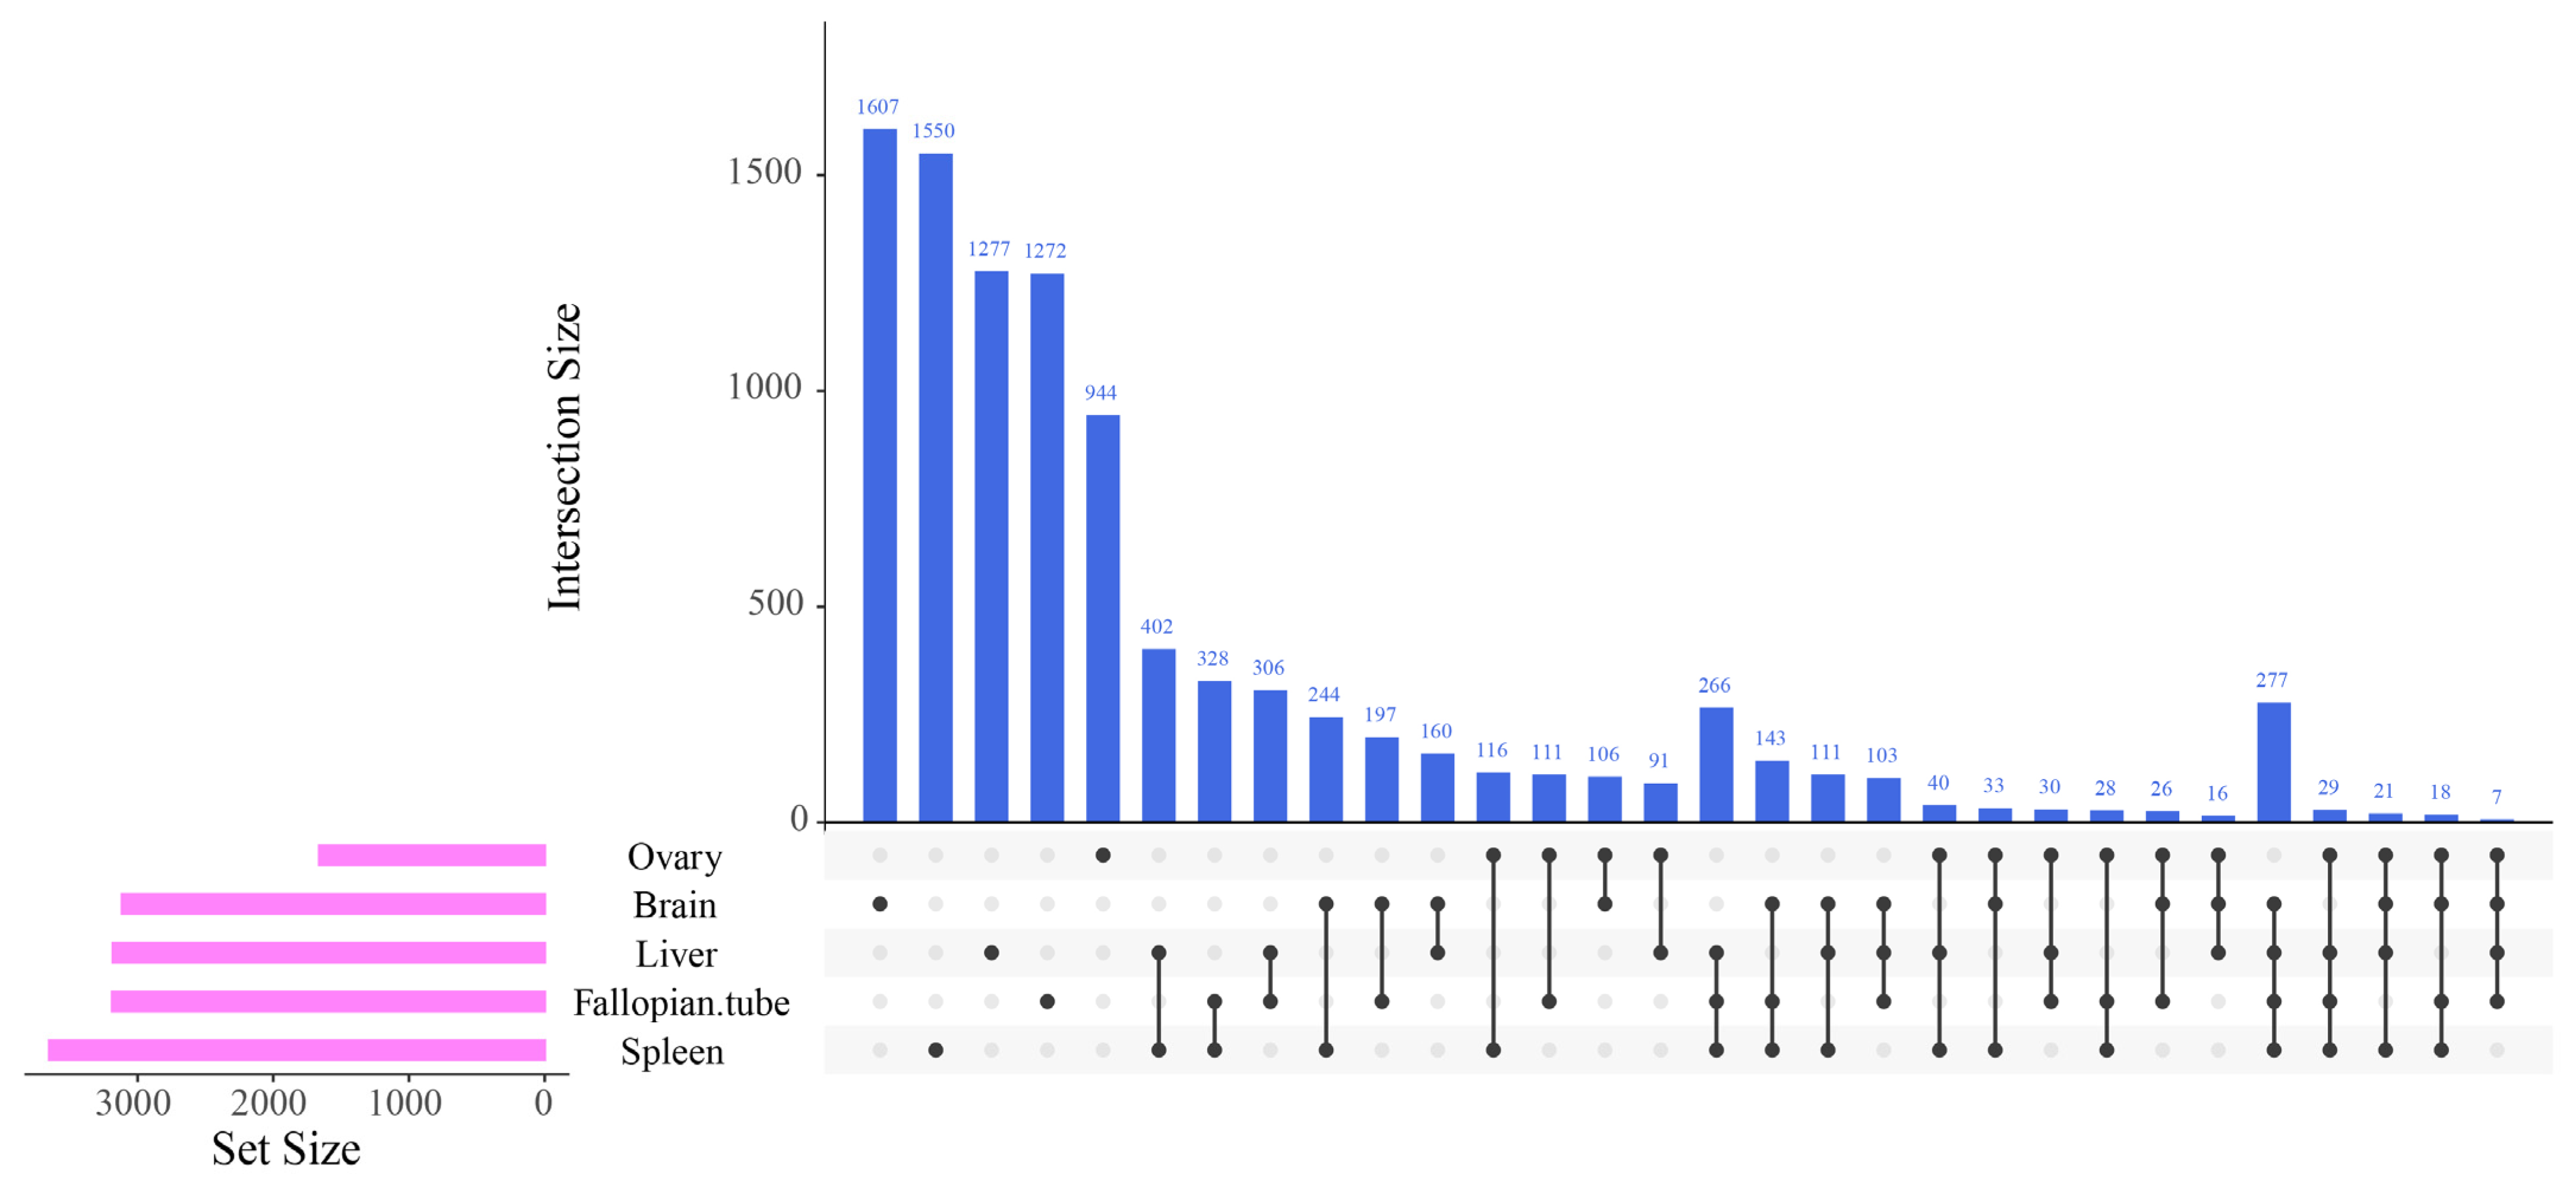
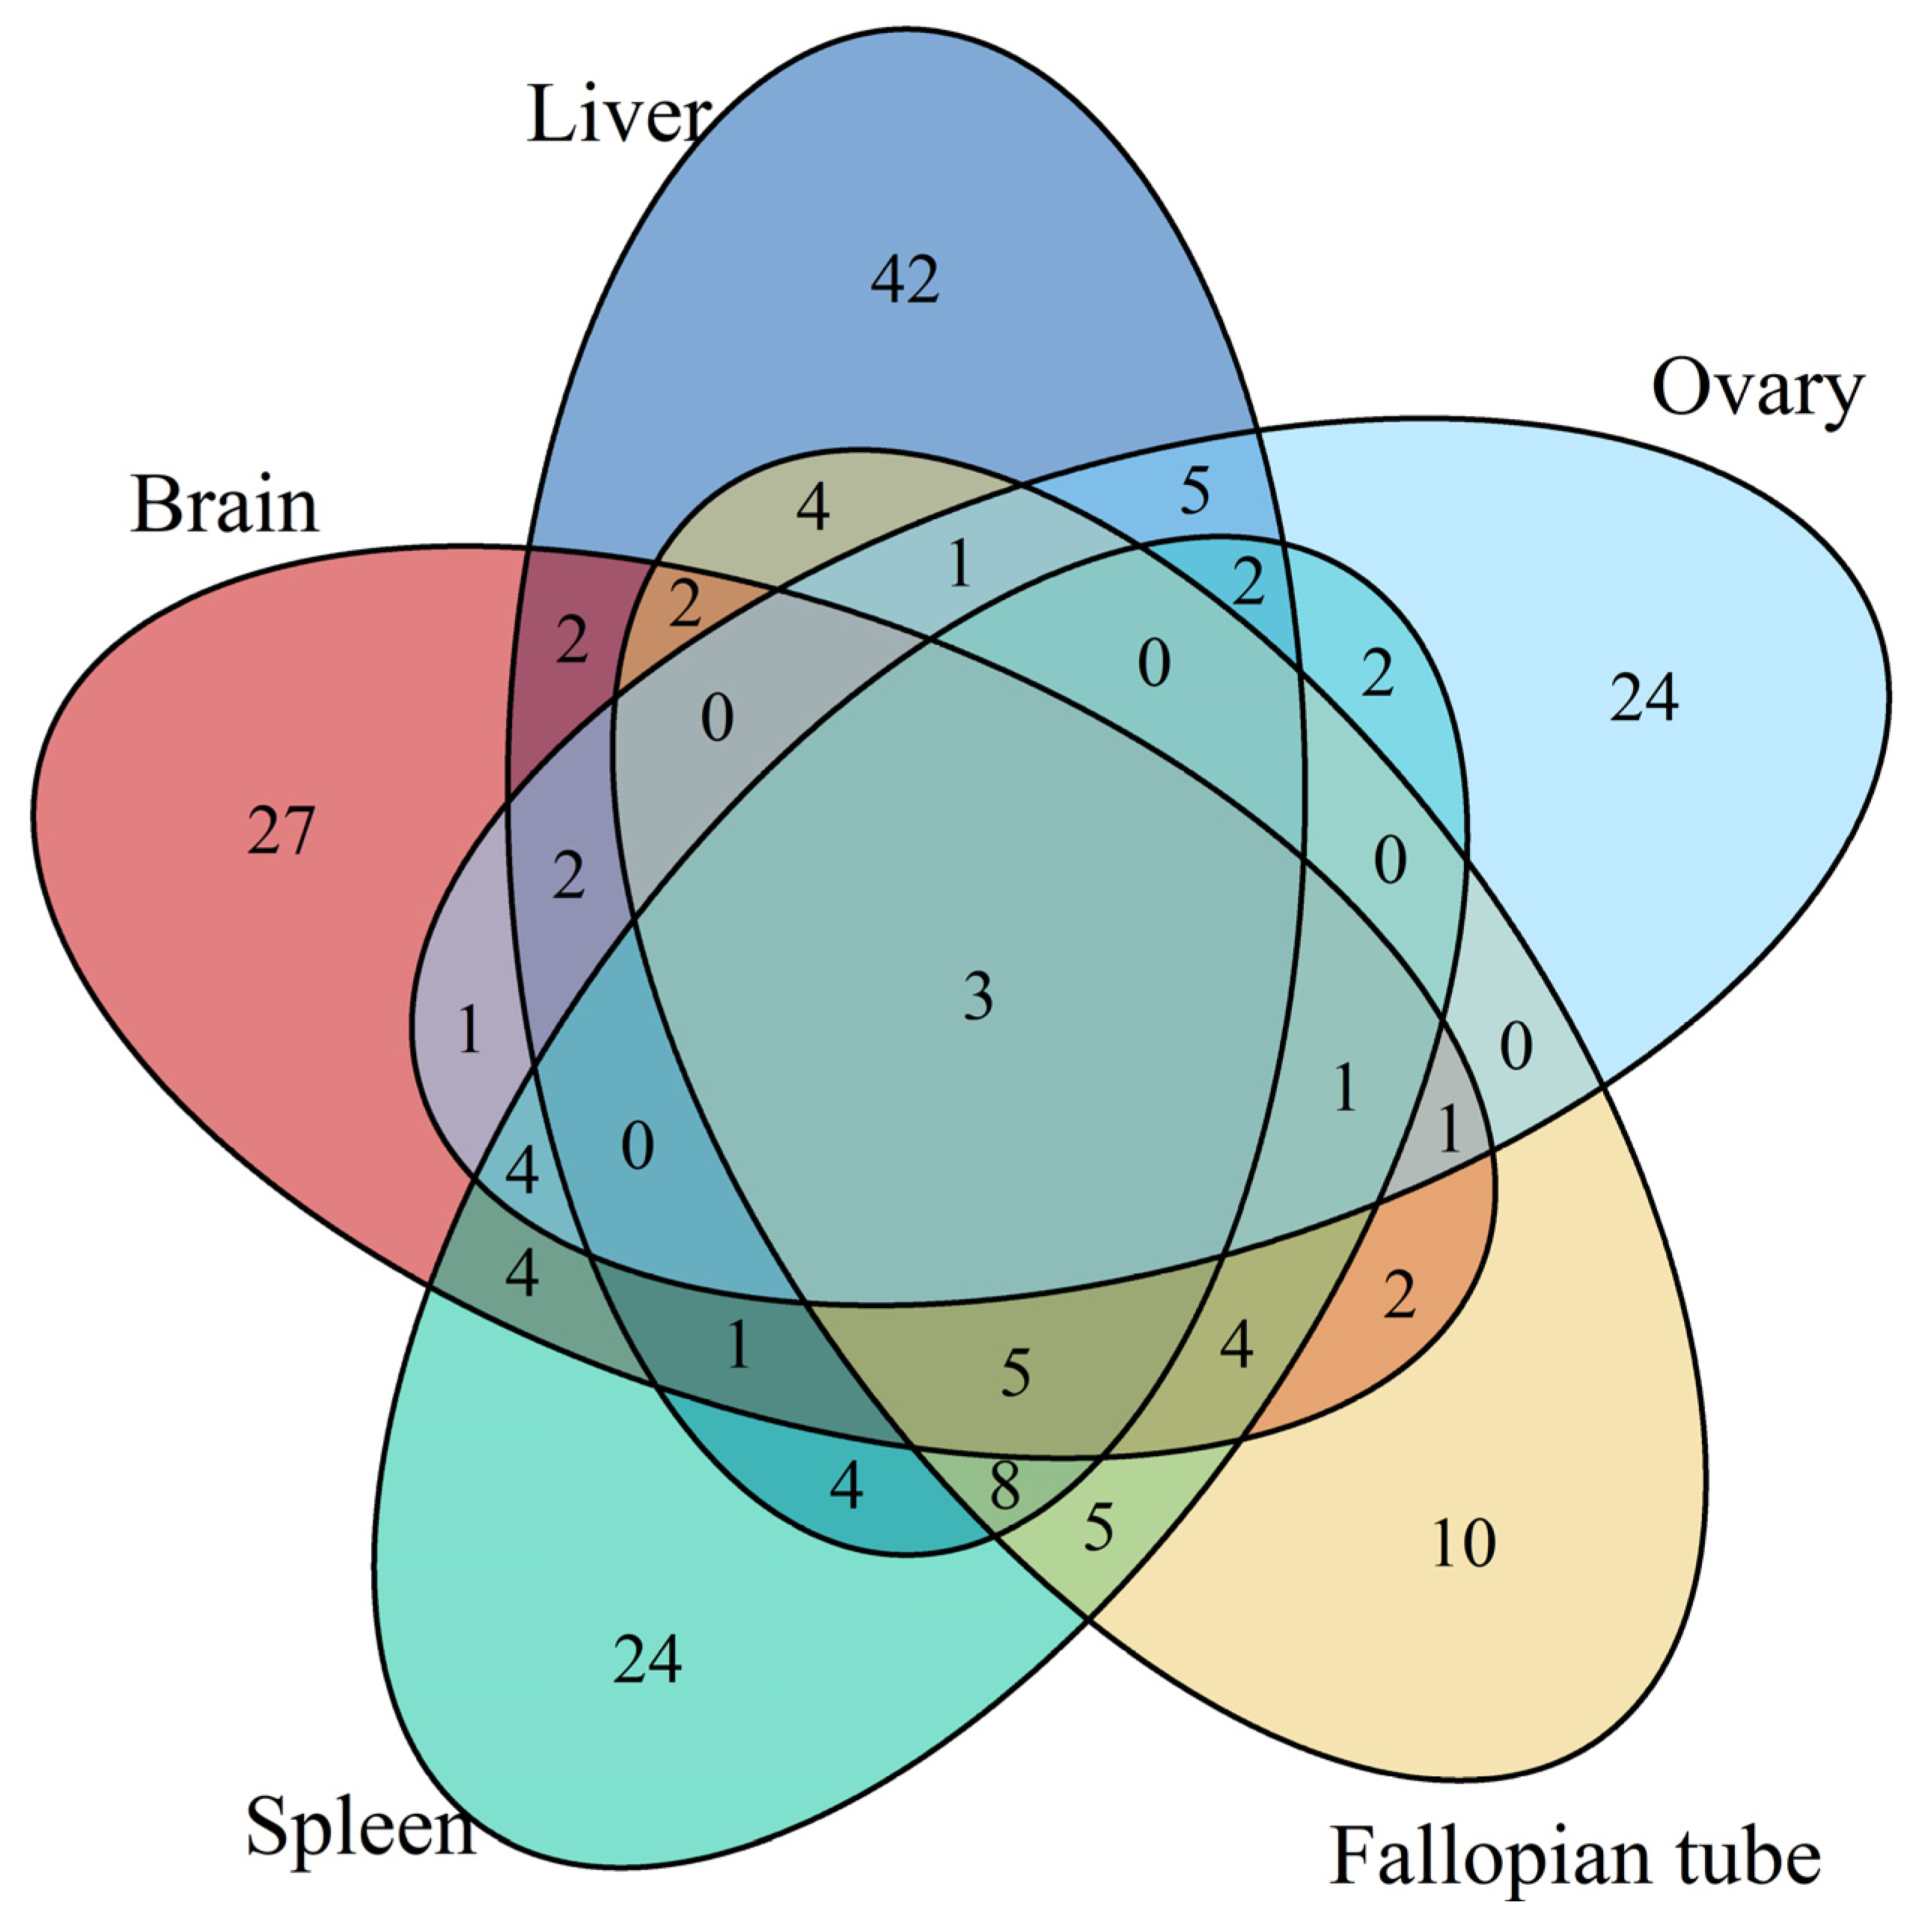
3.1. Differentially Expressed Gene Identification Involved in the Emergence from Hibernation

A total of 51,634 transcripts were identified, and DEGs were statistically analyzed in all five tissues. The spleen had the most DEGs, with 3651 members (Table S1). The amount of DEGs in the liver (Table S2), brain (Table S3), and fallopian tube (Table S4) was similar, 3182, 3115, and 3186, respectively. The lowest number was 1661, observed in the ovary (Table S5). A Venn diagram was used to display the distribution of DEGs within the same tissue and between different tissues. As a result, only 45 genes were differentially expressed in all five tissues (Figure 1).
We made a detailed comparative analysis of the amount of DEGs in and among all of the five tissues in this study. These results showed that these four tissues were more active and more consistent in gene expression than the ovary during recovery from hibernation, with 277 DEGs identified in all four tissues (Figure 2).
To reveal the expression patterns of DEGs in these tissues, we further performed a cluster analysis of DEGs in both the treatment and the control groups. These DEGs could be subdivided into 20 clusters according to their expression patterns. The DEGs were significantly up-regulated in cluster 3, 8, 11, 12, 14, and 19 in the ovary, and the DEGs in the brain were significantly up-regulated in cluster 1, 5, 9, 10, 16, and 20 (Figure 3). The average expression levels were retrieved from the RNA-seq database and logarithms base 2 were taken; the expression patterns of the above 20 clusters in the five tissues of the treatment group and the control group are shown in Figure 4.

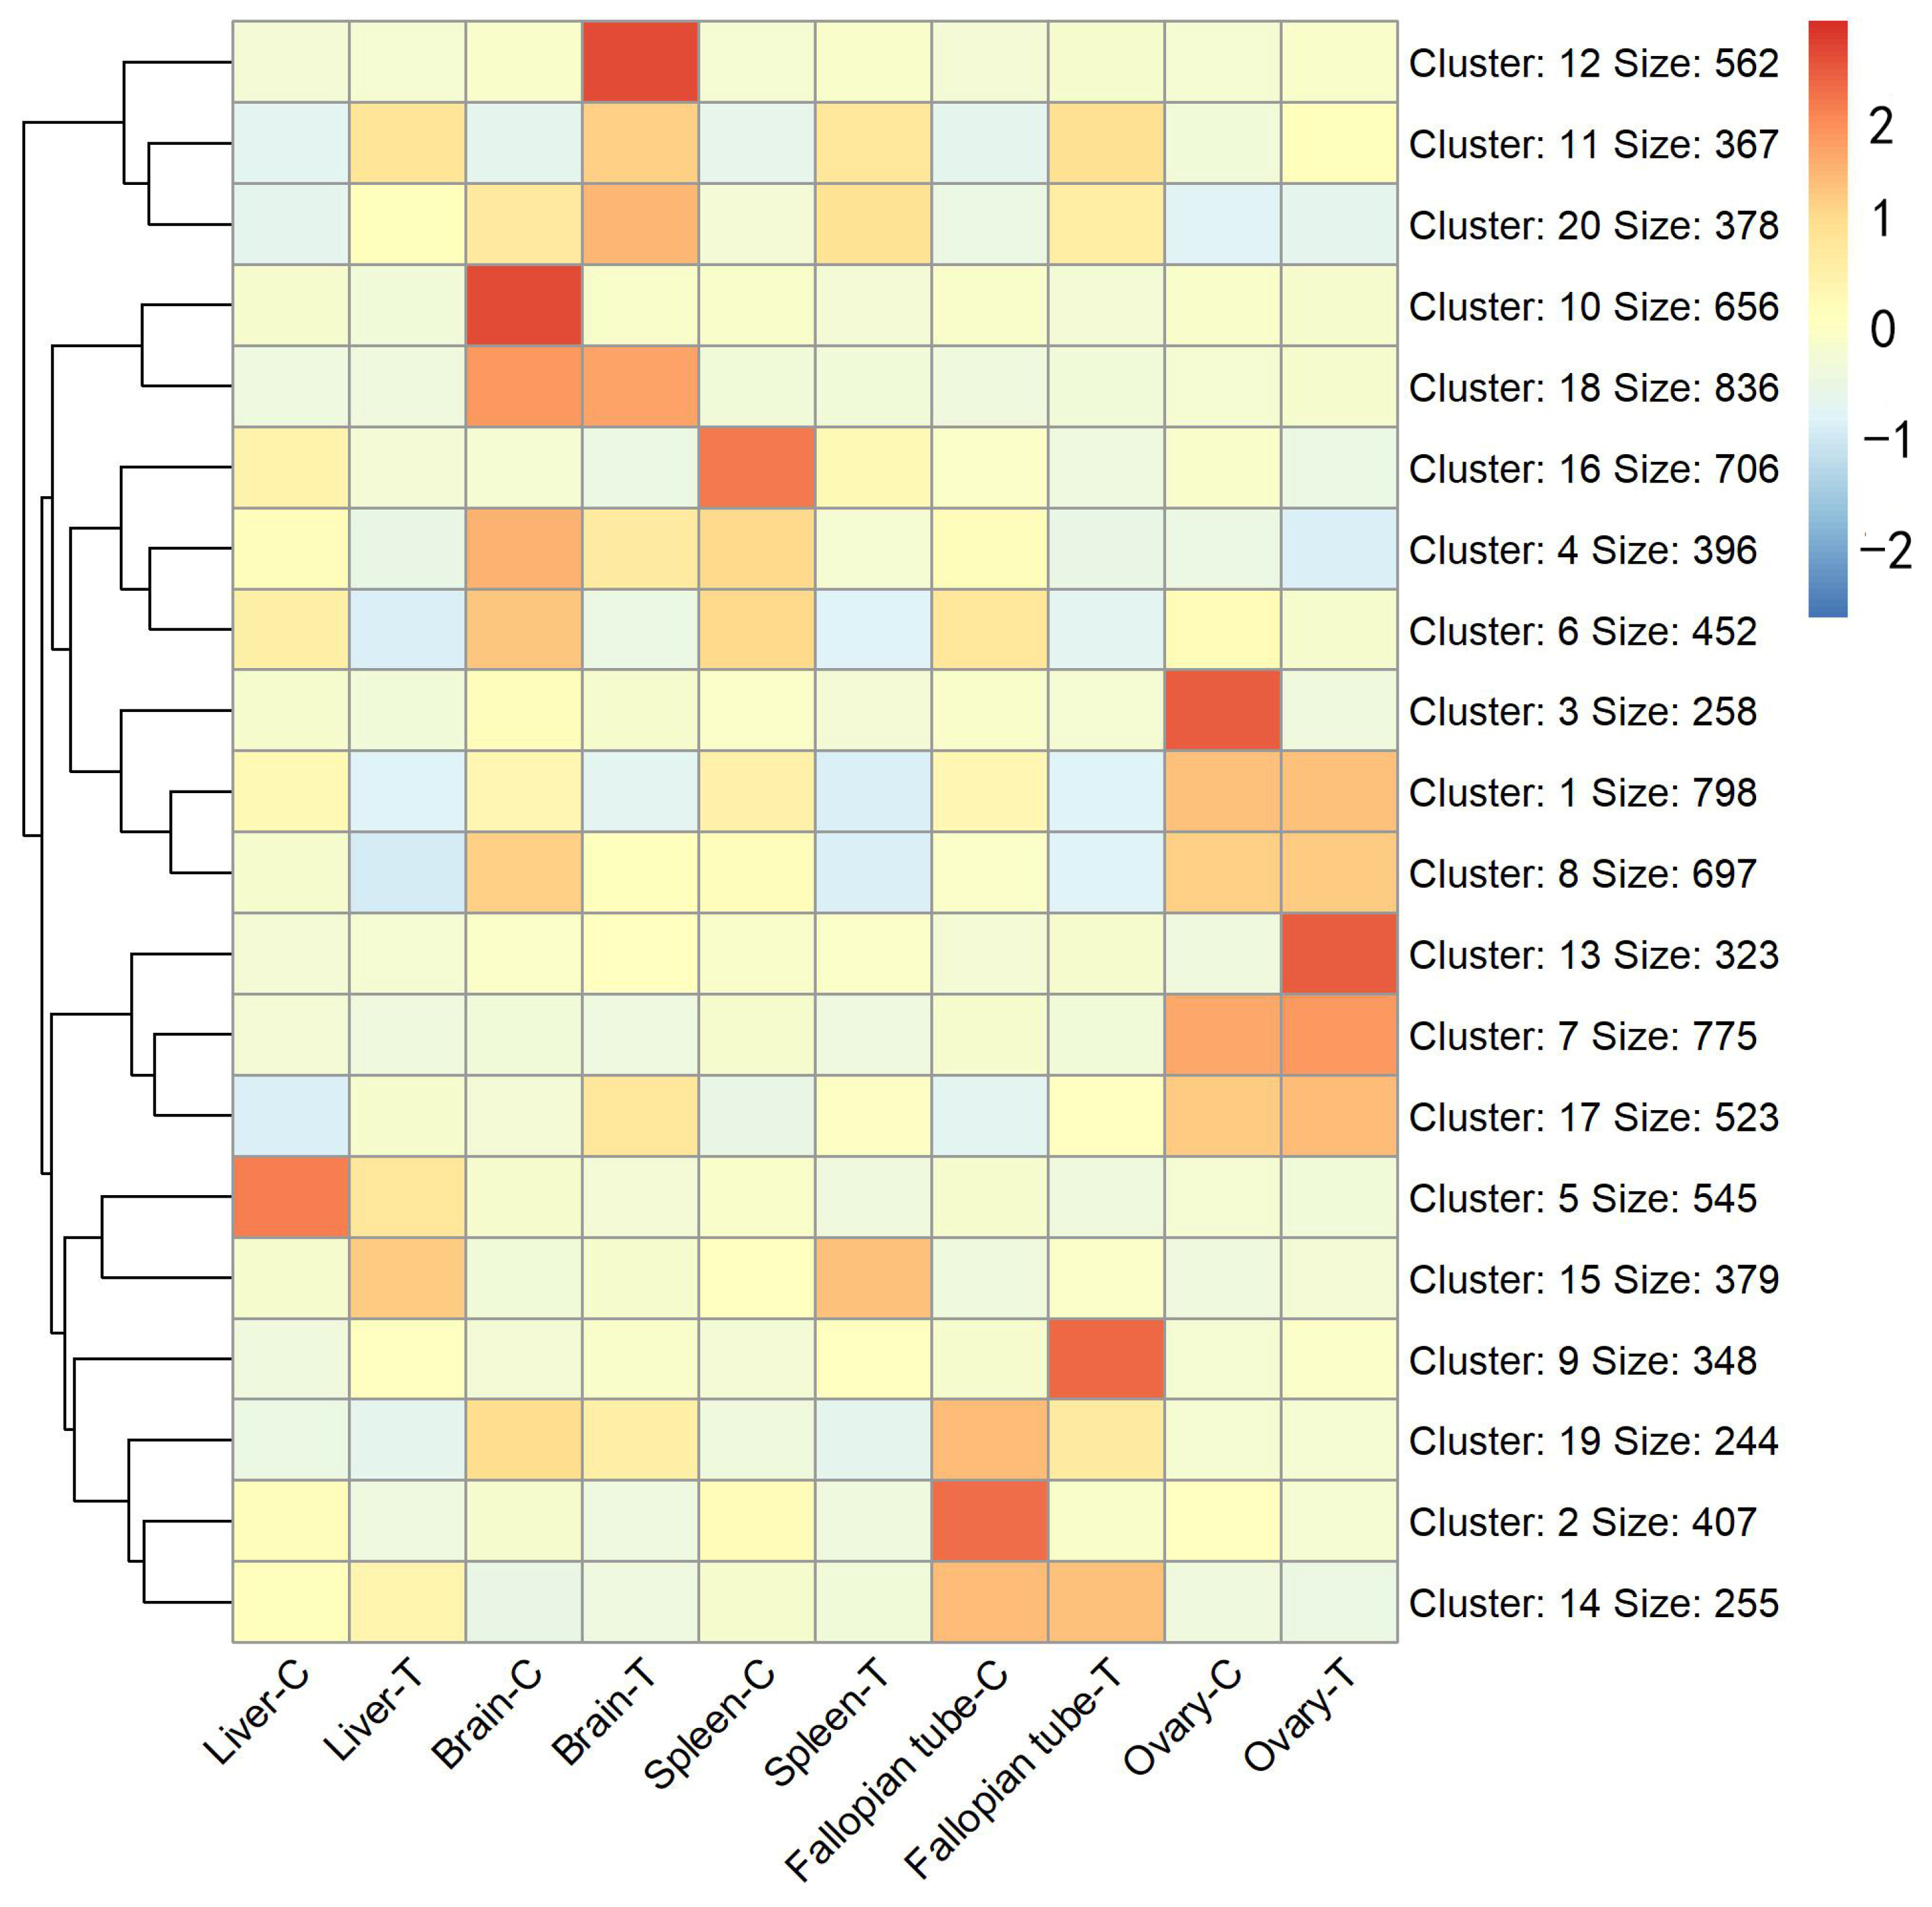
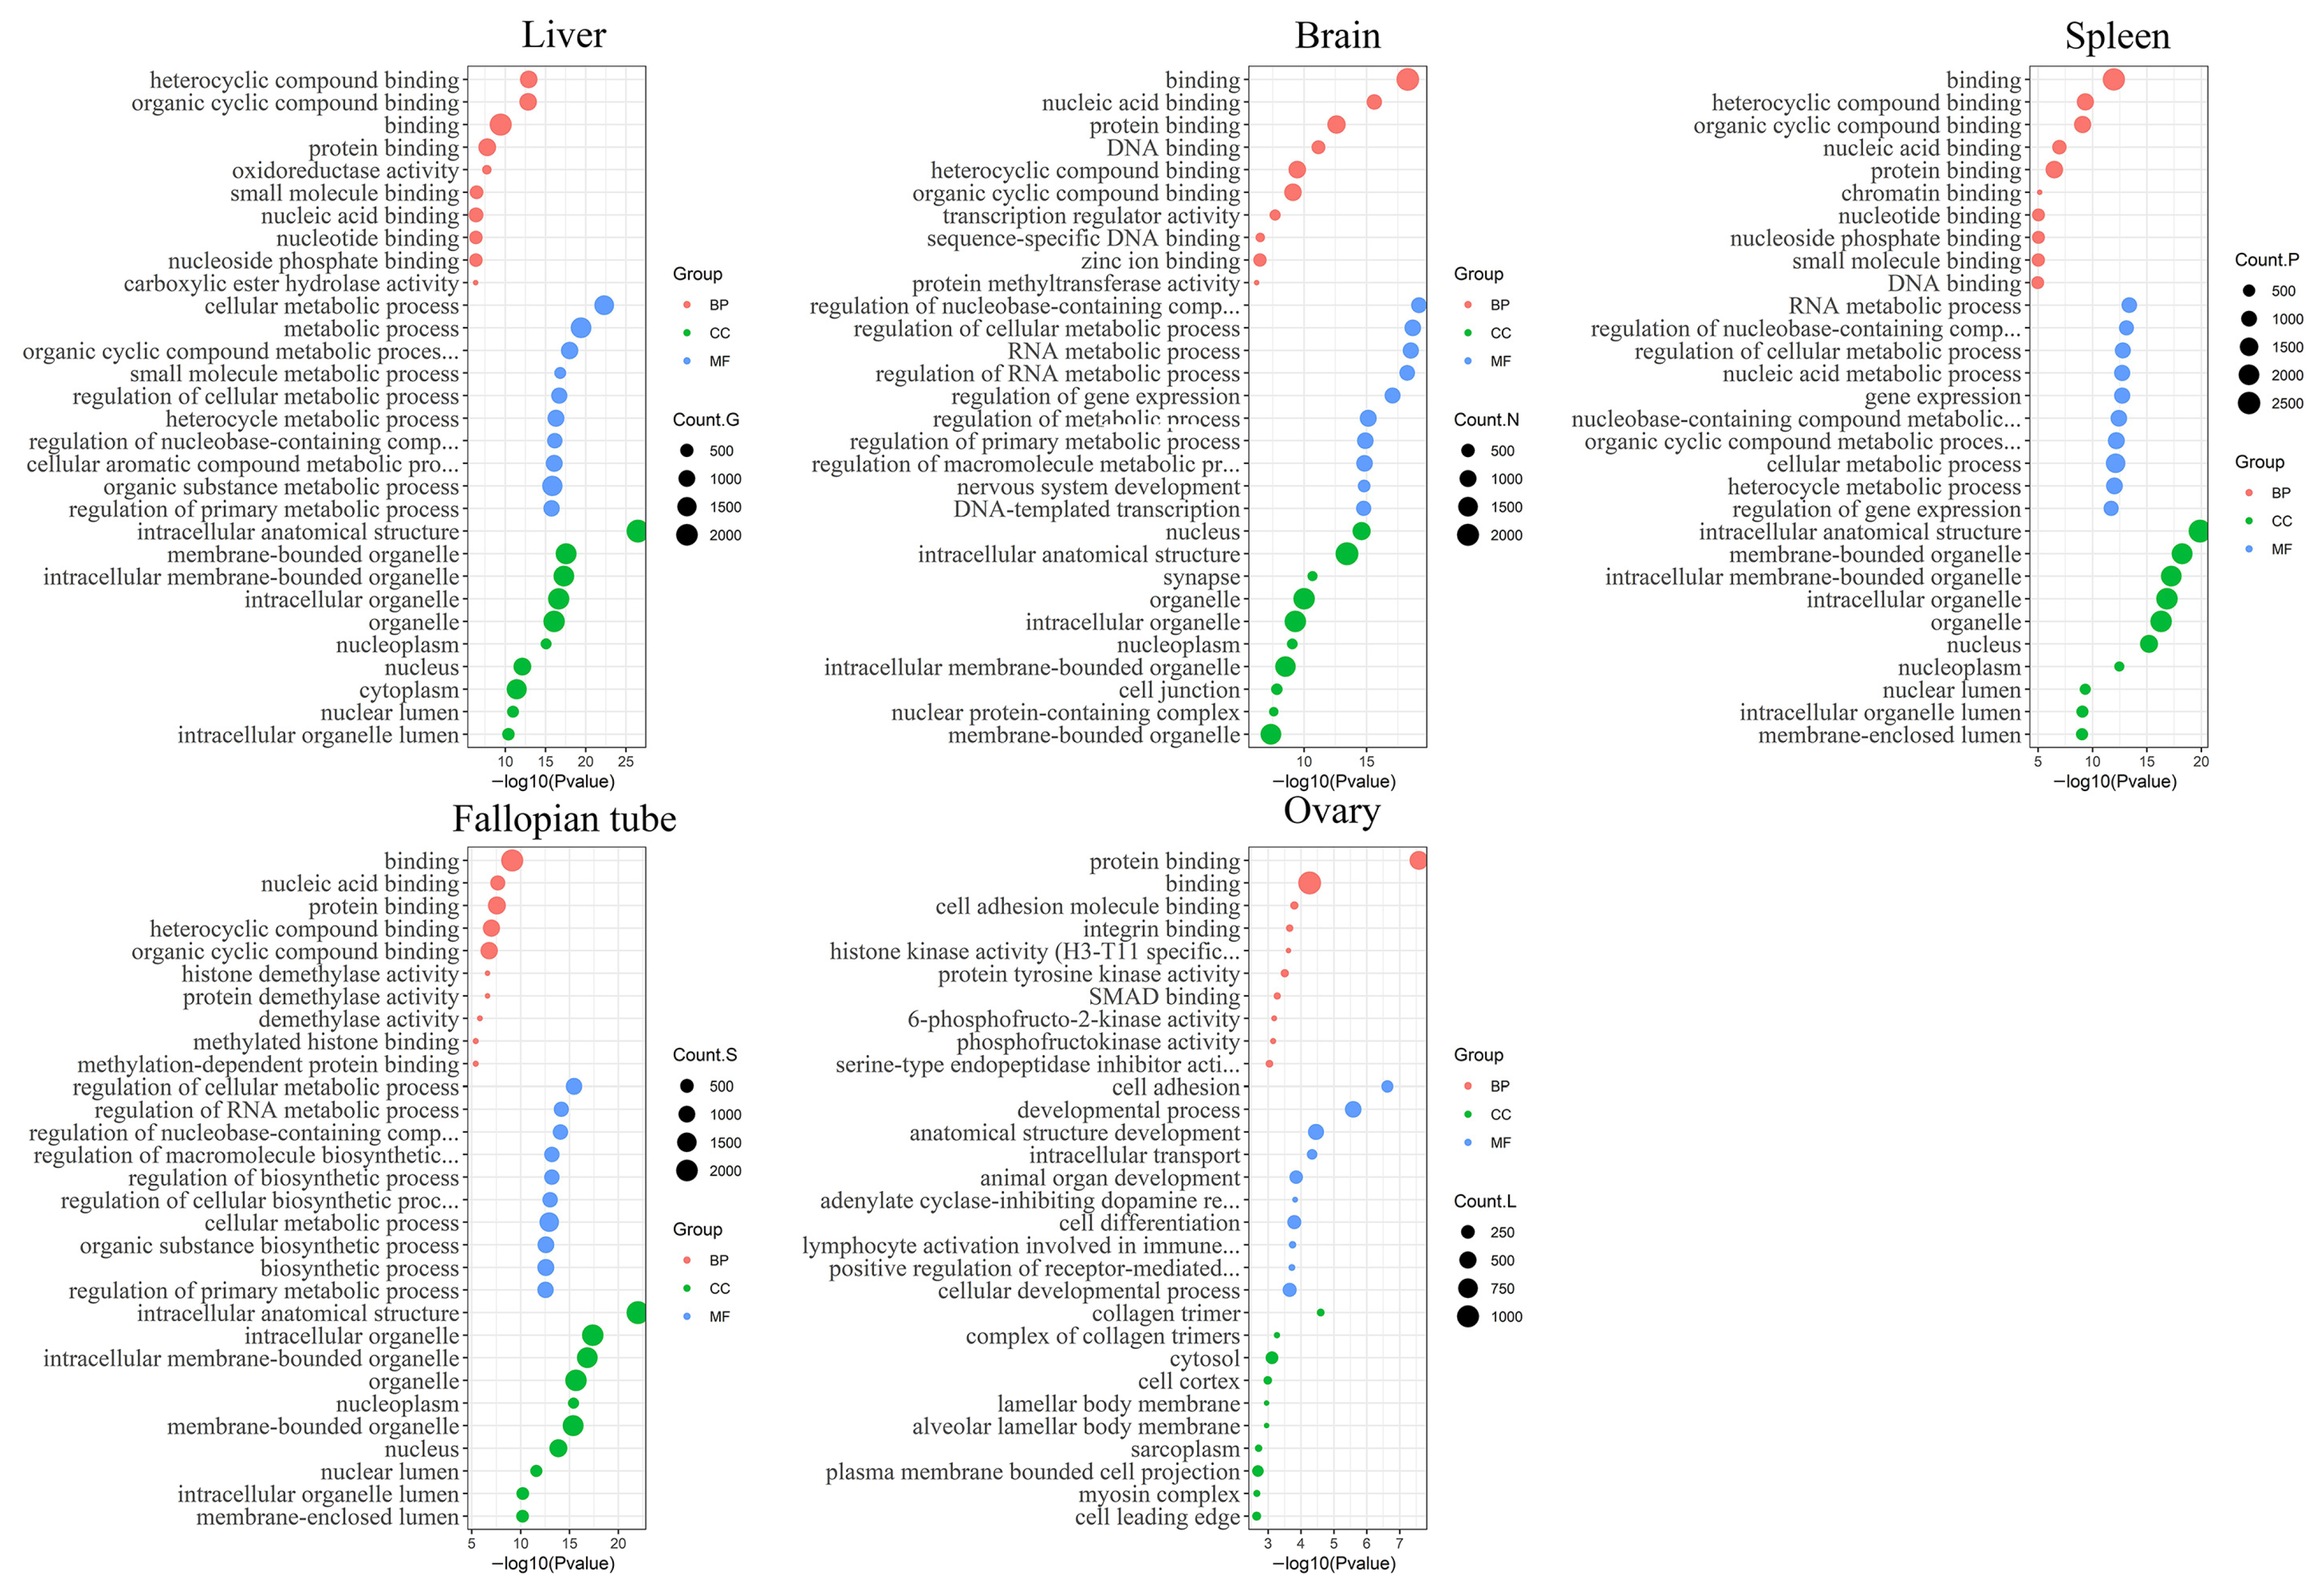
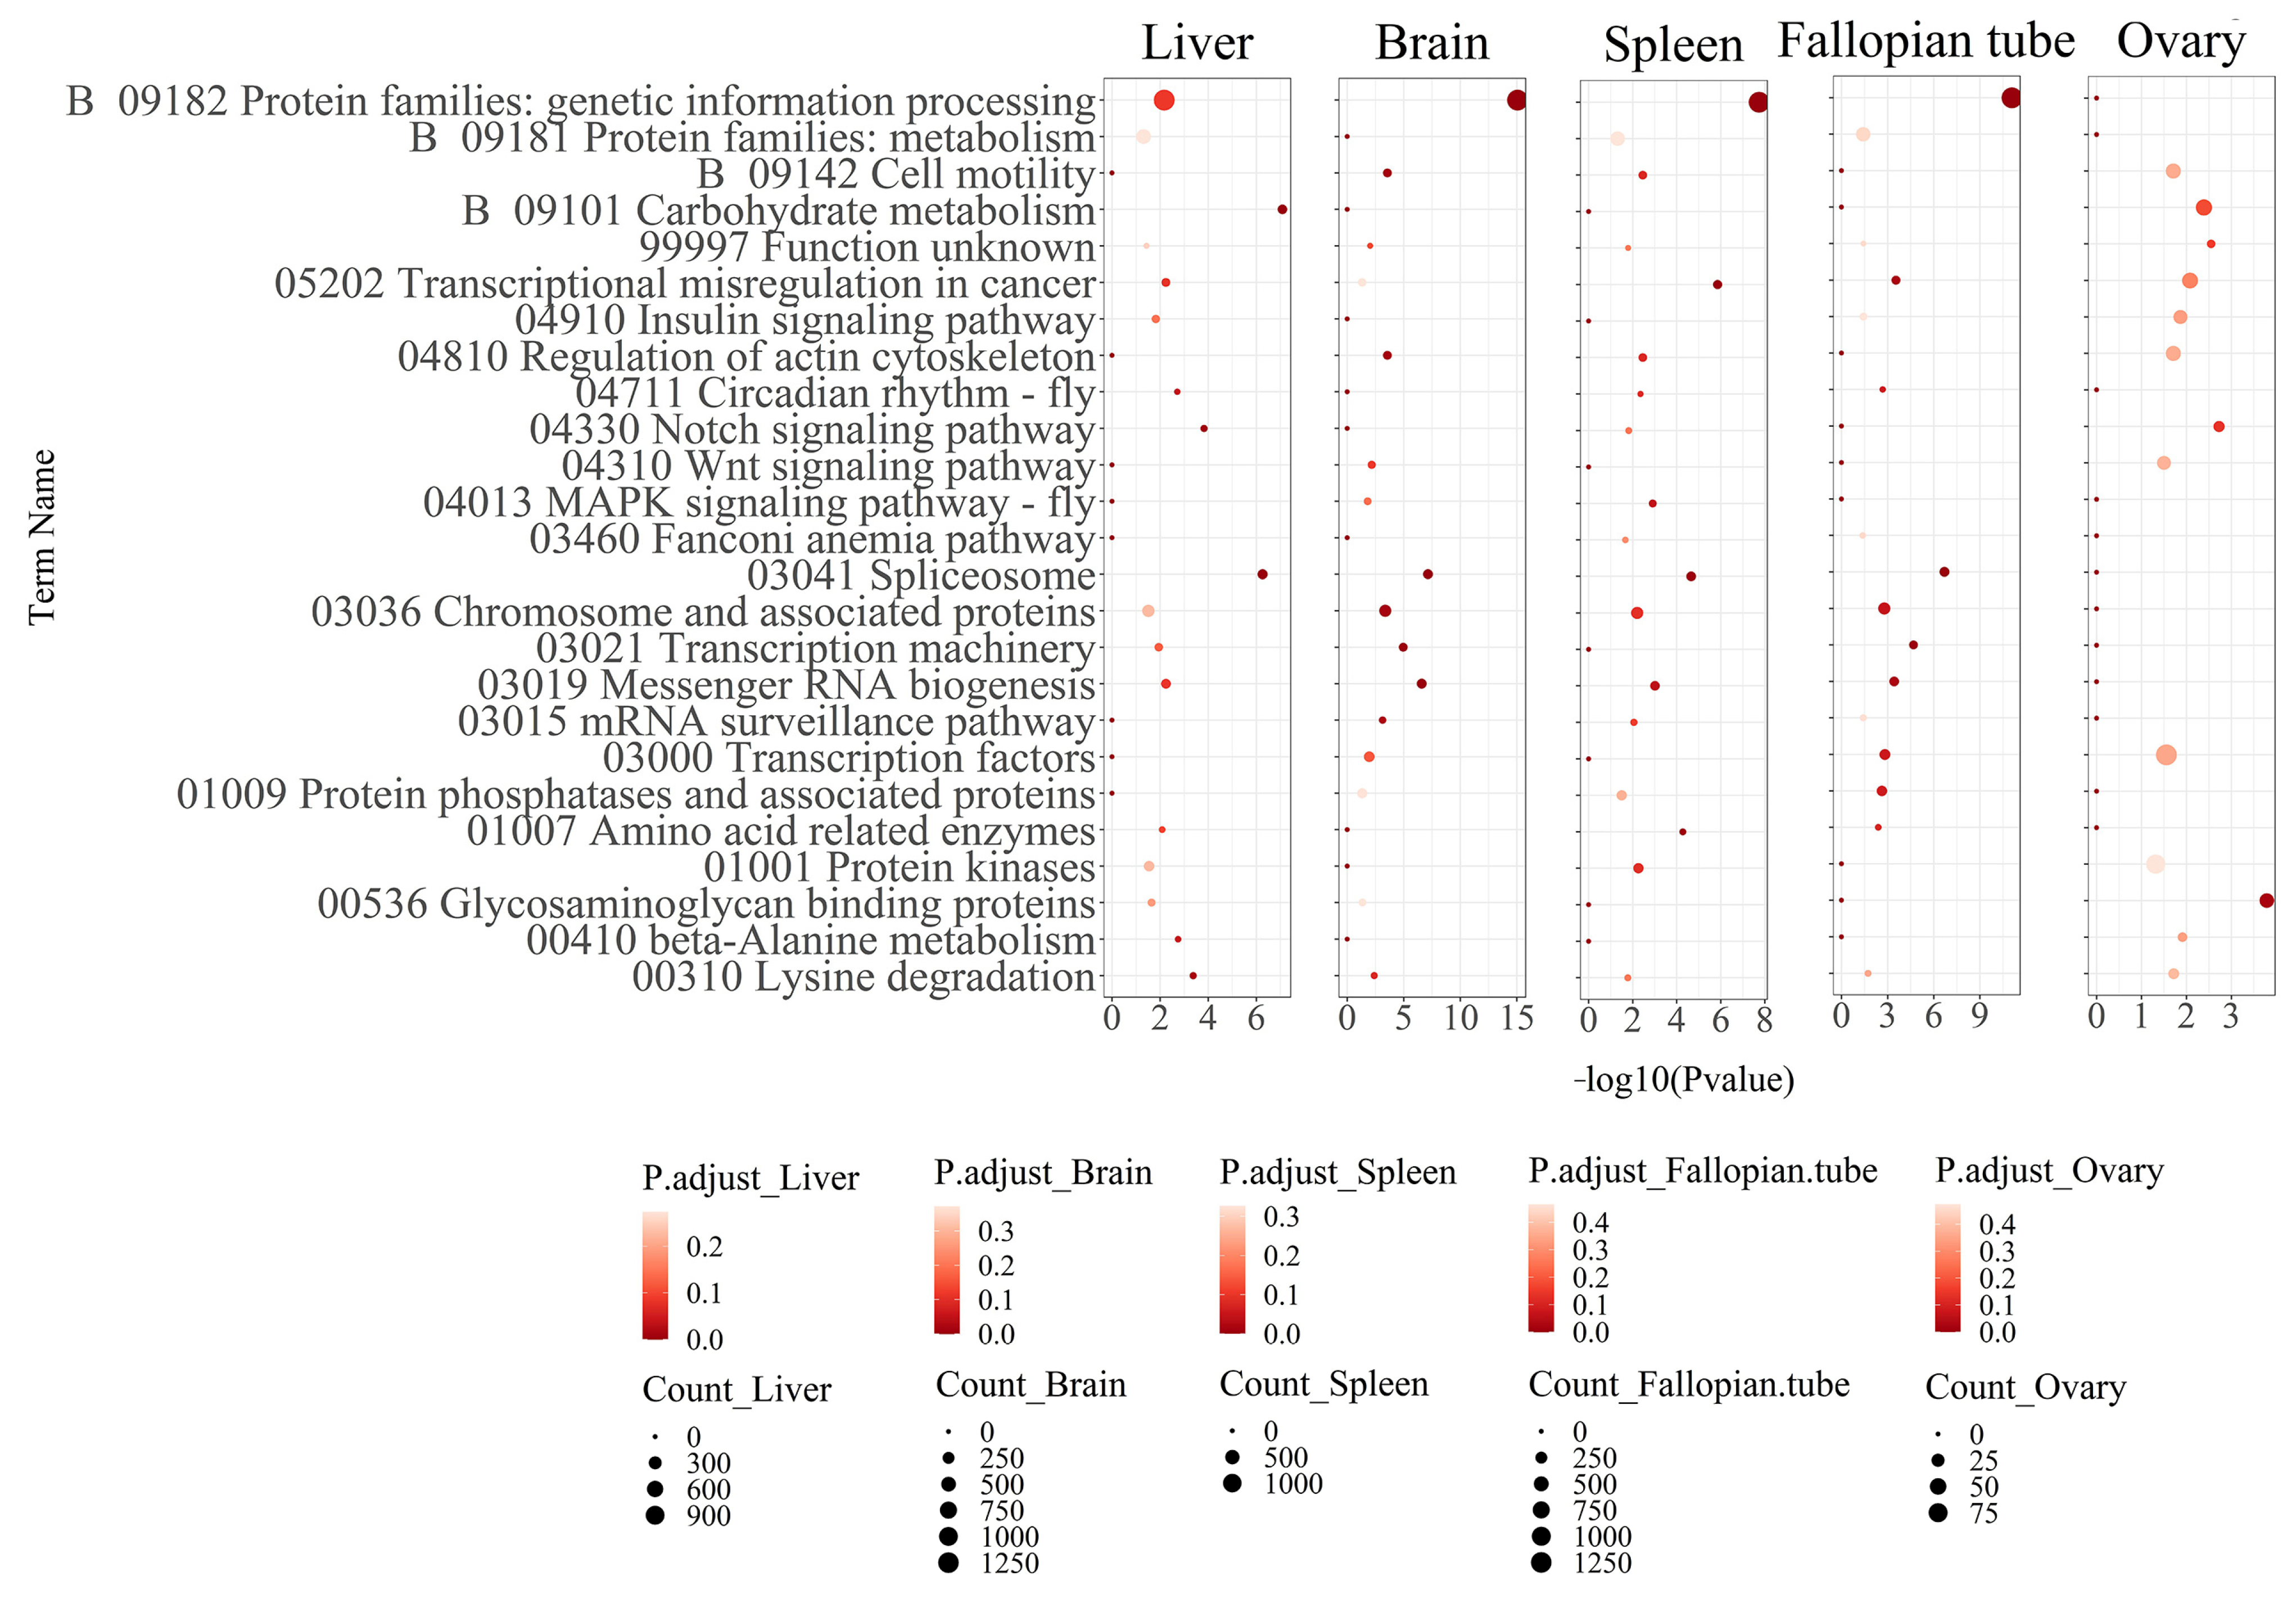
3.2. Functional Annotation Analysis of the Differentially Expressed Transcripts

To identify the biological processes in which the 51,634 transcripts are implicated, we identified the Gene Ontology (GO) terms of their homologs to allocate functions to these transcripts of R. temporaria. GO function annotation included analysis of biological processes, cellular components, and molecular functions. Then, GO term enrichment analysis was performed for the DEGs of each tissue. In the case of the spleen, 3651 DEGs were enriched in the following GO terms: binding (GO:0005488, 2414 unigenes), intracellular membrane-bounded organelle (GO:0044237, 2015 unigenes), cellular metabolic process (GO:0044237, 1711 unigenes), regulation of cellular metabolic process (GO:0031323, 1006 unigenes), and regulation of gene expression (GO:0010468, 905 unigenes). The same analysis was performed for the other four tissues, and the GO terms varied in different tissues (Figure 5).
Similarly, Venn diagrams were used to show the distribution of DEG-enriched KEGG pathways within the same tissue and between different tissues. The KEGG pathway enrichment analysis revealed substantial dissimilarities in the enrichment pathways of DEGs across each tissue (Figure 6). Interestingly, only three pathways, namely, “00310 Lysine degradation,” “05202 Transcriptional misregulation in cancer,” and “99997 Function unknown” (biological information not available), exhibited intersectionality among all five tissues. The GATA family gene regulation pathway, classified under “B 09182 Protein families: genetic information processing,” potentially exerted a significant influence on gene transcription regulation. Notably, this pathway exhibited the highest abundance of DEGs across various tissues, with the exception of the ovary (Figure 7).

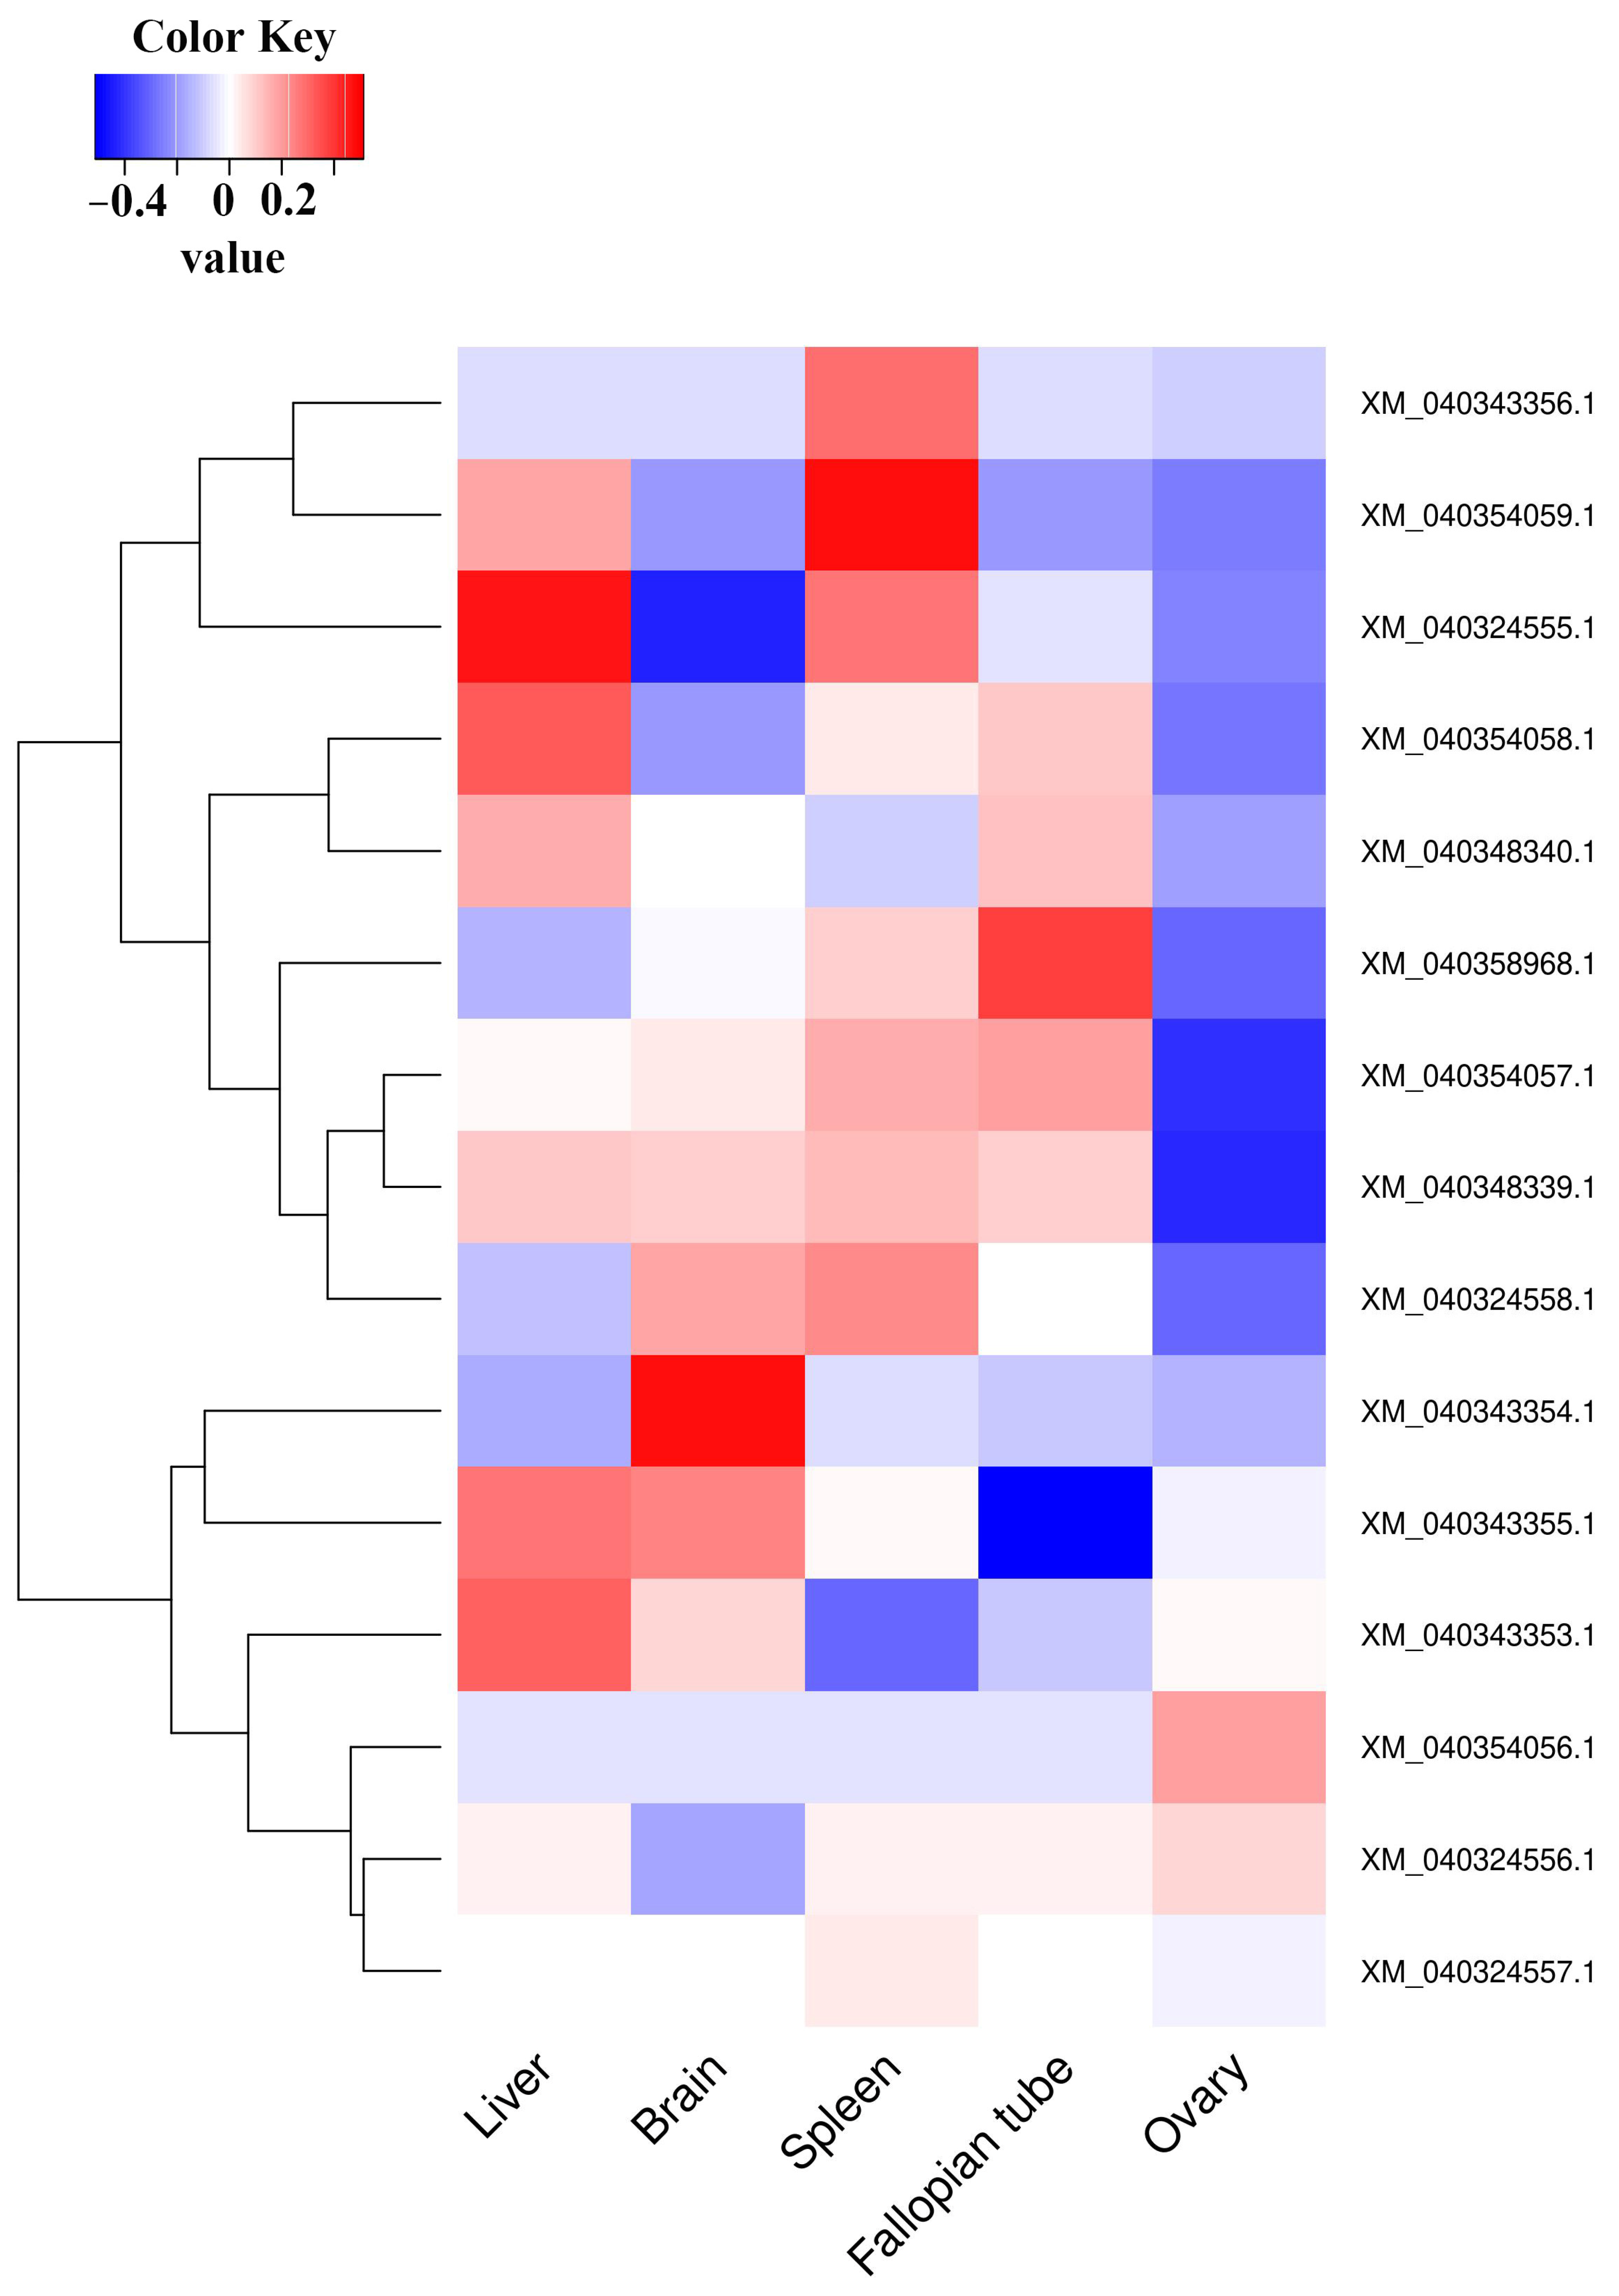
3.3. Validation of Expression Data by Real-Time Quantitative RT-PCR

KEGG annotations revealed the most significantly enriched genes in the “B 09182 Protein families: genetic information processing” pathway. A substantial proportion of these genes were identified as GATA genes based on their annotation information. To identify members of the GATA gene family, we conducted a comprehensive search in the whole genome database of R. temporaria using human GATA protein sequences as reference sequences. Subsequently, protein structure analysis was performed to identify their respective GATA structural domains. Expression profiles of all 16 considered GATA transcripts were retrieved from the RNA-seq database, and the differences in expression of GATA transcripts from all tissues were presented together for easy comparison and identification (Figure 8). Quantitative RT-PCR was performed on 10 transcripts with designed primers in all of the treatment and control groups of the five tissues, respectively, and the expression showed similar patterns to the transcriptome data (Figure 9).

4. Discussion

The state of hibernation is achieved through a series of physiological and behavioral adaptations during which an animal’s metabolic rate undergoes a significant reduction to minimize energy expenditure and facilitate the animal’s survival in the absence of food [29]. Neurohormones are also one of the important factors in regulating hibernation [30]. For example, neurotransmitters such as dopamine in the brain can regulate physiological functions such as body temperature and heart rate in animals, thus affecting the hibernation process [31]. These factors are often intertwined, guiding the animal into hibernation through multiple signals. Exploring the transcriptome during emergence from hibernation can facilitate the identification of functional genes and metabolic pathways implicated in this process, assess the biological significance of alterations in these genes and pathways, elucidate factors requiring control for overwintering site design, and optimize harvest timing and reproductive rhythm regulation in future endeavors. Consequently, this approach enhances the preservation of R. dybowskii germplasm resources and enables large-scale commercial cultivation. At the same time, it also provides a crucial perspective on the study of non-model species that have evolved different physiological strategies to cope with extreme and variable environments.
In this study, we investigated gene expression in reproductive, metabolic, immune, and neuroendocrine-related tissues such as the fallopian tube, ovary, liver, spleen, and brain, detecting valuable information related to the emergence from hibernation from transcriptional differences in multiple tissues. The amount of DEGs found in these tissues suggested that these four tissues (≥3000) were more active than the ovary (1661) during emerging from hibernation. A phenomenon that is now well understood is that female R. dybowskii gradually perform egg maturation and egg white encapsulation during hibernation and lay eggs soon after emerging from hibernation [32]. The DEG results were consistent with the behavior that the ovaries of R. dybowskii were working during the whole hibernation process and the other organs maintained a low metabolic level. The results of GO enrichment analysis also showed that the process of emergence from hibernation mobilized a large number of genes of various types and functions and carried out complex biological processes. Thousands of genes changed expression patterns in a short time, making it difficult to quickly target candidate key genes.
The expression of a single gene is affected by many factors, including other genes and environmental factors [33]. Focusing on a single gene may ignore these factors and lead to unstable or biased analysis results. In the process of pathway enrichment analysis, the KEGG database provides a large amount of gene and pathway information. In order to more accurately analyze the universality and stability of the role of these pathways, we conducted a multi-tissue analysis, taking into account the importance of these pathways in various tissues and the number of enriched genes to reduce the false positive rate [34]. Our cross-tissue KEGG enrichment results showed that only three pathways were uniformly enriched in all five tissues, including “00310 Lysine degradation”, “05202 Transcriptional misregulation in cancer”, and “99997 Function unknown”. The pathway “00310 Lysine degradation” detected in the KEGG analysis suggested that the presumed association with the emergence from hibernation was consistent with the known function of lysine [35]. In recent years, studies have suggested that lysine intake has a close relationship with sleep, and that lysine could regulate the neurotransmitter of gamma-aminobutyric acid (GABA) and play a sedative and hypnotic role [36]. Studies have also suggested that lysine acetylation interacts with the circadian clock [37], that lysine acetylation could regulate circadian rhythms through epigenetic regulation [38], or directly through acetylate core clock proteins, and could regulate their stability, protein–protein interactions, localization, or transcriptional activity, thereby affecting sleep quality. High levels of lysine could help maintain sleep, and the corresponding degradation of lysine might facilitate waking from sleep. The pathway “05202 Transcriptional misregulation in cancer” encompassed multiple oncogenes involved in the regulation of the cell cycle, a fundamental process governing cellular division [39]. Disruption of this tightly regulated cell cycle can lead to the development of cancer. Upon emergence from hibernation, R. dybowskii exhibited rapid activation of various tissues and organs after a period of dormancy, making it reasonable to assume that this cell growth regulatory pathway was implicated. Among the three, the pathway “99997 function unknown” indicated that similar sequences exist, but the function is unknown. If the term is not commented on, the sequence has no functional information in frogs, providing little biological information.
Interestingly, the pathway “B 09182 Protein families: genetic information processing” dominated by the GATA family genes, enriched the highest number of genes in four tissues, including the liver, brain, spleen and fallopian tube, but there was no significant enrichment in the ovary. The GATA gene family represents a group of transcription factors that possess zinc finger domains, which were named after their distinctive ability to bind to the conserved nucleotide sequence A/T(GATA)A/G [40]. This gene family exhibits a broad distribution across the animal kingdom and primarily plays crucial roles in dermal differentiation, organ development, and the maintenance of organ function [41]. The GATA family was the first protein family in which all members can act as inducers of the reprogramming process and may be an important intermediary in the transformation of cell fate [42]. According to our results of the tissue-specific KGEE pathway, the GATA gene family should be involved in the cell growth regulation pathway during emergence from hibernation in R. dybowskii.
In addition, we opted to analyze a subset of transcripts from the GATA gene family through quantitative RT-PCR verification. The majority of the quantitative RT-PCR outcomes aligned with the expression patterns observed in the transcriptome sequencing, thus validating the efficacy of the transcriptome acquisition method employed in this study.

5. Conclusions

This study involved the analysis of transcriptomes from five tissues, namely, brain, liver, spleen, fallopian tube, and ovary tissues, which possess significant biological functions. We found a large number of DEGs in all five tissues, and these DEGs were generally tissue-specific, as only 45 DEGs were present in all five tissues. Similarly, only two meaningful DEG-enriched KEGG pathways were present in all five tissues, and the pathway referred to as the GATA gene family was significantly enriched in four tissues, except the ovary, and it had the most enriched DEGs. These three pathways might contribute to the emergence from hibernation in female R. dybowskii. Our results are useful for ascertaining the factors that need to be controlled in the design of overwintering sites, offer a novel perspective for the conservation and management of the overwintering population of female R. dybowskii, and are helpful for controlling the harvest time, hibernation rhythm, and reproductive cycle in the future.

Supplementary Materials

The following supporting information can be downloaded at: https://www.mdpi.com/article/10.3390/fishes8120569/s1, Table S1. Annotated list of differentially expressed genes in brain. Table S2. Annotated list of differentially expressed genes in liver. Table S3. Annotated list of differentially expressed genes in spleen. Table S4. Annotated list of differentially expressed genes in fallopian tube. Table S5. Annotated list of differentially expressed genes in ovary.

Author Contributions

Conceptualization, G.H.; methodology, G.H. and Y.S.; investigation, F.C., P.L., M.L. and T.Z.; data curation, G.H. and Y.S.; writing—original draft preparation, G.H.; writing—review and editing, G.H. and Y.S.; supervision, G.H.; funding acquisition, G.H.; All authors have read and agreed to the published version of the manuscript.

Funding

This research was funded by a government purchase for a public service contract from the Ministry of Agriculture and Rural Affairs of China (17230180), the Chinese Academy of Fishery Sciences, the Central Public-interest Scientific Institution Basal Research Fund (2023TD22), and the Yichun City key science and technology plan applied research project (Y2023-3).

Institutional Review Board Statement

All procedures on the experimental animals were carried out in accordance with the guidelines for Experimental Animal Care and Use of Heilongjiang Fisheries Research Institute, Chinese Academy of Fishery Sciences. The animal experiments were examined and approved by the Experimental Animal Welfare and Ethics Committee of Heilongjiang Fisheries Research Institute, Chinese Academy of Fishery Sciences (approval number: 2022-12-01-03).

Data Availability Statement

The raw sequence data reported in this paper have been deposited in the Genome Sequence Archive of the National Genomics Data Center, Beijing Institute of Genomics, Chinese Academy of Sciences (GSA: CRA012717).

Conflicts of Interest

The authors declare no conflict of interest.

References

  1. Yang, B.-T.; Zhou, Y.; Min, M.-S.; Matsui, M.; Dong, B.-J.; Li, P.-P.; Fong, J.J. Diversity and phylogeography of Northeast Asian brown frogs allied to Rana dybowskii (Anura, Ranidae). Mol. Phylogenet. Evol. 2017, 112, 148–157. [Google Scholar] [CrossRef] [PubMed]
  2. Xu, X.; Xu, H.; Shang, Y.; Zhu, R.; Hong, X.; Song, Z.; Yang, Z. Development of the general chapters of the Chinese Pharmacopoeia 2020 edition: A review. J. Pharm. Anal. 2021, 11, 398–404. [Google Scholar] [CrossRef] [PubMed]
  3. Wang, S.; Gan, Y.; Mao, X.; Kan, H.; Li, N.; Zhang, C.; Wang, Z.; Wang, Y. Antioxidant activity evaluation of Oviductus ranae protein hydrolyzed by different proteases. Molecules 2021, 26, 1625. [Google Scholar] [CrossRef] [PubMed]
  4. Zhang, M.; Jia, X.-y.; Ma, Y.-d.; Ma, J.-z. Genetic diversity and differentiation of the Dybowski’s frog (Rana dybowskii) in Northeast China. J. For. Res. 2010, 21, 239–245. [Google Scholar] [CrossRef]
  5. Staples, J.F. Metabolic flexibility: Hibernation, torpor, and estivation. Compr. Physiol. 2016, 6, 737–771. [Google Scholar]
  6. Malan, A. Adaptation to poikilothermy in endotherms. J. Therm. Biol. 1983, 8, 79–84. [Google Scholar] [CrossRef]
  7. Lin, J.-Q.; Yu, J.; Jiang, H.; Zhang, Y.; Wan, Q.-H.; Fang, S.-G. Multi-omics analysis reveals that natural hibernation is crucial for oocyte maturation in the female Chinese alligator. BMC Genom. 2020, 21, 774. [Google Scholar] [CrossRef]
  8. Santana, F.E.; Swaisgood, R.R.; Lemm, J.M.; Fisher, R.N.; Clark, R.W. Chilled frogs are hot: Hibernation and reproduction of the endangered mountain yellow-legged frog Rana muscosa. Endanger. Species Res. 2015, 27, 43–51. [Google Scholar] [CrossRef]
  9. Costanzo, J.P.; do Amaral, M.C.F.; Rosendale, A.J.; Lee, R.E., Jr. Hibernation physiology, freezing adaptation and extreme freeze tolerance in a northern population of the wood frog. J. Exp. Biol. 2013, 216, 3461–3473. [Google Scholar] [CrossRef]
  10. Gao, X.; Jin, C.; Llusia, D.; Li, Y. Temperature-induced shifts in hibernation behavior in experimental amphibian populations. Sci. Rep. 2015, 5, 11580. [Google Scholar] [CrossRef]
  11. Tong, Q.; Dong, W.J.; Long, X.Z.; Hu, Z.F.; Luo, Z.W.; Guo, P.; Cui, L.Y. Effects of fine-scale habitat quality on activity, dormancy, habitat use, and survival after reproduction in Rana dybowskii (Chordata, Amphibia). BMC Zool. 2023, 8, 1. [Google Scholar] [CrossRef] [PubMed]
  12. Niu, Y.; Chen, Q.; Storey, K.B.; Teng, L.; Li, X.; Xu, T.; Zhang, H. Physiological ecology of winter hibernation by the high-altitude frog Nanorana parkeri. Physiol. Biochem. Zool. 2022, 95, 201–211. [Google Scholar] [CrossRef] [PubMed]
  13. Yi, L.; Pimentel, H.; Bray, N.L.; Pachter, L. Gene-level differential analysis at transcript-level resolution. Genome Biol. 2018, 19, 53. [Google Scholar] [CrossRef]
  14. Hrdlickova, R.; Toloue, M.; Tian, B. RNA-Seq methods for transcriptome analysis. Wiley Interdiscip. Rev. RNA 2017, 8, e1364. [Google Scholar] [CrossRef]
  15. Ungaro, A.; Pech, N.; Martin, J.-F.; McCairns, R.J.S.; Mévy, J.-P.; Chappaz, R.; Gilles, A. Challenges and advances for transcriptome assembly in non-model species. PLoS ONE 2017, 12, e0185020. [Google Scholar] [CrossRef] [PubMed]
  16. Huang, Q.; Sun, M.A.; Yan, P. Pathway and network analysis of differentially expressed genes in transcriptomes. Methods Mol. Biol. 2018, 1751, 35–55. [Google Scholar]
  17. Jin, L.; Zuo, X.-Y.; Su, W.-Y.; Zhao, X.-L.; Yuan, M.-Q.; Han, L.-Z.; Zhao, X.; Chen, Y.-D.; Rao, S.-Q. Pathway-based analysis tools for complex diseases: A review. Genom. Proteom. Bioinform. 2014, 12, 210–220. [Google Scholar] [CrossRef]
  18. Cirillo, E.; Parnell, L.D.; Evelo, C.T. A review of pathway-based analysis tools that visualize genetic variants. Front. Genet. 2017, 8, 174. [Google Scholar] [CrossRef]
  19. Streicher, J.W. The genome sequence of the common frog, Rana temporaria Linnaeus 1758. Wellcome Open Res. 2021, 6, 286. [Google Scholar] [CrossRef]
  20. Patro, R.; Duggal, G.; Love, M.I.; Irizarry, R.A.; Kingsford, C. Salmon provides fast and bias-aware quantification of transcript expression. Nat. Methods 2017, 14, 417–419. [Google Scholar] [CrossRef]
  21. Altschul, S.F.; Madden, T.L.; Schäffer, A.A.; Zhang, J.; Zhang, Z.; Miller, W.; Lipman, D.J. Gapped BLAST and PSI-BLAST: A new generation of protein database search programs. Nucleic Acids Res. 1997, 25, 3389–3402. [Google Scholar] [CrossRef] [PubMed]
  22. Ashburner, M.; Ball, C.A.; Blake, J.A.; Botstein, D.; Butler, H.; Cherry, J.M.; Davis, A.P.; Dolinski, K.; Dwight, S.S.; Eppig, J.T.; et al. Gene ontology: Tool for the unification of biology. Nat. Genet. 2000, 25, 25–29. [Google Scholar] [CrossRef] [PubMed]
  23. Love, M.I.; Huber, W.; Anders, S. Moderated estimation of fold change and dispersion for RNA-seq data with DESeq2. Genome Biol. 2014, 15, 550. [Google Scholar] [CrossRef] [PubMed]
  24. Wallach, D.; Makowski, D.; Jones, J.W.; Brun, F. (Eds.) Chapter 3—The R programming language and software. In Working with Dynamic Crop Models, 2nd ed.; Academic Press: San Diego, CA, USA, 2014; pp. 71–117. [Google Scholar]
  25. Alexa, A.; Rahnenfuhrer, J. topGO: Enrichment analysis for gene ontology. R Package 2019, version 2.38.1.
  26. Yu, G.; Wang, L.-G.; Han, Y.; He, Q.-Y. clusterProfiler: An R package for comparing biological themes among gene clusters. Omics J. Integr. Biol. 2012, 16, 284–287. [Google Scholar] [CrossRef]
  27. Wickham, H. ggplot2: Elegant Graphics for Data Analysis; Springer: New York, NY, USA, 2016. [Google Scholar]
  28. Potter, S.C.; Luciani, A.; Eddy, S.R.; Park, Y.; Lopez, R.; Finn, R.D. HMMER web server: 2018 update. Nucleic Acids Res. 2018, 46, W200–W204. [Google Scholar] [CrossRef]
  29. Geiser, F. Metabolic rate and body temperature reduction during hibernation and daily torpor. Annu. Rev. Physiol. 2004, 66, 239–274. [Google Scholar] [CrossRef]
  30. Lahiri, A.; Senior, R.; Khattar, R. The role of neurohormonal antagonists in hibernating myocardium. J. Cardiovasc. Pharmacol. 1999, 33, S9–S16. [Google Scholar]
  31. Sotowska-Brochocka, J.; Martyńska, L.; Licht, P. Dopaminergic inhibition of gonadotropic release in hibernating frogs, Rana temporaria. Gen. Comp. Endocrinol. 1994, 93, 192–196. [Google Scholar] [CrossRef]
  32. Zhang, Y.; Wang, Y.; Li, M.; Liu, S.; Yu, J.; Yan, Z.; Zhou, H. Traditional uses, bioactive constituents, biological functions, and safety properties of Oviductus ranae as functional foods in China. Oxidative Med. Cell. Longev. 2019, 2019, 4739450. [Google Scholar] [CrossRef]
  33. Raser, J.M.; O’shea, E.K. Noise in gene expression: Origins, consequences, and control. Science 2005, 309, 2010–2013. [Google Scholar] [CrossRef] [PubMed]
  34. Pian, C.; He, M.; Chen, Y. Pathway-based personalized analysis of Pan-Cancer transcriptomic data. Biomedicines 2021, 9, 1502. [Google Scholar] [CrossRef] [PubMed]
  35. Matthews, D.E. Review of Lysine metabolism with a focus on humans. J. Nutr. 2020, 150, 2548s–2555s. [Google Scholar] [CrossRef] [PubMed]
  36. Koh, W.; Kwak, H.; Cheong, E.; Lee, C.J. GABA tone regulation and its cognitive functions in the brain. Nat. Rev. Neurosci. 2023, 24, 523–539. [Google Scholar] [CrossRef] [PubMed]
  37. Jiang, H.; Wang, X.; Ma, J.; Xu, G. The fine-tuned crosstalk between lysine acetylation and the circadian rhythm. Biochim. Biophys. Acta Gene Regul. Mech. 2023, 1866, 194958. [Google Scholar] [CrossRef] [PubMed]
  38. Ali, I.; Conrad, R.J.; Verdin, E.; Ott, M. Lysine acetylation goes global: From epigenetics to metabolism and therapeutics. Chem. Rev. 2018, 118, 1216–1252. [Google Scholar] [CrossRef]
  39. Wong, S.H.D.; Yin, B.; Li, Z.; Yuan, W.; Zhang, Q.; Xie, X.; Tan, Y.; Wong, N.; Zhang, K.; Bian, L. Mechanical manipulation of cancer cell tumorigenicity via heat shock protein signaling. Sci. Adv. 2023, 9, eadg9593. [Google Scholar] [CrossRef]
  40. Tremblay, M.; Sanchez-Ferras, O.; Bouchard, M. GATA transcription factors in development and disease. Development 2018, 145, dev164384. [Google Scholar] [CrossRef]
  41. Fujikura, J.; Yamato, E.; Yonemura, S.; Hosoda, K.; Masui, S.; Nakao, K.; Miyazaki, J.-i.; Niwa, H. Differentiation of embryonic stem cells is induced by GATA factors. Genes Dev. 2002, 16, 784–789. [Google Scholar] [CrossRef]
  42. Shu, J.; Zhang, K.; Zhang, M.; Yao, A.; Shao, S.; Du, F.; Yang, C.; Chen, W.; Wu, C.; Yang, W. GATA family members as inducers for cellular reprogramming to pluripotency. Cell Res. 2015, 25, 169–180. [Google Scholar] [CrossRef]
Figure 1. Number of differentially expressed genes involved in the emergence from hibernation in and among all of the five tissues. Note: The intersection of ellipses is the number of common differentially expressed genes shared by tissues. The un-intersected portion of the ellipse is the number of tissue-specific differentially expressed genes.
Fishes 08 00569 g001
Figure 2. Comparative analysis of the number of differentially expressed genes in and among all of the five tissues. Note: Tissue and combinations of tissues are listed at the X-axis, and the numbers of differentially expressed genes are shown on the Y-axis, while the pink bars represent the number of DEGs in each tissue.
Fishes 08 00569 g002
Figure 3. Hierarchical clustering heatmap of differentially expressed genes in the treatment and control groups of all five tissues, respectively. Note: T indicates the treatment group, and C indicates the control group. In a heat map of the average expression of a cluster, the redder the color, the higher the level of gene expression in the cluster.
Fishes 08 00569 g003
Figure 4. Expression patterns of 20 clusters of the differentially expressed genes in the treatment and control groups of all five tissues, respectively. Note: T indicates the treatment group, and C indicates the control group. This figure presents the expression profiles of 20 clusters in the treatment and the control groups for all of the five tissues. The curve represents the logarithm base 2 of the raw gene expression data.
Fishes 08 00569 g004
Figure 5. Gene Ontology enrichment analysis of differentially expressed genes in all of the five tissues. Note: Red dots correspond to GO terms associated with biological processes (BP), green dots correspond to GO terms associated with molecular functions (MF), and blue dots correspond to GO terms associated with cellular components (CC). The size of each dot represents the number of genes involved in the respective GO term. The X-axis represents the p-value of the topGO enrichment analysis, which has been transformed using −log10 (p). The Y-axis represents the GO terms themselves.
Fishes 08 00569 g005
Figure 6. Number of KEGG pathways of tissue-specific differentially expressed genes involved in the emergence from hibernation in and among all of the five tissues. Note: The intersection of ellipses is the number of KEGG pathways of the differentially expressed genes shared by tissues. The un-intersected portion of the ellipse is the number of tissue-specific KEGG pathways of the differentially expressed genes.
Fishes 08 00569 g006
Figure 7. The enrichment analysis of the KEGG pathway of differentially expressed genes in all of the five tissues. Note: The X-axis represents the p-value of KEGG enrichment analysis, with −log10 transformation, −log10 (p), while the Y-axis represents the KEGG terms. The size of these red dots indicates the number of differentially expressed genes enriched in the KEGG term, and the larger the dot, the greater the number. The color of these red dots indicates the level of significance, and the darker the red, the higher the significance level.
Fishes 08 00569 g007
Figure 8. The expressional profiles of the transcripts of GATA genes in all of the five tissues. Note: The color of grid indicates the level of gene expression; the darker the red, the higher the relative expression, and the darker the blue, the lower the relative expression.
Fishes 08 00569 g008
Figure 9. Real-time quantitative RT-PCR expression of 10 GATA transcripts in all of the treatment and control groups of the five tissues, respectively. Note: The values on the Y-axis are the relative gene expression levels of the histograms, and the X-axis represents the tissues themselves, in which blue indicates the treatment group and orange indicates the control group.
Fishes 08 00569 g009
Table 1. Primer pairs used in quantitative RT-PCR.
GeneForwardReverse
XM_040324555.1TCAAGGACACAGTCATGGATTGCCACACAAGTTGTAGAAG
XM_040324558.1TACTCTACTGCTCCCTTCCTCACTGTAGCACCACAATTCA
XM_040343354.1TAAGGGTATAGGTGGAAGCCTACACTCCTTGTCTTCCTGG
XM_040343355.1GAGGAGGTGGATGTACTCTTGGCTTCCACCTATACCCTTA
XM_040343356.1TAAGGGTATAGGTGGAAGCCTACACTCCTTGTCTTCCTGG
XM_040348339.1AGAACAAGCGATCTGGGATACCCAGCCCCTTCATAAGAT
XM_040348340.1TCTGTTGCTGGAGAAAGTTGGTTGTAGGCTGAGCTCTCT
XM_040354056.1TACCAGGGTTGGATCTATGCATTGATCTCTGCCATTCACG
XM_040354057.1TACCATTACTCTCCCAGTCCGAAGACTATGCAGCATGGAG
XM_040354058.1TACACCCATCTCCTACCTTCATTGATCTCTGCCATTCACG
β-actinAAGAATGAGGGCTGGAACAGTGCGTGACATCAAGGAGAAGC
Disclaimer/Publisher’s Note: The statements, opinions and data contained in all publications are solely those of the individual author(s) and contributor(s) and not of MDPI and/or the editor(s). MDPI and/or the editor(s) disclaim responsibility for any injury to people or property resulting from any ideas, methods, instructions or products referred to in the content.

