Article

Does Soundpeaking Affect the Behavior of Chub (Squalius cephalus) and Brown Trout (Salmo trutta)? An Experimental Approach

1
Christian Doppler Laboratory for Meta Ecosystem Dynamics in Riverine Landscapes, Department Water-Atmosphere-Environment, Institute of Hydrobiology and Aquatic Ecosystem Management, University of Natural Resources and Life Sciences, Gregor Mendel Str. 33, 1180 Vienna, Austria
2
Department Water-Atmosphere-Environment, Institute of Hydrobiology and Aquatic Ecosystem Management, University of Natural Resources and Life Sciences, Gregor Mendel Str. 33, 1180 Vienna, Austria
3
Acoustic Solutions, Herbststrasse 37, 1160 Vienna, Austria
4
Institute of Natural Resource Sciences, University of Applied Sciences Zurich, Gruentalstrasse 14, 8820 Waedenswil, Switzerland
5
eQcharta GmbH, Tiefenhofstrasse 68, 8820 Waedenswil, Switzerland
*
Author to whom correspondence should be addressed.
Fishes 2023, 8(12), 581; https://doi.org/10.3390/fishes8120581
Submission received: 17 October 2023 / Revised: 21 November 2023 / Accepted: 22 November 2023 / Published: 28 November 2023
(This article belongs to the Section Biology and Ecology)

Abstract

:
Increased turbulent flow and sediment transport during flood or hydropeaking events often induces rapid changes in underwater sound pressure levels, which is here referred to as soundpeaking. This study is the first to investigate such a change in the underwater soundscape in relation to fish behavior using an experimental approach. Trials were conducted in an experimental channel stocked with either adult chub (Squalius cephalus) or brown trout (Salmo trutta). To mimic soundpeaking, the underwater soundscape of a small alpine river was recorded during a flood event and later played back through an underwater speaker during treatment trials. Furthermore, trials were recorded with a video camera, and based on the fish position, movement variables (swimming distance, number of movement direction changes, variance of the acceleration), the aggregation of individuals, the longitudinal and the lateral position in the experimental area were compared between control (no sound played) and treatment trials. During treatment trials, brown trout changed their movement direction significantly more often, chub showed a significantly higher variation of the acceleration, and individuals from both species were significantly more aggregated. Furthermore, the soundpeaking treatment had a significant effect on the longitudinal position of brown trout in the experimental area. However, the overall results did not provide any indication for a stronger soundpeaking effect in chub despite being equipped with much more refined hearing abilities in comparison to brown trout. Based on these results and findings from other studies, soundpeaking is discussed as a behavioral trigger as well as a source of acoustic stress.
Key Contribution: This study demonstrates an effect of soundpeaking on the movement and spatial use of fish in an experimental setup. In addition, our results show a similar response in both hearing specialists and generalists.

1. Introduction

Rivers are highly dynamic ecosystems on both spatial and temporal scales. Therefore, in order to be biologically successful, fish and other organisms must be able to orientate and react to changes within their surroundings. Both abilities require an accurate perception of the environment, which is achieved by processing different types of stimuli through the utilization of different senses such as hearing. Due to the high density of water, sound travels approximately five times faster compared to the atmosphere, and it has therefore been suggested to be the best channel for long-range communication in aquatic systems [1]. Moreover, sound is reflected very efficiently from the surface and to some extent from the bottom of a waterbody, while the incompressibility of water further causes a steep pressure gradient close to the source of an acoustic signal [2]. Hence, water represents a highly suitable medium to propagate acoustic information. In rivers, sounds mainly originate from air bubble formation due to turbulent flow dynamics [3,4] and particle collisions as a result of sediment transport [5,6]. Thus, since both processes are often increasing with discharge, this is generally also valid regarding the overall underwater sound pressure level. In case of a fast approaching flow wave during hydropeaking events, this increase can be very rapid and is referred to as soundpeaking [7]. Here, we use a slightly adapted version of this definition, including also less rapid changes caused by common high discharge events such as floods. Furthermore, we expand the focus from the initial peaking phase and integrate the whole period of the event. According to this broader definition, soundpeaking may represent highly valuable information for fish and other aquatic organisms since the associated hydraulic changes have a major impact on the underwater environment.

1.1. Hearing Capabilities in Teleost Fish

The octavolateralis system, which is comprised of the inner ear and the lateral line [8], is highly complex and even today, it is far from being fully understood. However, it is believed that at least some fish possess directional hearing through the reception of particle motion [9] and that in some taxa, the capability to additionally perceive sound pressure could allow the determination of acoustic intensity [10]. Popper et al. [11] even suggested that the way in which fish perceive acoustic information may result in “an image of local objects and events that may exceed in complexity that of most terrestrial animals”. Furthermore, there are several studies which have suggested that the goldfish (Carassius auratus) is able to not only perceive but also analyze acoustic information. For instance, this includes acquiring independent information about the frequencies of different sinusoidal components (166 Hz and 724 Hz pure tones) making up a complex sound [12], the existence of not only pitch-like (frequency) but also timbre-like (sound quality) perceptual dimensions, as well as the ability to determine the source of a specific acoustic signal from a complex acoustic scene with multiple sources, which is referred to as auditory stream segregation [13]. While there are still many unanswered questions regarding the hearing abilities of fish [14], this leads to the overall conclusion that goldfish and other taxa are potentially able to analyze a continuously changing auditory scene such as a natural underwater soundscape.
The family of cyprinids, a taxa including many European freshwater fish species, belongs to the group of othophysi which is characterized by a physical connection between the inner ear and the swim bladder [15], the so-called Weberian ossicles. This vertebral adaptation allows a stimulation of the inner ear by sound pressure additionally to particle motion, which is likely to improve hearing abilities due to an increased sensitivity as well as an extended high-frequency hearing range. According to Rogers and Cox [16], the latter would especially benefit fish living in shallow habitats, such as otophysans. Data from eight species have shown that cyprinids are in fact adapted to hear a wide range of frequencies with an optimum located between 200 Hz (and potentially lower) and 1000 Hz at sensitivities (frequency specific hearing thresholds) of 60–95 dB re: 1 µPa [17,18]. The chub (Squalius cephalus), which also belongs to this group and is further investigated in this study, shows the same overall hearing optimum where it is most sensitive to frequencies of approximately 400 Hz at sound pressure levels as low as 66 dB re: 1 µPa [18].
In contrast to cyprinids, there are no reports of comparable sound pressure sensitivity in the family of salmonids, as its members are not equipped with Weberian ossicles or similar structures. Likely as a result, the overall sensitivity to acoustic signals as well as the perceived range of frequencies is reduced. This could potentially be seen as an adaptation to faster flowing and therefore noisier habitats, which are inhabited by most salmonids at least during some life stages. Hence, acoustic sensitivity to a wider range of frequencies may lead to overstimulation, and rather than providing a benefit through increased information gain, this may instead result in the masking of relevant acoustic signals. Based on data from three different salmonid species, an optimum between 80 Hz (and potentially lower) and 350 Hz at sensitivities of approximately 90 dB re: 1 µPa [18,19,20] was identified. The brown trout (Salmo trutta), a member of this family which is further investigated in this study, is most sensitive to frequencies of approximately 200 Hz at sound pressure levels of approximately 87 dB re: 1 µPa [18].

1.2. Relevance of the Underwater Soundscape for Fish

Underwater soundscapes are of high relevance for aquatic fauna [21] and differ substantially between river habitat types, which naturally influence species composition and distribution [22]. Tonolla et al. [23] showed that pools, riffles and also runs (when sediment transport is initiated) exhibit distinct acoustic signatures within a frequency range of 31.5 to 16,000 Hz (octave bands) at sound pressure levels of approximately 80 to 160 dB re: 1 µPa, overlapping the audible range of both salmonids and cyprinids. Another study revealed the possibility to also differentiate between river segments based on the acoustic signature within the same frequency range and that higher flow levels (e.g., during a flood) result in higher sound pressure levels over most frequency bands [6]. These findings demonstrate the role of hydrological and morphological parameters, which are also used to classify river habitats, in determining the underwater soundscape [24]. Furthermore, hydrological events such as floods often cover time periods as short as several hours and potentially minutes depending on different catchment and precipitation characteristics [25]. Therefore, soundscapes should also be subject to strong temporal fluctuations that can serve as environmental cues triggering changes in behavior. However, research on this topic has focused heavily on the marine environment, where fish are known to use acoustic information, but unlike in rivers, sounds are primarily biological in their origin [26,27]. Only in recent years has this focus expanded to include freshwater ecosystems [28,29], with recent studies indicating that freshwater fish are also affected by the underwater soundscape [23,30,31], which in rivers is largely defined by morphological and hydrological characteristics [6,23]. A prominent example in this regard is hydropeaking, which leads to a homogenization of the underwater soundscape as well as “rapid, multiple-fold spikes in low frequency amplitude levels within the typical hearing range of common teleost fish species” [7]. Because discharge is usually positively linked to the overall underwater sound pressure level, behavioral responses of fish in hydropeaking scenarios may be attributed to hydraulic changes [32,33,34,35] as well as the associated increase in the sound pressure component, or in short, soundpeaking. Furthermore, fish have been found to respond to several other types of anthropogenic and natural acoustic cues with abiotic as well as biotic origins in both freshwater and marine environments [36,37]. While several studies have investigated the impact of anthropogenic noise on fish [38,39], research addressing changes of riverine underwater soundscapes and their effect on fish is sparse, and while bearing great potential, it still represents a major challenge in the future.
The main purpose of this study is to investigate whether soundpeaking generated by flood events induces a detectable behavioral response of adult chub, a fish species known to be sensitive to acoustic stimuli, and adult brown trout, a fish species regarded as less sensitive to acoustic stimuli. Furthermore, the aim was to characterize potential behavioral responses and to derive new implications on how fish interact with the environment based on their auditory sense. According to these objectives, the following hypotheses were formulated: for both species, we hypothesize that soundpeaking affects the movement (H1a) and the position (H2a) in the experimental area. We expected a stronger soundpeaking effect on chub compared to brown trout (movement: H1b; position: H2b) due to the more refined hearing of the former. We further hypothesized that soundpeaking affects the aggregation (H3) of individuals for chub but not in the case of brown trout, as this species is known to be territorial in its adult life stage.

2. Material and Methods

2.1. Experimental Setup and Design

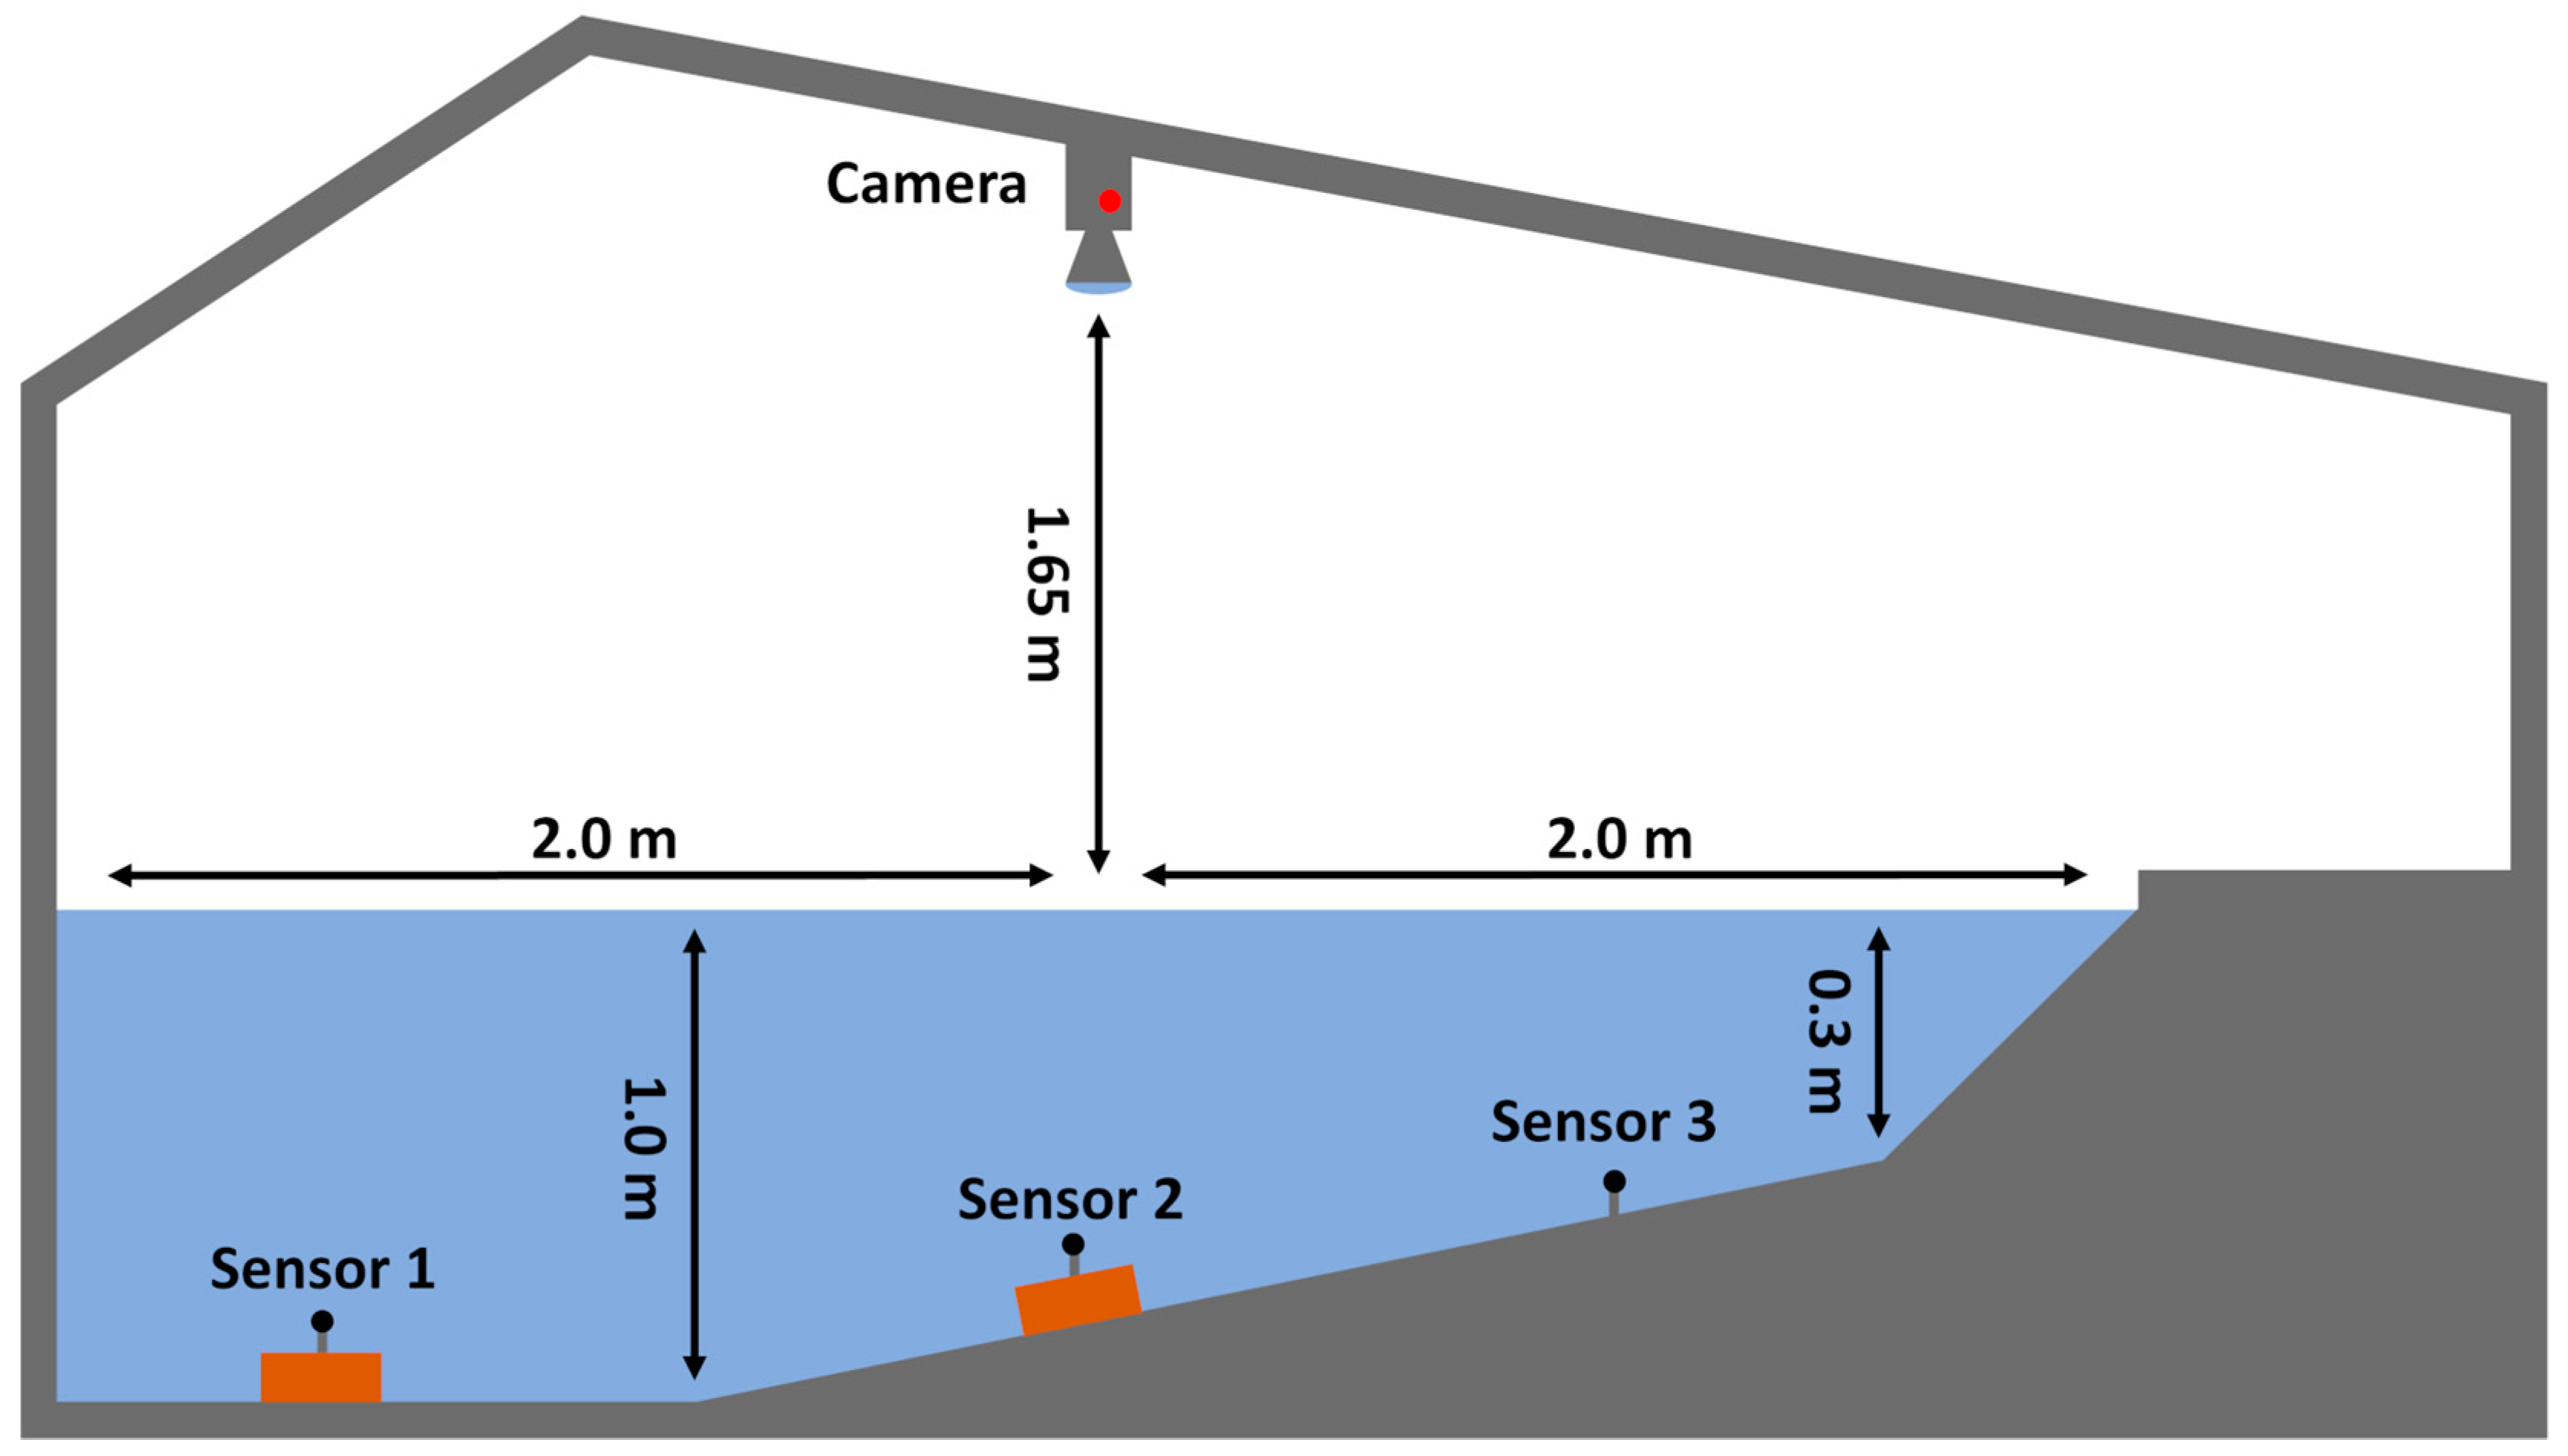
Trials were conducted during August 2021 at the HyTEC facility (Hydro-morphological and Temperature Experimental Channels; https://hydropeaking.boku.ac.at, accessed on 21 November 2023) in Lunz am See, which is located at an altitude of approximately 600 m in Lower Austria (47.85620, 15.03661). Here, an experimental area confined by a fine wire mesh fence with dimensions of 3.9 m × 2.1 m (Figure 1) was installed inside an artificial river channel and sourced with the surface water of lake Lunz via an underground pipe. Water depths ranged laterally from 0–0.9 m and remained constant in the longitudinal direction (Figure 2). Furthermore, six bricks were placed inside the experimental area on top of the sediment (akal), representing qualitatively equal structural elements (Figure 1 and Figure 2). In addition, a small weir equipped with a ramp was installed approximately two meters downstream of the experimental area. While the discharge was adjusted to approximately 155 l s−1, this structure led to an increase in water depth and homogenized flow velocities throughout the water column, creating a mesohabitat commonly described as a run. Flow velocities were measured across a transect at the upstream and the downstream end of the experimental area using a Marsh-McBirney Flo-Mate 2000 portable flow meter © (March-McBirney Inc., 4539 Metropolitan Court, Frederick, MD, USA) and ranged from 0 to 7 cm s−1. Furthermore, light conditions were adjusted by installing a roof equipped with four large (8800 lm) and two small (2300 lm) halogen floodlights above the experimental area. This measure was crucial in order to visually observe the fish during trials. For this purpose, a camera (GoPro® HERO3 Black Edition; GoPro Inc., 3025 Clearview Way, San Mateo, CA, USA) was positioned above the experimental area, which supplied a live video stream at 60 fps in HD quality (1920 × 1080 pixels). Within the recorded video footage, the experimental area which covered 1.098.880 pixels was further divided into three lateral and three longitudinal transects. The lateral transects denoted deep (latd), shallow (lats) and areas of moderate (latm) water depth (Figure 1 and Figure 2) and covered an area of 341,380 pixels (31%), 416,120 pixels (38%), and 341,380 pixels (31%), respectively. The longitudinal transects denoted areas where the presence of a fish could potentially indicate upstream (lonu), downstream (lond) or no displacement (lonn) amounting to 232,560 pixels (21%), 625,600 pixels (57%), and 240,720 (22%) pixels, respectively. Furthermore, the light intensity L and the water temperature T were continuously measured every 10 min by three (S1–S3) HOBO UA-002-08 pendant waterproof temperature and light intensity loggers (Onset Headquarters, 470 MacArthur Boulevard, Bourne, MA, USA) inside the experimental area (Figure 2). As a reference, another logger (S4) was positioned six meters further upstream at a water depth of approximately 0.5 m where the artificial river channel was not covered by the roof.
Before each trial, the experimental area was stocked with either three chub or brown trout, which had been collected previously in a nearby stream originating from lake Lunz, the Seebach (metarhithral). Fish were caught at least 24 h prior to the trial via electrofishing and were kept afterwards in a basin equipped with a wooden cover. The cage was installed inside the second artificial channel at the HyTEC facility, which was also fed by the surface water of Lake Lunz. Because the length of fish (total length) ranged from 16–30 cm in case of chub and from 16–29 cm in case of brown trout, each trial was conducted with three fish of approximately three different sizes (small, medium, large). At least five control and five treatment trials were conducted independently for each species where every individual was used only once. In addition, individuals were allowed to adapt to the new environment for one hour before each trial. This time period was chosen based on Ladich and Fay [40], who demonstrated that the hearing thresholds of goldfish had largely recovered from the effect of a white noise treatment after one hour. In order to assess the impact of soundpeaking on the two species, the underwater soundscape of the Seebach (MQ = 1.54 m3s−1; [41]) was previously recorded during a high discharge event (9.24 m3s−1 peak discharge; [41]). Furthermore, a control treatment approach was applied where the treatment consisted of the previously recorded soundscape (Figure 3) being played back for the duration of the trial, while no sound was played during control trials. For this purpose, an underwater speaker (Clark Synthesis AQ339 Diluvio; Clark Synthesis, 12905 Division Street Unit C, Littleton, CO, USA) with a frequency range of 0.02 to 17 kHz was installed approximately two meters upstream of the experimental area at a water depth of 0.5 m. During the first two minutes of the trial, the sound pressure level (measured as the energetic mean over all frequencies from 0.002 to 20 kHz) was increased from 90.3 dB re: 1 µPa (natural background noise in the artificial river channel) up to 113.7 dB re: 1 µPa. At this level, the sound was played for approximately ten minutes before the sound pressure level was again decreased down to the level of the background noise over a time period of two minutes. The amplification of the recorded soundscape during treatment trials was adjusted to match the sound pressure level that was measured during the recording in the Seebach. Furthermore, the frequency response of the underwater speaker was adapted for frequencies 500 Hz to match the actual amplitudes measured in the Seebach. The exact duration of each trial was 14.06 min (846 s).

2.2. Video Post-Processing and Tracking

In order to interpret coordinates referring to the positions of fish in the recorded images (frames) as their position in the experimental area, the videos were post-processed before tracking. This was necessary due to the wide-angle lens of the utilized camera which caused a severe radial distortion effect. However, because the distortion coefficients of the camera model could not be obtained, coefficients from similar models were adapted based on a visual assessment of the undistorted frames. The relevant parameters of the intrinsic camera matrix could not be obtained either, but they were available for a similar model (GoPro HERO3 White Edition; GoPro Inc., 3025 Clearview Way, San Mateo, CA, USA) from the Argus open-source software [42]. The effects of those parameters in combination with the previously adapted distortion coefficients were visually assessed and found to produce an image with no visible distortion effects. The algorithm used to undistort individual images from the recorded videos was implemented in Python 3.9.10, mainly using the OpenCV 4.5.2 library [43]. Furthermore, the video footage was aligned according to four fixpoints indicating the corners of the experimental area. While continually assessing the displacement between corners and fixpoints visually, images were shifted along the x- and y-axis, rotated around the image center and if necessary, also rotated along the x- and y-axis. Next, fish were tracked manually in two frames per second. To achieve this, a customized program was built in Python 3.9.10 using mainly the OpenCV 4.5.2 library. After extracting the coordinates of each fish in each relevant frame, the generated data were checked for plausibility. For this purpose, the missing coordinates in untracked frames were interpolated based on the Euclidean distance between the position of a fish in the previous and the following frame included in the tracking. In a next step, the coordinates for each of the three fish used per trial were indicated in the video by three small circles, each with a distinct color. The video was then played back at four times the normal speed while errors such as inaccuracies were identified by comparing the movement of the fish and the movement of the associated colored circle. The error generated during tracking was estimated by repeatedly (ten times) tracking a single individual over a randomly chosen period of 10 frames in a randomly chosen video. The x- and y-coordinates generated showed deviations of up to 9 pixels, and therefore, the error generated during tracking was taken to be 9 pixels. Moreover, the light refraction at the air–water interface led to an additional error. However, the refraction magnitude depends on the entry angle, which meant that the error increased with the distance from the center of the experimental area from 0 to approximately 120 pixels. Furthermore, according to the refraction angle at a specific point, the light deflection increased with the distance from the water surface. Therefore, because the water depth at which individuals were located was not recorded, the refraction error could not be accounted for. Hence, distances traveled by fish were measured in pixels and not converted into metric units.

2.3. Data Analysis

2.3.1. Variable Calculations

To quantify different behavioral aspects, several variables were calculated based on the coordinates referencing the x i and y i position of the fish in the experimental area at the time i (seconds). Regarding the movement of fish, the variables used for the statistical analysis included the distance traveled during trials D (pixels), the variance of the acceleration a v a r (pixels) and the number of movement direction changes o . In order to determine D , first, the velocity v i (pixels s−1) at which an individual had moved between i and i + 0.5 s after the beginning of the trial was calculated according to Equation (1). Next, D was calculated using Equation (2) with n = 2 × 846 according to the number of observations per individual and the duration of the trial.
v i + 0.5 = 2 × ( x i x i + 0.5 ) 2 + ( y i y i + 0.5 ) 2   ;   i = 0 ,   0.5 ,   1.0 , , 845.5
D = i n v i 2   ;   i = 0.5 ,   1.0 ,   1.5 , , 846
Regarding a v a r , first, the acceleration a i based on v i was determined as described by Equation (3), which was followed by the calculation of a v a r according to the formula for the variance of an independent subsample (Equation (4)).
a i = v i v i 0.5   ;   i = 1.0 ,   1.5 ,   2.0 , , 845.5
a v a r = 1 n 1 i = 1 n a i a ¯ 2   ;   i = 1.0 ,   1.5 ,   2.0 , , 846
The number of movement direction changes o (Equation (7)) was based on o r a d with π   o r a d π , which was calculated using the R-function “atan2” from the “base” package [44] according to Equation (5). The function determined the movement direction on a radiant scale where a value of 0 corresponded to movement in the upstream direction and a value of π in the downstream direction (Figure 1). Accordingly, a value of 0.5 π indicated movement toward the shallow area and a value of −0.5 π indicated movement toward the deep area (Figure 2). Here, it should be noted that calculations are based on the assumption that individuals did not conduct movement direction changes > 180° in time periods 0.5 s. In order to exclude movement direction changes at the time i (Equation (6)), that may have only been caused by tracking inaccuracies, such were only counted if the condition v i > 9 was fulfilled. Hence, individuals had to cover a distance larger than the tracking error (9 pixels) in the previous 0.5 s. Furthermore, movement direction changes were only counted as such if they exceeded a magnitude of 5° (Equation (7)).
o r a d , i = a t a n 2 x i x i 0.5   ; y i y i 0.5       ;   i = 0.5 ,   1.0 ,   1.5 , , 846
o , i = o r a d ,   i o r a d , i 0.5 ;   o r a d ,   i o r a d , i 0.5     π 2 π o r a d ,   i o r a d , i 0.5 ;   o r a d ,   i o r a d , i 0.5 > π     ;   i = 1.0 ,   1.5 ,   2.0 , , 846
o = i n 1 o , i 2 π   5 360 v i > 9   ;   i = 1.0 ,   1.5 ,   2.0 , , 846
Regarding the aggregation of the fish, first, the distances d between the three individuals ( a ,   b ,   c ) were determined at each time i according to Equation (8). Next, an aggregation index A i with 1 A i 0 was calculated, as illustrated by Equation (9), where a m a x was the largest possible distance between the individuals in the experimental area. A value of A i corresponding to 1 therefore indicated that all individuals were located at the exact same position, while a value of 0 indicated that the distance between them was as large as possible considering the physical extent of the experimental area.
d a b , i = ( x a , i x b , i ) 2 + ( y a , i y b , i ) 2   ;   i = 0 ,   0.5 ,   1.0 , , 846
A i = 1 a m a x d a b , i + d a c , i + d b c , i   ;   i = 0 ,   0.5 ,   1.0 , , 846
In order to test the hypotheses relating to the position of fish in the experimental area, each individual was assigned during each timestep i to one of the lateral transects (latd, latm, lats) and one of the longitudinal transects (lonu, lonn, lond) defined in Figure 1 according to its current position. For this purpose, the R-function “pip2D” from the “ptinpoly” package [45] was used, which determined whether or not a location based on x- and y-coordinates was located within a specified area. Every assignment to a specific transect at a specific timestep was further interpreted as a period of 0.5 s spent within the area by the individual.
Finally, for the purpose of identifying potential effects of abiotic variables on the results of this study, the arithmetic mean of the water temperature T ¯ i and the illumination L ¯ i measured by the three sensors located inside the experimental area (S1–S3) was calculated at each timestep i as well as the respective change T ¯ ,   i and L ¯ ,   i from i to i + 0.5 s. These variables were then summarized over the trial time period (arithmetic mean) and compared with variables describing the behavior of individuals.

2.3.2. Statistical Analysis

Variables were compared between control and treatment trials within species using the data from the full time period of the trials. Additionally, the same analysis was conducted using only the data from the first minute of each trial in order to investigate whether individuals exhibited a response to the treatment that could only be observed initially. Because the number of trials differed between groups defined by species and trial type (control and treatment), a random subsample with the largest possible n was used during the analysis in order to generate equal sample sizes across groups. In case of variables that were summarized over the period of a trial per individual, subsamples consisted of an even number of individuals per group. Regarding the aggregation of individuals ( A i ), subsamples consisted of an even number of observations at randomly chosen times during the trial. In total, seven control trials and six treatment trials were conducted with chub as well as eight control trials and five treatment trials with brown trout. However, in case of the latter species, eight individuals from five different control trials exhibited an extremely low activity and remained at a single position for most or the full duration of the trial. Because all other individuals were continuously moving throughout the trials, the data gathered from those fish were excluded from the analysis. Furthermore, the video footage of all individuals associated with outliers was visually examined, but since no behavioral anomalies were detected that could justify an exclusion from the dataset, no further individuals were excluded. Furthermore, the video footage from one of the chub trials only included the first 12 min, which naturally decreased the observed covered distance D . Therefore, this trial was fully excluded from the analysis. Finally, the sample size regarding the movement ( D , a v a r , o ) and position variables (latd, latm, lats, lonu, lonn, lond) amounted to 15 individuals per group. Regarding the aggregation of fish, the final sample size equaled 5079 random observations during the trial per group.
Since all variables indicated either a non-normal distribution, heterogenous variances or because the sample size was too small to test these assumptions, a non-parametric approach was applied in order to test the hypotheses. Hence, Brown–Mood median tests were conducted via the R-function “median_test” from the “coin” package [46]. Here, the probability of a type one error was adjusted by applying the Bonferroni correction according to the number of pairwise comparisons (α) made in order to test the hypothesis. In case of statistically significant differences, the effect sizes were estimated according to Cramér’s V [47]. All p-values were rounded to two decimal places, while significance was assumed at the adjusted 5% (p < 0.05) significance level of 1.6% (p < 0.016; α = 3) in case of positional variables and 2.5% (p < 0.025; α = 2) in case of proximity as well as movement variables. Furthermore, confidence intervals were calculated. For this purpose, an ordinary non-parametric bootstrapping method with 10,000 replicates was applied using the R-function “boot” from the “boot” package [48]. Subsequently, basic confidence intervals were calculated according to Davison and Hinkley [49] based on the bootstrapped data by utilizing the R-function “boot.ci” from the same package. Finally, correlations matrices with behavioral and abiotic variables were calculated according to Spearman’s ρ , including approximated p-values indicating the probability of ρ = 0, using the R-function “rcorr” from the “Hmisc” package [50].

3. Results

3.1. Abiotic Variables

While the water temperatures T only showed neglectable spatial variations (Table 1), the light intensities L measured outside the roof construction (S4) were naturally much higher and showed stronger fluctuations during trials (52,355.9–66.9 lm). Inside the experimental area (S1–S3), L fluctuated between 649.4–480.8 lm. Spearman’s ρ indicated a negative correlation of the swimming distance D (−0.40) and of the variance of the acceleration a v a r (−0.52) with L ¯ as well as a positive correlation of lond (0.52) with L ¯ , which were significantly different from zero. Therefore, the following results are to be interpreted under the assumption that these correlations did not cause a problematic bias.

3.2. Movement

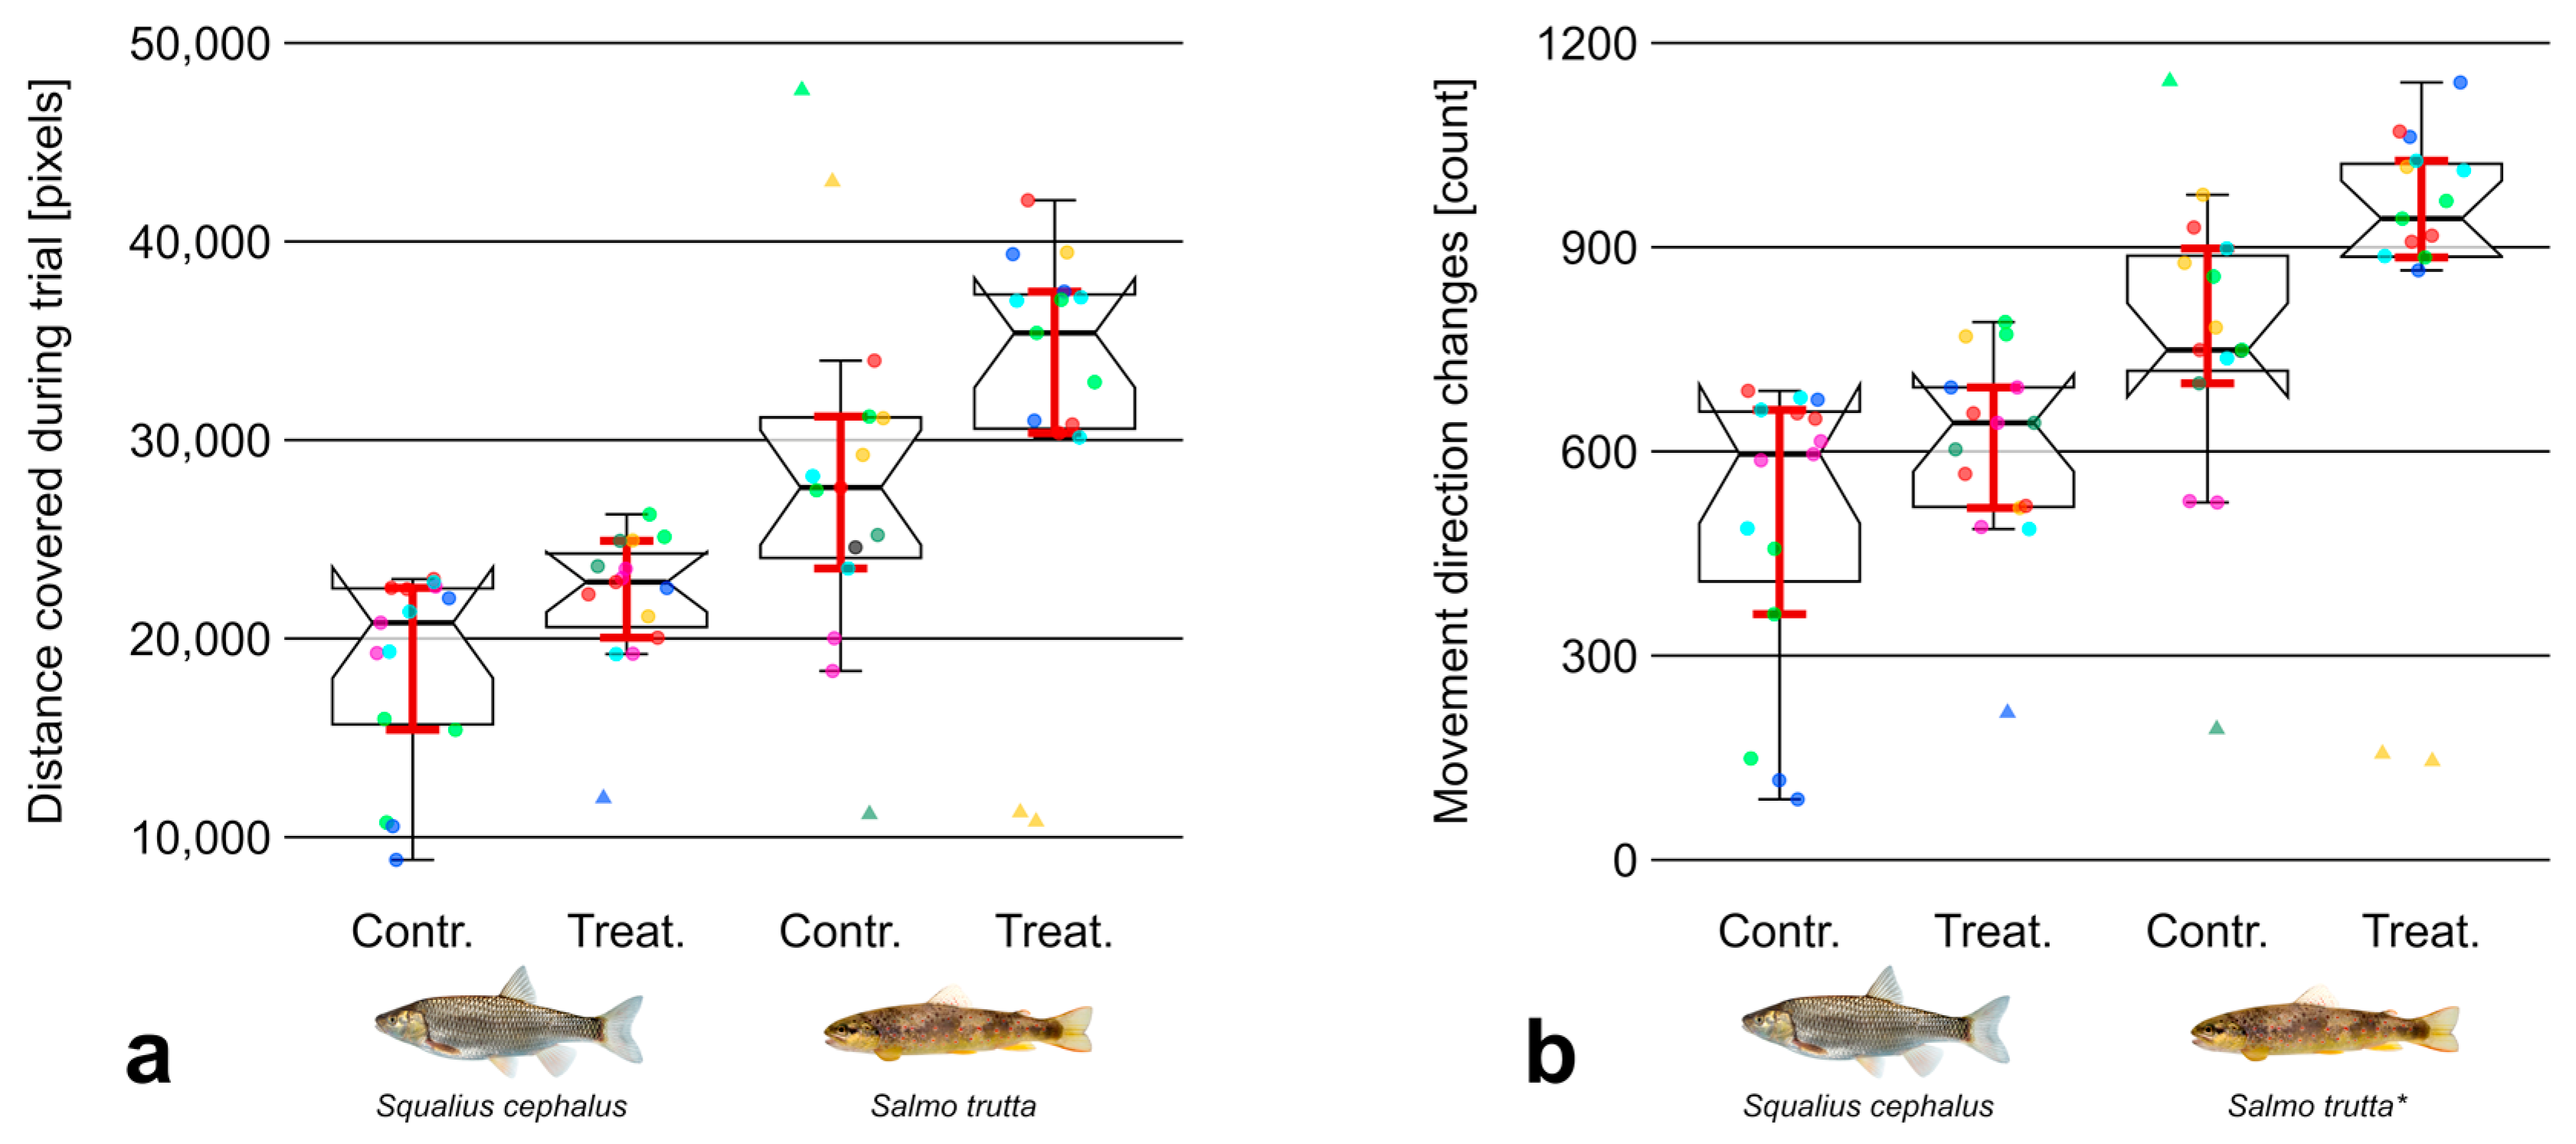
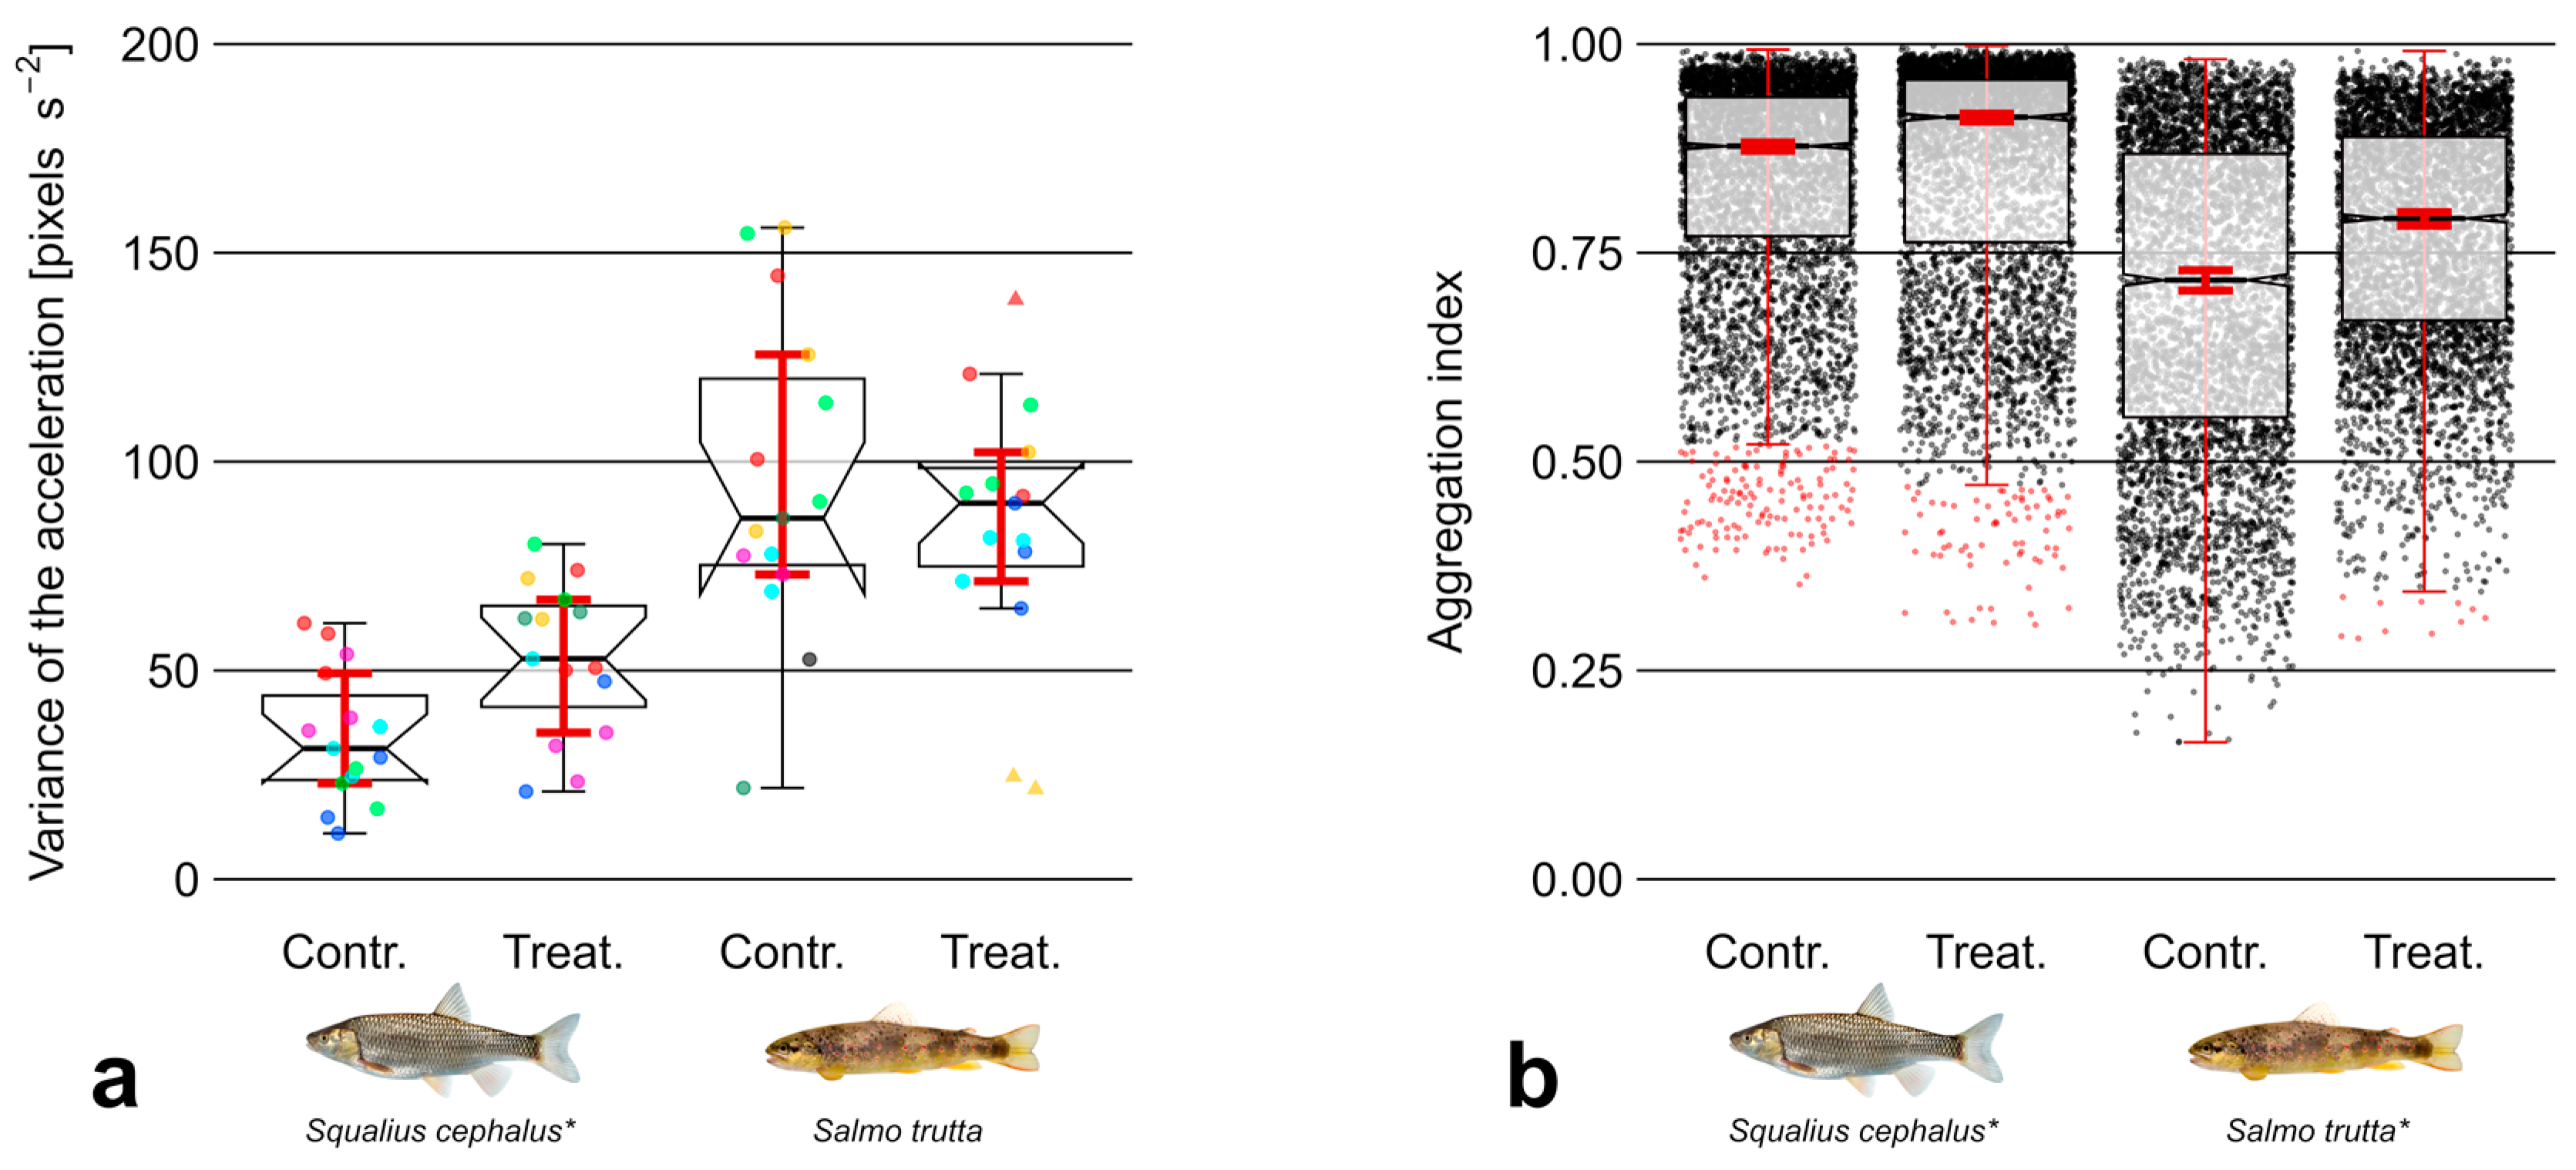
The results showed a trend indicating that both species covered larger distances during treatment trials relative to controls. This trend was more pronounced for brown trout, which also covered larger distances in general. However, differences of D (swimming distance) were not significant between control and treatment trials in either species (Figure 4a). The number of movement direction changes o (Figure 4b) was significantly higher during treatment trials in case of brown trout (Z = −2.51, p  < 0.05) with an effect size estimated to be moderate ( V = 0.47). Regarding chub, no statistically significant difference was observed in this regard. The variance of the acceleration a v a r (Figure 5a) showed no significant difference between trial types in case of brown trout. Contrastingly, a v a r was significantly higher during treatment trials in case of chub (Z = −2.51, p  < 0.05). The magnitude of this effect was estimated to be moderate ( V = 0.47). The analysis of movement variables during the first minute of trials showed no substantial differences compared to the results of the analysis over the entire trial period.

3.3. Aggregation

Regarding the aggregation of fish A i (Figure 5b), a weak ( V = 0.28) but statistically significant effect (Z = 40.49, p  < 0.01) was observed, indicating that that the overall distances between chub (median of A i   = 0.89, SD = 0.14) were smaller compared to brown trout (median of A i = 0.76, SD = 0.17). Furthermore, a significantly higher aggregation during treatment trials was observed in case of both chub (Z = −11.76, p  < 0.01) and brown trout (Z = −11.09, p  < 0.01) with weak effect sizes of V = 0.12 and V = 0.11, respectively. The analysis of A i during the first minute of trials showed no substantial differences compared to the results from the full period.

3.4. Position

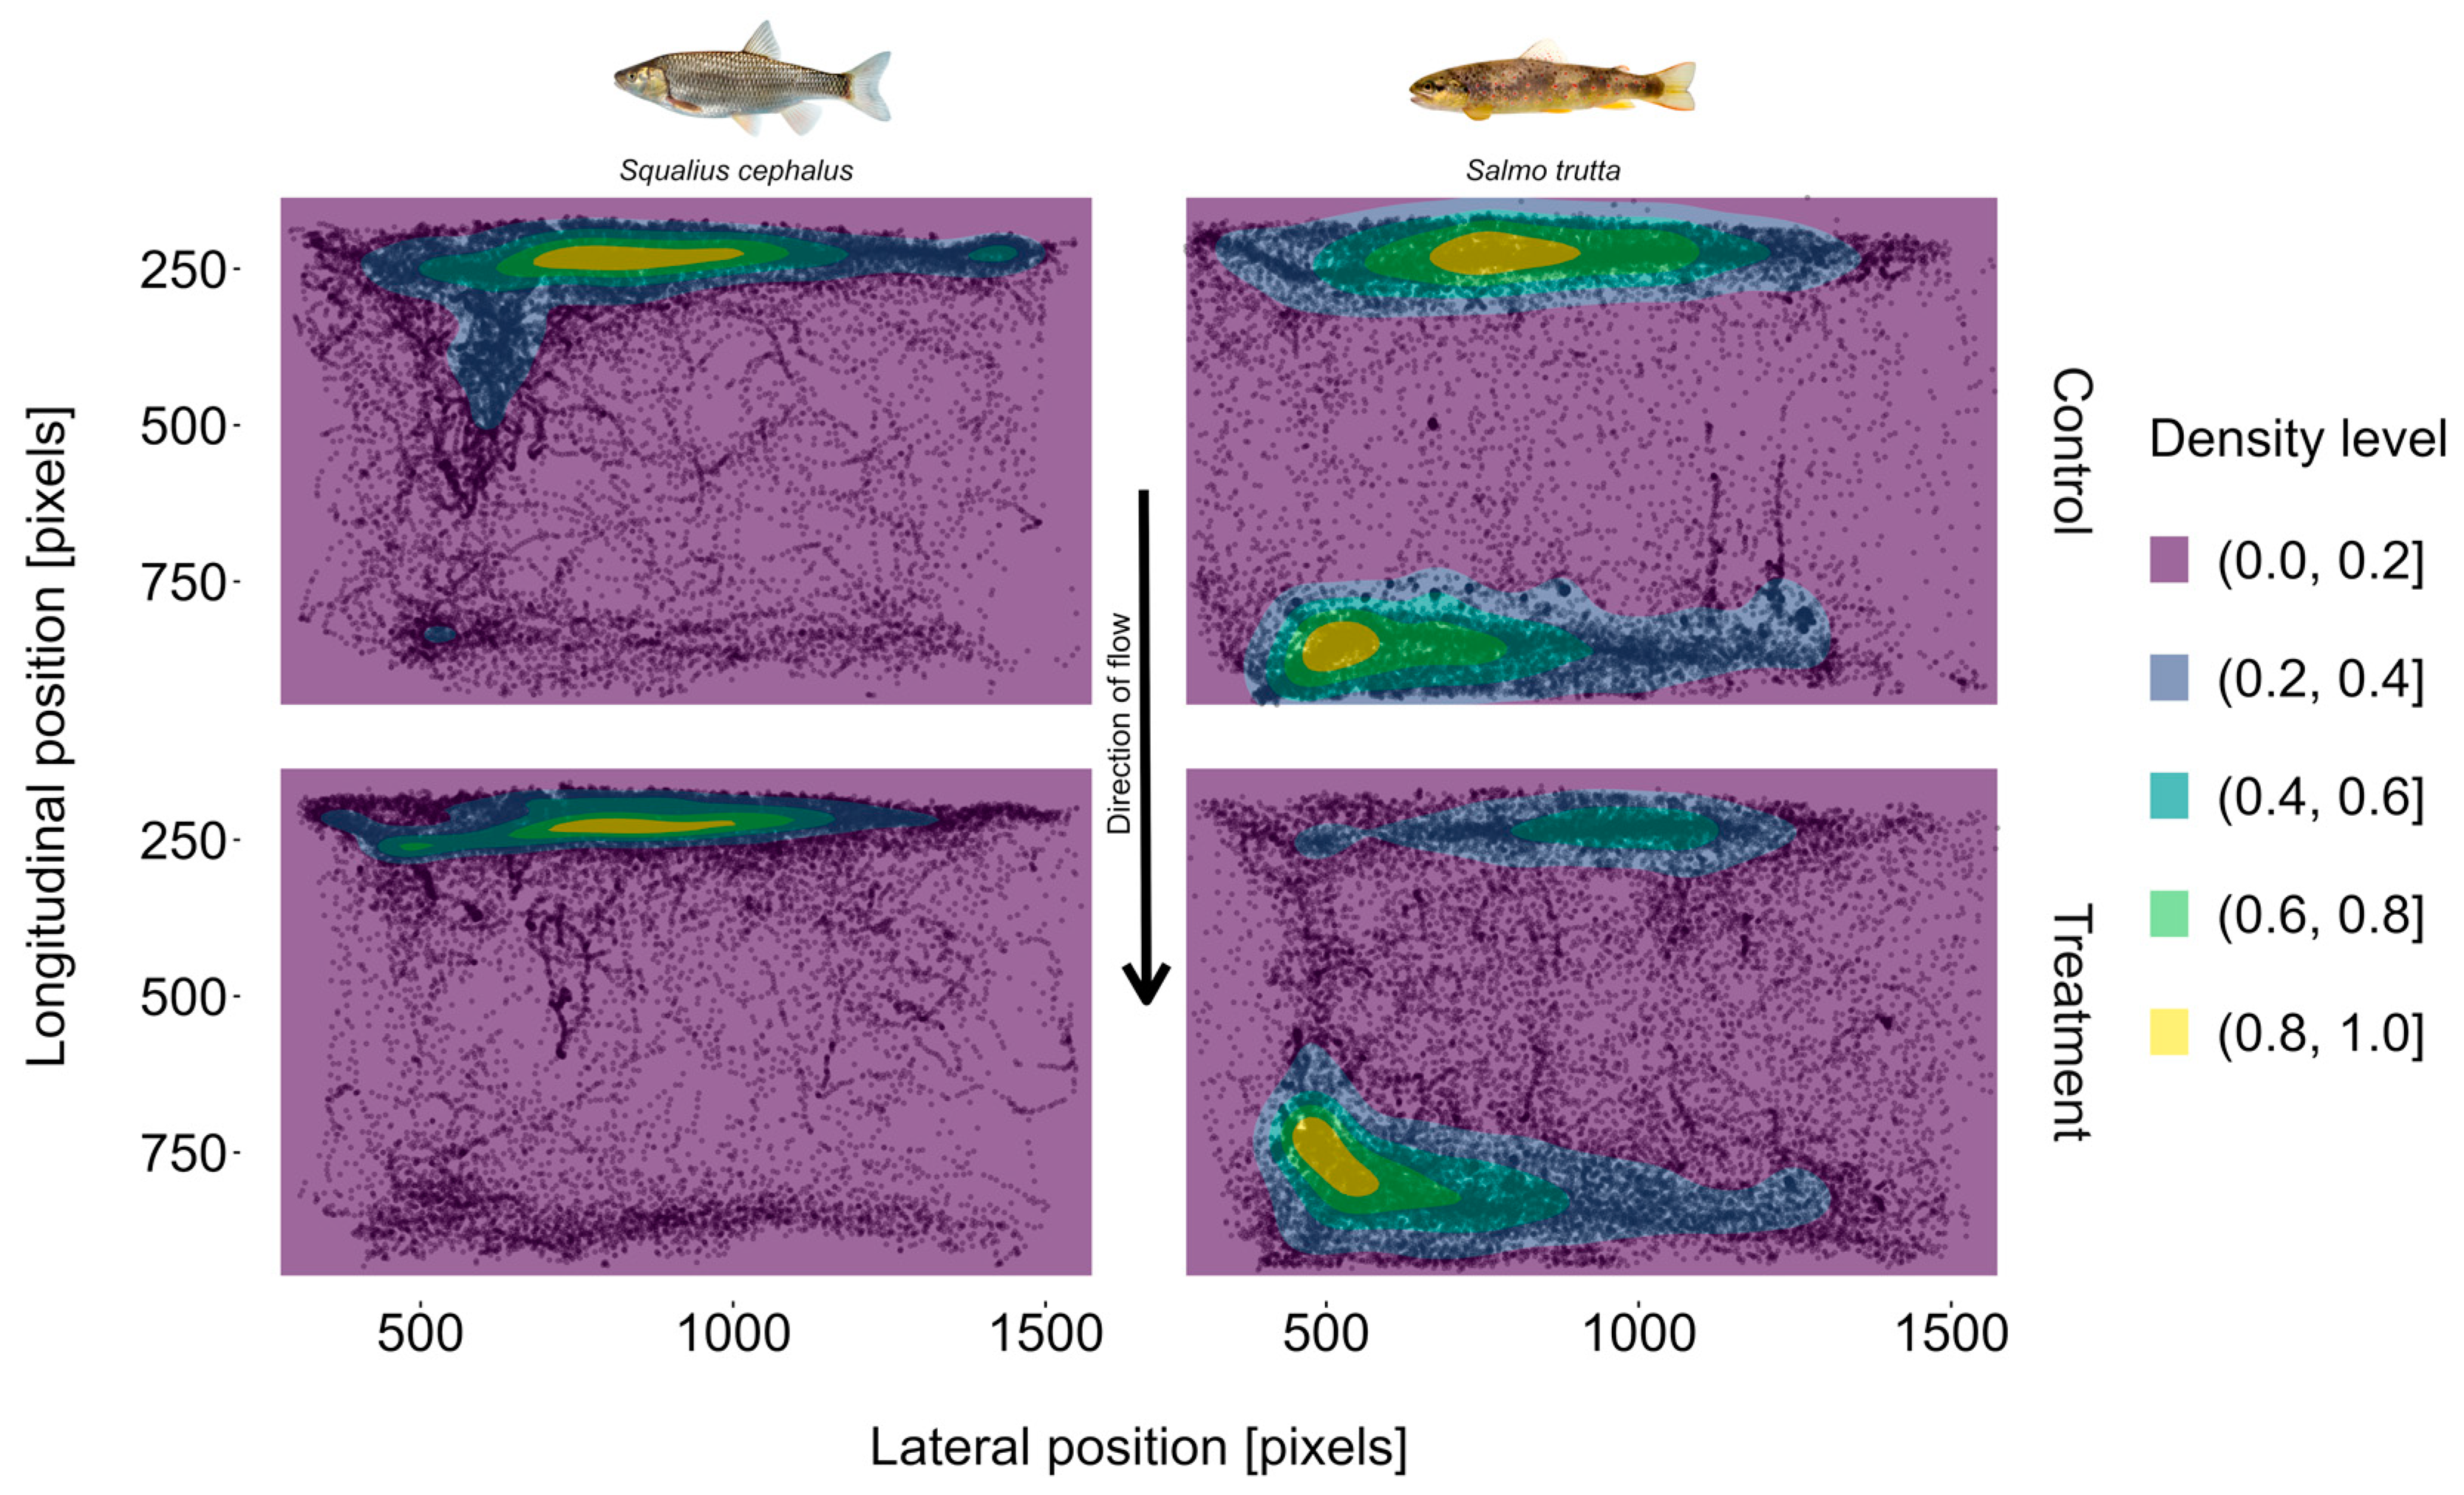
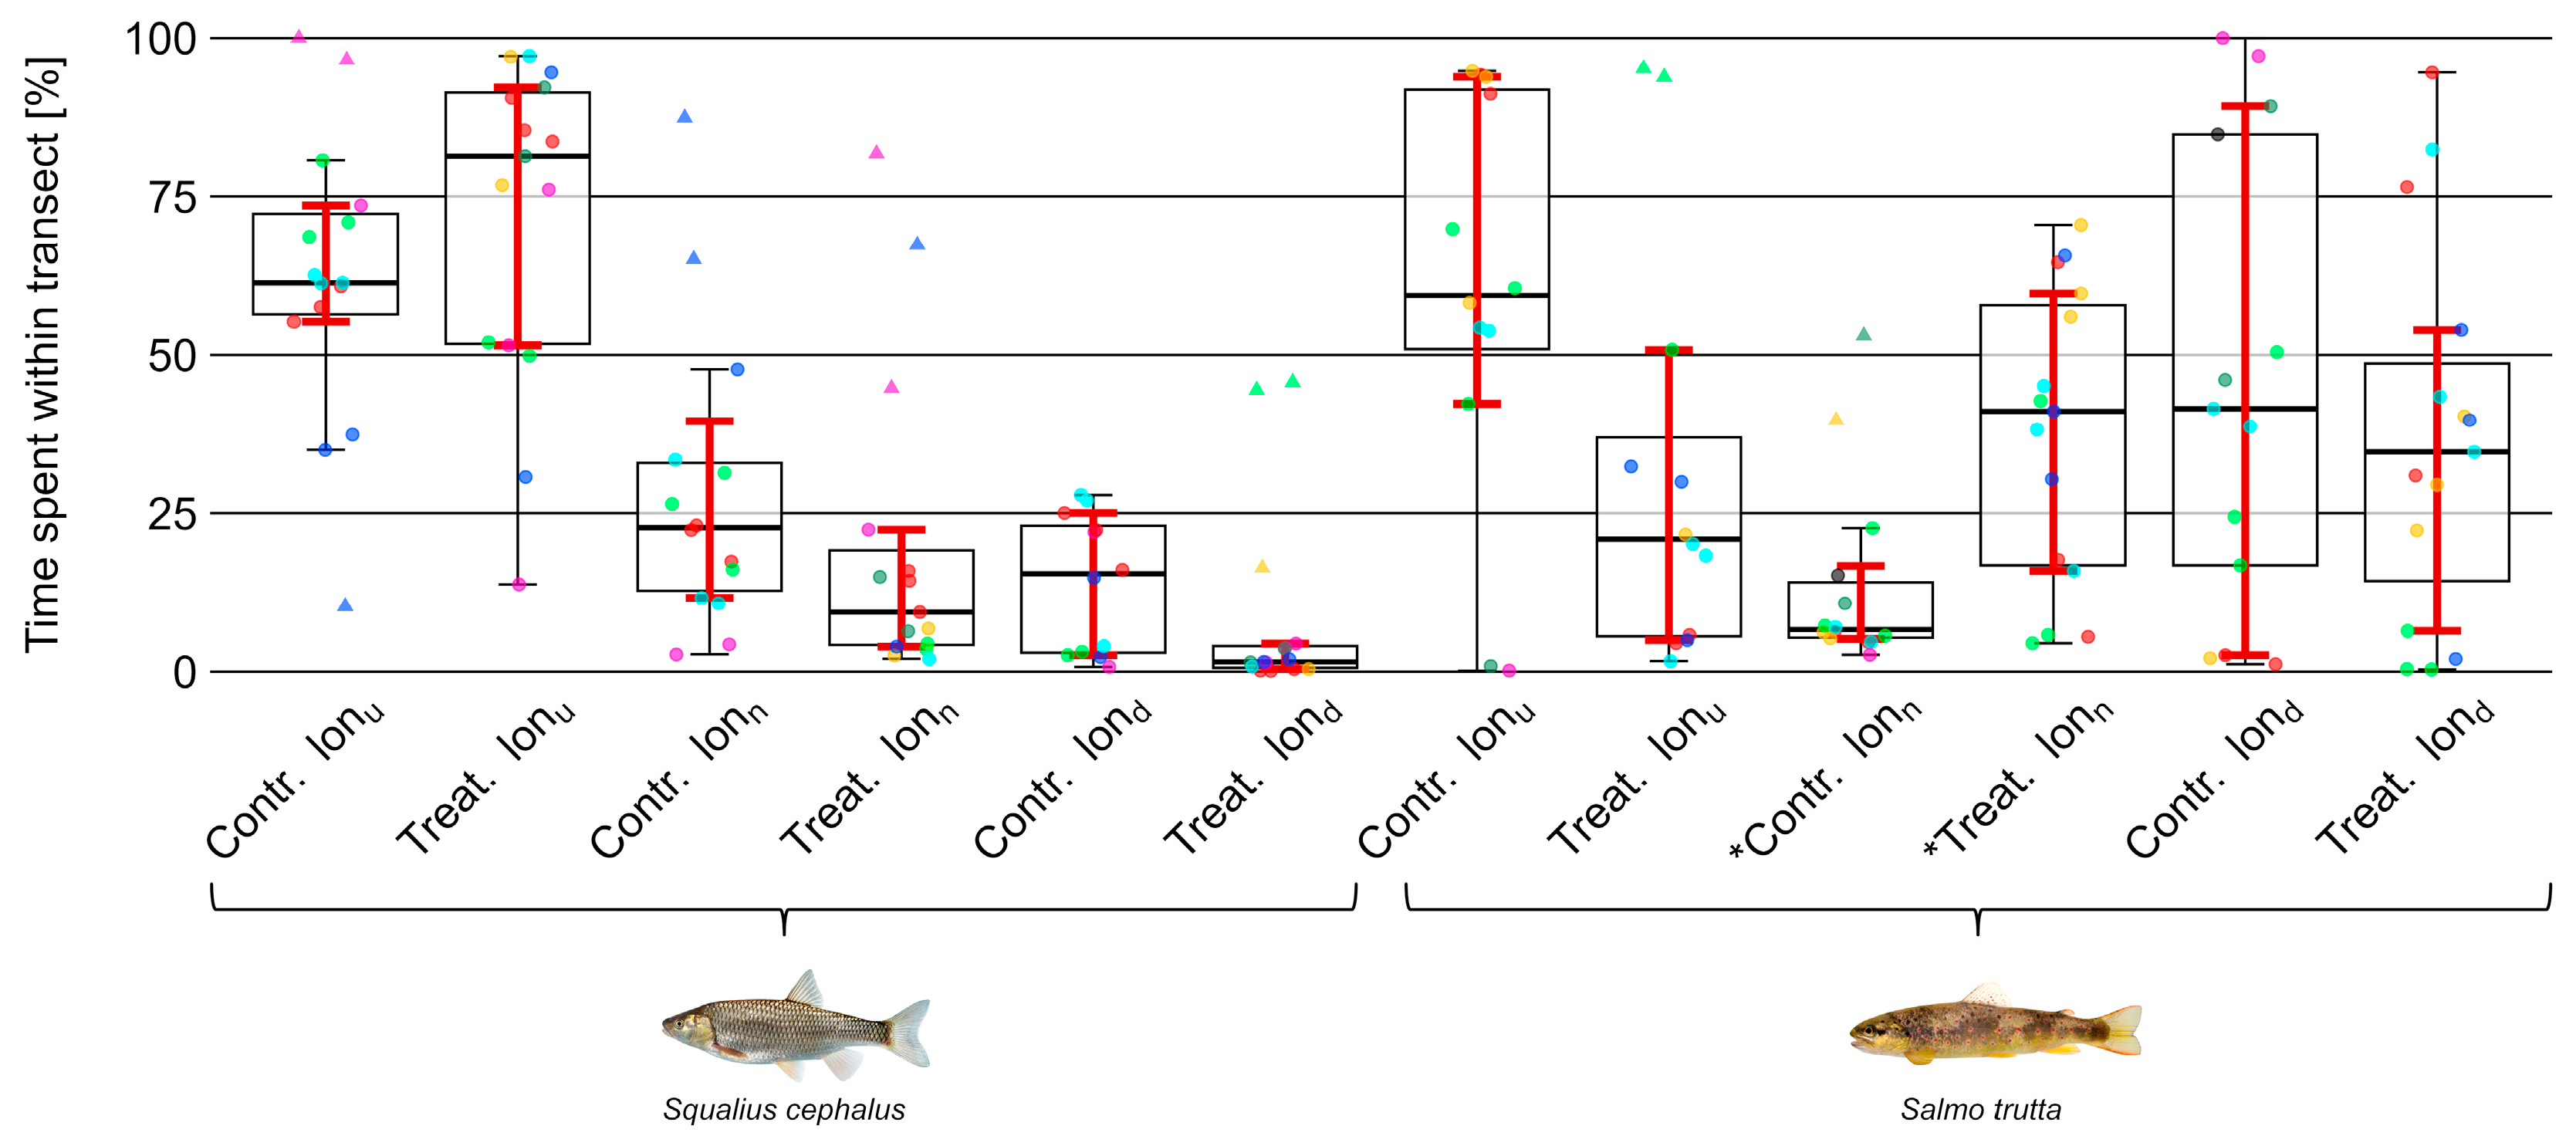
Both species were mostly residing close to the upper or lower end of the setup (Figure 6). Regarding the percentage of time spent in different lateral transects (Figure 7), no significant difference between trial types was observed in either species. However, brown trout spent significantly (moderate to strong effect size; V = 0.60) more time in lonn (Z = −3.23, p  < 0.01) and less time in lonu (not significant) during treatment trials (Figure 8).
Contrastingly, chub shifted their position slightly from lond and lonn toward lonu. However, this trend was not significant. The analysis of the longitudinal and lateral position of individuals during the first minute of the trials did not produce any results that differed substantially from those previously described.

4. Discussion

Firstly, it should be noted that the covered distance D is naturally correlated with the number of movement direction changes o (Spearman’s ρ = 0.97) and the variance of the acceleration a v a r (Spearman’s ρ = 0.87). Nevertheless, such parameters based on the movement of fish are commonly used to assess activity [51] and identify stress [52]. Overall, the results of this study often showed an increase in these variables during treatment trials in form of a statistically significant effect or a trend. Thus, the results indicate that soundpeaking affects the movement of fish and hence support H1a in case of both species. However, the driver behind this behavioral response is not clear, and H1a is based on the assumption that fish perceived the acoustic signal used to mimic a natural soundpeaking event as such. In this case, an increased activity could, for example, be interpreted as a repositioning in the surrounding environment due to an expected change in hydraulic conditions. This would indicate that fish utilize acoustic information in order to react to a changing environment and due to the fast speed of sound underwater, soundpeaking could potentially function as an early warning system. On the other hand, if the acoustic signal was perceived simply as noise rather than the soundscape associated with high discharge conditions, an increased activity could also be interpreted as the attempt to find shelter or other ways to escape a potential threat. Ultimately, this would mean that the study had failed to investigate the formulated research questions, but since several measures were undertaken to faithfully reproduce the recorded flood soundscape, it is assumed that this was not the case. Nevertheless, it should be considered that despite prudent handling and an adaptation time of one hour [40] prior to each trial, fish generally exhibited an unnatural behavior manifesting in regular attempts to escape the experimental area.
Considering the increased activity during treatment trials, the question arises as to whether soundpeaking not only acts as a behavioral trigger but also represents a source of stress for fish due to an intense acoustic stimulation [38,53]. Smith et al. [54] showed that goldfish (Carassius auratus) did not exhibit long-term physiological stress responses when exposed to a white noise treatment. Yet, a significant increase in hearing thresholds within ten minutes of noise exposure was observed and increased further until reaching a maximum after 24 h. While it took goldfish 14 days to reach control hearing levels after being exposed to white noise over a period of 21 days, the authors concluded: “hearing-specialist fishes may be susceptible to noise-induced stress and hearing loss”. However, the sound pressure level of the white noise treatment was substantially higher at 160–170 dB re: 1 µPa compared to the present study (113.7 dB re: 1 µPa). Nevertheless, especially chronic soundpeaking could potentially cause hearing thresholds to increase. Some Austrian rivers, for example, are impacted by up to five daily hydropeaking events [55], which as previously described, directly affect the sound pressure level. There are several potential consequences such as an increased predation mortality as demonstrated by Simpson et al. [56] in a marine fish species (Pomacentrus amboinensis) or reduced foraging success [57]. However, the actual consequences of such a chronic exposure to soundpeaking are unknown and on the population level likely masked by other effects of hydropeaking such as stranding [58]. Furthermore, hearing specialists like the chub might be more susceptible to acoustic stress compared to generalists like the brown trout, which as described earlier is better adapted to noisier environments and possesses less sensitive hearing. This assumption has been supported by Wysocki et al. [59] and Davidson et al. [60], which found no long-term effects of different noise treatments on rainbow trout (Oncorhynchus mykiss) in an aquaculture environment.
Another indication for stress induced by soundpeaking could lie in the slightly higher aggregation ( A i ) observed for both species during treatment trials in the present study. Consequently, the hypothesis H3 stating that soundpeaking affects the aggregation of individuals in case of chub but not in case of brown trout could only be partly supported. According to the results from Magurran and Pitcher [61], minnows (Phoxinus phoxinus) exhibited increased shoaling behavior as a response to a predatory threat. Hence, assuming the degree of aggregation can be interpreted as the degree to which schoaling behavior was exhibited, the observed increase during treatment trials could potentially represent a reaction to stress. However, schoaling behavior is typical for chub but generally not observed in adult brown trout, which are territorial. This raises the question as to whether the observed effect could also be based on another motive.
Regarding the position in the experimental area, the absence of a soundpeaking effect on the time spent in the different lateral transects could be due to several reasons. The assumption that fish generally do not tend to change their lateral position during floods seems highly unlikely, since the often increased hydraulic forces require fish to move from the central area of the riverbed to laterally located flow refugia [62]. In case of the present study, a plausible reaction of fish could therefore have been a shift toward the shallower area. However, zones of comparably low flow velocities were mostly located in the deep lateral transect, which in combination with the limited spatial extent of the experimental area might have led to the outcome that no effect was observed. Of course, another possibility could also be that fish did not perceive the signal used to mimic soundpeaking as such or did not react to it accordingly because other triggers such as an increase in flow velocities were not experienced. Regarding the longitudinal position, firstly, it should be mentioned that the overall preference of both species for the upper and lower transect which indicate up- or downstream displacement, respectively, was most likely due to fish attempting to escape the experimental area. Nevertheless, brown trout indicated a significantly decreased upstream displacement during treatment trials, while no effect was observed for chub in this regard. A reason for this observation could be that brown trout are highly rheophilic, which is why soundpeaking may have been associated with a more familiar habitat, reducing the undoubtably present stress caused by a novel environment. However, the variability between trials and individuals regarding the time spent in different lateral and longitudinal transects was high, and therefore, the discussed results should be interpreted with caution. Nevertheless, the hypothesis that soundpeaking is affecting the position of individuals in the experimental area (H2a) could only be supported in case of brown trout but not in case of chub.
The hypotheses H1b and H2b stating that soundpeaking would, respectively, affect the movement and the position of chub in the experimental area more strongly than brown trout due to the more refined hearing of the former could not be supported. Such a pattern merely existed in the variance of the acceleration ( a v a r ) but not in the other movement or positional variables. Accordingly, the results of this study imply that the perceived magnitude of the soundpeaking signal may not have been proportional to the magnitude of the behavioral response. However, this statement is based on the assumption that the overall hearing ability of a species is simply a function of sensitivities toward specific acoustic frequencies, defining so-called hearing “specialists” and “generalists”. Yet, this does not take into account the effect of different mechanisms by which acoustic signals and their properties are perceived and processed. Popper et al. [63] stressed the necessity of considering potentially even more important aspects of hearing including sound source localization, discrimination between sounds and detection of sounds in the presence of masking signals. Here, it should also be mentioned that certain behavioral responses might be triggered by sound pressure thresholds of specific frequencies, combinations, or frequency patterns instead of thresholds corresponding to the overall sound pressure level. Furthermore, as the propagation of underwater sound strongly depends on the environment, the bricks (Figure 1 and Figure 2), the overall structure of the experimental setup, or missing properties like sediment transport and turbulences may have affected the replication as well as the propagation of the artificial soundscape. Hence, the responses of fish to the treatment may have also been affected. Low frequencies ( < 1 kHz), for example, tend to rapidly decay in shallow areas (cut-off phenomenon), and sediment transport causes a sound pressure peak within the high frequency range (2–16 kHz), while air bubbles produced by turbulences have the ability to scatter and absorb sounds [4,23]. Moreover, the sound pressure level of the flood soundpeaking in this study was much lower than, e.g., soundpeaking recorded during hydropeaking events (up to 135 dB re: 1 µPa in Lumsdon et al. [7]) and bankfull flood events (up to 154 dB re: 1 µPa in Tonolla et al. [23]).
Finally, we would like to point out some implications that might help other researchers avoid challenges and shortcomings in future studies: the problem of fish exhibiting unnatural behavior could potentially be solved by allowing for longer adaptation periods, utilizing a larger experimental area or by providing a more natural setting. However, it should be noted that a larger experimental area would also require a more powerful acoustic setup. Regarding the present study, the utilized underwater speaker was merely able to generate the original sound level observed during the recording of the soundscape. Therefore, larger setups are likely to require an additional or several underwater speakers. Furthermore, studies investigating acoustic stress in fish used substantially higher sound pressure levels compared to the present study, which might be also relevant to future research questions regarding soundpeaking. Another future challenge will be to investigate other potential behavioral cues such as discharge, turbidity, temperature, or olfactory stimuli in combination with soundpeaking as well as specific frequency ranges and soundscapes. Furthermore, the manual tracking of individuals based on the video footage required a major effort. Hence, the development of efficient automated tracking algorithms such as machine learning approaches that can deal with a low contrast between fish and the background may represent an additional but necessary challenge. Furthermore, the utilization of a 3D rather than a 2D tracking system should be considered. This would both generate additional positional information that may lead to more robust results or further insights regarding the effect of soundpeaking on the behavior of fish and improve tracking accuracy, since the positional information regarding the water depth would allow accounting for the light refraction at the air–water interface. Finally, the investigation of fish behavior based on movement variables, aggregation and position may be supplemented by measurements of stress hormones such as cortisol [64].

5. Conclusions

The results of this study indicate that flood-generated soundpeaking is likely to affect the movement of both chub and brown trout and may lead to a higher aggregation of individuals. Furthermore, the results showed an effect on the longitudinal position of individuals in case of brown trout but no effect regarding the lateral position in case of either species. However, it should be mentioned that the results generally included a substantial amount of variance between trials and individuals. Furthermore, it is not clear whether the observed response was caused by the expectation of changing hydraulic conditions associated with a flood, acoustic stress, or a combination of both. A stronger soundpeaking effect on chub compared to brown trout due to the more refined hearing of the former could not be identified. Nevertheless, soundpeaking may be utilized by fish in order to react to changes in the environment and could potentially act as an early warning system. Moreover, soundpeaking may represent an additional stressor that fish must face in rivers impacted by hydropeaking, which outlines its relevance regarding future research and conservation efforts.

Author Contributions

J.L.K. carried out the experiments, performed the data analysis and drafted the manuscript. P.M., J.L.K., S.A., R.W., W.G. and S.S. participated in the overall design of the study. D.T., P.M., S.S., W.G. and R.W. helped to draft the manuscript by contributing their expertise while P.M. further coordinated the study. All authors have read and agreed to the published version of the manuscript.

Funding

This work was supported by the Austrian Science Fund (FWF; project RISO; TAI 198).

Institutional Review Board Statement

Ethical review and approval were waived because no animals were physically harmed or exposed to harmful levels of stress. Fish were exposed to a flood soundscape, which was applied at the same sound pressure level observed during the recording in the river where the fish originated from. Therefore, every individual had previously experienced the treatment regularly in its natural environment and for far longer periods than the duration of the trials. Moreover, the authors want to point out that the welfare of the fish used in this study had a very high priority. Thus, the handling of the fish prior, during and after the trials was conducted with extreme care. After each trial, the fish were released into the river in which they had been caught. Upon release, none of the fish were observed to show singes of injury. Finally, according to EU law [65], this study does not represent a case of animal experimentation, as fish were not subjected to a procedure “which may cause the animal a level of pain, suffering, distress or lasting harm equivalent to, or higher than, that caused by the introduction of a needle in accordance with good veterinary practice”.

Data Availability Statement

The data presented in this study are available on request from the corresponding author. The data are not publicly available, as the file size of the corresponding video footage is very large.

Acknowledgments

We would like to express our thanks to Simon Führer, Élora Fauchery, Daniel Mameri, Arnaud Monserat and Florian Dossi for their kind help with the field work. Furthermore, we would like to thank Erwin Lautsch for his advice regarding the statistical analysis of the data and Rebecca Ann Tibbetts for proofreading the manuscript. Furthermore, the financial support by the Austrian Federal Ministry for Digital and Economic Affairs, the National Foundation for Research, Technology and Development and the Christian Doppler Research Association is gratefully acknowledged. Open access funding by the Austrian Science Fund (FWF). This publication is based on the master thesis submitted by J.L.K. [66].

Conflicts of Interest

Richard Wimmer was employed by the company Acoustic Solutions. Diego Tonolla was employed by the company eQcharta GmbH. The remaining authors declare that the research was conducted in the absence of any commercial or financial relationships that could be construed as a potential conflict of interest.

References

  1. Tavolga, W.N. 6 Sound Production and Detection. In Sensory Systems and Electric Organs; Elsevier: Amsterdam, The Netherlands, 1971; pp. 135–205. ISBN 9780123504050. [Google Scholar]
  2. Vigoureux, P. Underwater sound. Proc. R. Soc. Lond. B Biol. Sci. 1960, 152, 49–51. [Google Scholar] [CrossRef] [PubMed]
  3. Klaus, M.; Geibrink, E.; Hotchkiss, E.R.; Karlsson, J. Listening to air–water gas exchange in running waters. Limnol. Oceanogr. Methods 2019, 17, 395–414. [Google Scholar] [CrossRef]
  4. Tonolla, D.; Lorang, M.S.; Heutschi, K.; Tockner, K. A flume experiment to examine underwater sound generation by flowing water. Aquat. Sci. 2009, 71, 449–462. [Google Scholar] [CrossRef]
  5. Thorne, P.D. An overview of underwater sound generated by interparticle collisions and its application to the measurements of coarse sediment bedload transport. Earth Surf. Dynam. 2014, 2, 531–543. [Google Scholar] [CrossRef]
  6. Tonolla, D.; Lorang, M.S.; Heutschi, K.; Gotschalk, C.C.; Tockner, K. Characterization of spatial heterogeneity in underwater soundscapes at the river segment scale. Limnol. Oceanogr. 2011, 56, 2319–2333. [Google Scholar] [CrossRef]
  7. Lumsdon, A.E.; Artamonov, I.; Bruno, M.C.; Righetti, M.; Tockner, K.; Tonolla, D.; Zarfl, C. Soundpeaking—Hydropeaking induced changes in river soundscapes. River Res. Appl. 2018, 34, 3–12. [Google Scholar] [CrossRef]
  8. Platt, C.; Popper, A.N.; Fay, R.R. The Ear as Part of the Octavolateralis System. In The Mechanosensory Lateral Line; Coombs, S., Görner, P., Münz, H., Eds.; Springer: New York, NY, USA, 1989; pp. 633–651. ISBN 978-1-4612-8157-3. [Google Scholar]
  9. Hawkins, A.D.; Popper, A.N. Directional hearing and sound source localization by fishes. J. Acoust. Soc. Am. 2018, 144, 3329. [Google Scholar] [CrossRef]
  10. Fay, R.R. The goldfish ear codes the axis of acoustic particle motion in three dimensions. Science 1984, 225, 951–954. [Google Scholar] [CrossRef]
  11. Popper, A.N.; Fay, R.R.; Platt, C.; Sand, O. Sound Detection Mechanisms and Capabilities of Teleost Fishes. In Sensory Processing in Aquatic Environments; Collin, S.P., Marshall, J.N., Eds.; Springer: New York, NY, USA, 2003; pp. 3–38. ISBN 978-0-387-95527-8. [Google Scholar]
  12. Fay, R.R. Analytic listening by the goldfish. Hear. Res. 1992, 59, 101–107. [Google Scholar] [CrossRef]
  13. Fay, R.R. Auditory stream segregation in goldfish (Carassius auratus). Hear. Res. 1998, 120, 69–76. [Google Scholar] [CrossRef]
  14. Popper, A.N.; Hawkins, A.D.; Sand, O.; Sisneros, J.A. Examining the hearing abilities of fishes. J. Acoust. Soc. Am. 2019, 146, 948. [Google Scholar] [CrossRef]
  15. Bird, N.C.; Hernandez, P.L. Morphological variation in the Weberian apparatus of Cypriniformes. J. Morphol. 2007, 268, 739–757. [Google Scholar] [CrossRef] [PubMed]
  16. Rogers, P.H.; Cox, M. Underwater Sound as a Biological Stimulus. In Sensory Biology of Aquatic Animals; Atema, J., Fay, R.R., Popper, A.N., Tavolga, W.N., Eds.; Springer: New York, NY, USA, 1988; pp. 131–149. ISBN 978-1-4612-8317-1. [Google Scholar]
  17. Jacobs, D.W.; Tavolga, W.N. Acoustic intensity limens in the goldfish. Anim. Behav. 1967, 15, 324–335. [Google Scholar] [CrossRef] [PubMed]
  18. Rüter, A. Die Anpassung der Hörschwelle von Einheimischen Fischarten an Ihre Hydroakustische Umwelt. Ph.D. Thesis, Rheinischen Friedrich-Wilhelms-Universität, Bonn, Germany, 2014. [Google Scholar]
  19. Hawkins, A.D.; Johnstone, A.D.F. The hearing of the Atlantic Salmon, Salmo salar. J. Fish Biol. 1978, 13, 655–673. [Google Scholar] [CrossRef]
  20. Harding, H. Measurement of Hearing in the Atlantic salmon (Salmo salar) using Auditory Evoked Potentials, and effects of Pile Driving Playback on salmon Behaviour and Physiology. Scott. Mar. Freshw. Sci. 2016, 7. [Google Scholar] [CrossRef]
  21. Johnson, M.F.; Rice, S.P. Animal perception in gravel-bed rivers: Scales of sensing and environmental controls on sensory information. Can. J. Fish. Aquat. Sci. 2014, 71, 945–957. [Google Scholar] [CrossRef]
  22. Melcher, A.; Hauer, C.; Zeiringer, B. Aquatic Habitat Modeling in Running Waters. In Riverine Ecosystem Management; Schmutz, S., Sendzimir, J., Eds.; Springer International Publishing: Cham, Switzerland, 2018; pp. 129–149. ISBN 978-3-319-73249-7. [Google Scholar]
  23. Tonolla, D.; Acuña, V.; Lorang, M.S.; Heutschi, K.; Tockner, K. A field-based investigation to examine underwater soundscapes of five common river habitats. Hydrol. Process. 2010, 24, 3146–3156. [Google Scholar] [CrossRef]
  24. Wohl, E.; Merritt, D.M. Reach-scale channel geometry of mountain streams. Geomorphology 2008, 93, 168–185. [Google Scholar] [CrossRef]
  25. Gaál, L.; Szolgay, J.; Kohnová, S.; Parajka, J.; Merz, R.; Viglione, A.; Blöschl, G. Flood timescales: Understanding the interplay of climate and catchment processes through comparative hydrology. Water Resour. Res. 2012, 48. [Google Scholar] [CrossRef]
  26. Rossi, T.; Nagelkerken, I.; Pistevos, J.C.A.; Connell, S.D. Lost at sea: Ocean acidification undermines larval fish orientation via altered hearing and marine soundscape modification. Biol. Lett. 2016, 12, 20150937. [Google Scholar] [CrossRef]
  27. Tolimieri, N.; Haine, O.; Montgomoery, J.C.; Jeffs, A. Ambient sound as a navigational cue for larval reef fish. Bioacoustics 2002, 12, 214–217. [Google Scholar] [CrossRef]
  28. Linke, S.; Gifford, T.; Desjonquères, C.; Tonolla, D.; Aubin, T.; Barclay, L.; Karaconstantis, C.; Kennard, M.J.; Rybak, F.; Sueur, J. Freshwater ecoacoustics as a tool for continuous ecosystem monitoring. Front. Ecol. Environ. 2018, 16, 231–238. [Google Scholar] [CrossRef]
  29. Amoser, S.; Ladich, F. Year-round variability of ambient noise in temperate freshwater habitats and its implications for fishes. Aquat. Sci. 2010, 72, 371–378. [Google Scholar] [CrossRef]
  30. Currie, H.A.L.; White, P.R.; Leighton, T.G.; Kemp, P.S. Collective behaviour of the European minnow (Phoxinus phoxinus) is influenced by signals of differing acoustic complexity. Behav. Process. 2021, 189, 104416. [Google Scholar] [CrossRef]
  31. Kacem, Z.; Rodríguez, M.A.; Roca, I.T.; Proulx, R. The riverscape meets the soundscape: Acoustic cues and habitat use by brook trout in a small stream. Can. J. Fish. Aquat. Sci. 2020, 77, 991–999. [Google Scholar] [CrossRef]
  32. Rocaspana, R.; Aparicio, E.; Palau-Ibars, A.; Guillem, R.; Alcaraz, C. Hydropeaking effects on movement patterns of brown trout (Salmo trutta L.). River Res. Applic. 2019, 35, 646–655. [Google Scholar] [CrossRef]
  33. Taylor, M.K.; Cooke, S.J. Meta-analyses of the effects of river flow on fish movement and activity. Environ. Rev. 2012, 20, 211–219. [Google Scholar] [CrossRef]
  34. Taylor, M.K.; Hasler, C.T.; Hinch, S.G.; Lewis, B.; Schmidt, D.C.; Cooke, S.J. Reach-scale movements of bull trout (Salvelinus confluentus) relative to hydropeaking operations in the Columbia River, Canada. Ecohydrology 2013, 7, 1079–1086. [Google Scholar] [CrossRef]
  35. Taylor, M.K.; Hasler, C.T.; Findlay, C.S.; Lewis, B.; Schmidt, D.C.; Hinch, S.G.; Cooke, S.J. Hydrologic Correlates of Bull Trout (Salvelinus confluentus) Swimming Activity in a Hydropeaking River. River Res. Appl. 2014, 30, 756–765. [Google Scholar] [CrossRef]
  36. Ladich, F. Ecology of sound communication in fishes. Fish Fish. 2019, 20, 552–563. [Google Scholar] [CrossRef]
  37. Popper, A.N.; Hawkins, A.D. An overview of fish bioacoustics and the impacts of anthropogenic sounds on fishes. J. Fish Biol. 2019, 94, 692–713. [Google Scholar] [CrossRef]
  38. Shafiei Sabet, S.; Wesdorp, K.; Campbell, J.; Snelderwaard, P.; Slabbekoorn, H. Behavioural responses to sound exposure in captivity by two fish species with different hearing ability. Anim. Behav. 2016, 116, 1–11. [Google Scholar] [CrossRef]
  39. Voellmy, I.K.; Purser, J.; Simpson, S.D.; Radford, A.N. Increased noise levels have different impacts on the anti-predator behaviour of two sympatric fish species. PLoS ONE 2014, 9, e102946. [Google Scholar] [CrossRef] [PubMed]
  40. Ladich, F.; Fay, R.R. Auditory evoked potential audiometry in fish. Rev. Fish Biol. Fish. 2013, 23, 317–364. [Google Scholar] [CrossRef] [PubMed]
  41. Provincial Government of Lower Austria. Station Number: 214262. 2021. Available online: https://www.noel.gv.at/wasserstand/#/de/Messstellen/Details/214262/Durchfluss/3Tage (accessed on 30 May 2022).
  42. Jackson, B.E.; Evangelista, D.J.; Ray, D.D.; Hedrick, T.L. 3D for the people: Multi-camera motion capture in the field with consumer-grade cameras and open source software. Biol. Open 2016, 5, 1334–1342. [Google Scholar] [CrossRef] [PubMed]
  43. Bradski, G. The OpenCV library. Version: 4.5.2. In Dr. Dobb’s Journal of Software Tools; UBM: San Francisco, CA, USA, 2000. [Google Scholar]
  44. R Core Team. R: A Language and Environment for Statistical Computing; R Foundation for Statistical Computing: Vienna, Austria, 2021; Available online: https://www.R-project.org/ (accessed on 20 October 2021).
  45. Maisog, J.M.; Wang, Y.; Luta, G.; Liu, J. Ptinpoly: Point-in-Polyhedron Test (2D and 3D). 2020. Available online: https://CRAN.R-project.org/package=ptinpoly (accessed on 31 October 2023).
  46. Hothorn, T.; Hornik, K.; van de Wiel, M.A.; Zeileis, A. A Lego System for Conditional Inference. Am. Stat. 2006, 60, 257–263. [Google Scholar] [CrossRef]
  47. Cramér, H. Mathematical Methods of Statistics; Princeton Mathematical Series; Princeton University Press: Princeton, NJ, USA, 1974; Volume 9. [Google Scholar]
  48. Canty, A.; Ripley, B.D. Boot: Bootstrap R (S-Plus) Functions, R Package Version 1.3-28; 2021. Available online: https://CRAN.R-project.org/package=boot (accessed on 15 November 2021).
  49. Davison, A.C.; Hinkley, D.V. Bootstrap Methods and Their Application; Cambridge Series on Statistical and Probabilistic Mathematics; Cambridge University Press: Cambridge, UK, 1997; Volume 1. [Google Scholar]
  50. Harrel, F.E.; Hmisc: Harrell Miscellaneous. R Package Version 4.6-0. 2021. Available online: https://CRAN.R-project.org/package=Hmisc (accessed on 15 November 2021).
  51. Martins, C.I.M.; Galhardo, L.; Noble, C.; Damsgård, B.; Spedicato, M.T.; Zupa, W.; Beauchaud, M.; Kulczykowska, E.; Massabuau, J.-C.; Carter, T.; et al. Behavioural indicators of welfare in farmed fish. Fish Physiol. Biochem. 2012, 38, 17–41. [Google Scholar] [CrossRef] [PubMed]
  52. Li, D.; Wang, G.; Du, L.; Zheng, Y.; Wang, Z. Recent advances in intelligent recognition methods for fish stress behavior. Aquac. Eng. 2022, 96, 102222. [Google Scholar] [CrossRef]
  53. Pieniazek, R.H.; Mickle, M.F.; Higgs, D.M. Comparative analysis of noise effects on wild and captive freshwater fish behaviour. Anim. Behav. 2020, 168, 129–135. [Google Scholar] [CrossRef]
  54. Smith, M.E.; Kane, A.S.; Popper, A.N. Noise-induced stress response and hearing loss in goldfish (Carassius auratus). J. Exp. Biol. 2004, 207, 427–435. [Google Scholar] [CrossRef]
  55. Greimel, F.; Schülting, L.; Graf, W.; Bondar-Kunze, E.; Auer, S.; Zeiringer, B.; Hauer, C. Hydropeaking Impacts and Mitigation. In Riverine Ecosystem Management; Schmutz, S., Sendzimir, J., Eds.; Springer International Publishing: Cham, Switzerland, 2018; pp. 91–110. ISBN 978-3-319-73249-7. [Google Scholar]
  56. Simpson, S.D.; Radford, A.N.; Nedelec, S.L.; Ferrari, M.C.O.; Chivers, D.P.; McCormick, M.I.; Meekan, M.G. Anthropogenic noise increases fish mortality by predation. Nat. Commun. 2016, 7, 10544. [Google Scholar] [CrossRef]
  57. Hanache, P.; Spataro, T.; Firmat, C.; Boyer, N.; Fonseca, P.; Médoc, V. Noise-induced reduction in the attack rate of a planktivorous freshwater fish revealed by functional response analysis. Freshw. Biol. 2020, 65, 75–85. [Google Scholar] [CrossRef]
  58. Auer, S.; Zeiringer, B.; Führer, S.; Tonolla, D.; Schmutz, S. Effects of river bank heterogeneity and time of day on drift and stranding of juvenile European grayling (Thymallus thymallus L.) caused by hydropeaking. Sci. Total Environ. 2017, 575, 1515–1521. [Google Scholar] [CrossRef]
  59. Wysocki, L.E.; Davidson, J.W.; Smith, M.E.; Frankel, A.S.; Ellison, W.T.; Mazik, P.M.; Popper, A.N.; Bebak, J. Effects of aquaculture production noise on hearing, growth, and disease resistance of rainbow trout Oncorhynchus mykiss. Aquaculture 2007, 272, 687–697. [Google Scholar] [CrossRef]
  60. Davidson, J.; Bebak, J.; Mazik, P. The effects of aquaculture production noise on the growth, condition factor, feed conversion, and survival of rainbow trout, Oncorhynchus mykiss. Aquaculture 2009, 288, 337–343. [Google Scholar] [CrossRef]
  61. Magurran, A.E.; Pitcher, T.J. Provenance, shoal size and the sociobiology of predator-evasion behaviour in minnow shoals. Proc. R. Soc. Lond. B 1987, 229, 439–465. [Google Scholar] [CrossRef]
  62. Schwartz, J.S.; Herricks, E.E. Fish use of stage-specific fluvial habitats as refuge patches during a flood in a low-gradient Illinois stream. Can. J. Fish. Aquat. Sci. 2005, 62, 1540–1552. [Google Scholar] [CrossRef]
  63. Popper, A.N.; Hawkins, A.D.; Sisneros, J.A. Fish hearing “specialization”—A re-evaluation. Hear. Res. 2022, 425, 108393. [Google Scholar] [CrossRef]
  64. Sadoul, B.; Geffroy, B. Measuring cortisol, the major stress hormone in fishes. J. Fish Biol. 2019, 94, 540–555. [Google Scholar] [CrossRef]
  65. EU. Directive of the European Parliament and of the Council of 22 September 2010 on the protection of animals used for scientific purposes. Off. J. Eur. Union 2010, 33–79. [Google Scholar]
  66. Kowal, J.L. Does Soundpeaking Affect the Behavior of Chub (Squalius cephalus) and Brown Trout (Salmo trutta)? Master’s Thesis, University of Natural Resources and Life Sciences, Vienna, Austria, 2022. [Google Scholar]
Figure 1. Top view of the experimental setup with the physical boundaries of the experimental area indicated by the red line and the flow direction indicated by blue arrows. Large (H) and small (h) halogen floodlights were installed upstream and downstream of the experimental area underneath the roof. The underwater speaker (Sp) was positioned approximately two meters upstream of the experimental area at a water depth of 0.5 m. The non-physical boundaries of the lateral transects (latd, latm, lats) are indicated by black dashed lines, while those of the longitudinal transects (lonu, lonn, lond) are indicated by white dashed lines. The six brown rectangular shapes represent bricks positioned at the bottom of the channel.
Fishes 08 00581 g001
Figure 2. Lateral profile of the experimental setup showing the position of the temperature and light intensity loggers as well as the position of the camera. Brown rectangular shapes represent the bricks positioned at the bottom of the channel.
Fishes 08 00581 g002
Figure 3. Visualization of the flood soundscape played during treatment trials. The frequency range has been limited according to the capacity of the utilized underwater speakers. Sound pressure levels (SPLs) have been amplified to match a mean value of 113.7 dB re: 1 µPa, the overall sound pressure level measured during the recording of the flood soundscape.
Fishes 08 00581 g003
Figure 4. (a) Traveled distance D in pixels and (b) number of movement direction changes o from individuals of the species chub (Squalius cephalus; left) and brown trout (Salmo trutta; right) during control and treatment trials. Data points outside 1.5 times the interquartile range (thin whiskers) are indicated by triangular shapes. Points of the same color within groups defined by species and trial type represent individuals from the same trial. Ordinary bootstrapped confidence intervals (see Section 2.3.2) are indicated by red whiskers. Statistical significance is indicated by an asterisk. Images reproduced with permission from Wolfgang Gessl, www.pisces.at (accessed on 20 February 2022); 2023.
Fishes 08 00581 g004
Figure 5. (a) Variance a v a r of acceleration (pixels) from individuals of the species chub (Squalius cephalus; left) and brown trout (Salmo trutta; right) during control and treatment trials. Data points outside 1.5 times the interquartile range (thin whiskers) are indicated by triangular shapes. Points of the same color within groups defined by species and trial type represent individuals from the same trial. (b) Aggregation A i of individuals from the species chub (Squalius cephalus) and brown trout (Salmo trutta). Data points outside 1.5 times the interquartile range (thin whiskers) are depicted in red; other values are depicted as black points. Ordinary bootstrapped confidence intervals (see Section 2.3.2) are indicated in both plots by red whiskers. Statistical significance is indicated by an asterisk. Images reproduced with permission from Wolfgang Gessl, www.pisces.at (accessed on 20 February 2022); 2023.
Fishes 08 00581 g005
Figure 6. Positions of individuals from the species chub (Squalius cephalus; left) and brown trout (Salmo trutta; right) during control and treatment trials. Points in the background represent observed locations (coordinates measured in pixels) of fish at different times during trials. A random subsample of the data is plotted to generate equal sample sizes across groups where n = 25,395 (observations from 15 individuals per group). Images reproduced with permission from Wolfgang Gessl, www.pisces.at (accessed on 20 February 2022); 2023.
Fishes 08 00581 g006
Figure 7. Time (%) spent within different lateral transects (latd, latm, lats) by individuals of the species chub (Squalius cephalus; left) and brown trout (Salmo trutta; right) during control and treatment trials. Data points outside 1.5 times the interquartile range (thin whiskers) are indicated by triangular shapes. Points of the same color within groups defined by species and trial type represent individuals from the same trial. Ordinary bootstrapped confidence intervals (see Section 2.3.2) are indicated by red whiskers. Images reproduced with permission from Wolfgang Gessl, www.pisces.at (accessed on 20 February 2022); 2023.
Fishes 08 00581 g007
Figure 8. Time (%) spent within different longitudinal transects (lonu, lonn, lond) by individuals of the species chub (Squalius cephalus; left) and brown trout (Salmo trutta; right) during control and treatment trials. Data points outside 1.5 times the interquartile range (thin whiskers) are indicated by triangular shapes. Points of the same color within groups defined by species and trial type represent individuals from the same trial. Ordinary bootstrapped confidence intervals (see Section 2.3.2) are indicated by red whiskers. Statistical significance is indicated by an asterisk. Images reproduced with permission from Wolfgang Gessl, www.pisces.at (accessed on 20 February 2022); 2023.
Fishes 08 00581 g008
Table 1. Arithmetic mean and standard deviation of the water temperature T (°C) and light intensity L (lm) measured by four temperature and light intensity loggers. Only the data included in the analysis was used. Additionally, the first row shows the arithmetic mean and standard deviation calculated from T ¯ i and L ¯ i .
T m e a n T s d L m e a n L s d
T ¯ i ; L ¯ i 16.41.0543.635.0
S116.41.0468.433.0
S216.41.0628.390.7
S316.31.0534.289.8
S416.70.912,078.810,615.5
Disclaimer/Publisher’s Note: The statements, opinions and data contained in all publications are solely those of the individual author(s) and contributor(s) and not of MDPI and/or the editor(s). MDPI and/or the editor(s) disclaim responsibility for any injury to people or property resulting from any ideas, methods, instructions or products referred to in the content.