Article

Identification of Novel Mutations in the Tyrosinase Gene (TYR) Associated with Pigmentation in Chinese Giant Salamanders (Andrias davidianus)

1
Shaanxi Key Laboratory for Animal Conservation, Shaanxi Institute of Zoology, Xi’an 710032, China
2
College of Life Sciences, Shaanxi Normal University, No. 620, West Chang’an Avenue, Chang’an District, Xi’an 710119, China
*
Author to whom correspondence should be addressed.
Fishes 2023, 8(3), 121; https://doi.org/10.3390/fishes8030121
Submission received: 13 January 2023 / Revised: 15 February 2023 / Accepted: 18 February 2023 / Published: 21 February 2023

Abstract

:
The Chinese giant salamander (Andrias davidianus), an endangered amphibian species endemic to China, has been previously evaluated with regards to its phyletic evolution, zooecology, and ethology, but molecular mechanisms underlying its skin pigmentation remain unknown. Herein, a skin transcriptome database of different colored salamanders was established using RNA-seq, and a total of 47,911 unigenes were functionally annotated. Among these unigenes, a total of 1252 differentially expressed genes (DEGs) were annotated in the seven public databases, and six DEGs were validated by qPCR between five different skin colors and eight tissues. The results showed that TYR, TYRP1, and ASIP were significantly differentially expressed between different body colors, while TYR, TYRP1, and DCT were highly expressed in skin tissue. The full-length complementary DNA of TYR was cloned and analyzed between normal and yellow phenotypes. Three nucleotide sequence deletion sites were identified in the coding region of TYR, leading to premature termination of transcription and translation in yellow individuals. Our study provides useful data for the further study of the molecular mechanisms of melanin formation, and a valuable reference for the breeding of specific skin colors in other salamanders.

1. Introduction

Body coloration is one of the most visible and variable phenotypic traits in vertebrates, and is key to the study of natural selection, genetic variation, and many fundamental physiological processes [1,2]. In vertebrates, coloring and color patterns are mainly determined by the type, number, and distribution of pigment cells. Unlike mammals, which only possess melanocytes, amphibian coloration is determined by three different types of pigment cells: melanophores (containing melanin), xanthophores (containing carotenoid and pteridine pigments), and iridophores (colorless but reflective), implying that their mechanism of body color formation is more complex and variable [3].
Genetic influence is a key factor affecting phenotypic traits in animals [4]. At present, over 125 loci have been identified that are involved in vertebrate pigment metabolism [5]. In humans and mammals, the molecular regulatory systems for melanin synthesis and transport are centered around melanocytes and are thought to be conserved across vertebrates. The main enzymes involved in melanin synthesis are tyrosinase (TYR), tyrosinase-related protein 1 (TYRP1), tyrosinase-related protein 2 (TYRP2, also named as DCT), and the melanocortin-1 receptor (MC1R). MC1R, the agouti signaling protein (Agouti, ASIP), and microphthalmia-associated transcription factor (MITF) are the main regulators of this process [6]. In terms of amphibians, EDN3 mutations and TYR nucleotide deletion have been identified in albino A. mexicanum individuals [7]. Furthermore, genetic MC1R mutations in O. rhodostigmatus (Megophryidae, Anura) tadpoles were found to coordinate pigment regression and robust melanogenesis in dark and light conditions, respectively [8]. In teleosts, other genes have also been confirmed to play a role in pigmentation, such as Kita, Sox10, Aim1, and SLCs [9]. However, candidate genes related to skin color pigmentation in the Chinese giant salamander (Andrias davidianus) have not yet been reported.
A. davidianus, a species of the Cryprorahida family, is the largest amphibian in the world, and is of great value in the study of genetic development, adaptive evolution, and biodiversity conservation [10,11]. Through evolution, it has developed a variety of body color phenotypes, and is an important species for studying the formation of body color polymorphisms and the molecular genetic mechanism of ectotherms. However, current research on body color formation mainly focuses on model organisms such as humans [12], mice [2,13], and zebrafish [14], but little is known about other species, especially urodela, and the molecular mechanisms behind their pigmentation remain unclear.
In this study, we utilized next-generation RNA sequencing to obtain molecular markers to assemble and annotate the skin transcriptome dataset of A. davidianus. Several DEGs involved in skin pigmentation were identified. Six candidate genes with significant differential expression were verified between ten tissues and five different body colors. Furthermore, as the key factor in the pigment metabolism pathway, we identified and sequenced the full-length TYR mRNA, and observed a correlation between frameshift mutations caused by three nucleotide deletions and abnormal body coloration in A. davidianus. This study identifies candidate genes related to A. davidianus skin pigmentation and potential molecular markers of adaptive evolution, and can act as a reference for the identification of the mechanisms underlying body coloration in other amphibians.

2. Materials and Methods

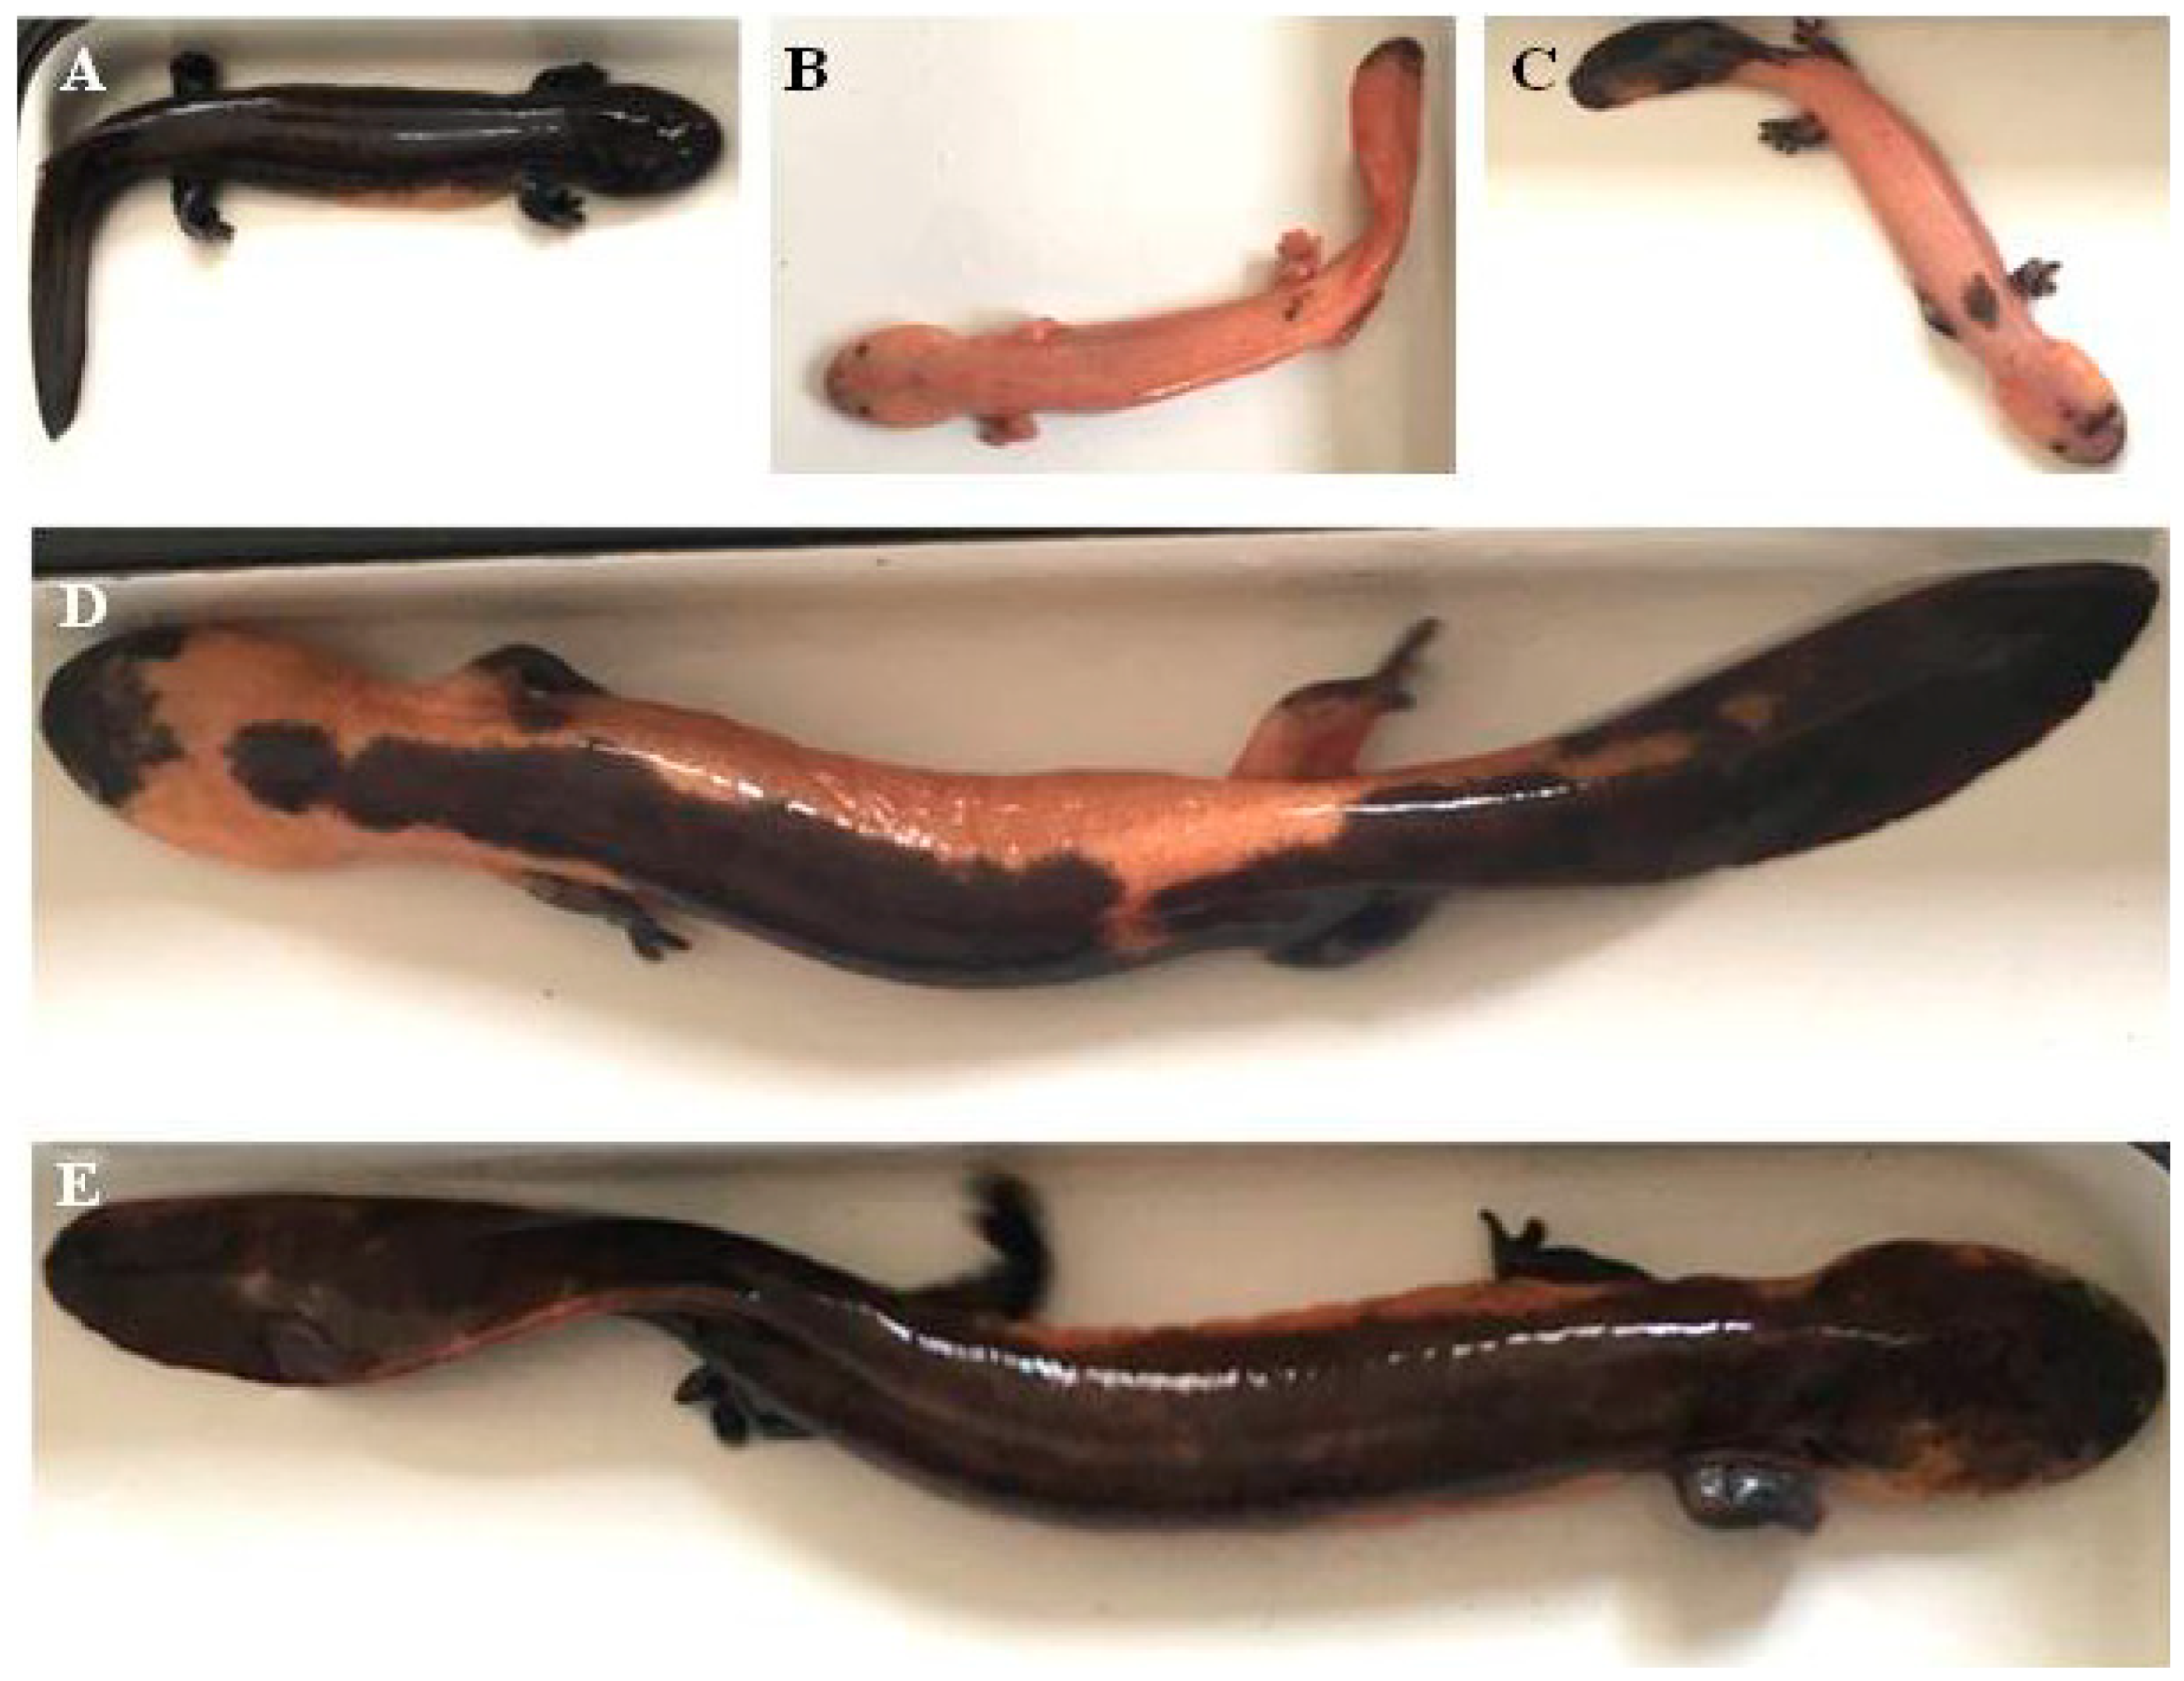
2.1. Animals and Sample Collection

All animals were obtained from Hanzhong Ancient Giant Salamander Co., Ltd. (wild animal utilization license (2015) No. 23), and the experiments were conducted according to the methods approved by the Animal Research and Ethics Committees of the Shaanxi Institute of Zoology, to minimize the suffering of animals.
The fifteen animals exhibited five body colors (Figure 1). Regular gray (wild-type phenotype, GY), entirely yellow (albino phenotype, YL), mainly yellow but with black spots (YB), and mainly black but with yellow spots (BY: 10% < yellow < 50%; BSY: yellow < 10%) specimens were selected, and skin tissue from the tail tips was collected from each. Eight tissues (muscle, skin, heart, liver, spleen, lung, stomach and intestine) were sampled from three healthy mature individuals belonging to the wild-type phenotype (two males and one female). All tissues were dissected after anesthetization using 0.01% MS-222 (Sigma, Burlington, MA, USA), and then frozen in liquid nitrogen before total RNA extraction.

2.2. Transcriptome Sequencing

Total RNA was extracted with TRizol reagent (Invitrogen, Waltham, MA, USA) according to the manufacturer’s instructions. RNA quality and completeness were examined using Nanodrop (Thermo Scientific, Waltham, MA, USA) and an Agilent 2100 Bioanalyzer (Agilent Technologies, Santa Clara, CA, USA). Only samples with RNA integrity number (RIN) > 8.0 were used for next generation sequencing (NGS). Oligo (dT) magnetic beads were used to concentrate the mRNA, which was ligated with random hexamers and used to generate first- and second-strand cDNA. The synthesized cDNA was subsequently purified, end-repaired, A-tailed, and ligated to sequencing adapters. Finally, the cDNA library was obtained via PCR amplification and purified with AMPure XP beads. The libraries were named T01 (GY skin libraries, pooled using three Gy phenotype individuals) and T02 (YL skin libraries, pooled using three YL phenotype individuals), and generated on an Illumina HISeq 2500 platform (Biomarker Technologies, Beijing, China) with paired-end reads at a length of 125 bp.

2.3. Quality Control and De Novo Assembly

Quality control of the raw reads was performed using FastQC software (http://www.bioinformatics.babraham.ac.uk, accessed on 15 March 2021). Reads with adapters, repeated sequences, missing nucleotides >10%, and/or of low quality (with over 50% the Q-values being ≤20% bases) were discarded. Transcriptome de novo assembly was conducted using Trinity the short read assembling program with default parameters [15]. The reads were combined and overlapped using a k-mer length of 25 to form longer fragments, which were termed contigs.

2.4. Gene Annotations

Functional annotation of unigenes was carried out by sequence comparison with seven public databases, including the NCBI non-redundant protein (Nr, e-value ≤ 10−5), Swiss-Prot (e-value ≤ 10−5), Clusters of Orthologous Groups (COG, e-value ≤ 10−5), Eukaryotic Orthologous Groups (KOG, e-value ≤ 10−5), and Protein Family (Pfam, e-value ≤ 0.01) databases. Gene Ontology (GO) functional classification was performed by Blast2GO v2.5 software (e-value < 10−6) [16] and the WEGO web tool [17] based on the Nr and Pfam annotations. Pathway assignments were conducted using the Kyoto Encyclopedia of Genes and Genomes databases (KEGG, e-value ≤ 10−10). For unigenes which failed to align to any of the databases, sequence directions and gene coding regions were predicted with ESTScan (3.0.3) software [18].

2.5. Differential Expression Analysis

DEGs in the skin were identified with the DESeq2 R package [19] between differently colored individuals. The resulting p-values were adjusted using the Benjamini–Hochberg method to limit the false discovery rate (FDR) to less than 0.01. Genes with an adjusted p-value < 0.01 and a fold change (FC) ≥ 2.0 were considered DEGs. The filtered DEGs were further subjected to GO enrichment, as well as COG and KEGG functional classification analysis.

2.6. Identification of Simple Sequence Repeats (SSRs) and Single Nucleotide Polymorphisms (SNPs)

Coding sequences (CDS) were predicted with TransDecoder software based on alignment with the length of the open reading frame (ORF), log-likelihood score, amino acid sequence, and protein domain. They were further predicted with Trinity and Cufflinks software.
Simple sequence repeats (SSRs) analysis was performed using microsatellite analysis (MISA, http://pgrc.ipk-gatersleben.de/misa/, accessed on 3 June 2021) among unigenes >1.0 kb in size. Six SSR types were identified: a minimum of six repeats for mononucleotides and di-nucleotides, and five repeats for tri-, tetra-, penta-, and hexa-nucleotides.
For each sample, alignment between the reads and unigenes was performed using STAR software [20] and, subsequently, GATK software [21] for single nucleotide polymorphisms (SNPs) using the calling approach. Consecutive single bases mismatched within a range of 35 bp < 3 with a SNP quality value of >2.0 after deep sequence standardization were used as criteria to identify SNPs.

2.7. Validation of DEGs Using qPCR

Six candidate genes involved in pigmentation were selected and identified by qPCR which was carried out by SYBR Green method using the LineGene 9600 System (Bioer Technology, Hangzhou, China) as follows: one cycle of 94 °C for 1 min, 40 cycles of 94 °C for 18 s, 62 °C for 18 s, and 72 °C for 20 s, and finally, 85 °C to generate a melting curve. GADPH was used as an internal control and no template was used as a negative control. The primers were designed by Primer Quest (http://sg.idtdna.com/Primerquest/Home/IndexPrimer, accessed on 20 October 2021), and are listed in Table 1. All assays were performed in triplicate for error reduction.

2.8. TYR Gene Cloning and Sequencing

Following the manufacturer’s protocol, approximately 1–3 ug total RNA from skin tissues was reverse transcribed using a RevertAid cDNA Synthesize Kit (Fermentas). Detailed primer information is listed in Table 1. The reaction was carried out under the following conditions: pre-denaturation for 5 min at 94 °C; 35 cycles of 30 s at 94 °C, 90 s at 52 °C and 120 s at 72 °C; and a final extension for 10 min at 72 °C. All amplified PCR products were isolated from 1.5% agarose gels using a AxyPrep Gel Extraction Kit (Axygen, Gelendale, AZ, USA), and cloned into the T & A cloning vector (Invitrogen). Cloned DNAs were transfected into competent DH5α cells (Invitrogen), and plasmids were identified by restriction enzyme digestion and sequenced at a commercial facility.

2.9. Gene Mutation Analysis

The sequence structure of the TYR gene was analyzed using ORF Finder (http://www.ncbi.nlm.nih.gov/orffinder, accessed on 23 January 2022), while the secondary structural composition of the TYR protein was predicted (https://www.novopro.cn/tools/secondary-structure-prediction.html, accessed on 10 February 2022). The similarity of TYR amino acid sequences between different species was assessed using the clustal W module of MEGA 7.0, and phylogenetic trees were constructed using the neighbor-joining method.

2.10. Statistical Analysis

The relative expression ratio of candidate genes was calculated by the 2−∆∆ct method [22]. GraphPad Prism 8.0 was used to generate graphics and perform significant difference analyses, with a p-value < 0.05 considered as significant. All results are represented as mean values ± standard error (mean ± SEM), and were analyzed using one-way analysis of variance (ANOVA) and Tukey’s post tests.

3. Results

3.1. Sequencing Characterization and De Novo Assembly

After quality assessment and data filtering, the cDNA library of different individual skin colors generated 52,980,934 clean reads, resulting in a final 13.33 Gb transcriptome sequence. All the Q30 scores of the clean data were above 91% for each sample. In addition, the average GC content was 50.36%, with no samples containing overly high (>80%) or low (<20%) GC contents, suggesting that the de novo sequencing was of high quality (Table S1).
Using the clean reads, the Trinity Program produced 212,454 transcripts with an average length of 852 bp and N50 length of 1728 bp, and assembled 149,114 unigenes with a mean length of 655 bp and N50 size of 1111 bp (Table S2). Among these unigenes, the sequence lengths ranged from 200 bp to over 2000 bp. 64,110 unigenes (42.99%) were no longer than 300 bp, 62,473 (41.89%) were in the range of 401 to 1000 bp, and 22,531 (15.11%) were longer than 1000 bp (Figure 2). Finally, alignment was performed between the sequencing data and assembled reads, and over 77% of the reads were found to correspond, which could be used for further analysis (Table S3).

3.2. Functional Annotation

Functional annotation revealed that 8814 (18.4%), 10,716 (22.37%), 12,892 (26.91%), 22,430 (46.82%), 22,005 (45.93%), 20,490 (42.77%), and 46,597 (97.26%) unigenes were significantly matched to the COG, GO, KEGG, KOG, Pfam, Swiss-Prot, and NR databases, respectively, for a total of 47,911 unigenes. As a result, 16,084 (33.57%) unigenes with lengths over 1000 bp had BLAST matches (Table S4). Unigenes successfully assigned to GO database were classified into 64 subcategories of three main ontologies based on their putative functions: cellular components (37.15%), molecular functions (17.94%), and biological processes (44.91%) (Figure 3).

3.3. DEGs Analysis

Based on the gene expression statistical analysis, a total of 1679 DEGs were identified, of which 375 unigenes of GY skin were upregulated and 1304 were downregulated. Volcano (Figure 4A) and MA (Figure 4B) plots were drawn to reveal the differences in expression levels and statistically significant differences between the two sample groups. The most significant log2FC of the downregulated unigenes was −5.1991, compared to 4.5869 in the upregulated unigenes (Table S5).
Additionally, for annotation and validation, all DEGs were subjected to analysis using seven public databases, including COG, GO, KEGG, Pfam, Swiss-Prot, KOG, and NR, and a total of 1252 DEGs were annotated (Table S6). GO analysis showed that there was a significant difference between DEGs and other unigenes in receptor regulatory activity, cell aggregation, and hormone secretion, suggesting that the variation may be attributed to a skin-specific function of A. davidianus (Figure 3). DEGs in the COG analysis were concentrated in cytoskeleton, signal transduction mechanisms and replication, recombination, and repair (Figure 5). In the KEGG enrichment analysis, most DEGs were classified into the following pathways: focal adhesion, ECM–receptor interaction, and tight junction (Figure 6 and Table 2).

3.4. Identification of SNP and SSR Markers

Using the MISA Perl script, a total of 8638 unigenes, containing 13,131 SSRs, were identified (from the 22,531 unigenes longer than 1 kb), with 2966 containing more than one SSR. The most abundant repeat types were mononucleotide (10,844, 82.58%) and di-nucleotide (1528, 11.64%), followed by tri-nucleotide (679, 5.17%) and tetra-nucleotide (78, 0.59%) (Table 3). Furthermore, by mapping against 149,114 unigenes, a total of 133,892 potential SNPs were identified, of which 54,703 were homozygous and 79,189 were heterozygous (Table S7). The SNP loci distribution density on unigenes was also calculated and analyzed (Figure 7).

3.5. Validation of Candidate Gene Expression Results

Many genes with crucial roles in the transcription of melanin forming proteins, biogenesis, and melanosome transport, such as MC1R, TYR, TYRP1, and ASIP, were identified in this study. Meanwhile, genes in the solute carrier (SLC) family and others involved in determining pigment cell type, including SLC40A1, SLC25A4, Sox10, Kit, and KITLG, were also found in the A. davidianus transcriptome.
To investigate the tissue expression patterns between different skin color phenotypes, based on the principle of |FPKM value in GY–FPKM value in YL| ≥ 3, the transcript length was nearly the CDS, and all of the genes’ Ct values were ≤35, six candidate genes involved in pigmentation, TYR, TYRP1, ASIP, DCT, MC1R, and MITF, were selected for qPCR validation. The results showed that all the genes were expressed in the eight detected tissues. TYR, TYRP1, and DCT were most highly expressed in wild-type skin tissues (Figure 8A). Skin expression level comparisons between GY (wild type) and YL mutants found that TYR, TYRP1, and ASIP were significantly different between the two phenotype (Figure 8B).

3.6. Identification of TYR Sequence and Mutations

The estimated TYR coding sequence is 1651 bp in length, and encodes the 534 amino acid TYR protein (Figure 9). The TYR amino acid sequence was most similar to that of Cynops pyrrhogaster (GeneBank No.: LC062599.1), with an identity correspondence of 98%. Phylogenetic analysis was performed to study the evolutionary relationships of TYR among other vertebrates, based on sequences reported in the GenBank database (Figure 10). These results are consistent with the multiple alignment by CLUSTAL W. According to phenotypic differences, the five skin colors can be divided into three groups: wild phenotype (GY), intermediate phenotype (YB, BY and BSY) and albino phenotype (YL). The TYR gene sequences from each group individuals were aligned and analyzed. Interestingly, the nucleotide sequence of TYR was basically consistent in each group, but three nucleotide sequence deletion sites (+715, +969, +984) were found in the coding region of TYR, leading to premature termination of transcription and translation in YL individuals specifically (Figure 11). These premature deletion sites produced a truncated TYR protein with only 238 amino acids, and have not been previously described in other species.

4. Discussion

In recent years, RNA-Seq has become an advantageous gene discovery tool for high-throughput sequencing on a genome-wide scale in non-model organisms, with advantages such as lower costs, increased information capacity, higher sensitivity, and easier detection. A. davidianus transcriptome analysis studies identifying immune-, sex-, and reproduction-related genes or genetic markers have been reported previously [23,24,25]. These studies provide an abundance of expressed sequences and reliable methodologies, which will be valuable for further gene identification studies of A. davidianus. In this study, approximately 13.33 Gb of clean data were generated and 47,911 unigenes were annotated. Subsequent differential analysis resulted in a total of 1679 DEGs that met the |log2(FC)| > 2 and p < 0.01 conditions, including 375 upregulated and 1304 downregulated DEGs. Interestingly, we found that most of the DEGs, like TYR, ASIP, and TYRP1 were concentrated in the melanin metabolism pathway, which is different from the mechanisms of body coloration in fish and other species that also possess multiple pigment cell types. This indicated that the body color pigmentation of A. davidianus may be mainly controlled by the melanin metabolism pathway, which is more viable in higher animals and also consistent with its evolutionary status as a transitional species.
The mechanisms of melanogenesis are complex, and at least four signaling pathways have been found to be involved in this process [5]. Among them, the α-melanocyte-stimulating hormone (α-MSH) regulation pathway has been the most studied. In mammals, MC1R binds to α-MSH, activates TYR, subsequently stimulates TYRP1 and TYRP2 genes (both members of TYR’s tyrosinase family), and activates to promote eumelanin production. ASIP, as the ligand of MC1R, can competitively bind to MC1R and inhibit the activation of TYR, thus preventing eumelanin formation and promoting pheomelanin synthesis and storage. In addition, the pheomelanin synthesis cascade can also be activated when TYR expression decreases [6,26]. Hence, during melanogenesis, some genes, like MC1R or TYR, perform a ‘switching’ function that determines whether eumelanin or pheomelanin will be synthesized. However, even though MC1R has been found to correlate with melanism in mammals, surprisingly few correlations have been found between this gene and color variation in amphibians and fish. In the present study, MC1R was also not found to be differentially expressed between GY and YL individuals, consistent with results in R. temporaria [27], Triplophysa siluroides [9], and midas cichlids [28]. Unlike that of MC1R, in this study, TYR expression was significantly different between the GY and YL phenotypes. The TYR gene, encoding tyrosinase, is a key factor in pigment synthesis that catalyzes the conversion of tyrosine to highly polymerized melanin. In vertebrates, many studies have shown significant downregulation of TYR in white skin samples compared with black samples, indicating that differences in TYR expression are strongly associated with albinism [29,30,31]. These results imply that although the regulation of body color in A. davidianus is similar to that of mammals, and is mainly via melanin metabolism, there may be differences in the key genes regulating melanin synthesis. Thus, the genetic basis for color variation in natural populations of amphibians requires further exploration.
To further study the relationships between TYR gene variants and color patterns, a full-length 1651 bp TYR gene in the ORF of A. davidianus was cloned and sequenced. Alignment of the amino acid sequences reveled that TYR encodes 534 amino acids and consists of an epidermal growth factor (EGF)-like (89–112 aa) domain and a tyrosinase (171–408 aa) domain. Multiple alignment revealed that these functional domains were conserved between species. However, there is a transmembrane domain elimination in A. davidianus TYR, similar to that of Macaca fascicularis [32], indicating that the quantity and distribution of TYR functional domains vary among species.
Changes in TYR, including missense mutations, frameshift mutations, deletion mutations, and overexpression, can affect enzyme activity, cause abnormal melanin metabolism, and eventually lead to variations in body color. Previous studies demonstrated that TYR mutations lead to oculocutaneous albinism type 1 (OCA1) [33,34]. More than 200 mutations in the human TYR gene have been associated with various types of albinism, among which missense mutations in exon 4 and mutations in the copper ion binding region lead to reduced melanin levels in the skin, hair, and eyes [31]. The targeted destruction of TYR in white crucian carp leads to reduced melanin deposition [35]. Conversely, in human HEK293 cells, overexpression of a single TYR gene can induce significant pigmentation in amelanotic cells, suggesting that tyrosinase-related genes are also regulated by melanin synthesis [36]. Among amphibians, TYR gene knockout can cause varying degrees of albinism in Xenopus laevis, salamanders, and costal newts [37,38,39]. In addition, previous researchers found that by introducing a stop codon in the first exon of TYR gene, the F0 generation can also exhibit albinism after protein functional loss [40]. This is very similar to the findings of this study, in which frameshift mutations were caused by three nucleotide deletions leading to premature termination of transcription and abnormal body color phenotypes. However, the transcriptional fragments that end prematurely in yellow individuals might not be functional. Further studies are needed to investigate the exact physiological role of these transcripts. Additionally, if the mutation of the TYR protein causes the albino phenotype, it is not necessary to downregulate the expression of the TYR gene. However, in this study, much lower expression of the TYR gene was shown in YL. Thus, some other factors, such as the feedback regulation of other genes related to melanogenesis (TYRP1, Dct, ASIP and MC1R, etc.) after deletion, as well as the epigenetic modification and the regulation of other transcription factors, could affect expression of this gene and need to be further studied. Overall, our results provide valuable information for understanding the mechanisms underlying gene involvement in amphibian pigmentation and new strategies for the conservation of species diversity and marker-based artificial breeding.

5. Conclusions

We reported on transcriptome sequencing for A. davidianus using wild-type and mutant skin pigmentation specimens. Six DEGs were identified, and TYR, TYRP1, Dct and ASIP, the key genes involved in melanogenesis, were found to be significantly differentially expressed, indicating their crucial roles in pigment synthesis. In addition, a 1651 bp segment of the TYR coding region was cloned and sequenced, and three nucleotide sequence deletion mutations were detected, which resulted in frameshifts causing premature termination in the mutant phenotype. Our study lays the foundation for the genomic sequencing of A. davidianus, and provides an interesting insight into the molecular mechanisms of skin pigmentation in A. davidianus and other amphibians.

Supplementary Materials

The following supporting information can be downloaded at: https://www.mdpi.com/article/10.3390/fishes8030121/s1, Table S1. Sequencing data statistics; Table S2. Statistical data of assembly results; Table S3 Comparison between sequencing data and assembly results; Table S4. Statistical data of unigene annotation; Table S5. Statistical data of gene expression; Table S6. Statistics of annotated differentially expressed genes; Table S7. Quantitative statistics of SNP loci.

Author Contributions

Conceptualization, J.D.; methodology, J.D.; software, J.D. and J.L.; validation, J.D. and W.J.; formal analysis, J.D. and H.M.; investigation, J.D. and M.H.; resources, H.Z. (Hu Zhao); data curation, J.D. and W.J.; writing—original draft preparation, J.D.; writing—review and editing, W.J. and J.L.; visualization, M.H. and H.Z. (Han Zhang); supervision, H.Z. (Hongxing Zhang) and W.J.; project administration, W.J.; funding acquisition, J.D. and W.J. All authors have read and agreed to the published version of the manuscript.

Funding

This work was supported by Foundation of Shaanxi Academy of Sciences of China (grant No. 2014k-19; No. 2017k-17; grant No. 2021k-19).

Institutional Review Board Statement

The animal study protocol was approved by the Animal Ethics Committee of the Shaanxi Institute of Zoology (protocol code: L22D005A51, date of approval: 18 July 2022) for studies involving animals.

Data Availability Statement

The data presented in this study are available on request from the corresponding author.

Acknowledgments

Our sincere thanks go to Qijun Wang and Fei Kong for the help in animal sample collections and experiments.

Conflicts of Interest

The authors declare no conflict of interest.

References

  1. Cuthill, I.C.; Allen, W.L.; Arbuckle, K.; Caspers, B.; Chaplin, G.; Hauber, M.E.; Hill, G.E.; Jablonski, N.G.; Jiggins, C.D.; Kelber, A.; et al. The biology of color. Science 2017, 357. [Google Scholar] [CrossRef] [Green Version]
  2. Caro, T.; Mallarino, R. Coloration in Mammals. Trends Ecol. Evol. 2020, 35, 357–366. [Google Scholar] [CrossRef]
  3. FrostMason, S.K.; Mason, K.A. What insights into vertebrate pigmentation has the axolotl model system provided? Int J Dev Biol 1996, 40, 685–693. [Google Scholar]
  4. Hubbard, J.K.; Uy, J.A.; Hauber, M.E.; Hoekstra, H.E.; Safran, R.J. Vertebrate pigmentation: From underlying genes to adaptive function. Trends Genet. TIG 2010, 26, 231–239. [Google Scholar] [CrossRef]
  5. D’Mello, S.A.; Finlay, G.J.; Baguley, B.C.; Askarian-Amiri, M.E. Signaling Pathways in Melanogenesis. Int. J. Mol. Sci. 2016, 17, 1144. [Google Scholar] [CrossRef] [Green Version]
  6. Lin, J.Y.; Fisher, D.E. Melanocyte biology and skin pigmentation. Nature 2007, 445, 843–850. [Google Scholar] [CrossRef]
  7. Woodcock, M.R.; Vaughn-Wolfe, J.; Elias, A.; Kump, D.K.; Kendall, K.D.; Timoshevskaya, N.; Timoshevskiy, V.; Perry, D.W.; Smith, J.J.; Spiewak, J.E.; et al. Identification of Mutant Genes and Introgressed Tiger Salamander DNA in the Laboratory Axolotl, Ambystoma mexicanum. Sci. Rep. 2017, 7, 6. [Google Scholar] [CrossRef] [Green Version]
  8. Zhu, W.; Liu, L.; Wang, X.; Gao, X.; Jiang, J.; Wang, B. Transcriptomics reveals the molecular processes of light-induced rapid darkening of the non-obligate cave dweller Oreolalax rhodostigmatus (Megophryidae, Anura) and their genetic basis of pigmentation strategy. BMC Genom. 2018, 19, 422. [Google Scholar] [CrossRef] [Green Version]
  9. Chen, Y.; Gong, Q.; Lai, J.; Song, M.; Liu, Y.; Wu, Y.; Ai, J.; Long, Z. Transcriptome analysis identifies candidate genes associated with skin color variation in Triplophysa siluroides. Comp. Biochem. Physiol. Part D Genom. Proteom. 2020, 35, 100682. [Google Scholar] [CrossRef]
  10. Lu, C.; Chai, J.; Murphy, R.W.; Che, J. Giant salamanders: Farmed yet endangered. Science 2020, 367, 989. [Google Scholar] [CrossRef]
  11. Yan, F.; Lu, J.; Zhang, B.; Yuan, Z.; Zhao, H.; Huang, S.; Wei, G.; Mi, X.; Zou, D.; Xu, W.; et al. The Chinese giant salamander exemplifies the hidden extinction of cryptic species. Curr. Biol. CB 2018, 28, R590–R592. [Google Scholar] [CrossRef] [Green Version]
  12. Suarez, P.; Baumer, K.; Hall, D. Further insight into the global variability of the OCA2-HERC2 locus for human pigmentation from multiallelic markers. Sci. Rep. 2021, 11, 22530. [Google Scholar] [CrossRef]
  13. Andrade, P.; Carneiro, M. Pterin-based pigmentation in animals. Biol. Lett. 2021, 17, 20210221. [Google Scholar] [CrossRef]
  14. Singh, A.P.; Frohnhofer, H.G.; Irion, U.; Nusslein-Volhard, C. Fish pigmentation. Response to Comment on "Local reorganization of xanthophores fine-tunes and colors the striped pattern of zebrafish". Science 2015, 348, 297. [Google Scholar] [CrossRef] [Green Version]
  15. Garber, M.; Grabherr, M.G.; Guttman, M.; Trapnell, C. Computational methods for transcriptome annotation and quantification using RNA-seq. Nat Methods 2011, 8, 469–477. [Google Scholar] [CrossRef] [Green Version]
  16. Gotz, S.; Garcia-Gomez, J.M.; Terol, J.; Williams, T.D.; Nagaraj, S.H.; Nueda, M.J.; Robles, M.; Talon, M.; Dopazo, J.; Conesa, A. High-throughput functional annotation and data mining with the Blast2GO suite. Nucleic Acids Res. 2008, 36, 3420–3435. [Google Scholar] [CrossRef]
  17. Ye, J.; Fang, L.; Zheng, H.; Zhang, Y.; Chen, J.; Zhang, Z.; Wang, J.; Li, S.; Li, R.; Bolund, L.; et al. WEGO: A web tool for plotting GO annotations. Nucleic Acids Res. 2006, 34, W293–W297. [Google Scholar] [CrossRef]
  18. Iseli, C.; Jongeneel, C.V.; Bucher, P. ESTScan: A program for detecting, evaluating, and reconstructing potential coding regions in EST sequences. Proc. Int. Conf. Intell. Syst. Mol. Biol. 1999, 99, 138–148. [Google Scholar]
  19. Love, M.I.; Huber, W.; Anders, S. Moderated estimation of fold change and dispersion for RNA-seq data with DESeq2. Genome Biol. 2014, 15, 550. [Google Scholar] [CrossRef] [Green Version]
  20. Dobin, A.; Davis, C.A.; Schlesinger, F.; Drenkow, J.; Zaleski, C.; Jha, S.; Batut, P.; Chaisson, M.; Gingeras, T.R. STAR: Ultrafast universal RNA-seq aligner. Bioinformatics 2013, 29, 15–21. [Google Scholar] [CrossRef]
  21. McKenna, A.; Hanna, M.; Banks, E.; Sivachenko, A.; Cibulskis, K.; Kernytsky, A.; Garimella, K.; Altshuler, D.; Gabriel, S.; Daly, M.; et al. The Genome Analysis Toolkit: A MapReduce framework for analyzing next-generation DNA sequencing data. Genome Res. 2010, 20, 1297–1303. [Google Scholar] [CrossRef] [Green Version]
  22. Livak, K.J.; Schmittgen, T.D. Analysis of relative gene expression data using real-time quantitative PCR and the 2(-Delta Delta C(T)) Method. Methods 2001, 25, 402–408. [Google Scholar] [CrossRef]
  23. Bai, Y.; Meng, Y.; Luo, J.; Wang, H.; Li, G.; Li, C. Full-length transcriptome assembly of Andrias davidianus (amphibia: Caudata) skin via hybrid sequencing. Biosci. Rep. 2021, 41. [Google Scholar] [CrossRef]
  24. Hu, Q.; Tian, H.; Li, W.; Meng, Y.; Wang, Q.; Xiao, H. Identification of critical sex-biased genes in Andrias davidianus by de novo transcriptome. Mol. Genet. Genom. MGG 2019, 294, 287–299. [Google Scholar] [CrossRef]
  25. Hu, Q.; Wang, Q.; Meng, Y.; Tian, H.; Xiao, H. Comparative transcriptome reveal the potential adaptive evolutionary genes in Andrias davidianus. Hereditas 2018, 155, 18. [Google Scholar] [CrossRef] [PubMed] [Green Version]
  26. Rzepka, Z.; Buszman, E.; Beberok, A.; Wrzesniok, D. From tyrosine to melanin: Signaling pathways and factors regulating melanogenesis. Postepy Higieny i Medycyny Doswiadczalnej 2016, 70, 695–708. [Google Scholar] [CrossRef] [PubMed]
  27. Herczeg, G.; Matsuba, C.; Merila, J. Sequence variation in the melanocortin-1 receptor gene (Mc1r) does not explain variation in the degree of melanism in a widespread amphibian. Ann. Zool. Fenn. 2010, 47, 37–45. [Google Scholar] [CrossRef]
  28. Henning, F.; Renz, A.J.; Fukamachi, S.; Meyer, A. Genetic, comparative genomic, and expression analyses of the Mc1r locus in the polychromatic Midas cichlid fish (Teleostei, Cichlidae Amphilophus sp.) species group. J. Mol. Evol. 2010, 70, 405–412. [Google Scholar] [CrossRef] [PubMed] [Green Version]
  29. Michaud, V.; Lasseaux, E.; Green, D.J.; Gerrard, D.T.; Plaisant, C.; Eye, U.K.B.; Vision, C.; Fitzgerald, T.; Birney, E.; Arveiler, B.; et al. The contribution of common regulatory and protein-coding TYR variants to the genetic architecture of albinism. Nat. Commun. 2022, 13, 3939. [Google Scholar] [CrossRef] [PubMed]
  30. Seruggia, D.; Josa, S.; Fernandez, A.; Montoliu, L. The structure and function of the mouse tyrosinase locus. Pigment. Cell Melanoma Res. 2021, 34, 212–221. [Google Scholar] [CrossRef]
  31. Pavan, W.J.; Sturm, R.A. The Genetics of Human Skin and Hair Pigmentation. Annu. Rev. Genom. Hum. Genet. 2019, 20, 41–72. [Google Scholar] [CrossRef] [PubMed]
  32. Kim, Y.H.; Park, S.J.; Choe, S.H.; Lee, J.R.; Cho, H.M.; Kim, S.U.; Kim, J.S.; Sim, B.W.; Song, B.S.; Lee, Y.; et al. Identification and characterization of the tyrosinase gene (TYR) and its transcript variants (TYR_1 and TYR_2) in the crab-eating macaque (Macaca fascicularis). Gene 2017, 630, 21–27. [Google Scholar] [CrossRef] [PubMed]
  33. Kamaraj, B.; Purohit, R. Mutational Analysis of Oculocutaneous Albinism: A Compact Review. BioMed Res. Int. 2014, 2014. [Google Scholar] [CrossRef] [PubMed] [Green Version]
  34. Kalahroudi, V.G.; Kamalidehghan, B.; Kani, A.A.; Aryani, O.; Tondar, M.; Ahmadipour, F.; Chung, L.Y.; Houshmand, M. Two Novel Tyrosinase (TYR) Gene Mutations with Pathogenic Impact on Oculocutaneous Albinism Type 1 (OCA1). PLoS ONE 2014, 9. [Google Scholar] [CrossRef] [Green Version]
  35. Liu, Q.; Qi, Y.; Liang, Q.; Song, J.; Liu, J.; Li, W.; Shu, Y.; Tao, M.; Zhang, C.; Qin, Q.; et al. Targeted disruption of tyrosinase causes melanin reduction in Carassius auratus cuvieri and its hybrid progeny. Sci. China Life Sci. 2019, 62, 1194–1202. [Google Scholar] [CrossRef]
  36. Cho, I.H.; Lu, Z.R.; Yu, J.R.; Park, Y.D.; Yang, J.M.; Hahn, M.J.; Zou, F. Towards profiling the gene expression of tyrosinase-induced melanogenesis in HEK293 cells: A functional DNA chip microarray and interactomics studies. J. Biomol. Struct. Dyn. 2009, 27, 331–346. [Google Scholar] [CrossRef]
  37. Nakajima, K.; Nakajima, T.; Yaoita, Y. Generation of Albino Cynops pyrrhogaster by Genomic Editing of the tyrosinase Gene. Zool. Sci. 2016, 33, 290–294. [Google Scholar] [CrossRef] [Green Version]
  38. Nakajima, K.; Yaoita, Y. Highly efficient gene knockout by injection of TALEN mRNAs into oocytes and host transfer in Xenopus laevis. Biol. Open 2015, 4, 180–185. [Google Scholar] [CrossRef] [Green Version]
  39. Ishibashi, S.; Cliffe, R.; Amaya, E. Highly efficient bi-allelic mutation rates using TALENs in Xenopus tropicalis. Biol. Open 2012, 1, 1273–1276. [Google Scholar] [CrossRef] [Green Version]
  40. Cai, H.; Peng, Z.; Ren, R.; Wang, H. Efficient Gene Disruption via Base Editing Induced Stop in Newt Pleurodeles waltl. Genes 2019, 10, 837. [Google Scholar] [CrossRef] [Green Version]
Figure 1. Five different body colors. Full-length range: 12–17 cm; Body weight range: 25–31 g. (A) regular gray (wild-type phenotype, GY); (B) whole yellow (albino phenotype, YL); (C) main yellow but black spot (YB); (D) main black but yellow spot, BY: 10% < yellow < 50%; (E) main black but yellow spot, BSY: yellow < 10%.
Fishes 08 00121 g001
Figure 2. Length distribution map of unigene. The x-axis represents the different length intervals of unigene; The y-axis represents the number of unigene in a certain length interval.
Fishes 08 00121 g002
Figure 3. GO annotation of DEGs in the skin color of YL and GY of A. davidianus. The horizontal coordinate is the secondary node under three GO categories. The ordinate represents the number of genes annotated to this node and their percentage in the total number of genes. The red column represents the annotation of all genes, and the blue column represents the annotation of differentially expressed genes.
Fishes 08 00121 g003
Figure 4. Analysis of differentially expressed genes in YL and GY skin color of A. davidianus. (A) Volcano plot; the x-axis represents the logarithm value of the multiple difference of expression amount of a certain gene in two samples. The larger the absolute value, the larger the multiple difference of expression amount between two samples. The y-axis represents the negative pair value of the error discovery rate. The larger the value, the more significant the differential expression. (B) MA plot; the horizontal coordinate is the value A: log2(FPKM), which is the logarithm value of the mean values of the two samples. The ordinate is the M value: log2(FC), that is, the logarithmic value of the multiple difference of gene expression between two samples. Each point in the volcano plot map represents a gene, and the y-axis represents the logarithm of the multiple difference of expression amount of a certain gene in two samples. The green dots represent genes with significant expression differences and the red dots represent genes with no significant expression differences.
Fishes 08 00121 g004
Figure 5. COG function classification of differentially expressed genes in YL and GY skin color of A. davidianus. The horizontal coordinate is the classification content of COG, and the ordinate is the number of genes. In different functional categories, the proportion of genes reflects metabolic or physiological preferences in the corresponding period and environment, which can be explained scientifically based on the distribution of research objects in each functional category.
Fishes 08 00121 g005
Figure 6. KEGG function classification of differentially expressed genes in YL and GY skin color of A. davidianus. The ordinate is the name of KEGG metabolic pathway, and the horizontal coordinate is the number of genes annotated to the pathway and their proportion to the total number of annotated genes.
Fishes 08 00121 g006
Figure 7. Density distribution map of SNP loci in YL and GY skin color of A. davidianus. T01,GY skin libraries; T02:YL skin libraries. The x-axis is SNP density, that is, the number of SNP per Kb gene sequence. The y-axis is the number of genes with the corresponding density.
Fishes 08 00121 g007
Figure 8. Expression of six genes related to pigmentation in different tissues and colors. (A) qPCR verification of the DEGs in eight different tissues of GY skin color individuals. (B) The expression of the selected DEGs in the skin of five skin colors. (n = 3; * p < 0.05; ** p < 0.01).
Fishes 08 00121 g008
Figure 9. TYR gene clone and sequence characterization. (A) Agarose gel electrophoresis of TYR, M: DL3000 DNA marker, Lane 1: amplification fragment of TYR; (B) secondary structure prediction of TYR protein. Fishes 08 00121 i001: helix; Fishes 08 00121 i002: coil; Fishes 08 00121 i003: strand.
Fishes 08 00121 g009
Figure 10. Phylogenetic tree of TYR from vertebrate. ●: indicates TYR from A. davidianus; the black font represents Reptilia, the blue font represents Aves, the purple font represents Mammalia, the green font represents Amphibian; GenBank accession numbers of other vertebrates are listed.
Fishes 08 00121 g010
Figure 11. Multiple alignment of TYR sequences of individuals with different body colors. Note: Three nucleotide insertion sites are indicated by □. TYR represents GY phenotype, TYR-4 represents YL phenotype, TYR-10 represents intermediate phenotype.
Fishes 08 00121 g011
Table 1. Primer pairs designed for PCR analysis of candidate genes.
GenesPrimer SequencesAmplified RegionTm (°C)Size (bp)
MC1RF5′-GCGGGCAGTGATGGTTATTA-3′CDs62110
R5′-GAAGCCAATGAGGCAGATGA-3′
AgoutiF5′-GAACTTCTTCCACCCATCTCAA-3′CDs62116
R5′-GAGCCTTTCTAGGTGGAACTTT-3′
TYRP1F5′-CGTGTCTCCGAATGATCCTATTT-3′CDs62.083
R5′-ACTGTGTCTTCTCAGCCATTC-3′
TYR p1F5′-TACAGATTGCTGCTGTGCAGA-3′CDs52.01651
R5′-TTGTTGAATTACTCTGGCCTT-3′
TYR p2F5′-GCAGACCAGAAGAATACAACAATC-3′CDs62.0105
R5′-CCTCAGAACCCTGGCTTTATC-3′
DCTF5′-TGCAACAGCCTGGATGACTA-3′CDs56.0194
R5′-GCATTCCGGAAGCTGAAACT-3′
MITFF5′-CCTTCTGCAGGCCTTTCATC-3′CDs56.0144
R5′-AGTGATGGTGCCATCTGTGA-3′
GAPDHF5′-CACTGAGGAACAGGTGGTCT-3′CDs57.97163
F5′-ATGGCTCATCAGGTCCACAA-3′
P1, primer for TYR gene cloning; P2, primer for qPCR.
Table 2. KEGG enrichment of differentially expressed genes.
Pathway KOEnrichment_FactorQ_Value
ECM-receptor interaction ko045120.170.0000 × 1000
Focal adhesion ko045100.240.0000 × 1000
Cardiac muscle contraction ko042600.212.8714 × 10−7
Tight junction ko045300.274.7132 × 10−7
Dilated cardiomyopathy ko054140.173.4160 × 10−5
Hypertrophic cardiomyopathy (HCM) ko054100.173.4160 × 10−5
Protein digestion and absorption ko049740.221.4015 × 10−3
Glycolysis/Gluconeogenesis ko000100.322.0857 × 10−2
Pathway: KEGG pathway name; KO: KEGG channel number; Enrichment_Factor: the enrichment factor; Q_value: Q value is the p value after multiple hypothesis testing correction, which represents the significance statistics of enrichment. The smaller the value, the higher the enrichment degree.
Table 3. Statistical data of SSR analysis.
Searching Item Number
Total number of sequences examined 22,531
Total size of examined sequences (bp) 51,295,961
Total number of identified SSRs 13,131
Number of SSR containing sequences 8638
Number of sequences containing more than 1 SSR 2966
Number of SSRs present in compound formation 774
Mono nucleotide 10,844
Di nucleotide 1528
Tri nucleotide 679
Tetra nucleotide 78
Penta nucleotide 2
Mono nucleotide: single base repeating SSR; Di nucleotide: double base repeat SSR; Tri-nucleotide: three-base repeating SSR; Tetra nucleotide: four-base repeating SSR; Penta nucleotide: five-base repeating SSR; Hexa nucleotide: six-base repeating SSR.
Disclaimer/Publisher’s Note: The statements, opinions and data contained in all publications are solely those of the individual author(s) and contributor(s) and not of MDPI and/or the editor(s). MDPI and/or the editor(s) disclaim responsibility for any injury to people or property resulting from any ideas, methods, instructions or products referred to in the content.

