Abstract
Commonly, female European eels are injected weekly with pituitary extract (PE) from carp (CPE) or salmon (SPE) to induce sexual maturation. However, a PE is a mixture of gonadotropins and other hormones that are not specific for eel and rapidly cleared from circulation. The aim of this study was therefore to test the effects of highly stable eel-specific recombinant gonadotropins (rGTHs) on oocyte development in vitro and in vivo in European eels. For the in vitro trial, the dose–effect responses of maturing eel oocytes on CPE and recombinant luteinizing hormone (rLH) were studied before and after 12 and 18 h of incubation. For the in vivo experiment, sexual maturation was stimulated by treatment with (i) CPE, (ii) recombinant follicle-stimulating hormone (rFSH) followed by CPE and (iii) rFSH followed by rLH. For the in vitro experiment, the expression of the nuclear progestin receptor 2 (pgr2) was induced by rLH, implying that rLH was preparing the oocyte for ovulation. For the in vivo experiment, the females treated with rGTHs had high gonadosomatic index (GSI) values (rFSH-CPE: 75, 77; rFSH-rLH: 80) in comparison with the females injected with CPE (50–60), suggesting that rFSH strongly induced vitellogenic growth. Larvae were produced for all treatment groups and for the first time by rGTH treatment alone but dose and timing still need optimization.
1. Introduction
Gametogenesis is controlled by two pituitary gonadotropins (GTHs): follicle-stimulating hormone (FSH) and luteinizing hormone (LH), as reviewed in [1,2]. While FSH is involved in vitellogenesis and the stimulation of oocyte growth, LH promotes oocyte maturation and ovulation. During vitellogenesis, the oocyte grows considerably by accumulating yolk globules within its ooplasm, as reviewed in [1,2]. Briefly, FSH binds to its ovarian receptor (Fshr) and promotes the production of 17β-estradiol (E2). Upon the binding of E2 to the hepatic nuclear estrogen receptors, the production of vitellogenin is stimulated which is then incorporated and cleaved into small units of yolk proteins within the oocyte [3,4]. Following the vitellogenic growth phase, the oocyte matures, as reviewed in [1,5], which is characterized by the (1) migration of the germinal vesicle (GV) from the center of the oocyte towards its surface where the nuclear envelope disintegrates (i.e., germinal vesicle breakdown (GVBD)), (2) hydration of the oocyte which results from the cleavage of the yolk into small amino acids that increase the osmotic pressure thereby allowing water influx in the oocyte [6], and (3) fusion of the lipid droplets that coalesce to a few large globules [7]. For inducing maturation, LH binds to its ovarian receptors (Lhrcg1 and Lhrcg2) to promote the production of the maturing-inducing hormone (MIH). In turn, MIH binds its membrane progestin receptors (mPRs) to induce GVBD. Following the LH surge-induced maturation, the MIH mediates ovulation, as reviewed in [8], via its nuclear progestin receptors (Pgr1 and Pgr2). LH stimulates the production of prostaglandins, which act through their receptors, such as the Ptger4b, to trigger the release of the oocyte from its surrounding follicles, as reviewed by [9].
Although recent advances in eel reproduction protocols has led to the regular production of larvae [10,11,12,13], the life cycle of the European eel is not closed yet in captivity. Generally, eels are weekly injected with SPE or CPE to induce oocyte growth [7,14,15,16]. Subsequently, females are injected with DHP, as the main MIH in eels [17], to induce oocyte maturation and ovulation. With the current protocol, egg and larvae quality is often poor, as exemplified by the low hatching rates, low larval survival and abundant occurrence of malformations [13,18,19]. Therefore, there is an urgent need to improve the artificial reproduction protocols to obtain high-quality eggs that will develop into larvae that are able to grow, survive and metamorphose into juvenile glass eels.
PE is a mixture of FSH, LH, growth hormone (GH), prolactin (PRL), somatolactin (SL) and thyroid-stimulating hormone (TSH) [20,21,22,23,24]. While the gonadotropins directly control gametogenesis, the secondary hormones, such as GH and PRL, regulate other physiological processes but also play a role in reproductive physiology [25,26,27,28,29]. In fish, GTHs have been reported to control the release of secondary pituitary hormones, such as GH [30], SL [31] and PRL [32]. Contrary to using the PE of species other than eel, rGTHs are species specific, and the dosages of the gonadotropins are controllable. Like other synthetic hormones, rGTHs do not pose a disease transmission risk as may PE [33]. rGTHs have been developed and tested in several other fish species. In Japanese eels, rGTHs were initially produced by Drosophila S2 cells, but these only moderately induced the development of ovarian tissues and testis in vivo, despite their great effectiveness in vitro [34]. This low biological activity in vivo is probably due to the high clearance rate from the circulation of recombinants produced by insect cells in vertebrates [35]. For increasing recombinant production, rGTHs have been produced by infecting silkworm larvae with baculovirus that contained cDNAs encoding eel gonadotropin subunits [36,37]. With these rGTHs, spermatogenesis was induced but the males did not produce sperm [36]. rGTHs produced in the Chinese hamster ovary (CHO) have been found to induce spermatogenesis but also spermiation in European eels [38]. Recently, Ramos-Júdez et al. [39] reported that the rGTHs produced in the CHO were successful in inducing oocyte development from previtellogenesis to oocyte maturation in the flathead grey mullet Mugil cephalus, and they were able to produce eggs and larvae that developed into juveniles. These results suggest that rGTHs produced in the CHO have a higher bioactivity and half-life than the ones produced in insect cells and silkworm pupae.
The main objective of this study was to establish the stimulatory effects of eel-specific rGTHs (rFSH and rLH) that were produced in CHO cells on oocyte development in vitro and in vivo in European eels. For the in vitro trial, the dose and effect response of the oocytes to rLH in boosting maturation and ovulation were assessed and compared with CPE as the control. For the in vivo experiment, sexual maturation was stimulated by treatment with (i) CPE as the control, (ii) rFSH followed by CPE and (iii) rFSH followed by rLH.
2. Materials and Methods
2.1. Ethics
The animal study protocol was approved by the Central Committee for Animal Experiments (project number: AVD401002017817), the DEC (Animal Experiments Committee) and the IvD (Authority for Animal Welfare) (experiment numbers: 2017.D-0007.001–5).
2.2. Broodstock Conditioning
2.2.1. Males
Both wild and farmed males (80–120 g) were used for the experiment. Wild males were caught by fyke net in the Harinxma canal (The Netherlands). The farmed males were obtained from Palingkwekerij Koolen B.V. (Bergeijk, The Netherlands). The males were transferred to the animal experimental facilities of Wageningen University and Research. The males were anaesthetized with 2-phenoxyethanol (2 mL in 10 L water), PIT-tagged (Trovan, DorsetID, Aalten, The Netherlands) and housed with the females.
2.2.2. Females
Young elvers of 10 g were obtained from Palingkwekerij Koolen B.V. (Bergeijk, The Netherlands) and transferred to the CARUS aquaculture facilities of Wageningen University and Research. The elvers were placed in 400 L tanks that were kept at 24 °C under dimmed light conditions. The elvers were feminized [40] by feeding them with 2 mm pellets (Alltech-Coppens, Helmond, The Netherlands) that were coated with E2 (Sigma Aldrich, Saint Louis, MI, USA) over a 6 month period. Feminized eels appear to be more sensitive to hormonal treatment [41], which shortens the generation time to two years. After that period, they were fed with a custom-made broodstock diet (protein 525 g kg−1, fat 98 g kg−1 and ash 76 g kg−1) for an additional 6 months. Then, premature females of 330 ± 43 g were selected, transferred to seawater (Tropic Marine, 36 ppt) and no longer fed. They were subjected to simulated migration in a swim gutter for 2 months, with a slightly adjusted protocol from [42]: constant swimming at a speed of 0.51 m s−1 for ~2700 km in the dark at daily alternating temperatures between 10 and 15 °C. After the simulated migration, the eels were randomly selected, anaesthetized with 2-phenoxyethanol (2 mL in 10 L water), PIT-tagged (Trovan, DorsetID, Aalten, The Netherlands) and housed in seawater at a salinity of 36 ppt, a water temperature of 16 °C and under dark conditions. Each eel was injected with an implant containing 17α-methyltestosterone (5 mg) and E2 (2 mg) in the peritoneal cavity for two months to induce the start of vitellogenesis [43].
2.3. Production of rGTHs
Homologous single chain recombinant European eel rFSH and rLH were produced by Rara Avis Biotec S.L. (Valencia, Spain) using in-house technology, as previously reported [38]. Briefly, the CHO cells were transfected with the expression constructs encoding fusion proteins containing the entire coding sequence of A. anguilla FSHβ (GenBank accession no. AAN73407.1) or LHβ (GenBank accession no. CAA43374.1) subunits, the 28 carboxyl-terminal amino acids of the human chorionic gonadotropin (hCG) β subunit as a linker and the mature sequence of the A. anguilla glycoprotein hormone α subunit (GenBank accession no. CAA43373.1). The secreted recombinant hormones were purified from the culture medium by ion exchange chromatography, concentrated and stored at −80 °C until use.
2.4. In Vitro Experiment of Ovarian Tissues
2.4.1. Biometrics
Before starting the weekly CPE injections, ten females were anaesthetized and measured for body length (BL), body weight (BW), body girth (BG) and eye diameters horizontal (Edh) and vertical (Edv) to calculate the Fulton’s condition factor (K), body girth index (BGI) and the eye index (EI):
Condition factor (K) = 100 ∗ (BW/BL3);
BW: body weight (g) (BL): body length (cm);
Body girth index (BGI) = BG/BL;
BG: body girth (cm);
EI = 100 ∗ (((Edh + Edv) ∗ 0.25)2 π ∗ (10 ∗ BL)−1), from [44];
Edh: eye horizontal diameter (mm); Edv: eye vertical diameter (mm).
2.4.2. Artificial Maturation
The females were weekly anesthetized and injected with 20 mg kg−1 CPE (Catfish, Den Bosch, The Netherlands) that was dissolved in a physiological salt solution (0.9% NaCl; 20 mg mL−1). From week 7 onwards, two days after each injection, the eels were weighed to determine whether oocyte hydration had commenced, as indicated by an increased body weight index:
BWI = 100 ∗ (BW/BW at the moment of first injection);
BW: body weight (g).
When the BWI increased to above 110, the females were anaesthetized to take an ovarian biopsy by inserting a cannula through the cloaca. The oocyte development was graded on a scale from 1 to 7, according to [7]. When most of the oocytes were in stage 3, ovarian tissue was sampled for the in vitro experiment.
2.4.3. In Vitro Dose–Response Effects of Ovarian Tissue
The ovarian tissue (~5 g) was obtained by perforating the body wall cavity (5 cm anterior from the cloaca) with a needle that had an inner diameter of 2.3 mm. The ovarian biopsy was placed in a Petri dish containing ice-cold Leibovitz’s L15 culture medium (Thermo Fisher Scientific, Waltham, MA, USA) supplemented with 2.5 g L−1 HEPES, 0.1 g L−1 streptomycin and 100,000 IU L−1 penicillin (Pen Strep, ThermoFisher, Waltham, MA, USA). The oocytes were dispersed in the culture medium by pipetting the ovarian pieces. For one of the females, ∼20 oocytes were fixed in cold 4% paraformaldehyde overnight, washed in PBS and then placed in 70% ethanol to check for the presence of follicle cells. For each female, ∼60 oocytes were stocked in each well of two 24-well culture plates in 1 mL medium supplemented with the treatment solution (CPE: 1.25, 12.5 and 125 µg mL−1; rLH: 10, 100, 1000 ng mL−1; concentrations were based on the results of a pilot study) or with 1 mL of hormone-free media with the plates as duplicates. Just before incubation, another oocyte sample was taken as the control for microscopy and gene expression analysis. One culture plate was incubated for 12 h and one plate was incubated for 18 h, as based on [45]. Both plates were incubated at 16 °C to be consistent with the water temperature of the in vivo experiment. After the incubation periods, the oocytes were sampled for microscopy and gene expression analysis.
2.4.4. Microscopy Analysis
For each female, the oocytes were stained with Serra’s fixative (ethanol:formalin:acetic at 6:4:1, diluted 20 times in PBS) for 3 min to stain the germinal vesicle for assessment of the percentage of oocytes displaying GVBD. The stained oocytes were then photographed using a digital camera connected to a microscope at 2x magnification. The lipid and oocyte diameters of ∼20 oocytes were measured with the free ImageJ software version 1.52 [46]. The lipid droplet diameter was measured according to [47]. Upon visual assessment, for each oocyte, the ten largest lipid droplets were measured and the five maximum values averaged. At the final stage of lipid coalescence, the lipid droplets fused together to form a few large oil globules [7]. When the lipid droplet diameter exceeded 190 µm, the diameter was based solely on the largest lipid droplet diameter. For each droplet, the diameter was measured only once, since their shapes were mostly spherical. For the oocyte diameter, the maximum diameter was measured, as the oocyte could sometimes be elliptical.
2.4.5. Histology
From the ∼20 oocytes that were fixed in 4% paraformaldehyde to check for the presence of the follicle cells, 10 oocytes were randomly selected, placed in 0.9% agarose (type VII, low gelling; Sigma Aldrich, Saint Louis, MO, USA), dehydrated via an ethanol series and embedded in paraffin. The embedded oocytes were then sectioned using a microtome (Microm, HM 350, ThermoFisher Scientific, Waltham, MA, USA) into 5 µm thick sections. The oocytes were stained with Mayers Haematoxylin–Eosin and photographed with a DFC450c color camera attached to a Leica DM6b microscope.
2.4.6. Gene Expression Analysis
The primers used for the gene expression analysis are listed in Table 1. The mPRα, mPRAL2 and Ptger4b protein sequences from zebrafish (Danio rerio) were aligned with A. anguilla using the NCBI tBLASTx tool to predict the gene sequence. The primers that were not previously described were designed using Primer3 v0.4.0 [48,49].

Table 1.
Primers used for each target gene. T⁰: annealing temperature; bp: base pair. The primer efficiency of mPRα, mPRAL1, mPRAL2, mPRδ and lhcgr2 could not be determined, since the expression of these genes were too low (ct > 30).
For each female, ∼20 oocytes were kept in RNAlater (Ambion Inc., Huntingdon, UK), refrigerated at 5 °C overnight and stored at −80 °C until RNA extraction. The total tissue was homogenized with a tissue lyzer (Qiagen, Tissuelizer II) and extracted with 1 mL Trizol (Invitrogen, CA, USA) according to the manufacturer’s protocol. Traces of DNA were digested with the ISOLATE II RNA Mini Kit (Bioline, London, UK) according to the manufacturer’s protocol. The RNA purity was then assessed using a Nanodrop and Bioanalyzer. The 260/280 ratios and RIN values were, on average, 2.1 ± 0.07 and 9.3 ± 0.6, respectively. Complementary DNA (125 ng uL−1) was generated with Superscript III Reverse transcriptase according to the manufacturer’s protocol (ThermoFisher, Waltham, MA, USA).
Gene expression analysis was performed by quantitative real-time PCR using SYBR on a QuantStudio Real-Time PCR system. The reactions were heated at 95 °C for 2 min, followed by 40 cycles of denaturation (95 °C, 5 s), annealing (60–64 °C, 10 s) and extension (72 °C, 5 s). A melt curve analysis was performed, and the products were electrophoresed on agarose gel to check for product specificity. When the CT values were below 30, standard curves were generated by diluting cDNA at 1:5 for elf1, pgr1, and pgr2 at 1:2 for lhr1, lhr2, fshr, ara and mPRδ to determine the primer efficiency. Since some mPRs (mPRα, mPRAL1, mPRAL2 and mPRδ) had CT values higher than 30, the primer efficiency could not be determined for these genes. When the CT values of a sample could not be determined due to the fact of a low expression, the CT values were set at 35. The data are expressed as the fold change using the 2−ΔΔCT method [54]. The transcript levels of each target were normalized over the elongation factor 1 (elf1), since its expression was stable across the various treatments (ANOVA, p = 0.536).
2.5. In Vivo Experiment
2.5.1. Biometrics and Ultrasound
Before starting the weekly CPE injections, thirty females were anaesthetized and measured for BW, BG, BL, Edh and Edv to calculate the K, BGI and EI [44]. The females were then scanned by ultrasonography using a compact and portable system (MyLabFive™Vet with a LA435 probe, Esaote, Genoa, Italy) according to [55]. The females were scanned from head to tail on the ventral side to determine the gonadosomatic index (GSI) according to the formula developed in [56]:
2.5.2. Artificial Induction of Sexual Maturation
The thirty female eels were randomly and equally divided over three groups and treated according to the schematic representation presented in Figure 1. The females of group 1 (N = 10) were weekly injected with CPE (Catvis, Den Bosch, The Netherlands) at a dose of 20 mg kg−1 and were considered the control group (Figure 1A). The females of group 2 (N = 10) were weekly injected with (1) 12 µg rFSH from week 1 to week 12, (2) 12 µg rFSH and 10 mg kg−1 CPE from week 13 to week 15, (3) 6 µg rFSH and 20 mg kg−1 CPE from week 16 to week 18, and (4) 20 mg kg−1 CPE from week 18 onwards (Figure 1B). The females of group 3 (N = 10) were weekly injected with (1) 12 µg rFSH from week 1 to week 12, (2) 12 µg rFSH and 10 µg rLH from week 13 to week 15, (3) 6 µg rFSH and 20 µg rLH from week 16 to week 18, and (4) 20 µg rLH from week 18 onwards (Figure 1C). As described before, from week 7 onwards, the females were anesthetized and weighed. When the BWI increased to above 110, ovarian tissue was sampled and photographed using a binocular. When the oocytes were approximately at stage 3, the oocyte maturation was boosted by injecting CPE at a dose of 20 mg kg−1 for groups 1 and 2 or by injecting rLH at a dose of 20 µg for group 3. The next day, a new biopsy was obtained and photographed under the binocular. When the oocyte development showed sufficient progression to stage 4, the eels were anesthetized and injected at eight locations in the ovarium with DHP at a dose of 2 mg kg−1. The females were then placed in a 373 L spawning tank in which the water was gradually increased in temperature from 18 to 20 °C and kept at 36 ppt under dark conditions. In the timespan of 11–16 h after receiving the DHP injection, the females were regularly checked for egg release. When ovulation was noticed by egg release following slight abdominal pressure, females were slightly anesthetized and stripped by applying gentle pressure on the abdomen to collect the eggs in dry bowls. From these eggs, a small sample was taken and photographed under the binocular.

Figure 1.
Schematic representations of the treatment administrated to each of the three groups of feminized eels, with (A) group 1: CPE (N = 10); (B) group 2: rFSH-CPE (N = 10); (C) group 3: rFSH-rLH (N = 10). For group 1, females were weekly injected with 20 mg kg−1 CPE. For group 2, females were weekly injected with 12 µg rFSH (week 1–12), 12 µg rFSH and 10 mg kg−1 CPE (week 13–15), 6 µg rFSH and 20 mg kg−1 CPE (week 16–18), and 20 mg kg−1 CPE from week 18 onwards. For group 3, females were weekly injected with 12 µg rFSH (week 1–12), 12 µg rFSH and 10 µg rLH (week 13–15), 6 µg rFSH and 20 µg rLH (week 16–18), and 20 µg rLH from week 18 onwards. Females started to release eggs (black arrows) at week 8 for group 1 and week 16 for groups 2–3.
The males were anesthetized and injected with hCG (Sigma Aldrich, Saint Louis, MO, USA) at a dose of 1000 IU [57] and returned to the 373 L tanks kept at 36 ppt and 16 °C. Between 8 and 10 weeks later, these males spermiated. At the moment of DHP injection of the females (so 10–12 h before fertilization), 6–10 males from the stock of spermiating males received their follow-up dose of 250 IU hCG [58] and were put in the tank with the females. Just before fertilization, 2–3 mL sperm was freshly collected by stripping the males and then diluted in 45 mL artificial eel plasma [59].
2.5.3. Fertilization and Hatchery Practices
The diluted sperm and stripped eggs were gently mixed, and 300 mL of artificial sea salt water (Tropic Marine, 36 ppt, 18 °C) was added to the mixed gametes for activation. After 5 min, the eggs were placed in 3 L beakers filled with artificial seawater (36 ppt, 18 °C) under dark conditions. After 1 h, the percentage of floating eggs was estimated in relation to the eggs that were sinking. From the 3 L beakers, the floating layer was collected, rinsed gently over a sieve and transferred into beakers filled with fresh artificial seawater. Per beaker, 10–20 g of the eggs were kept in the suspension by gentle aeration and dead material was removed every 12 h. After hatching (48–60 h post fertilization), the water in the beakers was gently mixed to uniformly disperse the larvae and estimate their number. The larvae were stocked in two plankton nets (300 µm mesh) that were each hanging in a 100 L white conic tank connected to a 338 L recirculating system. The number of larvae that hatched was estimated, and the larval longevity (i.e., the number of days post-hatch that larvae survived) was monitored daily.
2.6. Statistical Analysis
All data were analyzed using R (version 3.2.4; R foundation for statistical computing, Vienna, Austria). The BGI, EI, K, GSI and normalized copy numbers of each target gene were compared between treatments using the Kruskal–Wallis test followed by a pairwise Dunn post hoc test with Benjamini–Hochberg correction for multiple comparisons among groups. Residuals from the BW, BL, BG, oocyte diameter, lipid diameter and the number of weekly injections that were needed to reach sexual maturation were tested for normality with the Shapiro–Wilk test. After testing the normality with the Shapiro–Wilk test, only BG and BL followed a normal distribution. BG and BL were therefore compared between the CPE, rFSH-CPE and rFSH-rLH treatments using one-way ANOVA. BW, the number of injections that were needed to reach sexual maturation and the oocyte and lipid diameters were compared using Kruskal–Wallis followed by a pairwise Dunn post hoc test with Benjamini–Hochberg correction for the multiple comparisons among groups. For the number of injections needed to reach maturation, the booster and DHP injections were not included in the statistical analysis. The differences were considered significant when p < 0.05.
3. Results
3.1. In Vitro Experiment
3.1.1. Biometrics and Histology
The females used for the in vitro experiment had a BL of 53 ± 3 cm, BW of 279 ± 44 g, BGI of 0.20 ± 0.01, EI of 8.9 ± 1.3 and K of 0.19 ± 0.02. The ovarian tissue sampled before the in vitro experiment was composed of folliculated and defolliculated oocytes (Figure 2). While some oocytes had theca and granulosa cells that were easily distinguishable by their respective flat and round shapes (Figure 2A), others were lacking follicle cells (Figure 2B).

Figure 2.
Maturing oocytes in European eel: (A) folliculated; (B) defolliculated oocytes. The insets zoom in on parts of the section. OC, oocyte; GV, germinal vesicle; OM, oocyte membrane; TC, theca cells; GC; granulosa cells.
3.1.2. GVBD, Hydration and Lipid Fusion
Both CPE and rLH did not induce GVBD, hydration (p = 0.990) and lipid fusion at 16 °C (p = 0.980) (for an overview, see Figure 3). Large variations in hydration and lipid fusion were observed between the females in the in vitro ovarian tissues (Figures S1–S2).
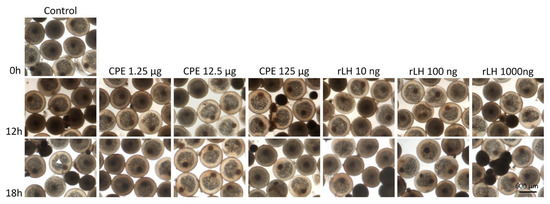
Figure 3.
Maturing eel oocytes when treated with various dosages of CPE (0, 1.25, 12.5 and 125 µg mL−1) and rLH (0, 10, 100 and 1000 ng mL−1) in vitro at the start of incubation (0 h) and after 12 and 18 h of incubation. Oocytes were fixed with Serra’s solution to stain the nucleus (white arrow). Oocytes incubated without hormone (control) had a visible nucleus after 0, 12 and 18 h of incubation. Similarly, oocytes incubated with CPE and rLH still had a visible nucleus showing that both CPE and rLH did not induce GVBD. In addition, the oocyte and lipid diameters did not change over time, neither with treatment. Still, variations in the oocyte and lipid diameters and variations in the position of the nucleus (center and periphery) were observed between oocyte batches of different females but independent of the treatment.
3.1.3. Expression of Nuclear and Membrane Progestin Receptors
Pgr1 expression remained stable with time and treatment (p = 0.504, Figure S3). Pgr2 expression increased with the treatment dose of rLH (p < 0.001) (Figure 4). The treatment with 1000 ng rLH after 12 h of incubation significantly increased the expression of pgr2 when compared to responses of the 0 h (p = 0.032), 12 h (p = 0.012) and 18 h controls (p = 0.021). Similar results were obtained after 18 h of incubation when comparing the dose–responses at 1000 ng rLH vs. the 0 h control (p = 0.014), at 1000 ng rLH vs. 12 h control (p = 0.009) and at 1000 ng rLH vs. the 18 h control (p = 0.015). The CPE treatment tended to cause an increase in pgr2 expression in a dose-dependent manner, but the results were not significant. When comparing the CPE and rLH treatments at various dosages, significant differences were detected but were ignored since they were not between comparable dosages.
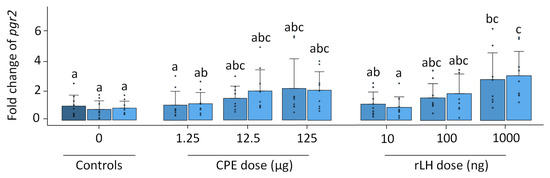
Figure 4.
Expression of the nuclear progestin receptor pgr2 when treated with various dosages of CPE (0, 1.25, 12.5 and 125 µg mL−1) and rLH (0, 10, 100 and 1000 ng mL−1) in vitro at the start of incubation (dark blue) and after 12 (mild blue) and 18 (light blue) hours of incubation. The receptor expression was normalized to the 0 h control and expressed as the fold change. The expression was compared between time points and dosages of CPE and rLH. The expression of pgr2 was upregulated after incubation with 1000 ng rLH after 12 and 18 h incubation when compared to the controls. The bars with no overlap in letters are significantly different from each other (p < 0.05). Data are presented as bar plots with an average ± standard deviation and individual data points as circles. The experiments were performed on N = 9 eels, with the exception of 100 ng rLH (N = 8 eels).
For the expression of the membrane progestin receptors mPRα (p = 0.108), mPRAL1 (p = 0.477), mPRγ (p = 0.999) and mPRδ (p = 0.261), no significant differences were found when comparing the treatments with CPE and rLH at various dosages at 0 h and after 12 and 18 h of incubation (Figures S4–S5, S7–S8). Significant differences were detected for mPRAL2 (p = 0.022, Figure S6) but were ignored since all CT values were above 35 cycles.
3.1.4. Expression of Gonadotropin, Androgen and Prostaglandin Receptors
In vitro, the fshr expression remained stable with the treatment and time (p = 0.624, Figure S9). The expression of lhcgr1 changed over time and with the treatment (p < 0.001). The expression of lhcgr1 decreased over time when comparing the dose–response at 18 h vs. the 0 h controls (p = 0.007) (Figure 5). For the CPE treatment, the expression of lhcgr1 decreased when comparing the dose–responses at 1.25 µg CPE after 18 h of incubation vs. the 0 h control (p = 0.014) and the dose–response at 125 µg CPE after 18 h of incubation with the 0 h control (p = 0.029). For the rLH treatment, the dose–response at 10 ng rLH after 18 h of incubation decreased lhcgr1 expression compared with the 0 h control (p = 0.005). Similar results were found when comparing the dose–response at 100 ng rLH after 18 h incubation vs. the 0 h control (p = 0.023), the dose–response at 1000 ng rLH after 12 h of incubation vs. the 0 h control (p = 0.006), and the dose–response at 1000 ng rLH after 18 h of incubation vs. the 0 control (p = 0.006). Overall, the dose–response effects between the treatments were very similar, except for one slight difference between the dose–response at 1.25 µg CPE at 12 h vs. 10 ng rLH at 18 h (p = 0.005). The expression of lhcgr2 (p = 0.815), ara (p = 0.910) and ptger4b (p = 0.978) remained stable with the treatment and time (Figures S10–S12).
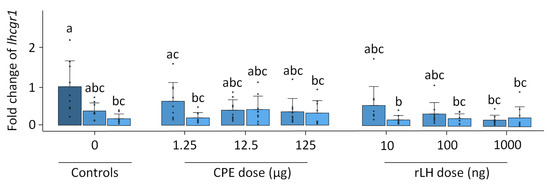
Figure 5.
Expression of the luteinizing hormone receptor lhcgr1 when treated with various dosages of CPE (0, 1.25, 12.5 and 125 µg mL−1) and rLH (0, 10, 100 and 1000 ng mL−1) in vitro at the start of incubation (dark blue) and after 12 (mild blue) and 18 (light blue) hours of incubation. The receptor expression was normalized to the 0 h control and expressed as the fold change. The expression was compared between the time points and dosages of CPE and rLH. The expression of lhcgr1 decreased after 18 h of incubation when compared to the 0 h control. Bars with no overlap of letters are significantly different from each other (p < 0.05). The data are presented as bar plots with the average ± standard deviation and individual data points as circles. The experiments were performed on N = 9 eels.
3.2. In Vivo Experiment
3.2.1. Biometrics and GSI
An overview of the biometric measurements (BL, BW, BGI, EI, K and GSI) of the three treatment groups (CPE, rFSH-CPE and rFSH-rLH) prior to the start of the experiment is shown in Table 2. No significant differences between the treatment groups existed.
Table 2.
Biometrics of the three treatment groups (CPE, rFSH-CPE and rFSH-rLH). BL, body length in cm; BW, body weight in g; BGI, body girth index; EI, eye index; K, condition factor; GSI, gonadosomatic index.
3.2.2. Sexual Maturation
The treatment affected the number of weekly injections to reach the oocyte maturation stage (p < 0.001) when crossing the threshold of a BWI of 110, indicating a significant hydration response. The females injected with CPE required significantly fewer weekly injections (9 ± 2 injections) to reach the oocyte maturation stage than the females injected with the rFSH-CPE (18 ± 1 injections, p = 0.008) and rFSH-rLH (20 ± 3 injections, p < 0.001) treatments (Figure 6). Increases in the oocyte diameter and lipid diameter were observed after the booster injection, after DHP injection and at stripping for each of the treatments (Figure 7).
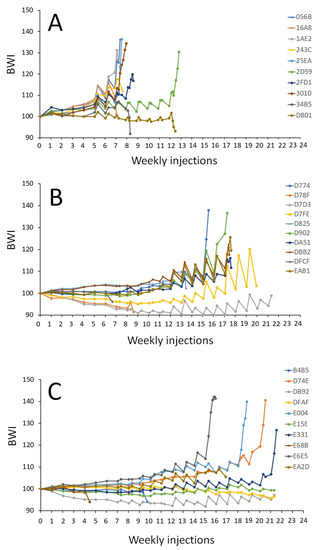
Figure 6.
Body weight index (BWI) of the maturing female eels. The eels were weekly injected with (A) CPE (N = 9); (B) rFSH and CPE (N = 6); (C) rFSH and rLH (N = 7) (see Section 2 for a description of the treatment protocol). The BWI values vs. the number of weekly injections are shown. The number of weekly injections was different between the treatments (p < 0.001). Females treated with CPE needed fewer injections to reach maturation than females injected with rFSH-CPE (p = 0.008) and rFSH-rLH (p < 0.001). Note that the booster and DHP injections are shown but not included in the analyses.
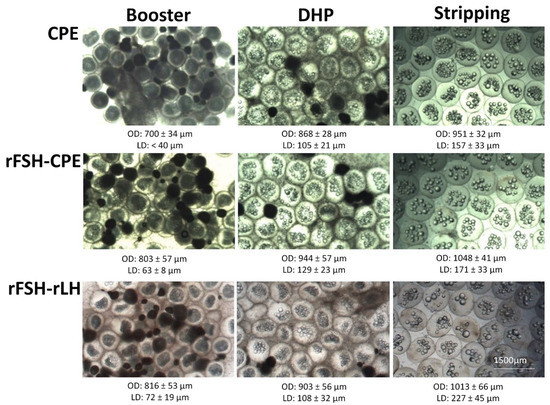
Figure 7.
Oocytes of eels treated with CPE, rFSH-CPE and rFSH-rLH at the moments of booster injection, DHP injection and stripping (see Section 2 for a description of the treatment protocol). For each treatment, increases in oocyte diameter and lipid diameter were observed between the moments of DHP injection and booster injection and between stripping and DHP injection. At the bottom of each picture, the average ± standard deviation of the respective oocyte diameter (OD) and lipid diameter (LD) is given. No differences between treatments were observed.
3.2.3. Reproductive Success
An overview of the reproductive success of females treated with CPE, rFSH-CPE and rFSH-rLH is shown in Table 3. Of the ten eels that were treated with CPE, one eel died before reaching oocyte maturation after the 9th weekly injection (GSI: 22), seven eels matured after 7–9 weekly injections (GSI: 28–60) and two matured after the 13th weekly injection (GSI: 30, 38). Of the nine eels that matured, three died before DHP injection, two died after DHP injection (GSI: 60, 50) and four eels could be stripped 12 h after DHP injection. Two of these eels produced larvae that survived until 6 and 18 days post-hatch (dph). Of the ten eels that were treated with rFSH-CPE, four eels died before reaching maturation after 7–22 weekly injections (GSI: 11–27), and the remaining six eels matured after 16–20 weekly injections (GSI: 20–77). Of the six females that sexually matured, one died before DHP injection, three died after DHP injection (GSI: 51, 75, 77) and two eels could be stripped after DHP injection. One of these two eels produced larvae that survived for 2 dph. Of the ten eels that were treated with rFSH-rLH, three females died before reaching maturation after 5–22 weekly injections (GSI: 18–23) and seven matured after 16–22 weekly injections (GSI: 19–80). Of the seven eels that sexually matured, three died before DHP injection, one died after DHP injection (GSI: 80) and three could be stripped 14.5 h after DHP injection. One of these three females produced larvae that survived up to 2 dph but showed developmental abnormalities, such as notochord deformities, necrosis and pericardial oedemas.
Table 3.
Reproductive success of the three treatment groups (CPE, rFSH-CPE and rFSH-rLH). Tag, PIT-tag code; Inj., number of weekly injections to reach maturation; BWI1, BWI at booster moment; BWI2, BWI at DHP injection; BGI1, BGI at booster moment; BGI2, BGI at DHP injection; t(h), hours after DHP injection; GSI, gonadosomatic index of females that died before/during maturation; Floaters, percentage of floaters after 1 h fertilization; Larvae, number of larvae after hatching; Fate, fate of the females.
4. Discussion
In the present study, we demonstrated that (1) eel-specific rGTHs (i.e., rFSH and rLH) produced in CHO cells drive sexual maturation in vivo; (2) rFSH strongly induces vitellogenesis in vivo; (3) rLH increased oocyte sensitivity to DHP by inducing the expression of pgr2 in vitro; and (4) larvae were produced for the first time with rGTHs alone in European eels. These findings provide important insights into the mechanisms of oocyte development in European eels that will help in improving the reproduction protocol of this species and, ultimately, help close the life cycle of this species in captivity.
The rGTHs induced oocyte development from early vitellogenesis to oocyte maturation in female European eels. The females that reached maturation had GSI values ranging between 37–77 and 31–80 for the rFSH-CPE and rFSH-rLH treatments, respectively. The high GSI values in the females treated with rGTHs are in sharp contrast to a study by Kazeto et al. [34], who found that both rGTHs led to only very moderate changes in inducing sexual maturation in vivo in Japanese eels. These authors reported that the females treated with rFSH and rLH (100 μg kg−1) for 8 weeks had mean GSI values of 1.51 ± 0.09 and 1.59 ± 0.08, respectively. The low GSI values in the study by Kazeto et al. [34] in comparison with the values of our study probably resulted from a difference in the systems used for rGTH production. While the study by Kazeto et al. [34] used rGTHs produced by insect cells that are known to be rapidly cleared from the circulation in vertebrates [35], we used rGTHs produced in mammalian cells. A comparison between the study by Kazeto et al. [34] and ours suggests a higher biological activity of rGTHs produced in mammalian cells to induce in vivo effects, as also recently reported in flathead grey mullet [39].
Three females treated with rGTHs had very high GSI values (rFSH-CPE: 75, 77; rFSH-rLH: 80) in comparison to the females injected with CPE (50–60). While the GSI values of eels obtained by applying the routine protocol of weekly CPE injections were within the range (30–60) of what has been observed in artificially reproduced European eels [7], high GSI values as observed in the females treated with rGTHs have not been reported yet. The high GSI values were the specific result of the rFSH treatment, because they were found in both the rFSH + CPE and rFSH + rLH groups. FSH increases the ovary weight by inducing oogonia proliferation and oocyte growth, as reviewed in [1,2]. In previous studies, histological analysis of ovarian tissues has shown that rFSH induced the formation of yolk globules in Japanese eel [34], flathead grey mullet [39] and Manchurian trout [60]. However, why were these GSI values in the rFSH-treated eels so much higher than what we observed for the CPE-treated eels? Should we inject CPE or rLH sooner and/or in higher doses since rFSH induces strong vitellogenic growth? Or does rFSH better synchronize oocyte development, and is the asynchronous oocyte development that we generally observed in the CPE-treated eels a flaw of the CPE treatment? In nature, the European eel may exhibit synchronous oocyte development and spawn eggs in a single batch. This hypothesis is supported by our earlier observations that CPE-treated eels that could be stripped almost empty were the most successful in their reproduction [7]; however, this is in contrast to our observations on a spontaneously matured female that had an estimated GSI of 47 and with only half of the oocytes hydrated and matured [61]. The mature females caught in the act of spawning in the Sargasso should provide a conclusive answer to this issue. Other explanations may be that the more stable rGTHs should be injected at longer than the weekly intervals of CPE or that the rGTHs lead to enlarged oocytes impairing the oocyte quality. Future studies should provide further insight into these issues.
Independent of the treatment, the mortality among the experimental eels was relatively high, as 50% of the females died during the course of the weekly injections and 40% of the remaining eels died after the DHP injection. This may originate from the fact that the experimental eels were not wild eels but feminized eels that were still young and perhaps not sufficiently conditioned as good broodstock. The wild silver eels that we used for experimenting were caught during their seaward migration at an age of at least 7 years old [62], and the feminized eels were used just one year after they arrived as young elvers. In our facilities, silvering is induced by subjecting them to a simulated migration, but at the end of this migration, they may not be at the stage of the wild silver eels yet. Their oocytes are still in previtellogenic stages with fewer lipid droplets [43] than in oocytes of the migrant wild eels, particularly when wild eels themselves are subjected to long-term swimming exercise, increasing the lipid deposition in the oocytes even further [63]. However, after the co-implantation with 17MT and E2, the feminized females had GSI values that reflected the initiation of vitellogenesis. Similar GSI values were reported by Palstra et al. [43] after steroid implantation in European eels. Therefore, the feminized eels in this study may have died because they were still too young for the induction of sexual maturation.
Both CPE and rLH did not induce hydration and lipid fusion in vitro after 18 h of incubation. The lack of histological changes during oocyte maturation in vitro is inconsistent with our in vivo results after the moment of boostering. Twenty-four hours after the females were injected with an extra CPE or rLH injection, the oocyte diameter increased, the cytoplasm became translucent and the lipid droplets fused together. In addition to the absence of effects on hydration and lipid coalescence, both CPE and rLH did not induce GVBD in vitro in European eels, which is in sharp contrast with previous studies in eels [36,37,64]. Kim et al. [64], who used the same rLH concentrations as our study, showed that rLH (1000 ng mL−1) and SPE (1 mg mL−1) induced approximately 30% GVBD in vitro at 20 °C after 24 h of incubation. The discrepancy between our study and the one by Kim et al. [64] might be explained by the difference in temperature (16 vs. 20 °C), which has been found to modulate the progression of oocyte development in eels [65,66]. In Japanese eels, oocytes matured faster at 20 °C than at 15 °C [66]. Similarly, female European eels reared at higher temperatures (18 and 21 °C) matured faster than those kept in water at 15 °C [65]. We performed the in vitro dose–response experiment at 16 °C in this study to be consistent with the water temperature of the in vivo experiment. A longer incubation time might have been necessary to induce histological changes in vitro at this temperature.
The expression of the membrane progestin receptors (mPRα, mPRAL1, mPRAL2, mPRγ and mPRδ) remained relatively constant in the in vitro trial of the maturing oocytes, which is in sharp contrast with the increased expression of the mPRs during spermatogenesis in European eels [51]. Our results indicate that the mPRs that are essential for the completion of oocyte maturation in fish [67,68] may already be present on the surface of the oocyte membrane. Similar results were found in vitro for mPRa in medaka, zebrafish and catfish [69,70,71] and for mPRβ in rainbow trout [72], zebrafish and catfish [73]. The upregulation of mPRa mRNA has been reported in seatrout after 8 h of incubation with hCG as an Lh analogue [67]. The lack of mPR overexpression in our study suggests that the upregulation of the mRNA levels is not required during oocyte maturation in eels. However, as shown in other fish species (spotted sea trout [67,74]; zebrafish [75]), it is possible that Lh increases mPR protein levels during oocyte maturation in female European eels. The protein level and transcript abundance of the various mPRs should receive more research attention in future studies to gain deeper insights into the mechanisms of oocyte maturation in European eels.
The expression of lhcrg1 but not lhcrg2 decreased over time in the in vitro trial of maturing oocytes. In Japanese eels, Kazeto et al. [76] showed that ovarian lhr transcripts increased during artificial maturation by the late vitellogenic stage. The expression of fshr remained stable in the in vitro trial of the maturing oocytes. In rainbow trout, a sharp increase in fshr expression just before oocyte maturation and ovulation was observed when compared with its expression at the end of vitellogenesis [77]. Like fshr, ara remained stable in the in vitro trial of the maturing oocytes. This result is in contrast with the study by Bobe and coauthors [78], who showed that ara expression decreased during oocyte maturation in rainbow trout. Androgen receptors have been shown to be important for oocyte maturation in zebrafish [79,80]. The decrease in lhcrg1 and the lack of changes in the fshr and ara expressions in the in vitro maturing oocytes may be explained by the low incubation temperature.
Following the DHP injection, several females injected with rGTHs successfully ovulated. Larvae were produced, for the first time, from eels treated with rGTHs. Still, the egg quality must have been low, as many embryos had abnormal development, failed to hatch and continued their development inside the egg shell until their demise. It is unclear from our study whether this low reproductive success is an effect of using rGTHs, since low hatching rates [19] and deformities [18] have been routinely observed in European eels and may originate from the used broodstock eels, the method of maturation induction and the hatchery and nursery conditions. In vitro, one marker of ovulation, pgr2, was induced by rLH, which is consistent with previous studies on mammals, as reviewed in [81], and fish (medaka [70]; zebrafish [82,83]). The results suggest that this process is highly conserved in vertebrates. In zebrafish, pgr -/- females showed normal oocyte development, but mature oocytes were trapped within the follicular layers and, therefore, these mutants failed to ovulate [82]. In fish, Pgr has been identified as essential for the upregulation of the ptgr4b gene [70,82]. In our study, LH-induced pgr expression was not associated with a higher ptger4b expression, which is not in line with the results obtained in medaka [70] and zebrafish [82]. Hagiwara et al. [70,71] proposed a mechanistic model for the expression of ptger4b in LH-primed preovulatory oocytes. Briefly, LH via its ovarian receptor induces pgr expression that translates into the Pgr protein within a few hours after the LH surge. Pgr binds to DHP which, in turn, increases ptgr4b expression. In this model, the authors assumed that DHP was present at high levels in the granulosa cells to induce ptgr4b in medaka, which is in contrast with eels that have low DHP levels within their ovarian follicles [84]. Therefore, the lack of DHP production by the follicular layers in European eels likely explains why the ptgr4b expression remained stable in the rLH-stimulated oocytes in our study. When considering the induced expression of pgr2 by rLH, it can be concluded that LH is preparing the oocyte for ovulation by increasing oocyte sensitivity to DHP.
5. Conclusion
In European eels, the newly developed eel-specific rGTHs (i.e., rFSH and rLH) successfully induced maturation and led to the production of eggs, embryos and larvae, but the dose and timing still need optimization. In the in vivo experiment, rFSH strongly induced vitellogenic growth up to high GSI values of 70–80, which has never been observed before. In the in vitro experiment with maturing oocytes, the rLH induced the pgr2 expression to prepare the oocyte for ovulation by increasing the oocyte sensitivity to DHP. Our study provides important insights into the mechanisms of oocyte maturation and ovulation that can help improve the artificial reproduction protocol in European eels.
Supplementary Materials
The following supporting information can be downloaded at: https://www.mdpi.com/article/10.3390/fishes8030123/s1, Figure S1: Oocyte diameters when treated with various dosages of CPE (0, 1.25, 12.5 and 125 µg mL−1) and rLH (0, 10, 100 and 1000 ng mL−1) in vitro at the start of incubation (dark blue) and after 12 (mild blue) and 18 (light blue) hours of incubation. Both CPE and rLH did not increase the oocyte diameter at any dose (p = 0.990), which indicates that hydration did not occur in vitro. The data are presented as bar plots with the average ± standard deviation of the independent experiments performed on N = 10 eels; Figure S2: Lipid diameters when treated with various dosages of CPE (0, 1.25, 12.5 and 125 µg mL−1) and rLH (0, 10, 100 and 1000 ng mL−1) in vitro at the start of incubation (dark blue) and after 12 (mild blue) and 18 (light blue) hours of incubation. Both CPE and rLH did not increase the lipid diameter at any dose (p = 0.980), which indicates that lipid fusion did not occur in vitro. The data are presented as bar plots with the average ± standard deviation of the independent experiments performed on N = 10 eels; Figure S3: Expression of the nuclear progestin receptor pgr1 when treated with various dosages of CPE (0, 1.25, 12.5 and 125 µg mL−1) and rLH (0, 10, 100 and 1000 ng mL−1) in vitro at the start of incubation (dark blue) and after 12 (mild blue) and 18 (light blue) hours of incubation. The receptor expression was normalized to the 0 h control and expressed as the fold change. The expression was compared between the time points and dosages of CPE and rLH. Both CPE and rLH did not change the pgr1 expression at any dose (p = 0.504). The data are presented as bar plots with the average ± standard deviation and the individual data points as circles. The experiments were performed on N = 9 eels; Figure S4: Expression of the membrane progestin receptor mPRα when treated with various dosages of CPE (0, 1.25, 12.5 and 125 µg mL−1) and rLH (0, 10, 100 and 1000 ng mL−1) in vitro at the start of incubation (dark blue) and after 12 (mild blue) and 18 (light blue) hours of incubation. The receptor expression was normalized to the 0 h control and expressed as the fold change. The expression was compared between the time points and dosages of CPE and rLH. Both CPE and rLH did not change the mPRα expression at any dose (p = 0.108). The data are presented as bar plots with the average ± standard deviation and the individual data points as circles. The experiments were performed on N = 9 eels; Figure S5: Expression of the membrane progestin receptor mPRAL1 when treated with various dosages of CPE (0, 1.25, 12.5 and 125 µg mL−1) and rLH (0, 10, 100 and 1000 ng mL−1) in vitro at the start of incubation (dark blue) and after 12 (mild blue) and 18 (light blue) hours of incubation. The receptor expression was normalized to the 0 h control and expressed as the fold change. The expression was compared between the time points and dosages of CPE and rLH. Both CPE and rLH did not change the mPRAL1 expression at any dose (p = 0.477). The data are presented as bar plots with the average ± standard deviation and the individual data points as circles. The experiments were performed on N = 9 eels; Figure S6: Expression of the membrane progestin receptor mPRAL2 when treated with various dosages of CPE (0, 1.25, 12.5 and 125 µg mL−1) and rLH (0, 10, 100 and 1000 ng mL−1) in vitro at the start of incubation (dark blue) and after 12 (mild blue) and 18 (light blue) hours of incubation. The receptor expression was normalized to the 0 h control and expressed as the fold change. The expression was compared between the time points and dosages of CPE and rLH. Significant differences were detected (p = 0.022) but ignored since all CT values were above 35 cycles. The data are presented as bar plots with the average ± standard deviation and the individual data points as circles. The experiments were performed on N = 9 eels; Figure S7: Expression of the membrane progestin receptor mPRδ when treated with various dosages of CPE (0, 1.25, 12.5 and 125 µg mL−1) and rLH (0, 10, 100 and 1000 ng mL−1) in vitro at the start of incubation (dark blue) and after 12 (mild blue) and 18 (light blue) hours of incubation. The receptor expression was normalized to the 0 h control and expressed as the fold change. The expression was compared between the time points and dosages of CPE and rLH. Both CPE and rLH did not change the mPRδ expression at any dose (p = 0.261). The data are presented as bar plots with the average ± standard deviation and the individual datapoints as circles. The experiments were performed on N = 9 eels; Figure S8: Expression of the membrane progestin receptor mPRγ when treated with various dosages of CPE (0, 1.25, 12.5 and 125 µg mL−1) and rLH (0, 10, 100 and 1000 ng mL−1) in vitro at the start of incubation (dark blue) and after 12 (mild blue) and 18 (light blue) hours of incubation. The receptor expression was normalized to the 0 h control and expressed as the fold change. The expression was compared between the time points and dosages of CPE and rLH. Both CPE and rLH did not change mPRγ expression at any dose (p = 0.999). The data are presented as bar plots with the average ± standard deviation and the individual data points as circles. The experiments were performed on N = 9 eels; Figure S9: Expression of the follicle-stimulating hormone receptor fshr when treated with various dosages of CPE (0, 1.25, 12.5 and 125 µg mL−1) and rLH (0, 10, 100 and 1000 ng mL−1) in vitro at the start of incubation (dark blue) and after 12 (mild blue) and 18 (light blue) hours of incubation. The receptor expression was normalized to the 0 h control and expressed as the fold change. The expression was compared between the time points and dosages of CPE and rLH. Both CPE and rLH did not change the fshr expression at any dose (p = 0.624). The data are presented as bar plots with the average ± standard deviation and the individual data points as circles. The experiments were performed on N = 9 eels; Figure S10: Expression of the luteinizing hormone receptor lhcgr2 when treated with various dosages of CPE (0, 1.25, 12.5 and 125 µg mL−1) and rLH (0, 10, 100 and 1000 ng mL−1) in vitro at the start of incubation (dark blue) and after 12 (mild blue) and 18 (light blue) hours of incubation. The receptor expression was normalized to the 0 h control and expressed as the fold change. The expression was compared between the time points and dosages of CPE and rLH. Both CPE and rLH did not change the lhcgr2 expression at any dose (p = 0.815). The data are presented as bar plots with the average ± standard deviation and the individual data points as circles. The experiments were performed on N = 9 eels; Figure S11: Expression of the androgen receptor ara when treated with various dosages of CPE (0, 1.25, 12.5 and 125 µg mL−1) and rLH (0, 10, 100 and 1000 ng mL−1) in vitro at the start of incubation (dark blue) and after 12 (mild blue) and 18 (light blue) hours of incubation. The receptor expression was normalized to the 0 h control and expressed as the fold change. The expression was compared between the time points and dosages of CPE and rLH. Both CPE and rLH did not change the ara expression at any dose (p = 0.910). The data are presented as bar plots with the average ± standard deviation and the individual data points as circles. The experiments were performed on N = 9 eels; Figure S12: Expression of the prostaglandin receptor ptger4b when treated with various dosages of CPE (0, 1.25, 12.5 and 125 µg mL−1) and rLH (0, 10, 100 and 1000 ng mL−1) in vitro at the start of incubation (dark blue) and after 12 (mild blue) and 18 (light blue) hours of incubation. The receptor expression was normalized to the 0 h control and expressed as the fold change. The expression was compared between the time points and dosages of CPE and rLH. Both CPE and rLH did not change the ptger4b expression at any dose (p = 0.978). The data are presented as bar plots with the average ± standard deviation and individual data points as the circles. The experiments were performed on N = 9 eels.
Author Contributions
Conceptualization, A.P.P., P.J., I.G.N., L.T.N.H. and H.K.; methodology, A.P.P., P.J., I.G.N., L.T.N.H. and H.K.; experimental work, P.J. and L.T.N.H.; gene expression analysis, P.J; histology: P.J. and H.S.; formal analysis, P.J.; investigation, P.J., A.P.P. and H.K.; data curation, P.J. and L.T.N.H.; writing—original draft preparation, P.J.; writing—review and editing, A.P.P. and H.K.; supervision, A.P.P. and H.K.; project administration, A.P.P.; funding acquisition, A.P.P. and W.S. All authors have read and agreed to the published version of the manuscript.
Funding
This study was funded as the project OptimAAL (grant number: 18971000009) by the DUPAN foundation, as well as the Dutch Ministry of Economic Affairs and the European Union, European Maritime and Fisheries Fund.
Institutional Review Board Statement
The animal study protocol was approved by the Central Committee for Animal Experiments (project number: AVD401002017817), the DEC (Animal Experiments Committee) and the IvD (Authority for Animal Welfare) (experiment numbers: 2017.D-0007.001–5).
Data Availability Statement
Raw data supporting the conclusions of this article will be made available by the authors, without undue reservation, to any qualified researcher.
Acknowledgments
The authors wish to thank A. De Wit, L. Kruijt, K. Laport and B. Dibbits for the technical support related to the gene expression analysis; animal care takers and zootechnicians W. Nusselder, T. Spanings, M. ter Veld, S. Visser, M. van Loon and T. Wiegers of the animal experimental facilities at CARUS for monitoring fish health and water quality. The results of this study have been presented at the Aquaculture Europe congress of 2021 and reported in an abstract (https://aquaeas.org/Program/PaperDetail/38729, accessed on 21 February 2022), as well as pitched in an overview presentation at the WCGALP congress of 2022 and reported in the proceedings (https://www.wageningenacademic.com/pb-assets/wagen/WCGALP2022/21_005.pdf, accessed on 21 February 2022).
Conflicts of Interest
The coauthors I.G., W.S. and L.H. are employees of a company. The other authors have no competing interest.
References
- Planas, J.V.; Swanson, P. Physiological function of gonadotropins in fish. In Fish Reproduction; Rocha, M.J., Arukwe, A., Kapoor, B.G., Eds.; Sciences Publisher: Enfield, CT, USA, 2008; pp. 37–66. [Google Scholar]
- Lubzens, E.; Young, G.; Bobe, J.; Cerdà, J. Oogenesis in teleosts: How fish eggs are formed. Gen. Comp. Endocrinol. 2010, 165, 367–389. [Google Scholar] [CrossRef]
- Sire, M.F.; Babin, P.J.; Vernier, J.M. Involvement of the lysosomal system in yolk protein deposit and degradation during vitellogenesis and embryonic development in trout. J. Exp. Zool. 1994, 269, 69–83. [Google Scholar] [CrossRef]
- Montserrat, N.; González, A.; Méndez, E.; Piferrer, F.; Planas, J.V. Effects of follicle stimulating hormone on estradiol-17b production and P-450 aromatase (CYP19) activity and mRNA expression in brown trout vitellogenic ovarian follicles in vitro. Gen. Comp. Endocrinol. 2004, 137, 123–131. [Google Scholar] [CrossRef] [PubMed]
- Nagahama, Y.; Yamashita, M. Regulation of oocyte maturation in fish. Develop. Growth Differ. 2008, 50, S195–S219. [Google Scholar] [CrossRef] [PubMed]
- Greeley, M.S.; Calder, D.R.; Wallace, R.A. Changes un teleost yolk proteins during oocyte maturation: Correlation of yolk proteolysis with oocyte hydration. Comp. Biochem. Physiol. 1986, 84, 1–9. [Google Scholar] [CrossRef]
- Palstra, A.P.; Cohen, E.G.H.; Niemantsverdriet, P.R.W.; van Ginneken, V.J.T.; van den Thillart, G.E.E.J.M. Artificial maturation and reproduction of European silver eel: Development of oocytes during final maturation. Aquaculture 2005, 249, 533–547. [Google Scholar] [CrossRef]
- Takahashi, T.; Hagiwara, A.; Ogiwara, K. Follicle rupture during ovulation with an emphasis on recent progress in fish models. Reproduction 2019, 157, R1–R13. [Google Scholar] [CrossRef]
- Takahashi, T.; Hagiwara, A.; Ogiwara, K. Prostaglandins in teleost ovulation: A review of the roles with a view to comparison with prostaglandins in mammalian ovulation. Mol. Cell Endocrinol. 2018, 461, 236–247. [Google Scholar] [CrossRef]
- Di Biase, A.; Lokman, P.M.; Govoni, N.; Casalini, A.; Emmanuele, P.; Parmeggiani, A.; Mordenti, O. Co-treatment with androgens during artificial induction of maturation in female eel, Anguilla anguilla: Effect on egg production and early development. Aquaculture 2017, 479, 508–515. [Google Scholar] [CrossRef]
- Asturiano, J.F. Improvement on the reproductive control of the European eel. In Reproduction in Aquatic Animals: From Basic Biology to Aquaculture Technology, 1st ed.; Yoshida, M., Asturiano, F., Eds.; Springer: Singapore, 2020. [Google Scholar] [CrossRef]
- Politis, S.N.; Syropoulou, E.; Benini, E.; Bertolini, F.; Sørensen, S.R.; Miest, J.J.; Butts, I.A.E.; Tomkiewicz, J. Performance thresholds of hatchery produced European eel larvae reared at different salinity regimes. Aquaculture 2021, 539, 736651. [Google Scholar] [CrossRef]
- Jéhannet, P.; Palstra, A.P.; Heinsbroek, L.T.N.; Kruijt, L.; Dirks, R.P.; Swinkels, W.; Komen, H. What goes wrong during early development of artificially reproduced European eel Anguilla anguilla? Clues from the larval transcriptome and gene expression patterns. Animals 2021, 11, 1710. [Google Scholar] [CrossRef] [PubMed]
- Yamamoto, K.; Yamauchi, K. Sexual maturation of Japanese eel and production of eel larvae in the aquarium. Nature 1974, 251, 220–222. [Google Scholar] [CrossRef] [PubMed]
- Lokman, P.M.; Young, G. Induced spawning and early ontogeny of New Zealand freshwater eels (Anguilla dieffenbachii and A. australis). N. Z. J. Mar. Freshw. Res. 2000, 34, 135–145. [Google Scholar] [CrossRef]
- Kottmann, J.S.; Jørgensen, M.G.P.; Bertolini, F.; Loh, A.; Tomkiewicz, J. Differential impacts of carp and salmon pituitary extracts on induced oogenesis, egg quality, molecular ontogeny and embryonic developmental competence in European eel. PLoS ONE 2020, 15, e0235617. [Google Scholar] [CrossRef] [PubMed]
- Adachi, S.; Ijiri, S.; Kazeto, Y.; Yamauchi, K. Oogenesis in the Japanese eel, Anguilla japonica. In Eel Biology; Aida, K., Tsukamoto, K., Yamauchi, K., Eds.; Springer: Tokyo, Japan, 2003; pp. 301–317. [Google Scholar] [CrossRef]
- Politis, S.N.; Mazurais, D.; Servili, A.; Zambonino-Infante, J.L.; Miest, J.J.; Tomkiewicz, J.; Butts, I.A.E. Salinity reduction benefits European eel larvae: Insights at the morphological and molecular level. PLoS ONE 2018, 13, e0198294. [Google Scholar] [CrossRef] [PubMed]
- Da Silva, F.F.G.; Jacobsen, C.; Kjørsvik, E.; Støttrup, J.G.; Tomkiewicz, J. Oocyte and egg quality indicators in European eel: Lipid droplet coalescence and fatty acid composition. Aquaculture 2018, 496, 30–38. [Google Scholar] [CrossRef]
- Kawauchi, H.; Moriyama, S.; Yasuda, A.; Yamaguchi, K.; Shirahata, K.; Kubota, J.; Hirano, T. Isolation and characterization of chum salmon growth hormone. Arch. Biochem. Biophys. 1986, 244, 542–552. [Google Scholar] [CrossRef] [PubMed]
- Degani, G.; Boker, R.; Jackson, K. Growth hormone, gonad development, and steroid levels in female carp. Comp. Biochem. Physiol. Part C Toxicol. Pharmacol. 1996, 115, 133–140. [Google Scholar] [CrossRef]
- Moriyama, S.; Swanson, P.; Larsen, D.A.; Miwa, S.; Kawauchi, H.; Dickhoff, W.W. Salmon thyroid-stimulating hormone: Isolation, characterization, and development of a radioimmunoassay. Gen. Comp. Endocrinol. 1997, 108, 457–471. [Google Scholar] [CrossRef]
- Onuma, T.; Ando, H.; Koide, N.; Okada, H.; Urano, A. AEffects of salmon GnRH and sex steroid hormones on expression of genes encoding growth hormone/prolactin/somatolactin family hormones and a pituitary-specific transcription factor in masu salmon pituitary cells in vitro. Gen. Comp. Endocrinol. 2005, 143, 129–141. [Google Scholar] [CrossRef]
- Minegeshi, Y.; Dirks, R.P.; de Wijze, D.L.; Brittijn, S.A.; Burgerhout, E.; Spaink, H.P.; van den Thillart, G.E.E.J.M. Quantitative bioassays for measuring biologically functional gonadotropins based on eel gonadotropic receptors. Gen. Comp. Endocrinol. 2012, 178, 145–152. [Google Scholar] [CrossRef]
- Le Gac, F.; Blaise, O.; Fostier, A.; Le Bail, P.Y.; Loir, M.; Mourot, B.; Weil, C. Growth hormone (GH) and reproduction: A review. Fish Physiol. Biochem. 1993, 11, 219–293. [Google Scholar] [CrossRef] [PubMed]
- Planas, J.V.; Swanson, P.; Rand-Weaver, M.; Dickhoff, W.W. Somatolactin stimulates in vitro gonadal steroidogenesis in coho salmon, Oncorhynchus kisutch. Gen. Comp. Endocrinol. 1992, 87, 1–5. [Google Scholar] [CrossRef]
- Benedet, S.; Björnsson, B.T.; Taranger, G.L.; Andersson, E. Cloning of somatolactin alpha, beta forms and the somatolactin receptor in Atlantic salmon: Seasonal expression profile in pituitary and ovary of maturing female broodstock. Reprod. Biol. Endocrinol. 2008, 6, 42. [Google Scholar] [CrossRef] [PubMed]
- Whittington, C.M.; Wilson, A.B. The role of prolactin in fish reproduction. Gen. Comp. Endocrinol. 2013, 191, 123–136. [Google Scholar] [CrossRef] [PubMed]
- Kumar, R.S.; Trant, J.M. Piscine glycoprotein hormone (gonadotropin and thyrotropin) receptors: A review of recent development. Comp. Biochem. Physiol. B Biochem. Mol. Biol. 2001, 129, 347–355. [Google Scholar] [CrossRef]
- Wong, A.O.L.; Zhou, H.; Jiang, Y.; Ko, W.K.W. Feedback regulation of growth hormone synthesis and secretion in fish and the emerging concept of intrapituitary feedback loop. Comp. Biochem. Physiol. Part A Mol. Integr. Physiol. 2006, 144, 284–305. [Google Scholar] [CrossRef] [PubMed]
- Pandofli, M.; Pozzi, A.G.; Canepa, M.; Vissio, P.G.; Shimizu, A.; Maggese, M.C.; Lobo, G. Presence of β-Follicle-Stimulating Hormone and β Luteinizing Hormone transcripts in the brain of Cichlasoma dimerus (Perciformes: Cichlidae). Neuroendocrinology 2009, 89, 27–37. [Google Scholar] [CrossRef]
- Lin, C.; Jiang, X.; Hu, G.; Ko, W.K.; Wong, A.O.L. Grass carp prolactin: Molecular cloning, tissue expression intrapituitary autoregulation by prolactin and paracrine regulation by growth hormone and luteinizing hormone. Mol. Cell Endocrinol. 2015, 399, 267–283. [Google Scholar] [CrossRef]
- Mylonas, C.C.; Fostier, A.; Zanuy, S. Broodstock management and hormonal manipulations of fish reproduction. Gen. Comp. Endocrinol. 2010, 165, 516–534. [Google Scholar] [CrossRef]
- Kazeto, Y.; Kohara, M.; Miura, T.; Miura, C.; Yamaguchi, S.; Trant, J.M.; Adachi, S.; Yamauchi, K. Japanese eel follicle-stimulating hormone (Fsh) and luteinizing hormone (Lh): Production of biologically active recombinant Fsh and Lh by Drosophila S2 cells and their differential actions on the reproductive biology. Biol. Reprod. 2008, 79, 938–946. [Google Scholar] [CrossRef] [PubMed]
- Brooks, S.A. Appropriate glycosylation of recombinant proteins for human use. Implication of choice of expression system. Mol. Biotech. 2004, 28, 241–255. [Google Scholar] [CrossRef] [PubMed]
- Kobayashi, M.; Hayakawa, Y.; Park, W.; Banba, A.; Yoshizaki, G.; Kumamaru, K.; Kagawa, H.; Kaki, H.; Nagaya, H.; Sohn, Y.C. Production of recombinant Japanese eel gonadotropins by baculovirus in silkworm larvae. Gen. Comp. Endocrinol. 2010, 16, 379–386. [Google Scholar] [CrossRef] [PubMed]
- Choi, J.H.; Kim, D.J.; Hong, S.M.; Jo, S.J.; Min, K.S.; Sohn, Y.C.; Lee, J.M.; Kusakabe, T. Molecular analysis and bioactivity of luteinizing hormone from Japanese eel, Anguilla japonica, produced in silkworm pupae. Biotechnol. Bioprocess. Eng. 2016, 21, 381–388. [Google Scholar] [CrossRef]
- Peñaranda, D.S.; Gallego, V.; Rozenfeld, C.; Herranz-Jusdado, J.G.; Pérez, L.; Gómez, A.; Giménez, I.; Asturiano, J.F. Using specific recombinant gonadotropins to induce spermatogenesis and spermiation in the European eel (Anguilla anguilla). Theriogenology 2018, 107, 6–20. [Google Scholar] [CrossRef]
- Ramos-Júdez, S.; Giménez, J.; Gumbau-Pous, J.; Arnold- Cruañes, L.S.; Estévez, A.; Duncan, N. Recombinant Fsh and Lh therapy for spawning induction of previtellogenic and early spermatogenic arrested teleost, the flathead grey mullet (Mugil cephalus). Sci. Rep. 2022, 12, 6563. [Google Scholar] [CrossRef]
- Chai, Y.; Tosaka, R.; Abe, T.; Sago, K.; Sago, Y.; Hatanaka, E.; Ijiri, S.; Adachi, S. The relationship between the developmental stage of oocytes in various seasons and the quality of the egg obtained by artificial maturation in the feminized Japanese eel Anguilla japonica. Aquac. Sci. 2010, 58, 269–278. [Google Scholar] [CrossRef]
- Ijiri, S.; Tsukamoto, K.; Chow, S.; Kurogi, H.; Adachi, S.; Tanaka, H. Controlled reproduction in the Japanese eel (Anguilla japonica), past and present. Aquac. Europe. 2011, 36, 13–17. [Google Scholar]
- Mes, D.; Dirks, R.P.; Palstra, A.P. Simulated migration under mimicked photothermal conditions enhances sexual maturation of farmed European eel (Anguilla anguilla). Aquaculture 2016, 452, 367–372. [Google Scholar] [CrossRef]
- Palstra, A.P.; Bouwan, L.J.; Jéhannet, P.; Kruijt, L.; Schipper, H.; Blokland, M.H.; Swinkels, W.; Heinsbroek, L.T.N.; Lokman, P.M. 17α-methyltestosterone and 17β-estradiol implants for the induction of vitellogenesis in feminized European silver eels (Anguilla anguilla L.). Front. Genet. 2022, 13, 969202. [Google Scholar] [CrossRef]
- Pankhurst, N.W. Relation of visual changes to the onset of sexual maturation in the European eel Anguilla anguilla (L.). J. Fish Biol. 1982, 21, 127–140. [Google Scholar] [CrossRef]
- Kagawa, H.; Horiuchi, Y.; Kasuga, Y.; Kishi, T. Oocyte hydration in the Japanese eel (Anguilla japonica) during meiosis resumption and ovulation. J. Exp. Zool. 2011, 311, 752–762. [Google Scholar] [CrossRef]
- Schindelin, J.; Arganda-Carreras, I.; Frise, E.; Kaynig, V.; Longair, M.; Pietzsch, T.; Preibisch, S.; Rueden, C.; Saalfeld, S.; Schmid, B.; et al. Fiji: An open-source platform for biological-image analysis. Nat. Methods 2012, 9, 676–682. [Google Scholar] [CrossRef] [PubMed]
- Unuma, T.; Hasegawa, N.; Sawaguchi, S.; Tanaka, T.; Matsubara, T.; Nomura, K.; Tanaka, H. Fusion of lipid droplets in Japanese eel oocytes: Stage classification and its use as a biomarker for induction of final oocyte maturation and ovulation. Aquaculture 2011, 322–323, 142–148. [Google Scholar] [CrossRef]
- Koressaar, T.; Remm, M. Enhancements and modifications of primer design program Primer3. Bioinformatics 2007, 23, 1289–1291. [Google Scholar] [CrossRef]
- Untergasser, A.; Cutcutache, I.; Koressaar, T.; Ye, J.; Faircloth, B.C.; Remm, M.; Rozen, S.G. Primer3–new capabilities and interfaces. Nucl. Acids Res. 2012, 40, e115. [Google Scholar] [CrossRef]
- Setiawan, A.N.; Lokman, P.M. The use of reference gene selection programs to study the silvering transformation in a freshwater eel Anguilla australis: A cautionary tale. BMC Mol. Biol. 2010, 11, 75. [Google Scholar] [CrossRef]
- Morini, M.; Peñaranda, D.S.; Vilchez, M.; Nourizadeh-Lillabadi, R.; Lafont, A.G.; Dufour, S.; Asturiano, J.F.; Weltzien, F.A.; Pérez, L. Nuclear and membrane progestin receptors in the European eel: Characterization and expression in vivo through spermatogenesis. Comp. Biochem. Physiol. Part A Mol. Integr. Physiol. 2017, 207, 79–92. [Google Scholar] [CrossRef]
- Zadmajid, V.; Falahatimarvast, A.; Damsteegt, E.L.; Setiawan, A.N.; Ozaki, Y.; Shoae, A.; Lokman, P.M. Effects of 11-ketotestosterone and temperature on inhibin subunit mRNA levels in the ovary of the shortfinned eel, Anguilla australis. Comp. Biochem. Phys. B. 2015, 187, 14–21. [Google Scholar] [CrossRef]
- Maugars, G.; Dufour, S. Demonstration of the coexistence of duplicated LH receptors in teleosts, and their origin in ancestral Actinopterygians. PLoS ONE 2015, 10, e0135184. [Google Scholar] [CrossRef]
- Livak, K.J.; Schmittgen, T.D. Analysis of relative gene expression data using real- time quantitative PCR and the 2−ΔΔCT method. Methods 2001, 25, 402–408. [Google Scholar] [CrossRef]
- Jéhannet, P.; Heinsbroek, L.T.N.; Palstra, A.P. Ultrasonography to assist with timing of spawning in European eel. Theriogenology 2017, 101, 73–80. [Google Scholar] [CrossRef]
- Bureau du Colombier, S.; Jacobs, L.; Gesset, C.; Elie, P.; Lambert, P. Ultrasonography as a non-invasive tool for sex determination and maturation monitoring in silver eels. Fish. Res. 2015, 164, 50–58. [Google Scholar] [CrossRef]
- Kahn, I.A.; Lopez, E.; Leloup-Hâtey, J. Induction of spermatogenesis and spermiation by a single injection of human chorionic gonadotropin in intact and hypophysectomised immature European eel (Anguilla anguilla L.). Gen. Comp. Endocrinol. 1987, 68, 91–103. [Google Scholar] [CrossRef]
- Pérez, L.; Asturiano, J.F.; Tomás, A.; Zegrari, S.; Barrera, R.; Espinós, F.J.; Navarro, J.C.; Jover, M. Induction of maturation and spermiation in the male European eel: Assessment of sperm quality throughout treatment. J. Fish Biol. 2005, 57, 1488–1504. [Google Scholar] [CrossRef]
- Peñaranda, D.S.; Pérez, L.; Gallego, V.; Barrera, R.; Jover, M.; Asturiano, J.F. European eel sperm diluent for short-term storage. Reprod. Domest. Anim. 2010, 45, 407–415. [Google Scholar] [CrossRef] [PubMed]
- Ko, H.; Park, W.; Kim, D.J.; Kobayashi, M.; Sohn, Y.C. Biological activities of recombinant Manchurian trout FSH and LH: Their receptor specificity, steroidogenic and vitellogenic potencies. J. Mol. Endocrinol. 2007, 38, 99–111. [Google Scholar] [CrossRef]
- Palstra, A.P.; Jéhannet, P.; Heinsbroek, L.T.N.; Lokman, P.M.; Vesala, S.; Tulonen, J.; Lakka, T.; Saukkonen, S. First observation of a spontaneously matured female European eel (Anguilla anguilla). Sci. Rep. 2020, 10, 2339. [Google Scholar] [CrossRef]
- Palstra, A.P. Energetic Requirements and Environmental Constraints of Reproductive Migration and Maturation of European Silver eel (Anguilla anguilla L.). 2006. Available online: https://hdl.handle.net/1887/4926 (accessed on 23 January 2023).
- Palstra, A.P.; van den Thillart, G.E.E.J.M. Swimming physiology of European silver eels (Anguilla anguilla L.): Energetic costs and effects on sexual maturation and reproduction. Fish Physiol. Biochem. 2010, 36, 297–322. [Google Scholar] [CrossRef]
- Kim, N.S.L.; Park, C.W.; Kim, D.W.; Park, H.K.; Byambaragchaa, M.; Lee, N.S.; Hong, S.M.; Seo, M.Y.; Kang, M.H.; Min, K.S. Production and characterization of monoclonal antibodies against recombinant tethered follicle-stimulating hormone from Japanese eel Anguilla japonica. Gen. Comp. Endocrinol. 2016, 233, 8–15. [Google Scholar] [CrossRef][Green Version]
- Kucharczyk, D.; Czarkowski, T.; Nowosad, J.; Targonska, K.; Kupren, K.; Wyszomirska, E.; Kujawa, R.; Horváth, L.; Müller, T. Influence of temperature on successful European eel female maturation under controlled conditions. Turkish J. Fish. Aquat. Sci. 2016, 16, 477–482. [Google Scholar] [CrossRef]
- Tanaka, T.; Adachi, S.; Nomura, K.; Tanaka, H.; Unuma, T. Effects of rearing temperature manipulation on oocyte maturation progress in Japanese eel. Fish. Sci. 2021, 87, 681–691. [Google Scholar] [CrossRef]
- Zhu, Y.; Rice, C.D.; Pang, Y.; Pace, M.; Thomas, P. Cloning, expression, and characterization of a membrane progestin receptor and evidence it is an intermediary in meiotic maturation of fish oocytes. Proc. Natl. Acad. Sci. USA 2003, 100, 2231–2236. [Google Scholar] [CrossRef]
- Thomas, P.; Pang, Y.; Zhu, Y.; Detweiler, C.; Doughty, K. Multiple rapid progestin actions and progestin membrane receptor subtypes in fish. Steroids 2004, 69, 567–573. [Google Scholar] [CrossRef]
- Kazeto, Y.; Goto-Kazeto, R.; Trant, J.M. Membrane-bound progestin receptors in channel catfish and zebrafish ovary: Changes in gene expression associated with the reproductive cycles and hormonal reagents. Gen. Comp. Endocrinol. 2005, 142, 204–211. [Google Scholar] [CrossRef] [PubMed]
- Hagiwara, A.; Ogiwara, K.; Katsu, Y.; Takahashi, T. Luteinizing hormone-induced expression of Ptger4b, a prostaglandin E2 receptor indispensable for ovulation of the medaka Oryzias latipes, is regulated by a genomic mechanism involving nuclear progestin receptor. Biol. Reprod. 2014, 90, 1–14. [Google Scholar] [CrossRef] [PubMed]
- Hagiwara, A.; Ogiwara, K.; Takahashi, T. Expression of membrane progestin receptors (mPRs) in granulosa cells of medaka preovulatory follicles. Zool. Sci. 2016, 33, 98–105. [Google Scholar] [CrossRef]
- Mourot, B.; Nguyen, T.; Fostier, A.; Bobe, J. Two unrelated putative membrane-bound progestin receptors, progesterone membrane receptor component I (PGMRCI) and membrane progestin receptor (mPR) beta, are expressed in the rainbow trout oocyte and exhibit similar ovarian expression patterns. Reprod. Biol. Endocrinol. 2006, 4, 6. [Google Scholar] [CrossRef] [PubMed]
- Thomas, P.; Pinter, J.; Das, S. Upregulation of the maturation-inducing steroid membrane receptor in spotted seatrout ovaries by gonadotropin during oocyte maturation and its physiological significance. Biol. Reprod. 2001, 64, 21–29. [Google Scholar] [CrossRef]
- Thomas, P.; Dressing, G.; Pang, Y.; Berg, H.; Tubbs, C.; Benninghoff, A.; Doughty, K. Progestin, estrogen and androgen G-protein coupled receptors in fish gonads. Steroids 2006, 71, 310–316. [Google Scholar] [CrossRef]
- Aizen, J.; Pang, Y.; Harris, C.; Converse, A.; Zhu, Y.; Aguirre, M.A.; Thomas, P. Roles of progesterone receptor membrane component 1 and membrane progestin receptor alpha in regulation of zebrafish oocyte maturation. Gen. Com. Endocrinol. 2018, 263, 51–61. [Google Scholar] [CrossRef]
- Kazeto, Y.; Mayuko, K.; Ryoata, T.; Koichiro, G.; Yokoyama, M.; Miura, C.; Miura, T.; Adachi, S.; Yamauchi, K. Molecular characterization and gene expression of Japanese eel (Anguilla anguilla) gonadotropin receptors. Zool. Sci. 2012, 29, 204–211. [Google Scholar] [CrossRef]
- Sambroni, E.; Le Gac, F.; Breton, B.; Lareyre, J.J. Functional specificity of the rainbow trout (Oncorhynchus mykiss) gonadotropin receptors as assayed in mammalian cell line. J. Endocrinol. 2007, 195, 213–228. [Google Scholar] [CrossRef]
- Bobe, J.; Nguyen, T.; Jalabert, B. Targeted gene expression profiling in rainbow trout (Oncorhynchus mykiss) Ovary during maturational competence acquisition and oocyte maturation. Biol. Reprod. 2004, 71, 73–82. [Google Scholar] [CrossRef] [PubMed]
- Crowder, C.M.; Lassiter, C.S.; Gorelick, D.A. Nuclear androgen receptor regulates testes organization and oocyte maturation in zebrafish. Endocrinology 2018, 159, 980–993. [Google Scholar] [CrossRef]
- Li, J.; Huang, D.; Sun, X.; Li, X.; Cheng, C.H.K. Zinc mediates the action of androgen in acting as a downstream effector of luteinizing hormone on oocyte maturation in zebrafish. Biol. Reprod. 2019, 100, 468–478. [Google Scholar] [CrossRef] [PubMed]
- Robker, R.; Akison, L.K.; Russell, D.L. Control of oocyte release by progesterone-regulated gene expression. Nucl. Recept. Signal. 2009, 7, nrs-07012. [Google Scholar] [CrossRef]
- Tang, H.; Liu, Y.; Li, J.; Yin, Y.; Li, G.; Chen, Y.; Li, S.; Zhang, Y.; Lin, H.; Liu, X.; et al. Gene knockout of nuclear progesterone receptor provides insights into the regulation of ovulation by Lh signalling in zebrafish. Sci. Rep. 2016, 6, 28545. [Google Scholar] [CrossRef]
- Liu, D.T.; Carter, N.J.; Wu, X.J.; Hong, W.S.; Chen, S.X.; Zhu, Y. Progestin and nuclear progestin receptor are essential for upregulation of metalloproteinase in zebrafish preovulatory follicles. Front. Endocrinol. 2018, 9, 517. [Google Scholar] [CrossRef] [PubMed]
- Yamauchi, K. Studies of gonadal steroids involved in final gonadal maturation in the Japanese eel, Anguilla japonica, a review. Int. Revue Ges. Hydrobiol. 1990, 75, 859–860. [Google Scholar] [CrossRef]


Disclaimer/Publisher’s Note: The statements, opinions and data contained in all publications are solely those of the individual author(s) and contributor(s) and not of MDPI and/or the editor(s). MDPI and/or the editor(s) disclaim responsibility for any injury to people or property resulting from any ideas, methods, instructions or products referred to in the content. |
© 2023 by the authors. Licensee MDPI, Basel, Switzerland. This article is an open access article distributed under the terms and conditions of the Creative Commons Attribution (CC BY) license (https://creativecommons.org/licenses/by/4.0/).