Article

Light Intensity and Photoperiod Interaction Affects the Survival, Development, Molting and Apoptosis-Related Genes of Swimming Crab Portunus trituberculatus Larvae

1
Key Laboratory of Aquacultural Biotechnology, Ningbo University, Chinese Ministry of Education, 818 Fenghua Road, Ningbo 315211, China
2
Marine Economic Research Center, Dong Hai Strategic Research Institute, Ningbo University, 818 Fenghua Road, Ningbo 315211, China
3
Collaborative Innovation Center for Zhejiang Marine High-Efficiency and Healthy Aquaculture, 818 Fenghua Road, Ningbo 315211, China
4
Key Laboratory of Green Mariculture (Co-Construction by Ministry and Province), Ministry of Agriculture and Rural, Ningbo 315211, China
5
Key Laboratory of Environment Controlled Aquaculture (KLECA), Ministry of Education, 52 Heishijiao Street, Dalian 116023, China
*
Author to whom correspondence should be addressed.
Fishes 2023, 8(5), 221; https://doi.org/10.3390/fishes8050221
Submission received: 22 March 2023 / Revised: 13 April 2023 / Accepted: 19 April 2023 / Published: 23 April 2023
(This article belongs to the Section Environment and Climate Change)

Abstract

:
A 19-day experiment was conducted to investigate the optimal light intensity and photoperiod combination for larval swimming crabs Portunus trituberculatus in terms of survival, development, and apoptosis-related gene expression. Two photoperiods, i.e., 12 and 18 h photophases, and three light intensities, i.e., 126.08, 173.17, and 191.53 μmol m−2 s−1, were used in the study. The results showed that the cumulative survival rate (CSR) of larvae decreased with the increasing light intensity, and the adverse effect of high light intensity was only observed in long photophase groups. On the contrary, a long photophase and low light intensity elevated the CSR from zoea III to juvenile crabs. A long photophase also accelerated the development of zoea III larvae and upregulated the molting-related (ecr and rxr) and apoptosis-related (jnk, p53, and bcl-2) gene expressions. Taken together, the present study suggested that the light intensity and the photoperiod had a combined effect on P. trituberculatus larvae. The optimal light intensity and photoperiod for P. trituberculatus larvae were 126.08 μmol m−2 s−1 and an 18 h photophase, respectively.
Key Contribution: 1. The light intensity and photoperiod interaction significantly affected the survival and development of swimming crab Portunus trituberculatus larvae. 2. The survival rate of larvae decreased with the increasing light intensity in the long photophase groups. 3. The long photophase upregulated molting and apoptosis-related gene expression. 4. The optimal light intensity and photoperiod for larval P. trituberculatus were 126.08 μmol m−2 s−1 and an 18 h photophase, respectively.

1. Introduction

Swimming crab (Portunus trituberculatus) is a high-value marine crab species widespread in Far East Asia [1,2]. In China, the total production reached 525,525 tons in 2020, of which 100,895 tons were aquacultured [3]. At present, the juvenile P. trituberculatus are mainly produced in earthen ponds [4]. The spawned female crabs are kept in fertilized ponds rich in microalgae and zooplankton until larvae release. The larvae feed on natural food in the pond and are collected when they develop into juvenile crabs. However, limited by the uncontrollable environment, the quality and quantity of the seeds are not always stable [5]. In recent years, the indoor nursery of P. trituberculatus has been developing fast [6]. With a controllable environment, the production is expected to be precisely controlled. Nevertheless, the fundamental environmental needs of the P. trituberculatus larvae indoor nursery, such as the light requirements, remain little known [6].
Light, including light intensity and photoperiod, has been widely demonstrated to influence the survival and development of crabs [7,8,9,10,11,12] and the effects vary for different species and developmental stages. For the mud crab Scylla paramamosain, the optimum light intensities for the juvenile and adult are 11.36-18.27 W m−2 (ca. 60.55–97.38 μmol m−2 s−1) [12] and 1.43 μmol m−2 s−1 [13,14], respectively. For larval P. trituberculatus, the suitable light intensity decreased from 195.31 to 124.31 μmol m−2 s−1 as zoea developed into megalopa [6]. As for the photoperiod, some previous studies concluded that constant darkness had advantageous effects on the survival and development of red frog crab Ranina ranina [15]. However, larval P. trituberculatus could not complete the entire larval cycle without light [6]. Furthermore, the light intensity and photoperiod in aquaculture practice are not independent. For example, Pseudocarcinus gigas larvae had a shorter intermolt period in brighter light and longer photoperiods [16]. Thus, it is crucial to simultaneously study light intensity, photoperiod, and their interactions to define the optimum light protocol.
Our previous work has studied the optimal light intensity (124.31–195.31 μmol m−2 s−1) [6] and photoperiod (12–18 h photophase) (unpublished data) for P. trituberculatus larvae. This study aims to further investigate the interaction of light intensity and photoperiod on P. trituberculatus by examining the survival, development, molting, and apoptosis-related genes. The results could help define the suitable lighting protocol for a P. trituberculatus nursery.

2. Material and Method

2.1. Experimental Design and Management

This experimental scheme was approved by the Animal Care and Use Committee of Ningbo University and carried out in May and June 2020 at the School of Marine Sciences, Ningbo University. The newly hatched zoea I of captive breeding were purchased from a Chou Pi Jiang commercial nursery (Ningbo, China), and 2400 healthy zoea I larvae with intact limbs and strong phototaxis were randomly distributed into 24 transparent glass beakers (ShuNiu, volume 1 L, d = 11 cm, h = 15 cm) (100 individuals per beaker per L).
The schematic diagram of experimental design is shown in Figure 1. Six different light regimes were designed using full-spectrum LED as the light source: 12 h photophase—126.08 μmol m−2 s−1 (12-LI), 12 h photophase—173.17 μmol m−2 s−1 (12-MI), 12 h photophase—191.53 μmol m−2 s−1 (12-HI), 18 h photophase—126.08 μmol m−2 s−1 (18-LI), 18 h photophase—173.17 μmol m−2 s−1 (18-MI), and 18 h photophase—191.53 μmol m−2 s−1 (18-HI). Each treatment had four replicates (Table 1). A full-spectrum LED strip light (Yaminjie Intelligent Technology Co., Ltd., Shenzhen, China) was placed in the water surface of beakers (open status), and the LED lights were the only source of light. The environment where the beaker was placed was in a constant temperature with a shading cloth. The light intensity was adjusted by regulating the power of the light source and the distance from the water surface. Light intensity was measured with a professional illuminance meter (PLA-30, EVERFINE, Hangzhou, China), and the photoperiod was controlled by a timer (on at 6:00 and off at 18:00 or 24:00). The larvae were fed with Artemia nauplii (10 individuals mL−1) twice a day at 8:00 am and 5:00 pm. In the environment, 2/3 natural sea water was changed the following day with same source sea water. Gas exchange was performed at the surface of the water. At the same time, the metamorphosed and dead larvae were counted. Once the larvae metamorphosed to the next stage, all were moved into a new beaker of the same size to reduce cannibalism. When the larvae metamorphosed into juvenile crabs, they were immediately anesthetized, frozen in liquid nitrogen, and stored at −80 °C for further analysis. The water quality parameters during the experiment were salinity, 23–25 psu; temperature, 24–25 °C; pH, 8–8.5; dissolved oxygen, ≥6 mg L−1; and nitrite nitrogen < 0.1 mg L−1.

2.2. Gene Expression Analysis

The total RNA of juvenile crabs was extracted with a commercial kit RNA isolator (R401-01, Vazyme, Nanjing, China). Subsequently, ultramicro spectrophotometer (nano, MaestroGEN, Taiwan, China) and 1% gel electrophoresis were used to check the purity and integrity of total RNA. The cDNA was synthesized with a HiFiScript cDNA synthesis kit (CW2569M, CWBIO, Beijing, China).
The relative expression of jnk, p53, bcl-2, ecr, rxr, e75, and mih were analyzed by real-time PCR (LightCycler480, Roche, USA) with MagicSYBR Mixture kit (CW3008H, CWBIO, Beijing, China). The total volume was 20 μL (10 μL of 2 × MagicSYBR Mixture, 1 μL of cDNA, 0.4 μL of each primer (10 μM), and 8.2 μL of ddH2O). The β-actin was chosen as a housekeeping gene. The specific primers used in this study are listed in Table 2 (Youkang Biological Technology Co., Ltd., Hangzhou, China). The conditions of real-time PCR were as follows: 95 °C for 30 s; 40 cycles at 95 °C for 5 s and 60 °C for 30 s; and 95 °C for 15 s. The relative expression level of target genes was calculated by the 2−ΔΔCT method [17].

2.3. Calculations

The staged and cumulative survival rate was calculated by the following formulae:
Staged survival rate (%, SSR) = 100 × Ns/Np
Cumulative survival rate (%, CSR) = 100 × Ns/Ni
Cumulative development duration (days): the days from Zoea I to Megalopa, where Ns is the number of larvae in each stage, Np is the number of larvae in the previous stage, and Ni is the number of larvae at the start of the experiment (100).

2.4. Statistical Analysis

Before analysis, the survival rate data were converted with arcsine square-root transformation to get a continuous probability distribution. Then, all data were checked for normal distribution and variance homogeneity by the Kolmogorov–Smirnov test and Levene’s test. For light intensity, the homogeneous and normal data were compared with one-way ANOVA, followed by Duncan’s multiple comparison post hoc test; otherwise, a nonparametric test (Kruskal–Wallis tests) was applied. For photoperiod, Student’s t-test was used to compare the significance of differences between treatments. Finally, two-way ANOVA was used to compare whether there was an interaction between light intensity and photoperiod. p < 0.05 and p < 0.01 were considered significant differences and extremely significant differences, respectively. All statistical analyses were performed on SPSS 22.0 software.

3. Results

3.1. The Staged Survival Rate

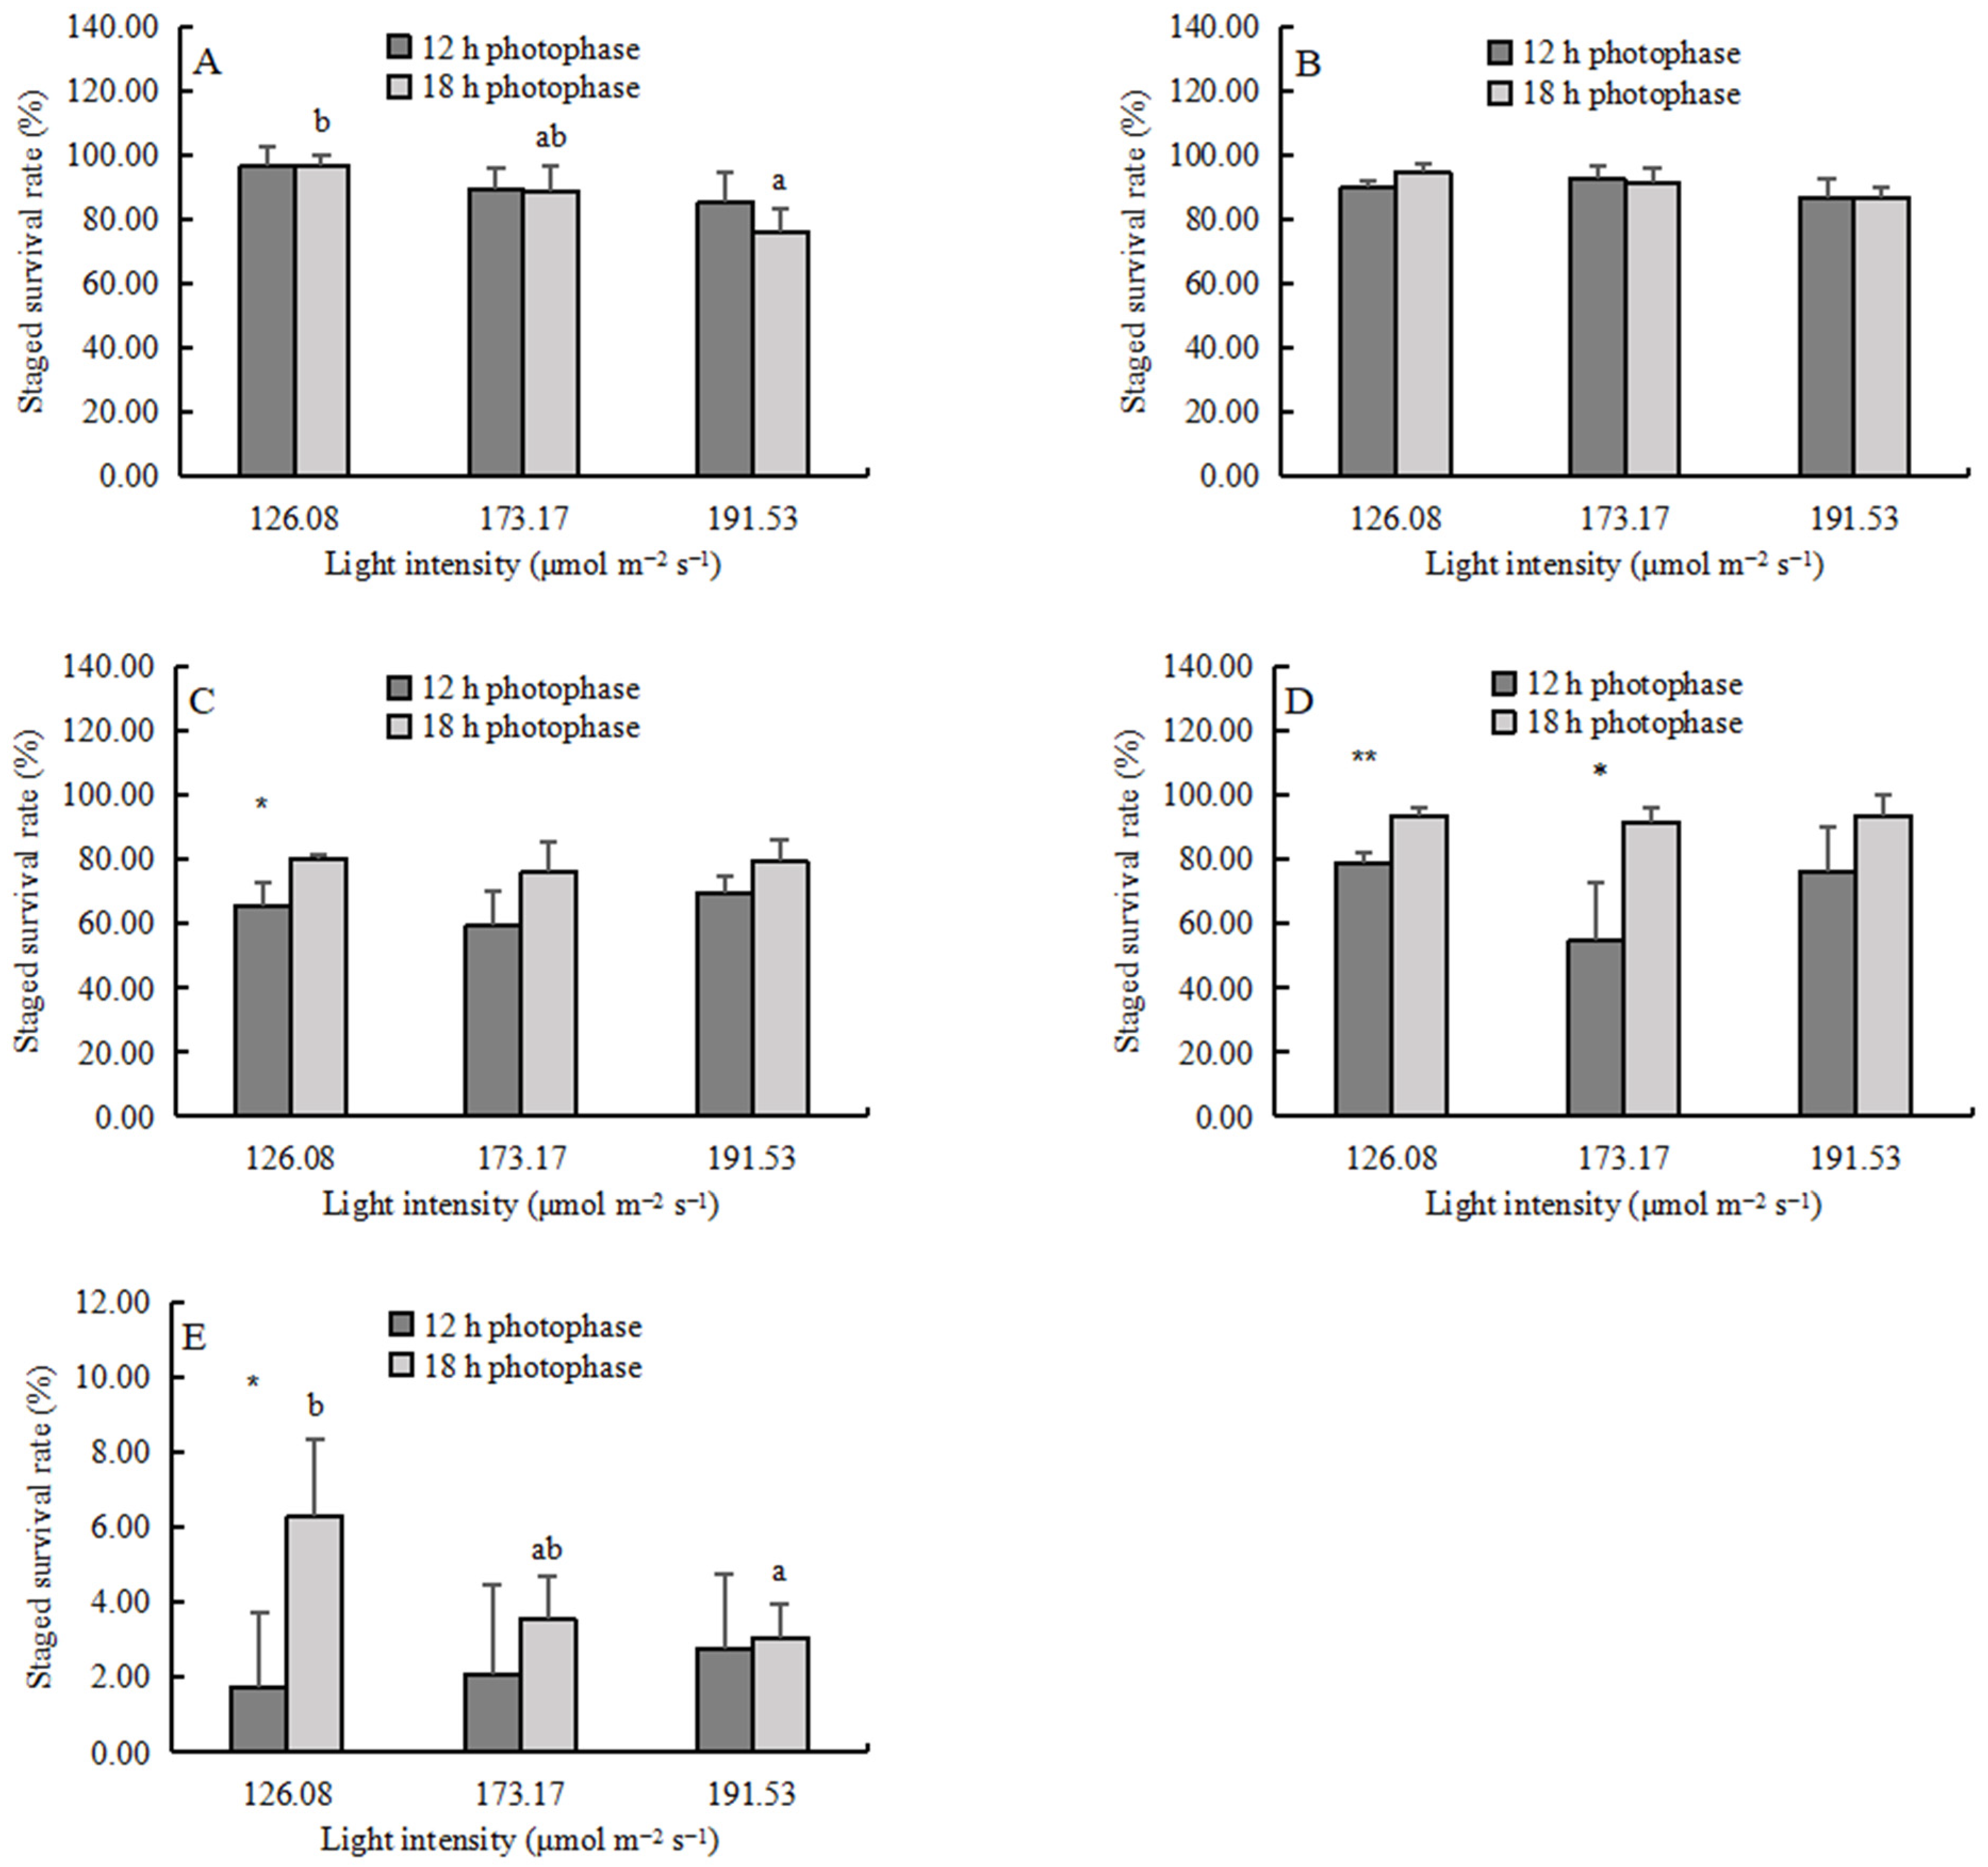
The SSR of zoea I decreased significantly with increasing light intensity (Figure 2A) (p < 0.05), but the SSR of zoea II-zoea IV was not affected by light intensity (Figure 2B–D). The SSR of the megalopa decreased significantly with increasing light intensity in the 18 h photophase group (p < 0.05) (Figure 2E). The photoperiod did not affect the SSR of zoea I and zoea II (Figure 2A,B). However, the 18 h photophase significantly increased the SSR of zoea III-megalopa (p < 0.05) (Table 3, Figure 2C–E). No interaction between the light intensity and the photoperiod on SSR was observed in any developmental stages (Table 3).

3.2. The Cumulative Survival Rate

The cumulative survival rate (CSR) decreased significantly with increasing light intensity in the 18 h photophase group (Figure 3) (p < 0.05). The photoperiod did not affect the CSR of zoea I and zoea II (Figure 3A,B), but the 18 h photophase significantly increased the CSR of zoea III-megalopa (p < 0.01) (Figure 3C,D). For zoea III and zoea IV, there was a significant interaction between photoperiod and light intensity (Table 3).

3.3. The Cumulative Development Duration

The cumulative development duration (CDD) of zoea I, zoea II, and megalopa was not affected by the light intensity (Figure 4A,B, Table 3). The CDD of zoea III and zoea IV was significantly shorter in the MI group under the 12h photophase (p < 0.05) (Figure 4C,D). The photoperiods did not affect the CDD of zoea I, zoea II, and megalopa (Figure 4A,B, Table 3). For zoea III, the LI and HI groups had significantly shorter CDD under the 18 h photophase (p < 0.01) (Figure 4C). For megalopa, the CDD was significantly longer in the 18 photophase group under HI (p < 0.01) (Figure 4E). The interaction of the light intensity and the photoperiods was only found in the zoea III and zoea IV stage.

3.4. The Molting and Apoptosis-Related Gene Expression

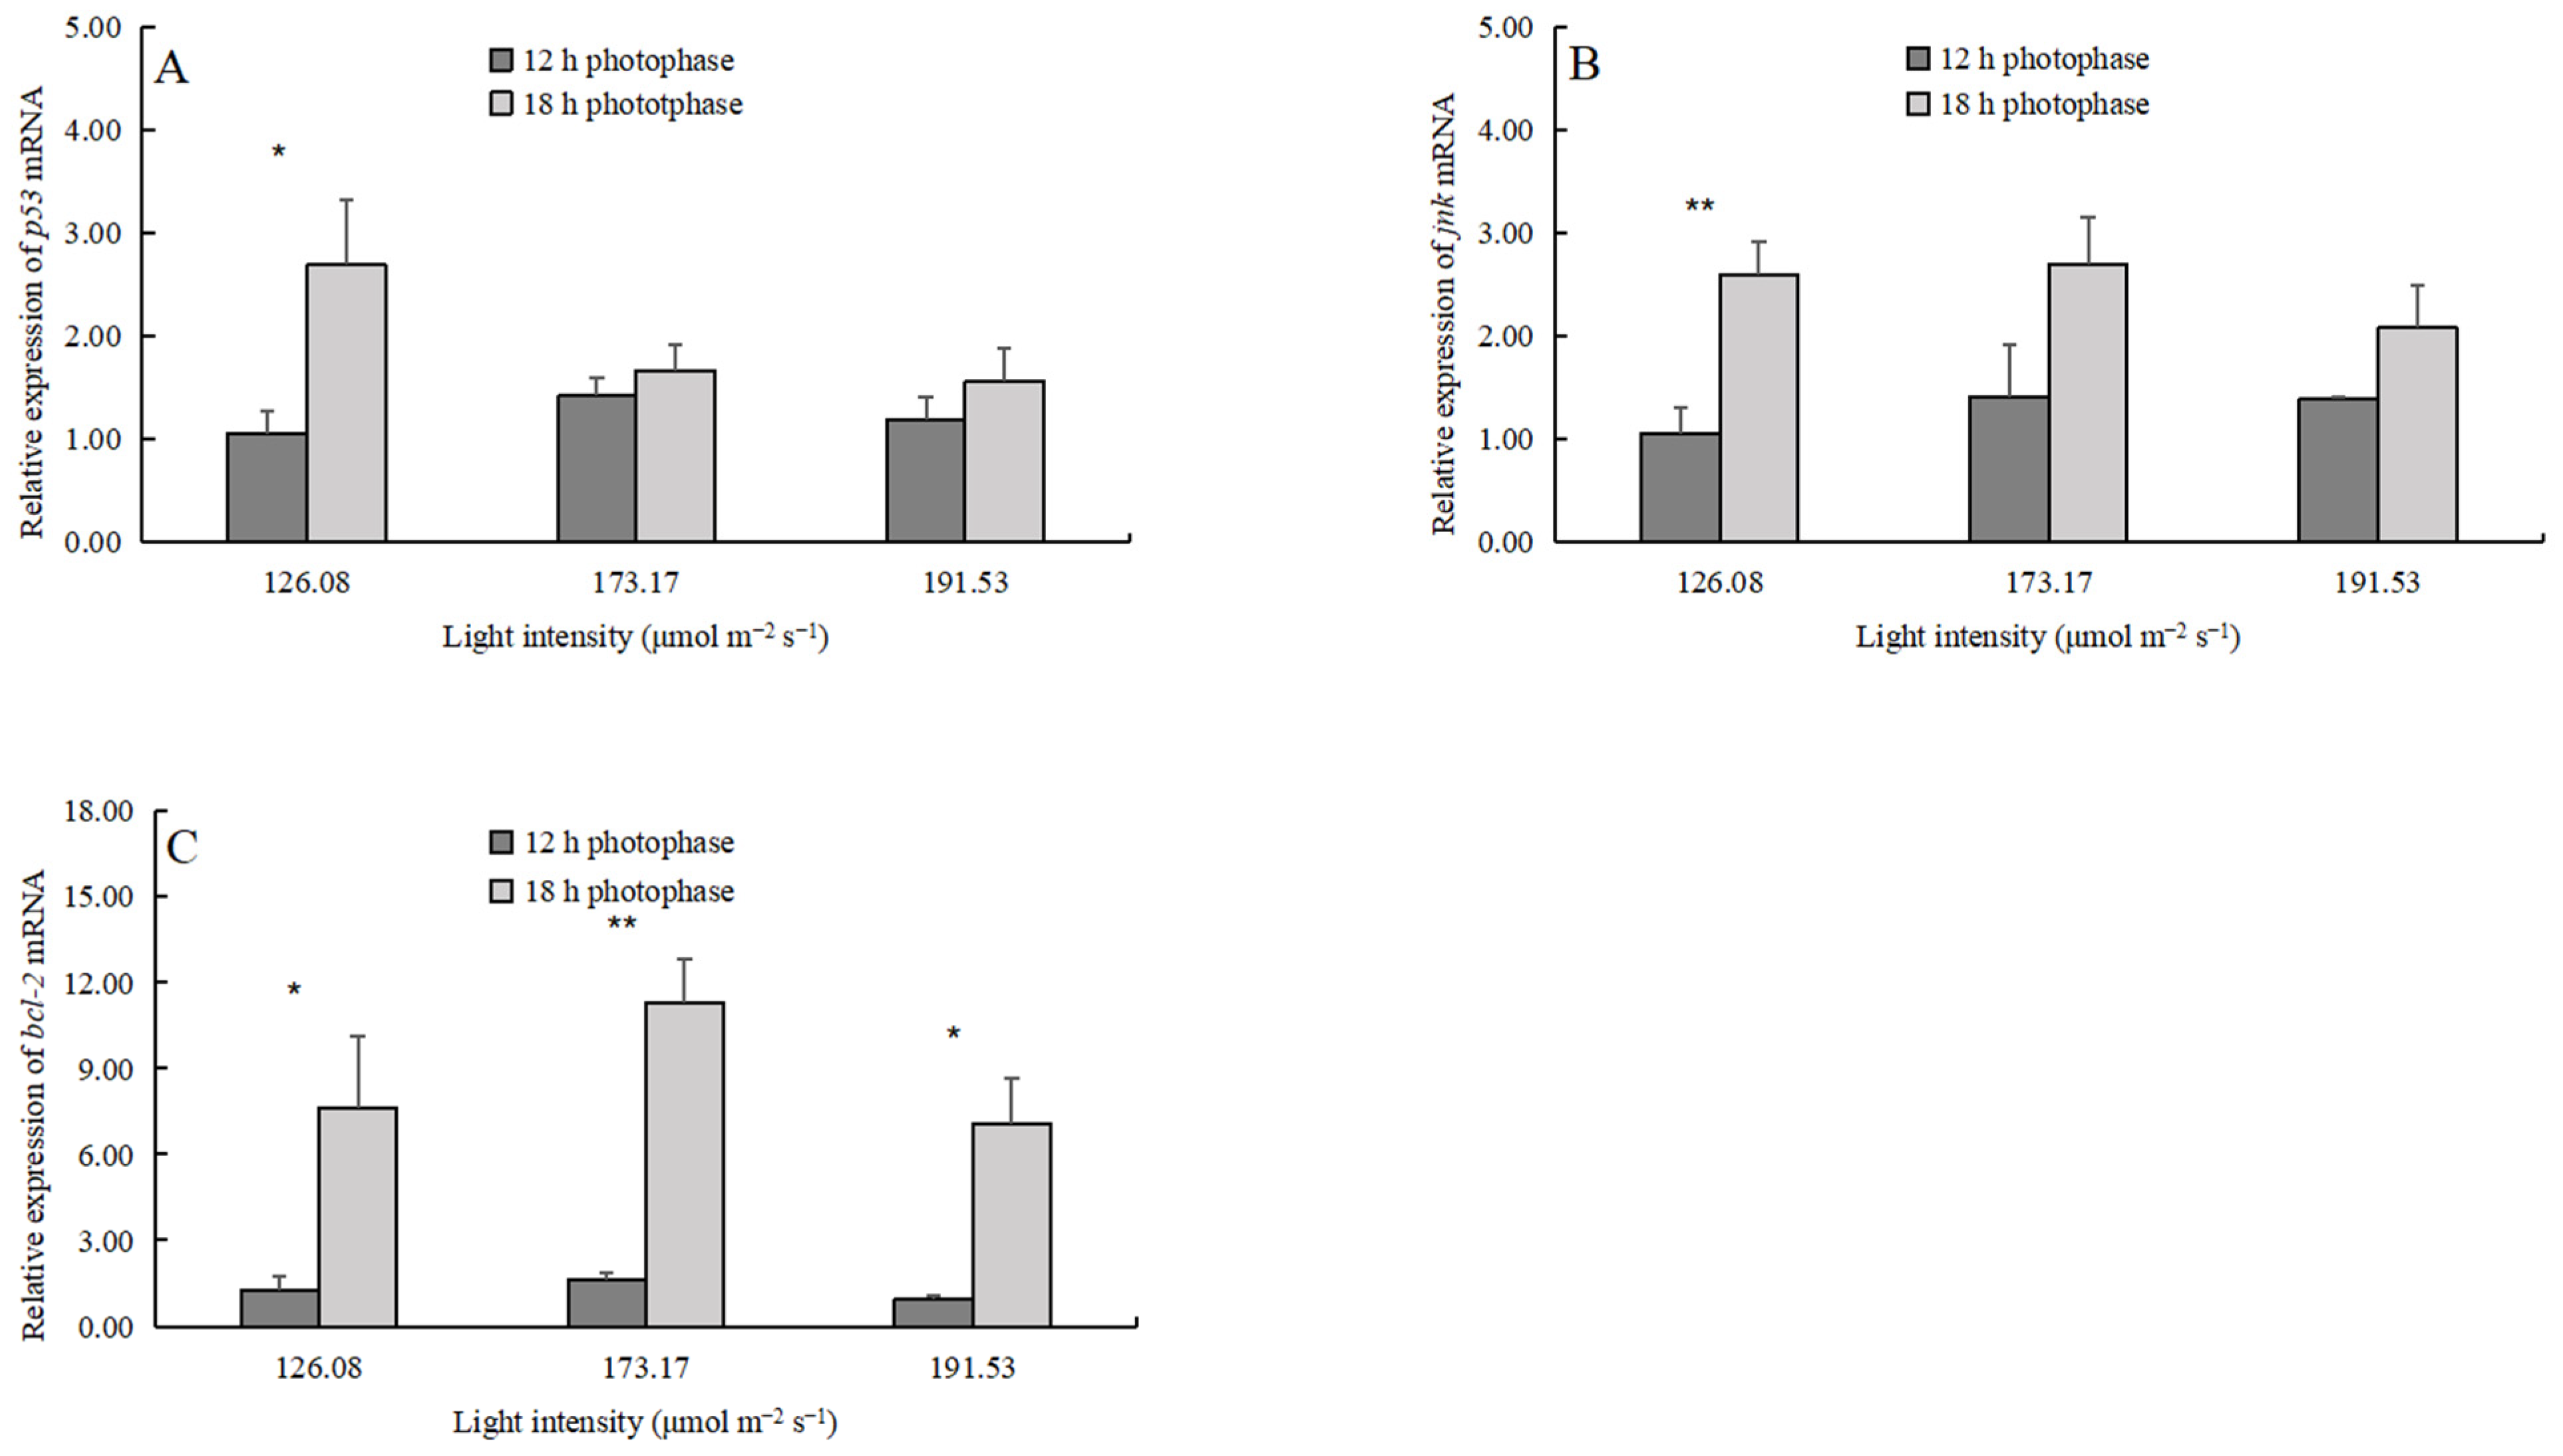
The light intensity did not affect the expression of e75, ecr, rxr, and mih (Table 3), but the 18 h photophase significantly upregulated the expression levels of ecr and rxr (Table 3, Figure 5). The light intensity did not affect the expression of jnk, p53, and bcl-2, but the 18 h photophase significantly upregulated the expression levels of these genes (Table 3, Figure 6).

4. Discussion

In this study, the SSR of zoea I larvae decreased with increasing light intensity, but it was not affected by the photoperiod (Figure 2). A similar phenomenon was also observed in spiny lobster Jasus edwardsii phyllosoma [18]. These results could be explained by the fact that the visual system of early-stage crab larvae is not fully developed. They are filter-feeders relying on random encounters rather than eyesight, as observed in blue crab Callinectes sapidus [19], red frog crab Ranina ranina [15], and P. gigas [16,20]. Thus, a prolonged photophase does not benefit predation success for early-stage larvae, while the high light intensity can be a stressor [12].
However, the prolonged photophase groups showed a higher CSR after the zoea II stage probably because, with the visual system’s maturation and physical fitness improvement, the larvae benefited more from an extended feeding duration (Figure 3). Notably, although a long photophase increased the survival rate, the high light intensity sabotaged the survival as the larvae gradually changed from pelagic to benthic [4]. Interestingly, the adverse effect of high light intensity on the CSR was only observed in the long photophase groups, suggesting that the two factors had a cumulative impact on survival [9,15].
The developmental duration is also an important indicator for evaluating the development of larvae. In the present study, neither light intensity nor photoperiod affected the development duration of zoea I and zoea II (Table 3, Figure 4A,B). By the zoea III stage, the 18-LI and 18-HI groups developed significantly faster than the 12-LI and 12-HI groups (Table 3, Figure 4C). However, the differences were not observed at the zoea IV stage (Table 3, Figure 4D). At the megalopa stage, the larvae developed significantly slower in the 18-HI group than in the 12-HI group (Table 3, Figure 4E). These results further suggest that high light intensity and a long photophase were suboptimal for the development of P. trituberculatus larvae. Similar results were found in spiny lobster Sagmariasus verreauxi [21].
Suitable light could promote the growth and development of crabs by regulating molting [12]. Molting is a process mainly controlled by two antagonistic hormones, ecdysteroid and molt-inhibiting hormone (MIH) [22]. Ecdysteroid is secreted by the Y organ, released into the hemolymph, and converted to the more active form 20-hydroxyecdysone (20E) in peripheral tissues [23]. 20E binds to a heterodimer formed by the ecdysone receptor (EcR) and the retinoid-X receptor (RXR), regulates the expression of the downstream nuclear receptor E75, and thereby controls molting and development [24,25]. MIH is a member of a novel neuropeptide family secreted by organ X [22], which inhibits ecdysteroid synthesis by directly limiting cholesterol uptake, an ecdysteroid precursor substance [23,26]. MIH could also bind to the G protein-coupled receptor (MIH-R) on the cell membrane, activate cellular signaling, and indirectly regulate ecdysone synthesis in the Y organ [27,28]. Long photophase upregulated the expression of ecr and rxr but did not affect the expression of e75 and mih (Table 3, Figure 5). Unexpectedly, the total cumulative development duration (from zoea I-juvenile crabs) was significantly longer in the 18-HI group than in the 12-HI group (Table 3, Figure 4). The result further confirmed that high light intensity [29] and a long photophase [21] could impede the growth and development of crustaceans by disturbing energy intake and consumption.
On the contrary, suboptimal light conditions could stress the crab [12]. For instance, excess reactive oxygen species (ROS) generated during stress damages the cells [30]. The organism repairs the damaged cells or induces apoptosis to maintain individual homeostasis via various pathways. For instance, c-Jun N-terminal kinase (JNK), also known as stress-activated protein kinase (SAPK), mediates the JNK signaling and is an essential branch of the mitogen-activated protein kinase (MAPK) signaling pathway. It plays a vital role in various physiological and pathological processes such as cell cycle, reproduction, apoptosis, and cellular stress [31,32,33]. JNK could activate the tumor suppressor p53 (p53) [34], an important tumor suppressor gene that repairs cell DNA damage and induces cancerous cell apoptosis [35,36]. The B-cell lymphoma-2 (Bcl-2) gene, a vital regulator of the mitochondrial apoptotic pathway, inhibits apoptosis by suppressing ROS production [37]. In the present study, the jnk and p53 expressions in the 18 h photophase group were generally higher than those in the 12 h photophase group, and 18-LI was significantly higher than 12-LI (Table 3, Figure 6A,B). Consistently with the expression of jnk and p53, the expression level of the bcl-2 was significantly higher in the 18 h photophase group than in the 12 h photophase group, independent of light intensity, indicating that a long photophase may cause cellular damage (Table 3, Figure 6C). However, the 18-LI group had a higher survival rate than the other groups, indicating that P. trituberculatus larvae maintain individual homeostasis by repairing damaged cells under low light intensity and long photophases.

5. Conclusions

In summary, both light intensity and photoperiod significantly affected the survival and development of P. trituberculatus larvae. The appropriate light intensity and photoperiod combination was 126.08 μmol m−2 s−1 and an 18 h photophase. The present study references the light regulation of P. trituberculatus nurseries. Further studies should investigate the optimal spectrum for the larval development of P. trituberculatus.

Author Contributions

Conceptualization, Y.Z. and J.D.; methodology, J.D.; software, H.X.; validation, H.X. and Y.Z.; formal analysis, J.D. and Z.M.; investigation, Z.M.; resources, Z.R.; data curation, H.X.; writing—original draft preparation, Y.Z.; writing—review and editing, C.S.; visualization, W.S.; supervision, C.M. and Y.Y.; project administration, C.W. and C.S.; funding acquisition, C.S. All authors have read and agreed to the published version of the manuscript.

Funding

This research was funded by the National Natural Science Foundation of China (Grant No. 31972783, 32172994), the Zhejiang Public Welfare Project (LGN22C19000), the Province Key Research and Development Program of Zhejiang (2021C02047), the SanNongJiuFang Zhejiang Agricultural Science and Technology Cooperation Project (2023SNJF063), the China Agriculture Research System of MOF and MARA (China Agriculture Research System of Ministry of Finance and Ministry of Agriculture and Rural Affairs), the Project of Major Agricultural Technology Cooperation Plan of Zhejiang Province (Grant No. 2020XTTGSC03 and No. 2022XTTGSC04), the K. C. Wong Magna Fund in Ningbo University, and The Basic Public Welfare Program of Zhejiang Province (Grant No. LGN22C190005).

Institutional Review Board Statement

The study was conducted according to the guidelines of the Declaration of Helsinki and approved by Animal Ethics Committee of Ningbo University.

Conflicts of Interest

The authors declare that they have no conflict of interest.

References

  1. Dai, A.Y.; Yang, S.L.; Song, Y.Z. Marine Crabs in China Sea; Marine Publishing Company: Beijing, China, 1986. [Google Scholar]
  2. Lu, J.K.; Li, R.H.; Bekaert, M.; Migaud, H.; Liu, X.; Chen, Q.W.; Zhang, W.R.; Mu, C.K.; Song, W.W.; Wang, C.L. Development and validation of SNP genotyping assays to identify genetic sex in the swimming crab Portunus trituberculatus. Aquac. Rep. 2021, 20, 100731. [Google Scholar] [CrossRef]
  3. Fisheries Bureau of Agriculture Ministry of China. China Fishery Statistical Yearbook; China Agriculture Press: Beijing, China, 2021; pp. 22–38. [Google Scholar]
  4. Wang, J.C.; Peng, K.W.; Lu, H.D.; Li, R.H.; Song, W.W.; Liu, L.; Wang, H.; Wang, C.L.; Shi, C. The effect of tank colour on growth performance, stress response and carapace colour of juvenile swimming crab Portunus trituberculatus. Aquac. Res. 2019, 50, 2735–2742. [Google Scholar] [CrossRef]
  5. Shi, C.; Wang, J.C.; Peng, K.W.; Mu, C.K.; Ye, Y.F.; Wang, C.L. The effect of tank colour on background preference, survival and development of larval swimming crab Portunus trituberculatus. Aquaculture 2019, 504, 454–461. [Google Scholar] [CrossRef]
  6. Dou, J.; Zhang, G.L.; Shi, C.; Song, C.B.; Mu, C.K.; Ye, Y.F.; Wang, C.L. High-intensity light of full-spectrum LED promotes survival rate but not development of the larval swimming crab Portunus trituberculatus. Aquac. Eng. 2021, 93, 102158. [Google Scholar] [CrossRef]
  7. Andrés, M.; Rotllant, G.; Zeng, C.S. Survival, development and growth of larvae of the blue swimmer crab, Portunus pelagicus, cultured under different photoperiod conditions. Aquaculture 2010, 300, 218–222. [Google Scholar] [CrossRef]
  8. Ravi, R.; Manisseri, M.K. The effect of different pH and photoperiod regimens on the survival rate and developmental period of the larvae of Portunus pelagicus (Decapoda, Brachyura, Portunidae). Iran. J. Fish. Sci. 2013, 12, 490–499. [Google Scholar]
  9. Hamasaki, K.; Ogiso, Y.; Dan, S.; Kitada, S. Survival, development and growth of larvae of the coconut crab, Birgus latro, cultured under different photoperiod conditions. Aquac. Res. 2016, 47, 2506–2517. [Google Scholar] [CrossRef]
  10. Castejón, D.; Rotllant, G.; Giménez, L.; Torres, G.; Guerao, G. Influence of temperature and light regime on the larval development of the common spider crab Maja brachydactyla Balss, 1922 (Brachyura: Majidae). Aquac. Res. 2018, 49, 3548–3558. [Google Scholar] [CrossRef]
  11. Ichikawa, T.; Hamasaki, K.; Murakami, K. Larval survival, development and growth in the horsehair crab, Erimacrus isenbeckii, cultured under different photoperiod conditions. Aquac. Res. 2018, 49, 2511–2517. [Google Scholar] [CrossRef]
  12. Chen, S.J.; Migaud, H.; Shi, C.; Song, C.B.; Wang, C.L.; Ye, Y.F.; Ren, Z.M.; Wang, H.; Mu, C.K. Light intensity impacts on growth, molting and oxidative stress of juvenile mud crab Scylla paramamosain. Aquaculture 2021, 545, 737159. [Google Scholar] [CrossRef]
  13. Li, N.; Zhou, J.; Wang, H.; Wang, C.; Mu, C.; Shi, C.; Liu, L. Effects of light intensity on growth performance, biochemical composition, fatty acid composition and energy metabolism of Scylla paramamosain during indoor overwintering. Aquac. Rep. 2020, 18, 100443. [Google Scholar] [CrossRef]
  14. Li, N.; Zhou, J.; Wang, H.; Wang, C.; Mu, C.; Shi, C.; Liu, L. Effect of light intensity on digestion and immune responses, plasma cortisol and amino acid composition of Scylla paramamosain during indoor overwintering. Aquac. Res. 2020, 51, 5005–5014. [Google Scholar] [CrossRef]
  15. Minagawa, M. Effects of photoperiod on survival, feeding and development of larvae of the red frog crab. Ranina ranina. Aquaculture 1994, 120, 105–114. [Google Scholar] [CrossRef]
  16. Gardner, C.; Maguire, G.B. Effect of photoperiod and light intensity on survival, development and cannibalism of larvae of the Australian giant crab Pseudocarcinus gigas (Lamarck). Aquaculture 1998, 165, 51–63. [Google Scholar] [CrossRef]
  17. Livak, K.J.; Schmittgen, T.D. Analysis of relative gene expression data using real-time quantitative PCR and the 2−△△CT method. Methods 2001, 25, 402–408. [Google Scholar] [CrossRef]
  18. Bermudes, M.; Ritar, A.J. Response of early stage spiny lobster Jasus edwardsii phyllosoma larvae to changes in temperature and photoperiod. Aquaculture 2008, 281, 63–69. [Google Scholar] [CrossRef]
  19. McConaugha, J.R.; Tester, P.A.; McConaugha, C.S. Feeding and growth in meroplanktonic larvae of Callinectes sapidus (Crustacea: Portunidae). In Memoirs of the Queensland Museum, Proceedings of the 1990 International Crustacean Conference, Brisbane, Australia, 2–7 July 1990; Davie, P., Quinn, R.H., Eds.; Queensland Museum: Brisbane, Australia; p. 320.
  20. Gardner, C.; Northam, M. Use of prophylactic chemical treatments for mycosis of giant crab Pseudocarcinus gigas larvae in intensive culture. Aquaculture 1997, 158, 203–214. [Google Scholar] [CrossRef]
  21. Fitzgibbon, Q.P.; Battaglene, S.C. Effect of photoperiod on the culture of early-stage phyllosoma and metamorphosis of spiny lobster (Sagmariasus verreauxi). Aquaculture 2012, 368–369, 48–54. [Google Scholar] [CrossRef]
  22. Chang, E.S.; Mykles, D.L. Regulation of crustacean molting: A review and our perspectives. Gen. General. Comp. Endocrinol. 2011, 172, 323–330. [Google Scholar] [CrossRef]
  23. Mykles, D.L. Ecdysteroid metabolism in crustaceans. J. Steroid Biochem. Mol. Biol. 2011, 127, 196–203. [Google Scholar] [CrossRef] [PubMed]
  24. Xie, X.; Zhou, Y.Q.; Liu, M.X.; Tao, T.; Jiang, Q.H.; Zhu, D.F. The nuclear receptor E75 from the swimming crab, Portunus trituberculatus: cDNA cloning, transcriptional analysis, and putative roles on expression of ecdysteroid-related genes. Comp. Biochem. Physiol. Part B 2016, 200, 69–77. [Google Scholar] [CrossRef] [PubMed]
  25. Song, Y.; Villeneuve, D.L.; Toyota, K.; Lguchi, T.; Tollefsen, K.E. Ecdysone receptor agonism leading to lethal molting disruption in arthropods: Review and adverse outcome pathway development. Environ. Sci. Technol. 2017, 51, 4142–4157. [Google Scholar] [CrossRef]
  26. Watson, R.D.; Spaziani, E. Effects of eyestalk removal on cholesterol uptake and ecdysone secretion by crab (Cancer antennarius) Y-organs in vitro. Gen. General. Comp. Endocrinol. 1985, 57, 360–370. [Google Scholar] [CrossRef] [PubMed]
  27. Kim, H.W.; Batista, L.A.; Hoppes, J.L.; Lee, K.J.; Mykles, D.L. A crustacean nitric oxide synthase expressed in nerve ganglia, Y-organ, gill and gonad of the tropical land crab, Gecarcinus lateralis. J. Exp. Biol. 2004, 207, 2845–2857. [Google Scholar] [CrossRef] [PubMed]
  28. Covi, J.A.; Chang, E.S.; Mykles, D.L. Neuropeptide signaling mechanisms in crustacean and insect molting glands. Invertebr. Reprod. Dev. 2012, 56, 33–49. [Google Scholar] [CrossRef]
  29. Wang, F.; Dong, S.L.; Dong, S.S.; Huang, G.Q.; Zhu, C.B.; Mu, Y.C. The effect of light intensity on the growth of Chinese shrimp Fenneropenaeus chinensis. Aquaculture 2004, 234, 475–483. [Google Scholar] [CrossRef]
  30. Yu, K.; Shi, C.; Ye, Y.; Li, R.; Mu, C.; Ren, Z.; Wang, C. The effects of overwintering temperature on the survival of female adult mud crab, Scylla paramamosain, under recirculating aquaculture systems as examined by histological analysis of the hepatopancreas and expression of apoptosis-related genes. Aquaculture 2023, 565, 739080. [Google Scholar] [CrossRef]
  31. Liu, J.; Lin, A.N. Role of JNK activation in apoptosis: A double-edged sword. Cell. Res. 2005, 15, 36–42. [Google Scholar] [CrossRef]
  32. Dhanasekaran, D.N.; Reddy, E.P. JNK signaling in apoptosis. Oncogene 2008, 27, 6245–6251. [Google Scholar] [CrossRef]
  33. Xu, H.; Dou, J.; Wu, Q.; Ye, Y.; Song, C.; Mu, C.; Wang, C.; Ren, Z.; Shi, C. Investigation of the light intensity effect on growth, molting, hemolymph lipid, and antioxidant capacity of juvenile swimming crab Portunus trituberculatus. Front. Mar. Sci. 2022, 9, 851. [Google Scholar] [CrossRef]
  34. Shi, Y.; Nikulenkov, F.; Zawacka-Pankau, J.; Li, H.; Gabdoulline, R.; Xu, J.; Eriksson, S.; Hedström, E.; Issaeva, N.; Kel, A.; et al. ROS-dependent activation of JNK converts p53 into an efficient inhibitor of oncogenes leading to robust apoptosis. Cell. Death Differ. 2014, 21, 612–623. [Google Scholar] [CrossRef] [PubMed]
  35. Fridman, J.S.; Lowe, S.W. Control of apoptosis by p53. Oncogene 2003, 22, 9030–9040. [Google Scholar] [CrossRef] [PubMed]
  36. Polyak, K.; Xia, Y.; Zweier, J.L.; Kinaler, K.W.; Vogelstein, B. A model for p53-induced apoptosis. Nature 1997, 389, 300–305. [Google Scholar] [CrossRef] [PubMed]
  37. Cadet, J.L.; Harrington, B.; Ordonez, S. Bcl-2 overexpression attenuates dopamine-induced apoptosis in an immortalized neural cell line by suppressing the production of reactive oxygen species. Synapse 2000, 35, 228–233. [Google Scholar] [CrossRef]
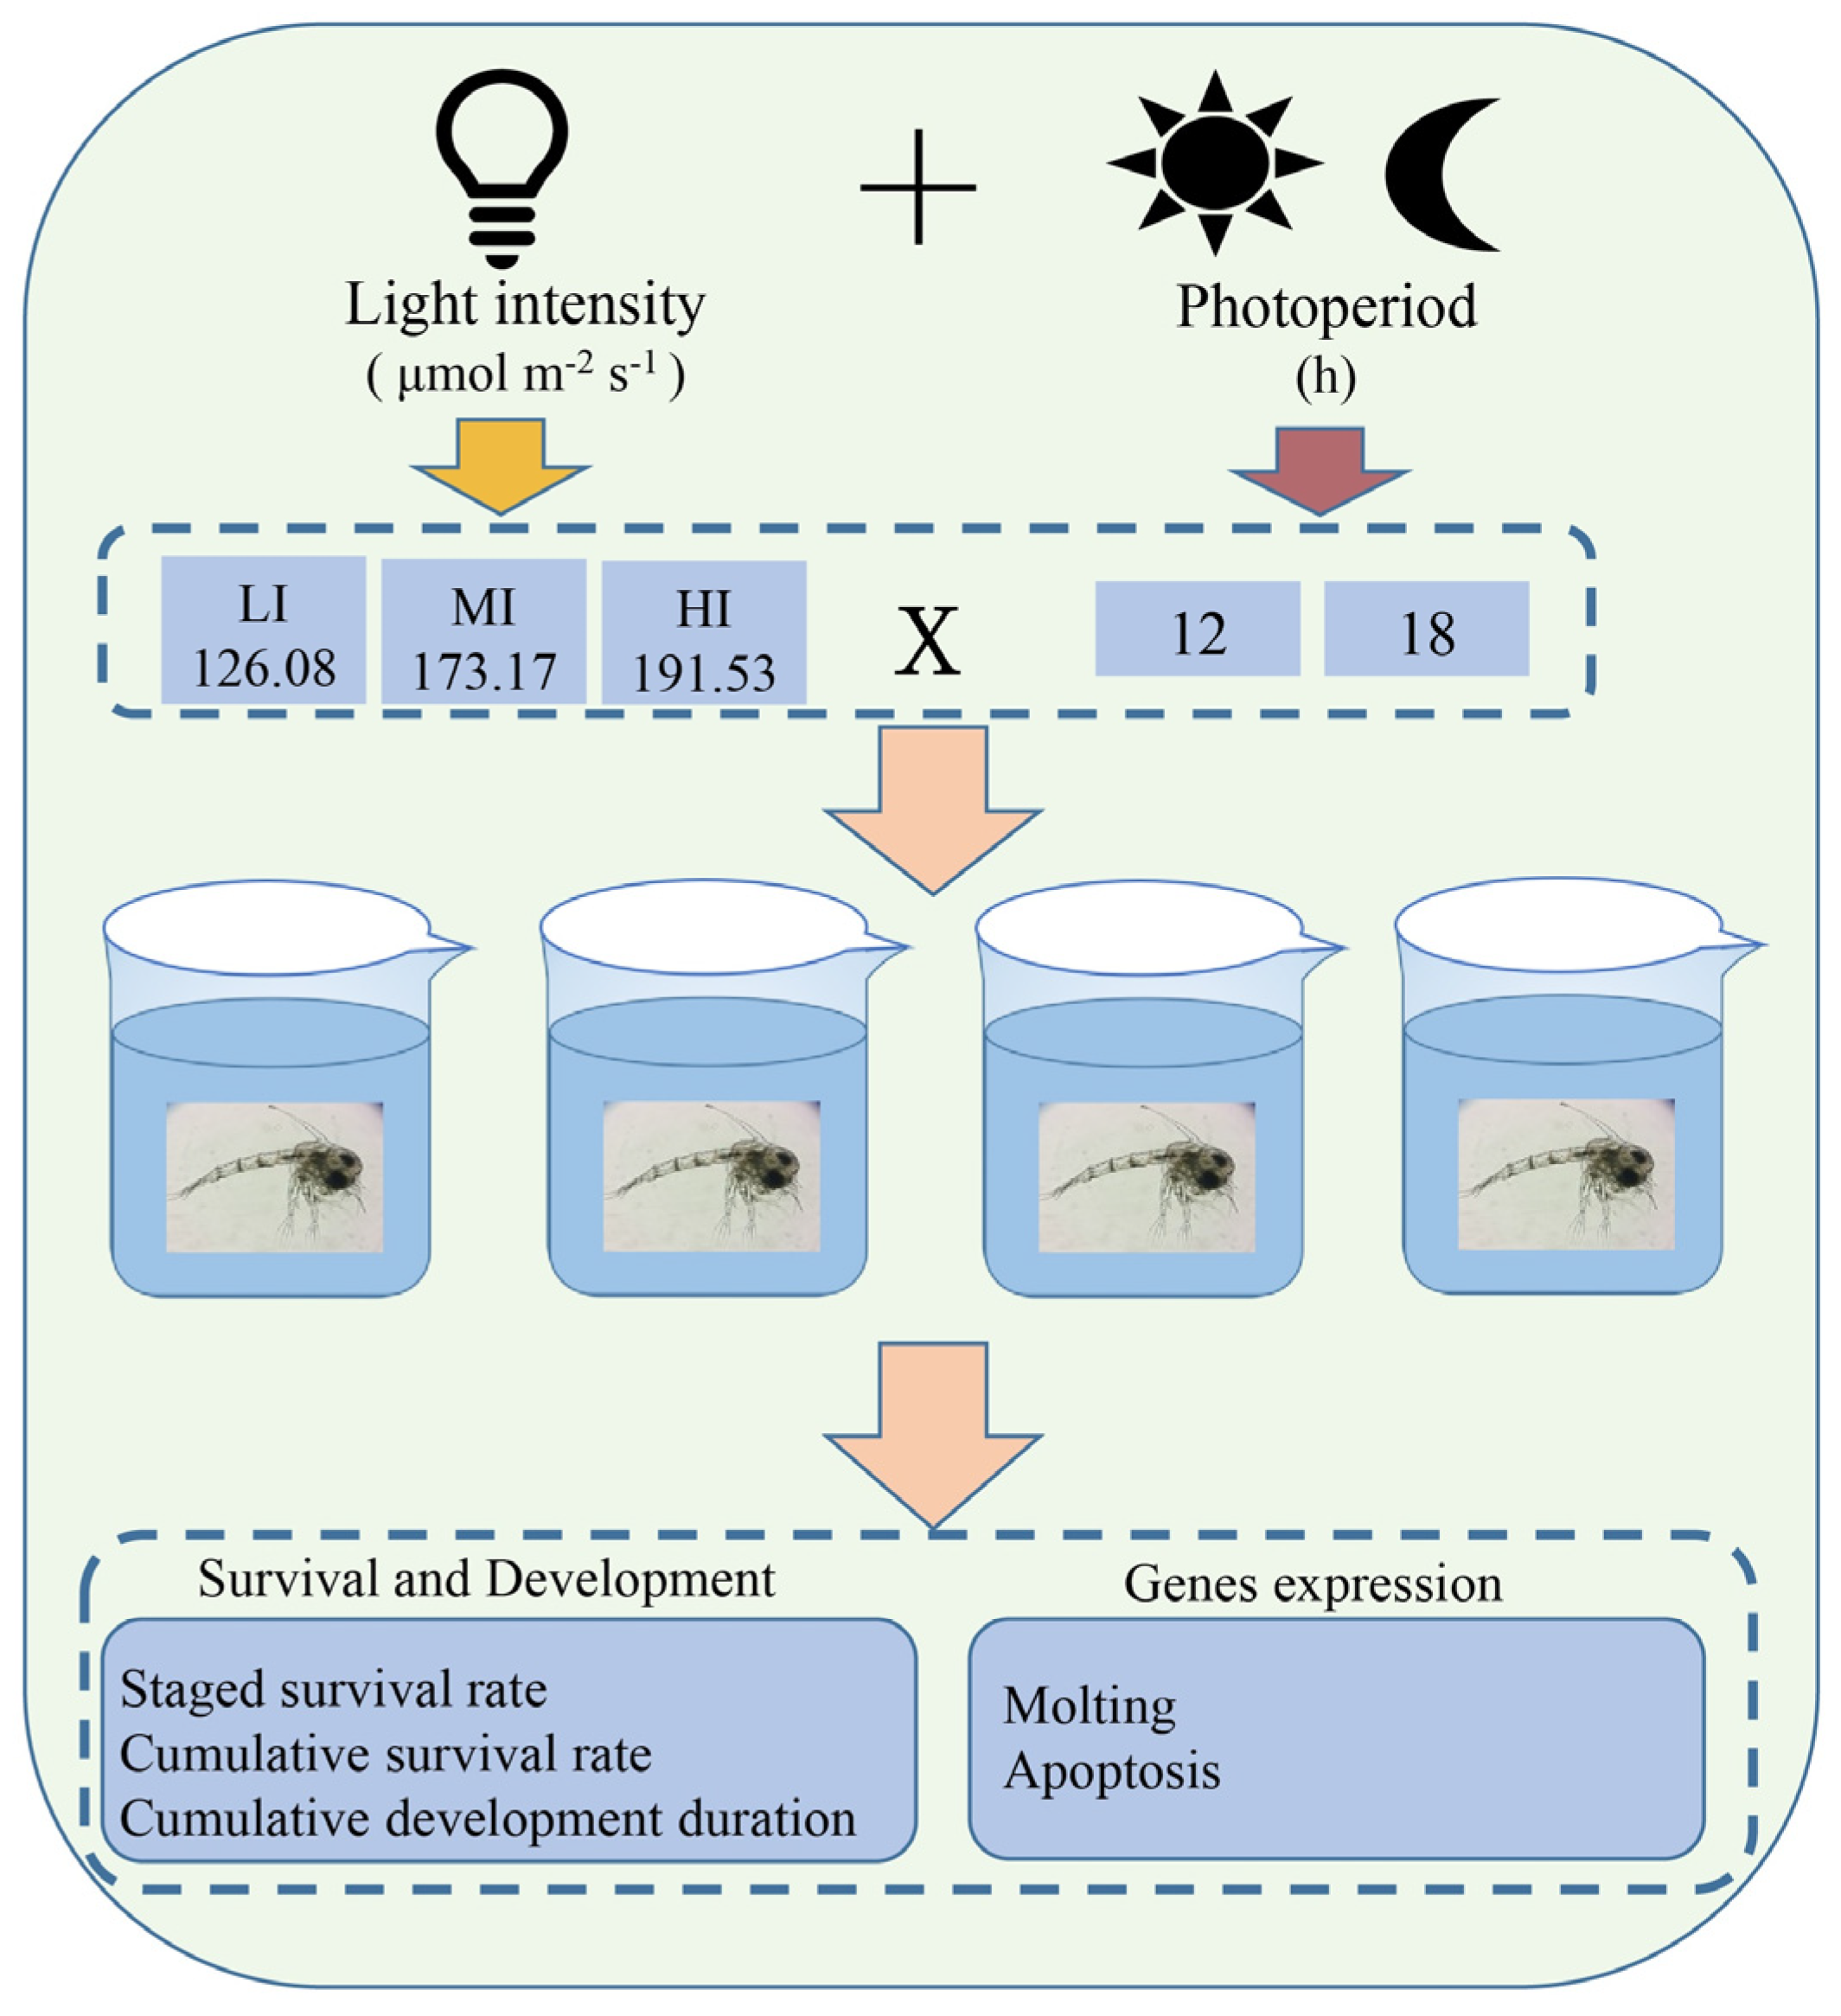
Figure 1. The schematic diagram of experimental design for light intensity and photoperiod interaction of swimming crab P. trituberculatus larvae. The light intensity included LI (126.08 μmol m−2 s−1), MI (173.17 μmol m−2 s−1), and HI (191.53 μmol m−2 s−1). The photoperiod included 12 h and 18 h periods. X means the interaction of light intensity and photoperiod. The 4 glass beakers in the figure represent the 4 replicates of each group.
Fishes 08 00221 g001
Figure 2. The staged survival rate (SSR, mean ± SD, n = 4) of larvae: (A) zoea I, (B) zoea II, (C) zoea III, (D) zoea IV, and (E) megalopa. Different lowercase letters indicate significant differences among different light intensities at the same photophase treatment (p < 0.05). Asterisks denote significant differences between photoperiods at the same light intensity treatment (*, p < 0.05; **, p < 0.01).
Fishes 08 00221 g002
Figure 3. The cumulative survival rate (CSR, mean ± SD, n = 4) of larvae: (A) zoea I, (B) zoea II, (C) zoea III, (D) zoea IV, and (E) megalopa. Different capital letters and lowercase letters indicate significant differences among different light intensities at the same photophase treatment (p < 0.05). Asterisks denote significant differences between photoperiods at the same light intensity (*, p < 0.05; **, p < 0.01).
Fishes 08 00221 g003
Figure 4. The cumulative development duration (CDD, mean ± SD, n = 4) of larvae: (A) zoea I, (B) zoea II, (C) zoea III, (D) zoea IV, and (E) megalopa. Different capital letters and lowercase letters indicate significant differences among different light intensities at the same photophase treatment (p < 0.05). Asterisks denote significant differences between photoperiods at the same light intensity (*, p < 0.05; **, p < 0.01).
Fishes 08 00221 g004
Figure 5. The apoptosis-related gene expression (mean ± SD, n = 4) of juvenile crabs: (A) e75, (B) ecr, (C) rxr, and (D) mih. Different lowercase letters indicate significant difference among different light intensities at the same photophase treatment (p < 0.05). Asterisks denote significant differences between photoperiods at the same light intensity (*, p < 0.05).
Fishes 08 00221 g005
Figure 6. The apoptosis-related gene expression (mean ± SD, n = 4) of juvenile crabs: (A) p53, (B) jnk, and (C) bcl-2. Asterisks denote significant differences between photoperiods at the same light intensity (*, p < 0.05; **, p < 0.01).
Fishes 08 00221 g006
Table 1. The experimental treatments.
Light Intensity (μmol m−2 s−1)
Photoperiod126.08 (LI)173.17 (MI)191.53 (HI)
12 h photophase (12)12-LI12-MI12-HI
18 h photophase (18)18-LI18-MI18-HI
Table 2. The specific primers used for real-time PCR in this study.
GeneSequence (5′ to 3′)Size (bp)Access Number
jnkF:TAGACTTCGGACTTGCTCG195MK287992
R:GGTCAATATGATCTGTGCC
p53F:GAAAGTCGCCATCGTGTA338MH155953
R:CCAACAACAGTCCCAGAG
bcl-2F:TCCTCCATAGCGTCCCTTACCT251MH155954
R:CCAGCAGGGATTTCTAAGGAC
ecrF:TAAGTGATGACGACTCGGATGC150KC354381
R:ACGAGCAAGCCTTTAGCAGTG
rxrF:AGCGTCAGAGGACAAAAGGC136KF061043
R:TGGTCCAGTGGCTGCTCAT
e75F:CGAGAGCCTAGTGATGTA118KM016226
R:ATGAGTGATGAGCGAGTA
mihF:TATCAAGTGCAGGAACTCAG110EU869539
R:GGAACATACAAGCCTAAACA
β-actinF:CGAAACCTTCAACACTCCCG154FJ641977
R:GATAGCGTGAGGAAGGGCATA
jnk: c-Jun N-terminal kinase; p53: tumor suppressor p53; bcl-2: B-cell lymphoma-2; ecr: ecdysone receptor; rxr: retinoid X receptor; e75: nuclear receptor E75; mih: molt-inhibiting hormone.
Table 3. Summary of two-way ANOVA. The staged survival rate, cumulative survival rate, cumulative development duration, and gene expression of swimming crab Portunus trituberculatus larvae under different experimental treatments (n = 4).
ItemLife StageLight Intensity
(F, P)
Photoperiod
(F, P)
Light Intensity X Photoperiod
(F, P)
Staged survival rate (SSR, %)Zoea I5.517, 0.0040.742, 0.4000.387, 0.685
Zoea II3.211, 0.0640.443, 0.5141.104, 0.353
Zoea III1.245, 0.31116.185, 0.0010.229, 0.798
Zoea IV2.382, 0.12124.535, 0.0001.241, 0.313
Megalopa0.222, 0.8037.643, 0.0131.238, 0.314
Cumulative survival rate (CSR, %)Zoea I5.517, 0.0140.742, 0.4000.387, 0.685
Zoea II 11.898, 0.0010.159, 0.6951.323, 0.291
Zoea III10.652, 0.00118.280, 0.0003.830, 0.041
Zoea IV12.124, 0.00062.521, 0.0004.315, 0.029
Megalopa1.319, 0.29219.050, 0.0002.417, 0.117
Cumulative development duration (CDD, days)Zoea I1.314, 0.2770.214, 0.6450.210, 0.811
Zoea II0.060, 0.9420.017, 0.8950.163, 0.850
Zoea III3.213, 0.04611.286, 0.00118.179, 0.000
Zoea IV1.023, 0.3641.186, 0.2803.492, 0.035
Megalopa0.128, 0.8804.413, 0.0392.559, 0.084
Gene expression
p53Juvenile crab2.203, 0.15314.772, 0.00205.106, 025
jnk0.766, 0.48630.646, 0.0001.426, 0.278
bcl-23.510, 0.06383.400, 0.0002.000, 0.178
e751.293, 0.3100.055, 0.8191.454, 0.272
ecr0.410, 0.67311.296, 0.0060.086, 0.918
rxr1.744, 0.21625.261, 0.0002.615, 0.114
mih0.670, 0.5300.648, 0.4361.082, 0.370
p53: tumor suppressor p53; jnk: c-Jun N-terminal kinase; bcl-2: B-cell lymphoma-2; e75: nuclear receptor E75; ecr: ecdysone receptor; rxr: retinoid X receptor; mih: molt-inhibiting hormone. NS: non-significant differences.
Disclaimer/Publisher’s Note: The statements, opinions and data contained in all publications are solely those of the individual author(s) and contributor(s) and not of MDPI and/or the editor(s). MDPI and/or the editor(s) disclaim responsibility for any injury to people or property resulting from any ideas, methods, instructions or products referred to in the content.