Article

Conservation Status Assessment of Demersal Elasmobranchs in the Balearic Islands (Western Mediterranean) over the Last Two Decades

by
Alba Serrat
*,
Maria Teresa Farriols
,
Sergio Ramírez-Amaro
,
Francesc Ordines
,
Beatriz Guijarro
,
Francesca Ferragut-Perello
and
Enric Massutí
Centre Oceanogràfic de les Balears (COB-IEO), CSIC, Moll de Ponent s/n, 07015 Palma, Illes Balears, Spain
*
Author to whom correspondence should be addressed.
Fishes 2023, 8(5), 230; https://doi.org/10.3390/fishes8050230
Submission received: 21 February 2023 / Revised: 13 April 2023 / Accepted: 22 April 2023 / Published: 27 April 2023
(This article belongs to the Special Issue Cartilaginous Fishes: Stock Assessment and Population Dynamics)

Abstract

:
More than half of the Mediterranean sharks and rays are threatened by fishing exploitation. However, population assessments are limited by the scarcity of specific data on fishing catches. In this study, we assessed temporal trends of the indicators developed within the European Marine Strategy Framework Directive over the last two decades in order to assess the conservation status of demersal sharks and batoids in the Balearic Islands, which represent an important fraction of the bycatch of bottom trawling in this area. On the basis of a georeferenced, fishery-independent dataset of 19 species of elasmobranchs, we analyzed 20 year time series (2002–2021) of nine indicators regarding area distribution, population size, population status, and community structure. Between 30% and 50% of the elasmobranch species and functional groups showed increasing trends in distribution area and population size. This was especially true for batoids, whereas the distribution area and population size of most sharks remained stable over the study period. The remaining indicators showed stability or, in some cases, variable trends. Only in one case did we find a negative trend sustained all along the time series (i.e., the proportion of R. radula large individuals in relation to the reference period). Overall, our results suggest that the populations of elasmobranchs from the Balearic Islands show stable or recovery trends, mainly in terms of distribution area and density. However, it remains elusive whether this community can recover to the levels of more than half a century ago, before the development of the bottom trawl fishery, or whether this apparent current steady state should be interpreted as a new equilibrium.
Key Contribution: The populations of elasmobranchs from the Balearic Islands show stable or recovery trends; mainly in terms of distribution area and density of batoids.

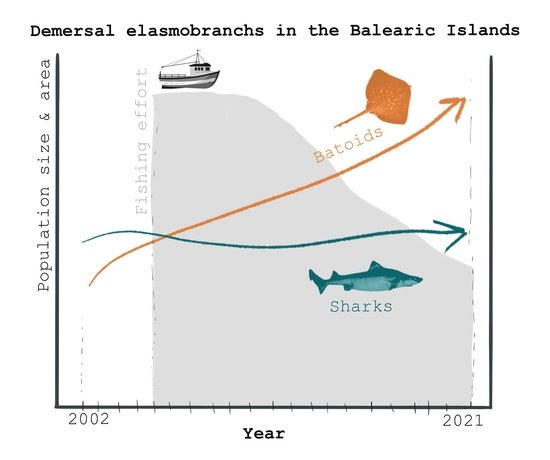
Graphical Abstract

1. Introduction

The vital traits (i.e., slow growth, late sexual maturation, large body size and low fecundity) of elasmobranchs (sharks and batoids) make them especially vulnerable to fishing pressure [1]. In fact, fisheries are likely the main current anthropogenic threat to elasmobranch populations [2]. During the 20th century, the global increase in fishing effort [3,4] led to declines and serial depletions of elasmobranch populations [5,6], which may take decades to recover [7]. In the Mediterranean, more than half of the species of elasmobranchs are currently threatened [2]. Recently, the General Fisheries Commission for the Mediterranean (GFCM) adopted the recommendation GFCM/42/2018/2 on fisheries management measures for the conservation of sharks and rays and the recommendation GFCM/44/2021/16 on additional mitigation measures for the conservation of elasmobranchs in the Mediterranean, including the adoption of measures to reduce their mortality by incidental catch during fishing operations, as well as supporting data collection, monitoring, and research programs on these vulnerable species [8].
During the last decades, fisheries assessment and management has evolved from a species- to an ecosystem-based approach, which considers not only the fisheries target species but also other components of the ecosystem [9]. This is particularly required in the complex multi-gear and multispecies fisheries of the Mediterranean, where trawling is the most important fishery in terms of fleet and catches [10]. Bottom trawlers operate over a wide bathymetric range along the continental shelf and slope, causing a large level of bycatch and discards. Demersal elasmobranchs can represent an important fraction of this bycatch [11], but a minor portion of landings [12].
However, the assessment of elasmobranch populations is limited by the lack of reliable specific data on fishing catches and landings [13]; consequently, most of these populations remain unassessed and without proper management measures. As an example, a recent study by Juan-Jordà et al. (2022) [14] provided evidence of recovery of tunas and billfishes after 2000s, when fisheries management actions were implemented for target species, whereas sharks’ extinction risk continues to rise due to the lack of management. In fact, the conservation status of more than 20% of sharks and rays in the Mediterranean has worsened during the last decades [15].
Despite all the limitations, the use of fisheries-independent data and population and community indicators has allowed to describe the community composition and assess the status for demersal elasmobranchs in the Balearic Islands (western Mediterranean) [12,16,17,18]. These studies showed a greater diversity and density of demersal elasmobranchs in the Balearic archipelago compared to adjacent waters of the western Mediterranean, which could be related to a relatively low intensity of bottom trawling. In the Balearic Islands, the highest development of the bottom trawl fleet took place from mid-1950s to 1980, resulting in a clear decrease in elasmobranch populations and important community changes [12]. During the last decades, the community of elasmobranchs has achieved some stability in terms of diversity, biomass, and specific density, but with different behavior between continental shelf and slope populations [12]. Some species such as Scyliorhinus canicula, Raja clavata, and Galeus melastomus, with a wide distribution depth range, showed signs of recovery, but negative trends have been observed for other species such as Etmopterus spinax and Dipturus oxyrinchus that are more restricted to deep waters [18]. These studies have related these temporal dynamics to the historical evolution of the intensity and bathymetric distribution of the bottom trawl fishing effort.
Marine biodiversity loss is considered to be one of the most severe global environmental problems. Among many other aspects, it plays an important role in maintaining marine ecosystem functioning and in providing ecosystem services. The Marine Strategy Framework Directive (MSFD; Directive 2008/56/EU) aims to increase protection of the European marine environment and to achieve a good environmental status, enabling a sustainable use of marine goods and services. Therefore, it requires the application of an ecosystem-based approach to better link ecosystem components, anthropogenic pressures, and impacts on the marine environment. Member states should analyze and periodically update the status of their marine ecosystems according to criteria and methodological standards on good environmental status (GES) and specifications of methods for their monitoring and assessment (Commission Decision EU 2017/848), established from 11 qualitative descriptors for interpreting what GES means in practice, through describing what the environment will look like when GES has been achieved. MSFD Descriptor 1 refers to biodiversity and describes the achievement of GES as the maintenance of the biological diversity. Within this descriptor, analyses of the distribution and condition of habitats and species are performed every 6 years within each marine demarcation. In regard to elasmobranchs, these periodical analyses only include the most common species at a regional level. Hence, in the Balearic Islands, the representation of the elasmobranch community in these analyses is limited to only the three most abundant species: R. clavata, S. canicula, and G. melastomus.
In the present work, we aim to expand the MSFD analysis beyond the dominant species and to evaluate the conservation status of the elasmobranch community in the Balearic Islands over the last two decades. For this purpose, we used the GES indicators for circalittoral and bathyal fishes developed in the context of MSFD Descriptor 1. A total of nine indicators regarding the population size, status, and distribution of 19 elasmobranch species were calculated on the basis of georeferenced fishery-independent data on density, biomass, and total body length. Indicators were estimated annually at the species, functional group, and community levels, and their trends were evaluated over the last two decades (2002–2021).

2. Materials and Methods

2.1. Study Area

The Balearic Islands are situated in the western Mediterranean, separated from the Iberian Peninsula by a distance up to 95 nautical miles, with depths between 800 and 1800 m. The continental shelf is generally narrow (3 km width), with some exceptions such as southern Mallorca, where widths can reach up to 35 km [19]. The slope on the western and southern sides is gentle (6° average inclination), while the northern and eastern sides have an abrupt slope (16° average inclination), with a clear shelf-break. The sediments of the shelf are mainly biogenic sands and gravels, and sandy–muddy and detrital bottoms are present at the shelf-slope break, whereas muddy sediments of biogenic origin dominate the deeper areas [19,20].
The archipelago delimits the Balearic sub-basin in the north from the Algerian sub-basin in the south. These sub-basins are characterized by different oceanographic conditions [21] and are connected by a series of channels with depths between 100 and 800 m, which play an important role in the regional circulation, as passages for the exchange of water masses between them [22]. The Balearic sub-basin is more influenced by atmospheric forcing and Mediterranean waters, which are colder and more saline, whereas the Algerian sub-basin is affected basically by density gradients and receives warmer and less saline Atlantic waters, entering the Mediterranean through the Strait of Gibraltar [23].
Within the general oligotrophic environment of the Mediterranean, the waters around the Balearic Islands show more pronounced oligotrophy than the adjacent waters off the Iberian coast and the Gulf of Lion [24,25], due to the scarcity of rain and the karstic nature of the islands. This pronounced oligotrophy explains the high transparency of the waters in the area that enables algal populations to grow until 90–100 m depth [26,27]. Red algae beds, with two main communities being rhodoliths and Peyssonnelia beds, dominate the continental shelf landscape down to 85 m depth [28,29]. However, frontal mesoscale events between Mediterranean and Atlantic waters [23] and input of cold northern water into the channels [30] can act as external fertilization mechanisms that enhance productivity off the Balearic Islands.
Regarding fisheries, the Balearic Islands can be considered an individualized area for assessment and management purposes in the western Mediterranean [31], where the number of bottom trawl fishing boats has remained historically very low, compared to other areas of the Mediterranean coast off the Iberian Peninsula. Due to this lower fishing exploitation, the demersal resources and ecosystems in the Balearic Islands are in a healthier state than in adjacent areas off Iberian Peninsula, which is reflected in the population structure of the main commercial species (populations from the Balearic Islands have larger modal sizes and lower percentages of small-sized individuals), as well as in the higher abundance and diversity of elasmobranch assemblages [31].

2.2. Data Source

The data used come from the bottom trawl surveys BALAR (2002–2006) and MEDITS (2007–2021) developed around Mallorca and Menorca in the Balearic Islands (western Mediterranean; Figure 1). These surveys are performed annually during late spring and early summer, using the experimental bottom trawl GOC-73, equipped with 10–20 mm mesh size in the cod-end, and applying a stratified sampling scheme with four depth strata (B: 51–100 m, C: 101–200 m, D: 201–500 m, E: 501–800 m) following the MEDITS protocol [32,33]. Hauls were conducted during daylight hours at a towing speed between 2.5 and 3 knots, with an effective duration of 20 min at depths shallower than 101 m, 30 min at depths between 101 and 200 m, and 60 min in deeper areas.
For each haul, position, depth, and the arrival and departure of the net to the bottom, as well as its horizontal and vertical openings (ranging 16–22 and 2.5–3 m, respectively), were monitored in real time using SCANMAR or MARPORT systems. Once the catch was on board, it was sorted by species, counted, and weighted, and the individual total length was measured to the lowest half cm. Abundance and biomass were standardized to 1 km2, using the horizontal opening of the net and the distance covered by the net on the seafloor during each haul, which was measured using a GPS.

2.3. Species Selection and Functional Groups

A total of 943 hauls from 2002 to 2021, distributed among 50 sampling stations each survey (Figure 1), were analyzed. Only elasmobranch species appearing in more than 33% of the years (at least 7 years) were considered (Table 1). Species were grouped based on functional similarities, regarding their biological traits. The traits considered were type of reproduction, body shape, maximum body size, and mean body weight. Each trait was divided into four categories, and each species was assigned to one category according to Farriols et al. (2017) [34]. Then, a functional resemblance matrix among species was calculated using the simple matching coefficient:
f i j = 100 × ( 1 a + d a + b + c + d ) ,
where a is the number of common categories to species i and j, b is the number possessed by i and not j, c is the number possessed by j and not I, and d is the number possessed by neither. The functional resemblance matrix was subjected to cluster analysis, and a hierarchical cluster was produced using the average group linkage with PRIMER 7 [35].

2.4. Estimation of Indicators

The MSFD defines the GES for demersal fish, according to a set of criteria at the population and community levels. More related information can be found in the introduction and Article 8 of the MSFD, Directive 2008/56/EU and in the Commission Decision EU 2017/848. Here, up to nine indicators were estimated annually, six of them regarding populations and three regarding community, with the latter considered by the MSFD as ecosystem structure indicators. The meaning of each of these indicators and their calculation is detailed below. GES population indicators responding to the criteria of distribution, size, and status of populations were estimated at the species and functional group levels. Community indicators responding to the criteria of ecosystem structure were estimated: (i) for the whole community (all species included); (ii) for each functional group; (iii) for the whole community, but excluding the dominant species S. canicula, G. melastomus, and R. clavata, because their high abundance and biomass may have masked trends for the rest of the community (referred to as the reduced community hereafter).

2.5. Population Distribution Indicators

Area of Distribution

The extent of the study area was delimited manually along the outer side of the 800 m isobath around Mallorca and Menorca and divided into 1 × 1 km cells, applying a grid established by the Spanish Ministry for the Ecological Transition and the Demographic Challenge, the authority for the implementation of the MSFD in Spain [36].
The species bathymetric range was defined by the minimum and maximum depth at which the species was caught over the whole time series.
The area of distribution indicator estimates the standardized percentage of grids where a species occurred within its bathymetric range, as follows:
% C + 1 = c + i C t c m i C m a x ,
where C+i is the number of grids where the species was present in year i, Ct is the total number of grids within the species bathymetric range in the whole area, Cmi is the number of sampled grids within the species bathymetric range in year i, and Cmax is the maximum number of grids within the species bathymetric range sampled any year.

2.6. Population Size Indicators

Density and Biomass

Population size by year was assessed by estimating the average stratified density and biomass of each species, multiplying the average standardized density (number of individuals per km2) and biomass (weight in g per km2) at each stratum by the stratum surface, and the result was divided by the total surface, considering all strata. Subsequently, the annual standard score (Z-score) was calculated as follows:
Z = x μ σ ,
where Z is the Z-score value, x is the value being evaluated, μ is the mean, and σ is the standard deviation. The Z-score value for the last year indicates the current status of the species (Zlast) over the time series.

2.7. Population Status Indicators

2.7.1. 95th Percentile of Size Distribution (P95)

It is assumed that the health of a population increases as its size distribution consists of larger fish. Hence, the 95% percentile of the population length frequency distribution (P95) is considered a good state indicator for the implementation of MSFD. It is expected to be sensitive to fishing and other human impacts [37,38,39]. A decrease in P95 length value generally indicates increased fishing pressure [39].
The standardized density (individuals/km2) by length class was used to estimate this indicator at the species level. Species-specific size values were ordered (from smallest to largest), and the annual P95 was obtained from the length value corresponding to the ordinal (n) calculated as follows:
n = 95 100 × ( N i + 1 2 ) ,
where Ni is the number of individuals in year i.

2.7.2. Percentage of Mature Specimens (%Mature)

For each species, the annual abundance of mature specimens was calculated as the sum of standardized density (individuals/km2) of all length classes larger than the species-specific length at first maturity (L50), obtained from the available literature (Supplementary Table S1). The %Mature was calculated at a species level as the ratio between the abundance of mature specimens and the total standardized density of the species. When data on sex-specific L50 were available, this indicator was also evaluated separately for each sex.

2.8. Ecosystem Structure Indicators

2.8.1. Mean Maximum Length of Fish (MMLF)

At the community level, the proportion of large species is also a sign of good health status. The MMLF is a good indicator to reflect the evolution of the mean maximum length of the fish communities, taking into consideration intraspecific variations of size and its sensitivity to fishing pressure [39]. The MMLF was calculated as follows:
L m a x =   L m a x , j × N j N ,
where Lmax,j is the maximum total length observed for species j, Nj is the number of specimens of species j, and N is the total number of specimens.

2.8.2. Large Fish Indicator (LFI)

This indicator estimates the proportion of fish (relative density) with a length exceeding the length criteria to be considered a large fish. The threshold size (LFTS) that defines what could be considered a large fish within the community of elasmobranchs was determined on the basis of the proportion of individuals larger than a specific size. Different threshold sizes were tested every 5 cm from 30 to 115 cm, and the percentage of individuals larger than each threshold size was calculated. The selected large fish threshold size was that which was surpassed only by ≤2.5% of the individuals (Table 2).

2.8.3. Conservation Status of Fish (CSFb)

This indicator measures the relative abundance of individuals larger than 0.5 times the species-specific asymptotic length (L∞) in the community in relation to an initial reference period and only considering large species (i.e., those species with total maximum length larger than the large fish threshold at community level, which was here estimated at 60 cm). The asymptotic length should be calculated from the growth function by species; however, since this information was lacking in most cases, the maximum length recorded in the entire series (Lmax) was used instead (Lmax can be consulted in Table 1). For each species, the annual abundance (stratified standardized density) of individuals larger than 0.5 times the species-specific Lmax was calculated. Subsequently, for each species, the mean abundance of individuals larger than 0.5 × Lmax in the first 3 years of the time series was computed. For the successive years, the proportion of large individuals in relation to the reference period was quantified (from here on, POL/Ref) at the species level as the ratio between the abundance of individuals larger than 0.5 × Lmax and mean abundance in the reference period. In cases where a species did not occur in the first 3 years, the reference period was extended until the year of first occurrence. Lastly, for any given year, the CSFb was calculated at the community level as the geometric mean of the relative abundance of the species included in the community. It should be noted that the geometric mean of a dataset with at least one zero will always be zero. Thus, given that the geometric mean does not capture any information about the non-zero values, only those species with individuals larger than 0.5 × Lmax occurring in all the surveys were retained for the calculation of CSFb. Therefore, the CSFb was only calculated at the whole community level considering only the species that met the aforementioned criteria: R. clavata, Raja miraletus, R. polystigma, L. naevus, Dipturus oxyrinchus, S. canicula, and G. melastomus. For all these species the reference period was the first 3 years of the time series (2002–2004).

2.9. Trends Evaluation

The procedure applied within the MSFD is by the means of simple linear regressions. However, taken into account that trend changes can occur throughout time series, we explored the existence of changes in the direction of the regression line, by comparing simple linear regressions with segmented models, also known as piecewise regression [40,41]. In this regression analysis method, the independent variable is partitioned into intervals and a separate line segment is fit to each interval. The knot connecting two linear segments is called the breakpoint. For this purpose, the segmented R package [40,42] was used. First of all, the number of breakpoints that best fit the data was selected using the selgmented function [43] and setting at three the maximum number of breakpoints to be tested (Kmax). This function performs sequential comparisons of the simple linear model using segmented models with n breakpoints (from 0 to Kmax) and determines the most appropriate number of breakpoints, according to the Bayesian information criterion (BIC). When the lowest BIC was achieved with zero breakpoints, a simple linear regression model was fit to the data. Otherwise, the segmented function was used to fit a segmented model with the selected number of breakpoints. The slope, the 95% confidence interval, and the p-value (only available for simple linear regression) of the linear regression or of each linear segment were obtained. According to the sign of the slope, the range of the 95% confidence interval, and the p-value of the regression, the historical trend of each indicator was classified into three categories: increasing, decreasing, and uncertain (Table 3). For segmented models, a trend category was assigned to each interval of years.
The achievement of GES was assessed on the basis of temporal trends of the indicators from 2002 to 2021. Species showing increasing or uncertain trends were considered to be in GES, while GES was not achieved by species showing decreasing trends. For segmented models, the achievement of GES was based on the last segment trend. For population size indicators (abundance and biomass), the achievement of GES was assessed on the basis of population size temporal trends and comparing the population Zlast value to the mean of the annual Z-score values over the timeseries. Following the MSFD definitions of GES, the mean Z-score was assumed to be 0, and the standard deviation was assumed to be 1. Assuming that all elasmobranchs are considered K-strategists, populations were considered to be in GES when (a) the population size indicators showed a decreasing trend and Zlast ≥ 0.5, or (b) the population size indicators showed an increasing or stable trend and Zlast > −0.5.

3. Results

The elasmobranch community was clearly dominated by two sharks (S. canicula and G. melastomus) and one batoid (R. clavata) (Table 1), with different relevance depending on the bathymetric strata (Supplementary Table S2). Between 50 and 100 m depth (stratum B), S. canicula accounted for more than 85% and 54% of the density (n/km2) and biomass (kg/km2), respectively. In this stratum, the most abundant batoids were R. miraletus (3.6% and 2.7% of density and biomass, respectively) and R. clavate (2.6% and 16% of density and biomass, respectively). Between 101 and 200 m depth (stratum C), the community was dominated by S. canicula (accounting for 81% of density and 31% of biomass) and R. clavata (accounting for 9.4% and 40% of density and biomass, respectively). Between 201 and 500 m depth (stratum D), the most abundant species was G. melastomus, followed by S. canicula, representing 70% and 26% of density, respectively. In terms of biomass, the community of this stratum was dominated by R. clavata, G. melastmous, and S. canicula, accounting for 35%, 24%, and 24%, respectively. G. melastomus clearly dominated between 501 and 800 m depth (stratum E), representing 92% of density and 89% of biomass, followed by E. spinax (accounting for 8% of density and 4.5% of biomass) and Centrophorus uyato, with values of 0.15% and 2.7%, respectively.
The cluster analysis showed that species grouped in six functional groups (Table 1). For most species and functional groups, simple linear regressions were the models that best fitted time series of indicators (Figure 2 and Figure 4), although there are some species and functional groups whose indicators trends were better described by segmented models. For more detail, see Supplementary Tables S3–S11.
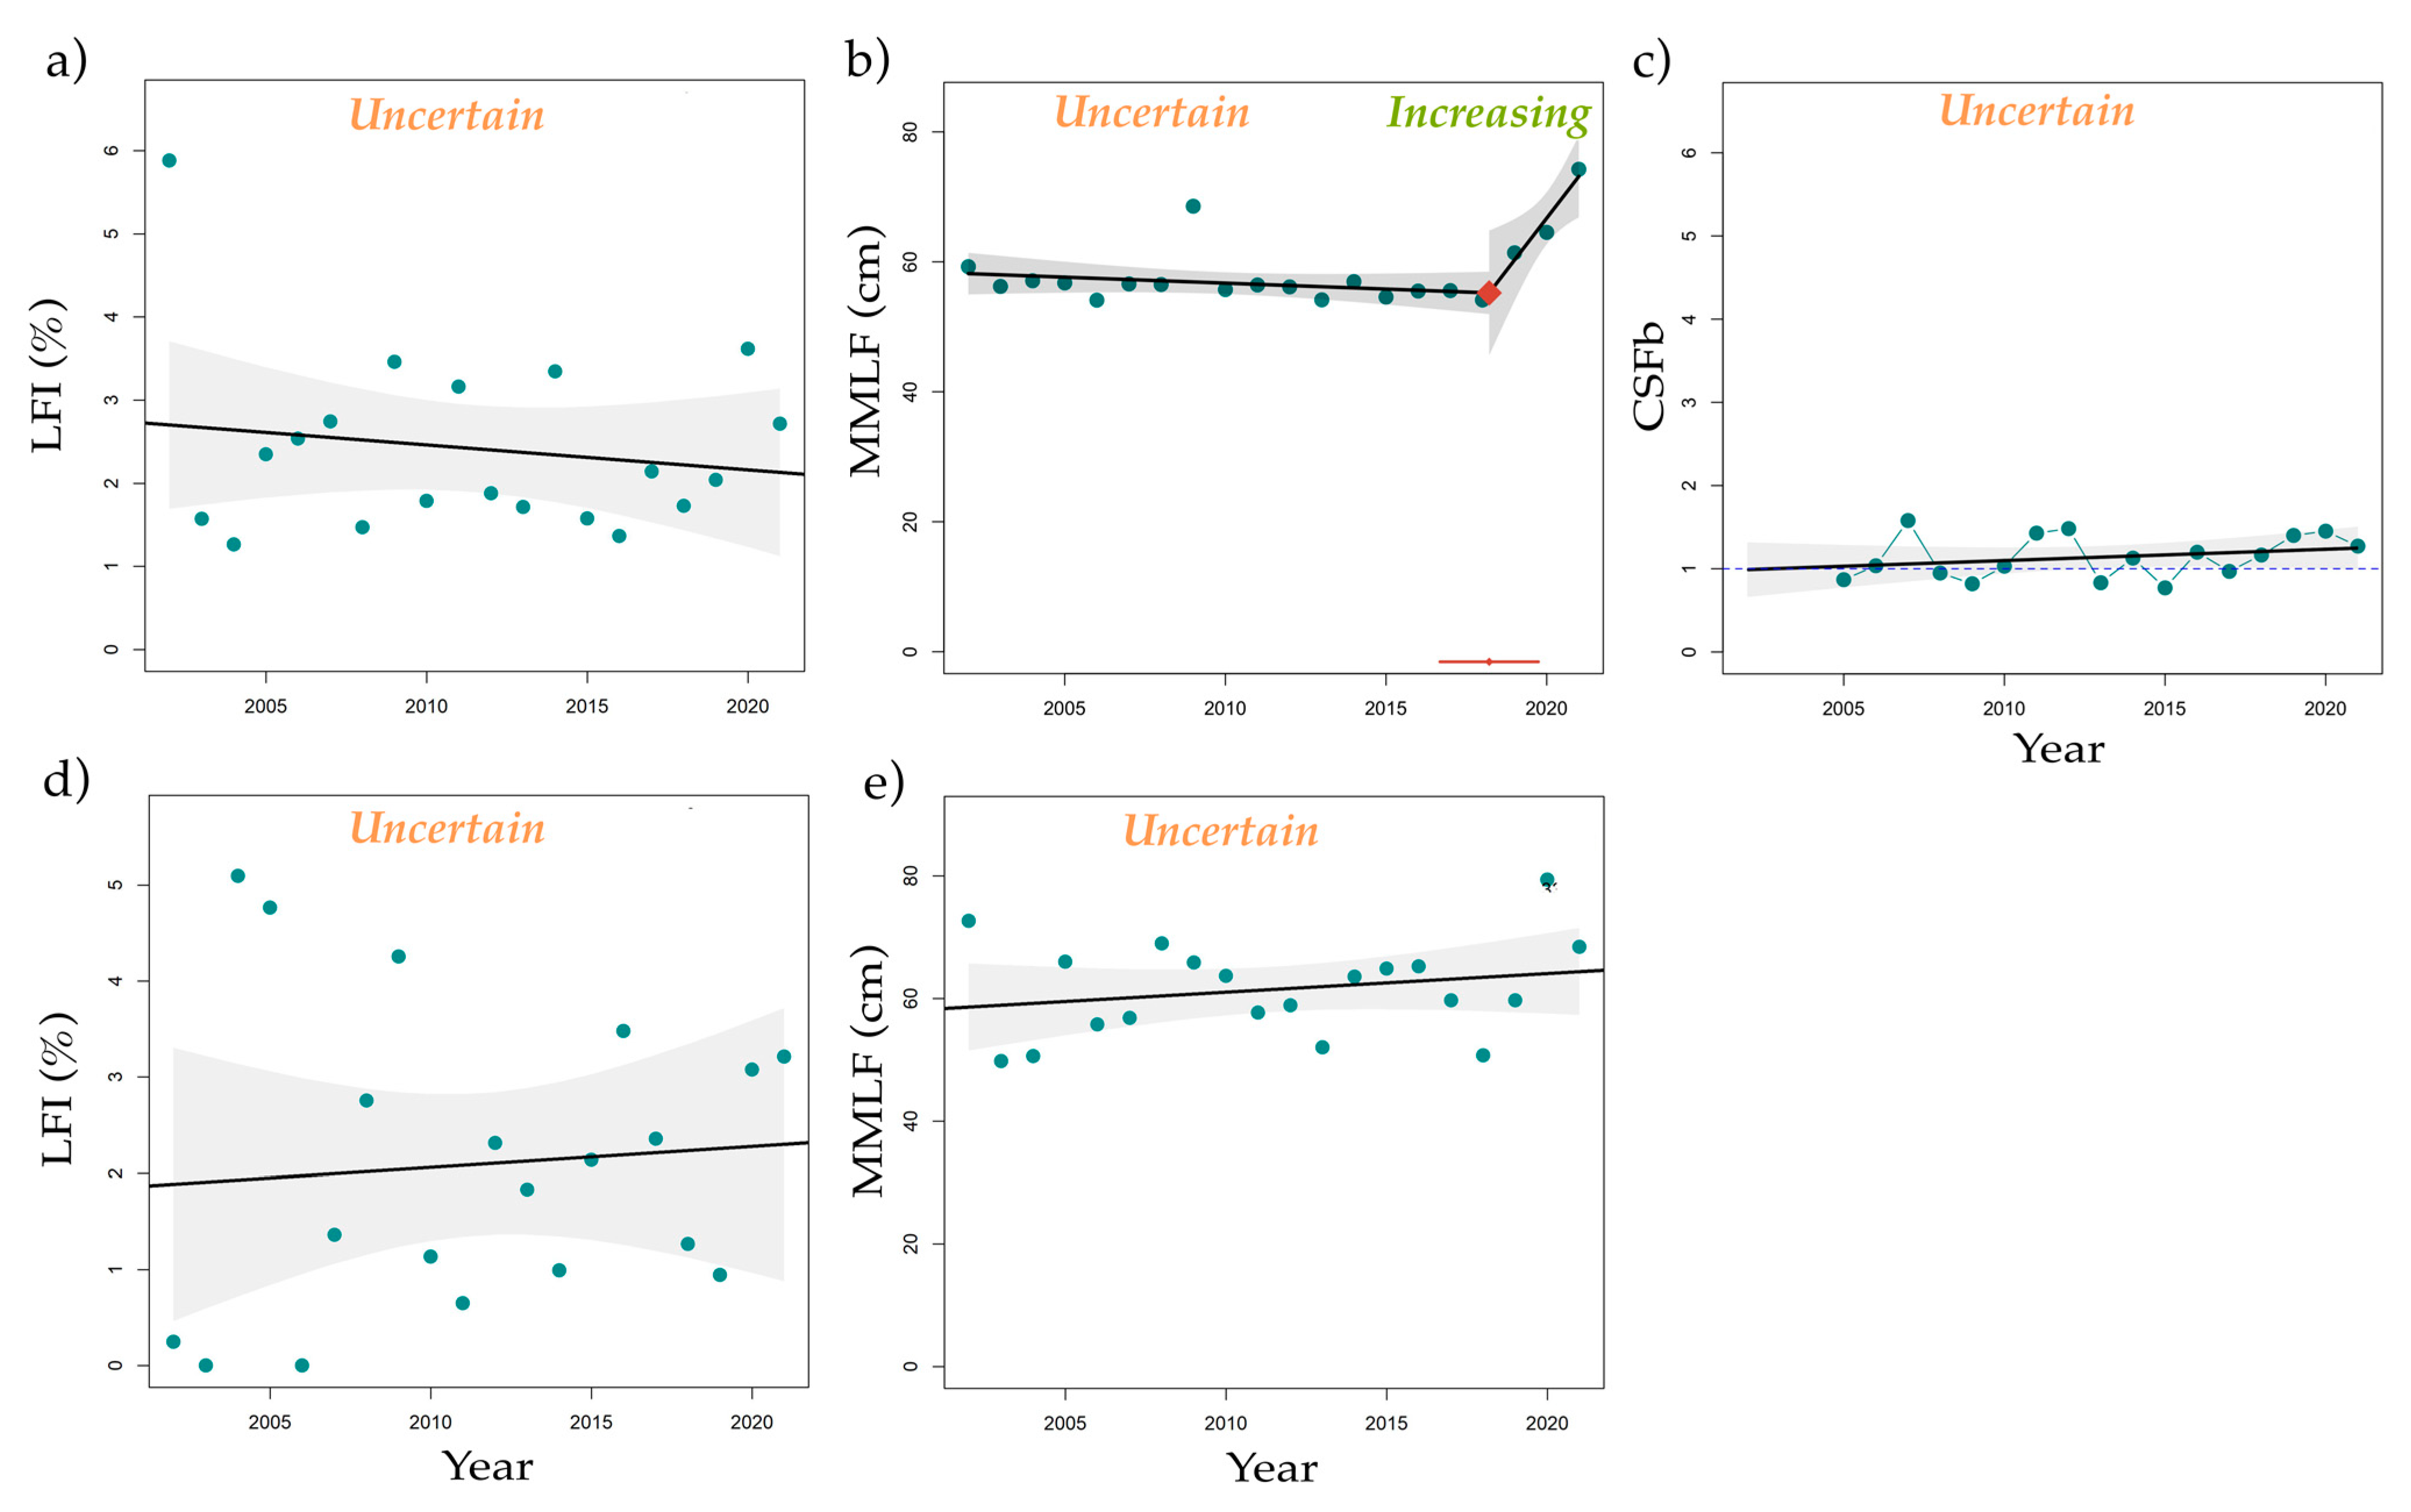
At the functional group level, the area of distribution, stratified density, and biomass of batoids (B1, B2 and B3) increased over the study period. In contrast, the distribution and population size indicators of sharks showed apparent stability, with a few exceptions including the area of distribution of group S1, which decreased from 2002 to 2004, and the biomass of group S2, which decreased from 2010 to 2017 and increased from 2017 to 2021 (Figure 2). With regard to the population status and ecosystem structure indicators, most batoids and shark groups showed stability (Figure 2). Some groups showed different trends along the time series. This was the case of S1, which showed a decrease in P95 from 2004 and an increase in MMLF during the last years (2019–2021) and B2, along with some variability on %Mat trend during the first years (2002–2005). At the community level, ecosystem structure indicators showed general stability (Figure 3). Considering the community as a whole, MMLF showed an increasing trend during the last part of the time series (2018–2021), a similar behavior to the MMLF of group S1. In fact, this trend was not detected when the reduced community was considered by excluding the most abundant species S. canicula, G. melastomus, and R. clavata.
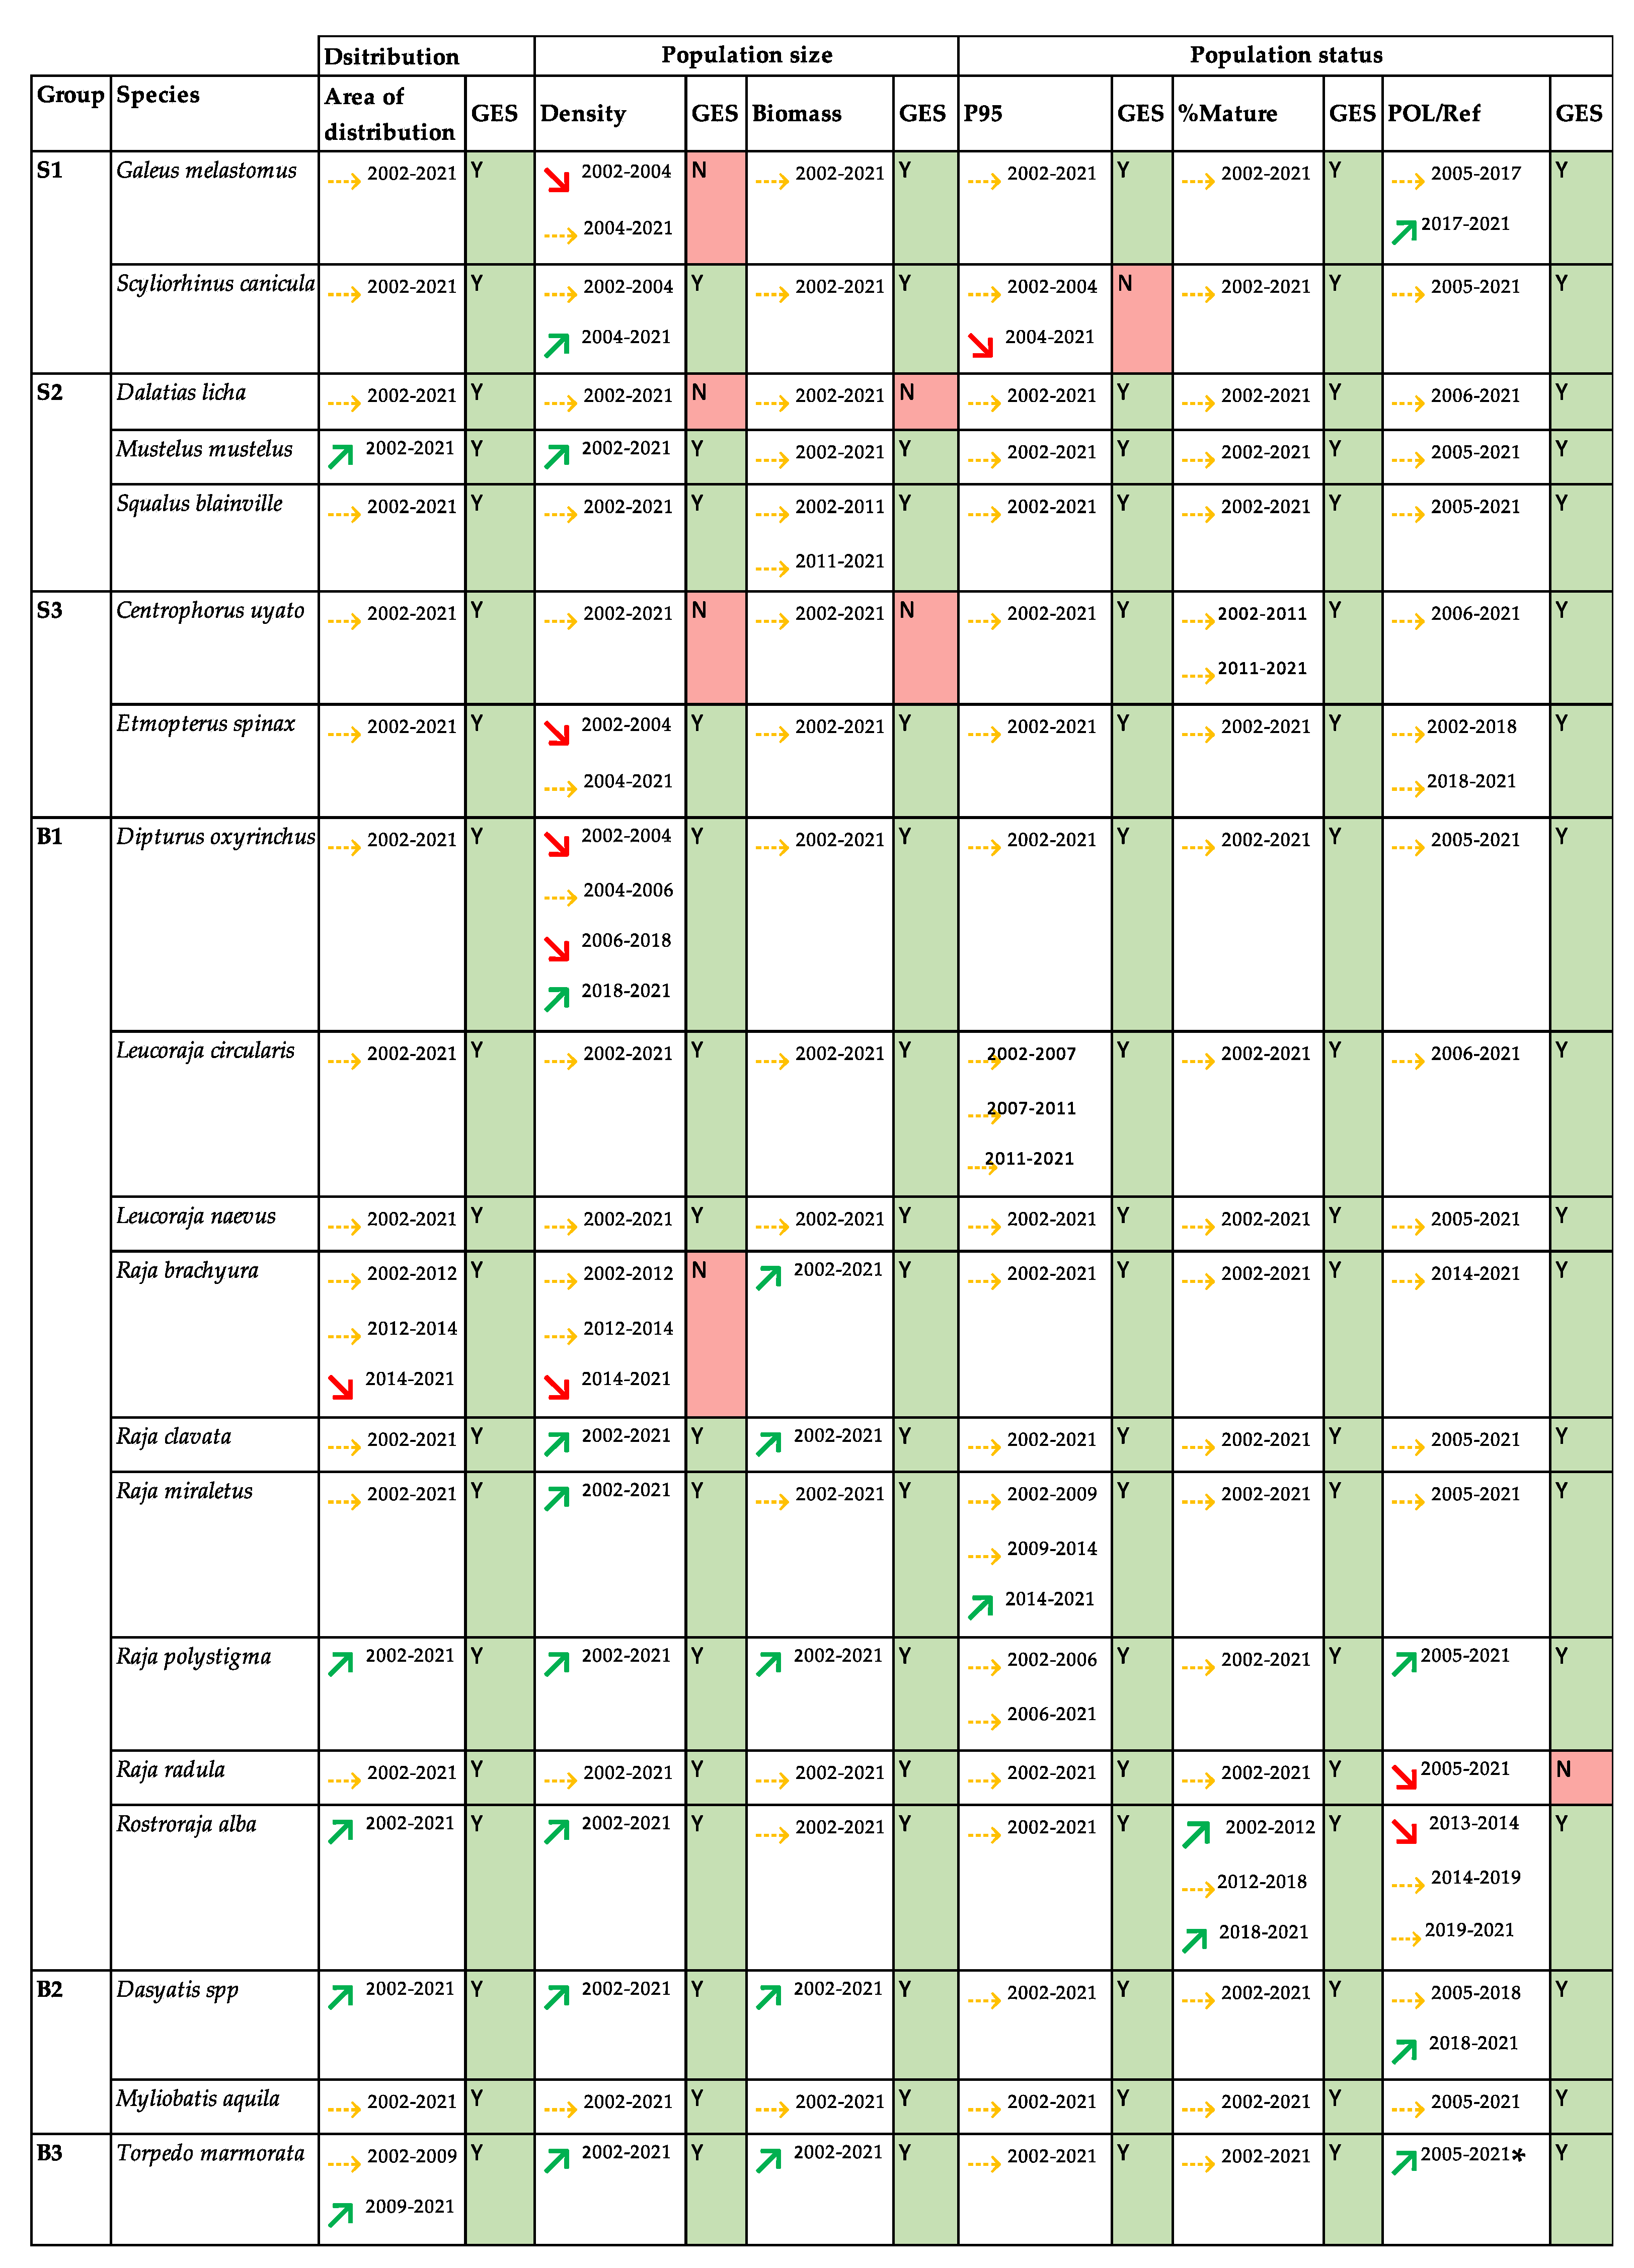
At the population level, different trends were detected for group S1 before and after 2004 (Figure 4). During the first years (2002–2004), the abundance of G. melastomus decreased, while the remaining indicators showed stability. After 2004, the distribution area of G. melastomus was stabilized, while that for S. canicula abundance increased, and P95 changed from stability to a decreasing trend. The Pol/Ref trend of G. melastomus increased during the last years of the time series (2017–2021). In group S2, although Mustelus mustelus showed an increasing trend in terms of distribution and abundance, most of the rest of indicators showed no clear trends. In group S3, trends were uncertain for all indicators evaluated, with the exception of E. spinax, which showed a decreasing trend in abundance during the first years (2002–2004).
Within the batoid group B1, increasing trends dominated in terms of distribution and population size, with the exception of (i) Raja brachyura, which, from 2014 onward, showed negative trends of distribution and abundance, while its biomass maintained a positive trend throughout the entire period, and (ii) Dipturus oxyrinchus, which showed decreasing abundance for most of the period, except for the last 4 years, when the slope became positive. In relation to the temporal evolution of population status, Rostroraja alba presented an increasing trend in %Mature for most of the time series, and R. miraletus showed a growing trend in P95 during recent years (2014–2021). The POL/Ref indicator showed clear trends for Raja radula, with a negative slope throughout all time series, and for R. polystigma, with a sustained increasing trend. In group B2, Dasyatis spp. showed an increasing area of distribution and population size throughout the entire period and an increasing trend in POL/Ref during the last period of the time series (2018–2021). Regarding Mylobatis aquila, no clear trends were detected for any of the indicators. Group B, represented only by Torpedo marmorata, showed general signs of recovery with increasing trends for area of distribution (from 2009) and population size indicators. Note that the increasing POL/Ref trends for Torpedo marmorata should be interpreted cautiously because the Lmax used in this work (maximum length observed in the surveys) is much lower than that reported in the literature [44,45]; thus, it may not be representative of the whole population and not a good proxy of L∞.
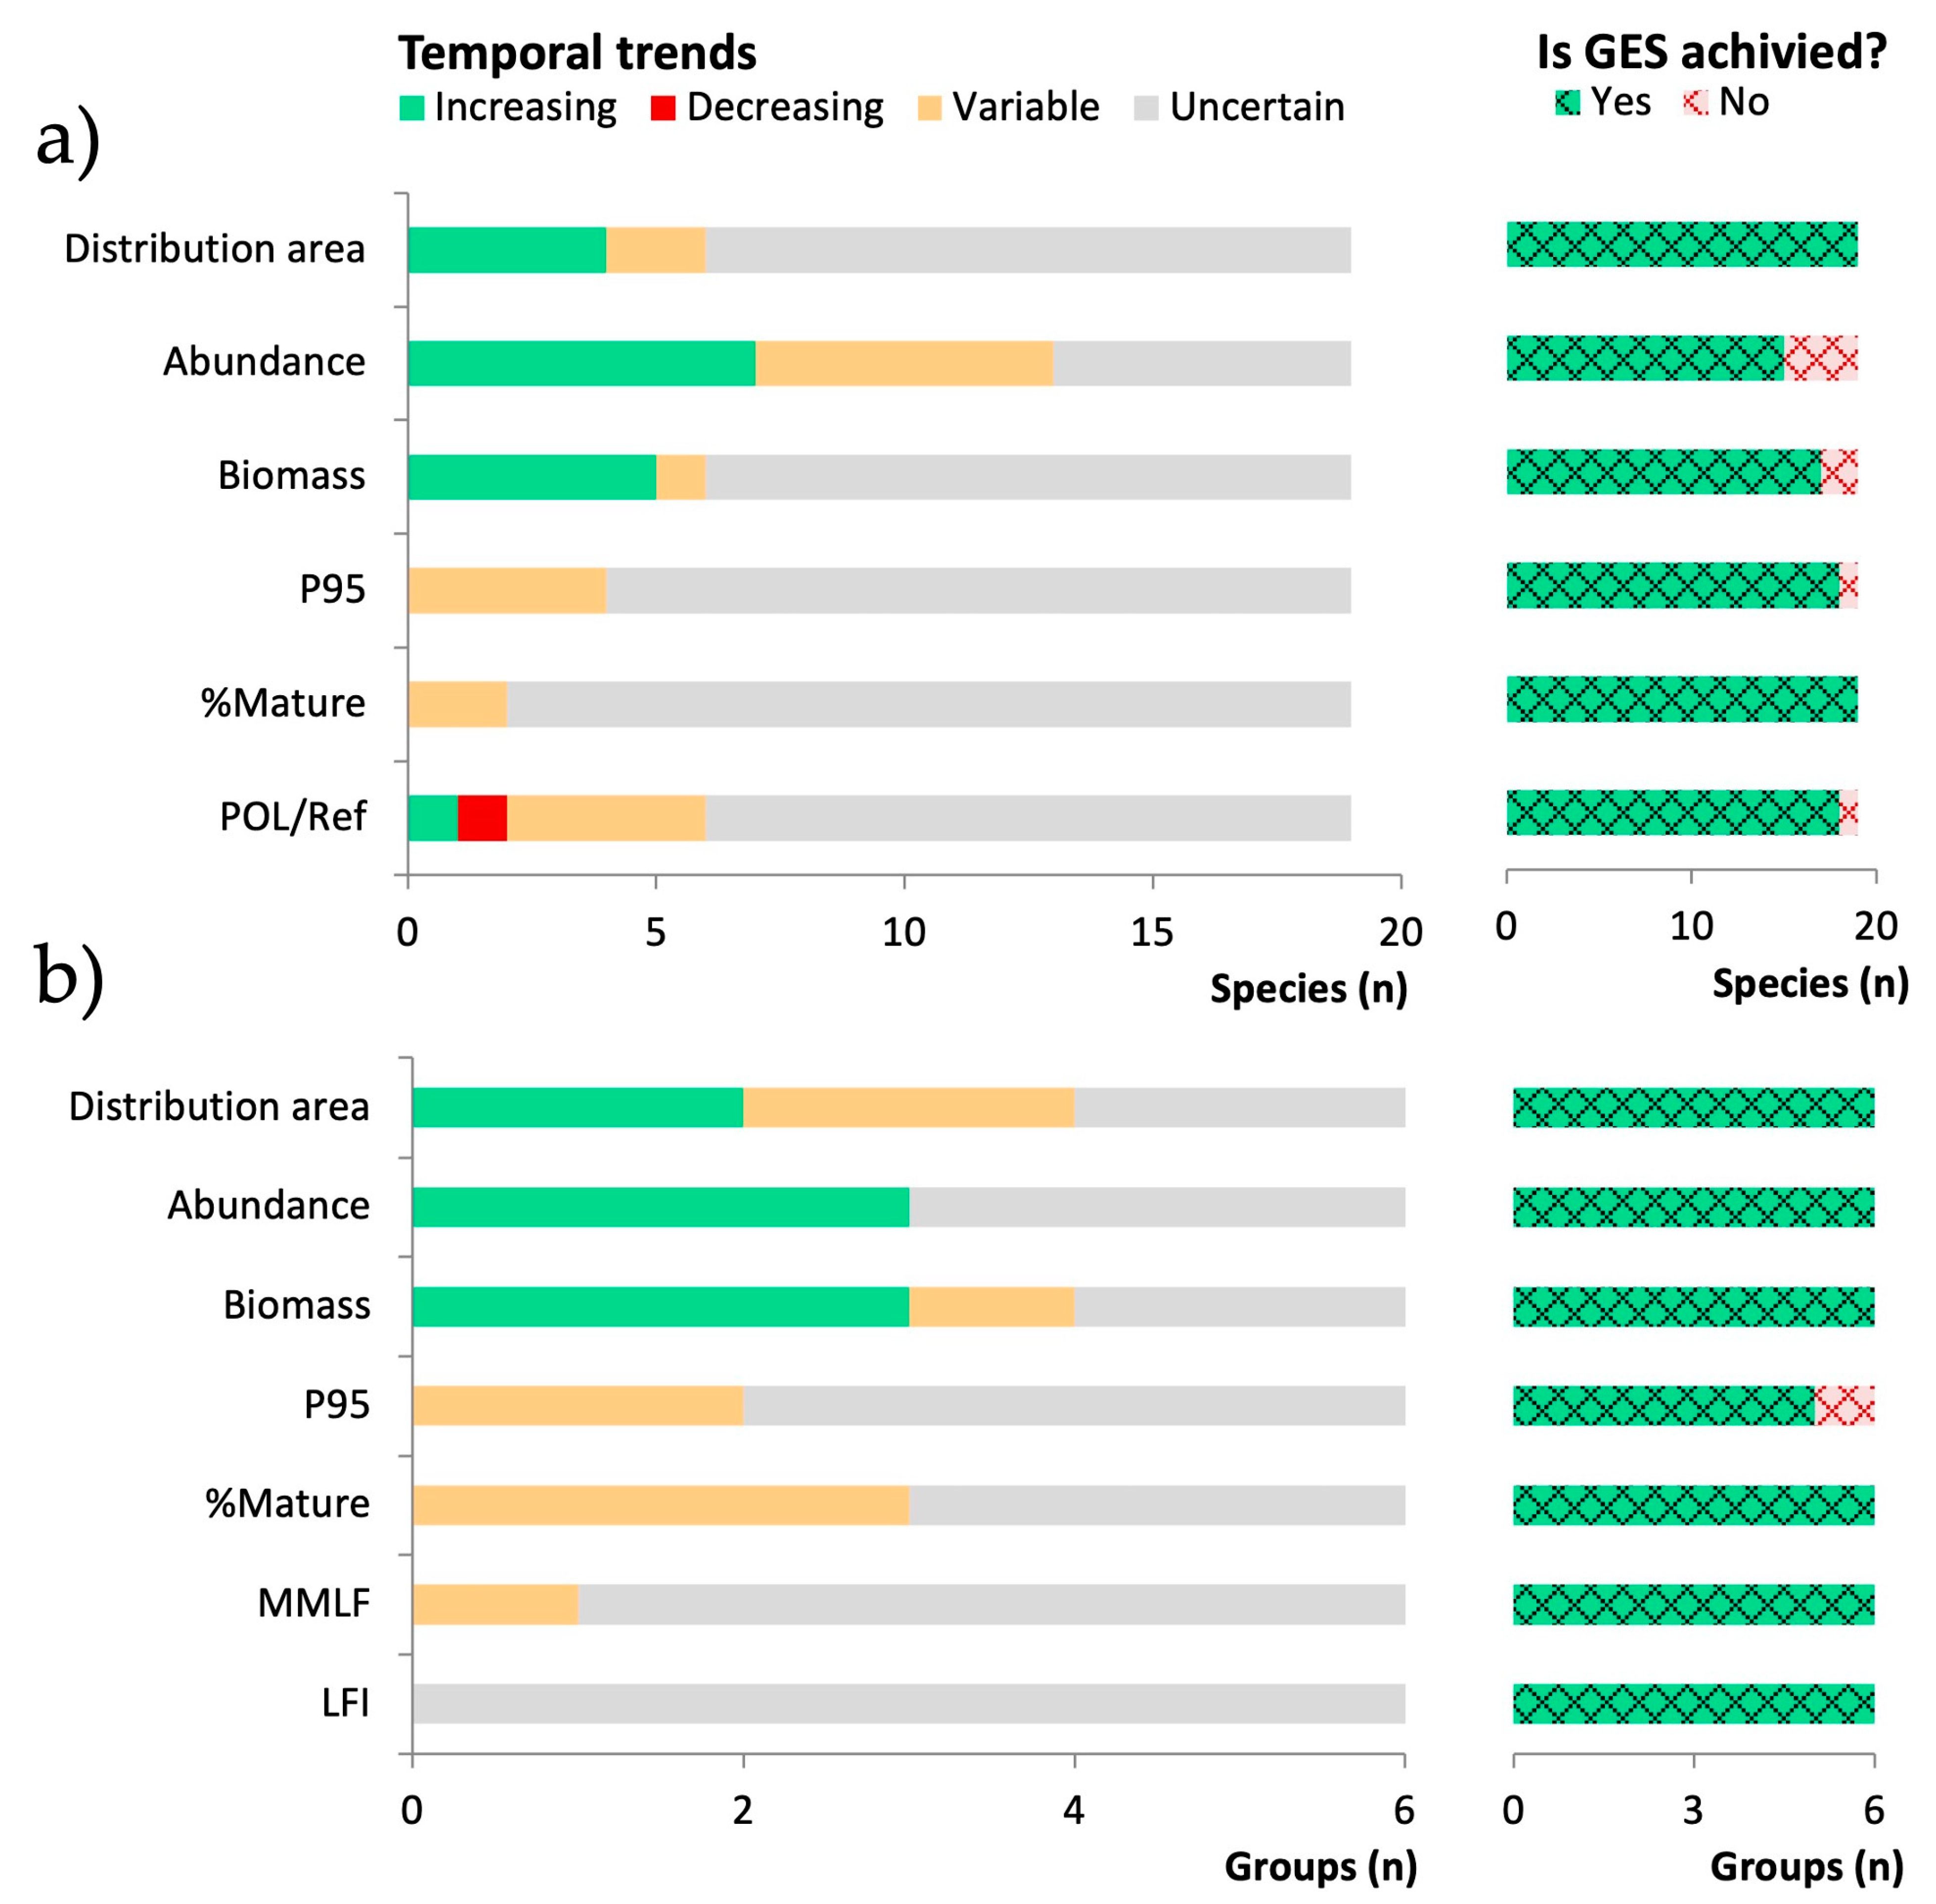
Overall, 30–50% of the species and functional groups analyzed showed an increasing area of distribution and population size (Figure 5). At the species level (Figure 5a), abundance was the indicator that showed more variability throughout the time series (35% of the species), while, at the group level (Figure 5b), population status indicators showed higher variability. At the species level (Figure 5a), GES was achieved by 79–100% of the species, depending on the indicator. Specifically, GES was not achieved for population size indicators of G. melastomus (abundance), Dalatias licha (abundance and biomass), C. uyato (abundance and biomass), and R. brachyura (abundance), nor for specific population status indicators such as P95 of S. canicula and CSFb of R. radula (Figure 4). GES was achieved for all indicators at the functional group (Figure 5b) and community levels (Figure 3), except for P95 of group S1 (Figure 2).
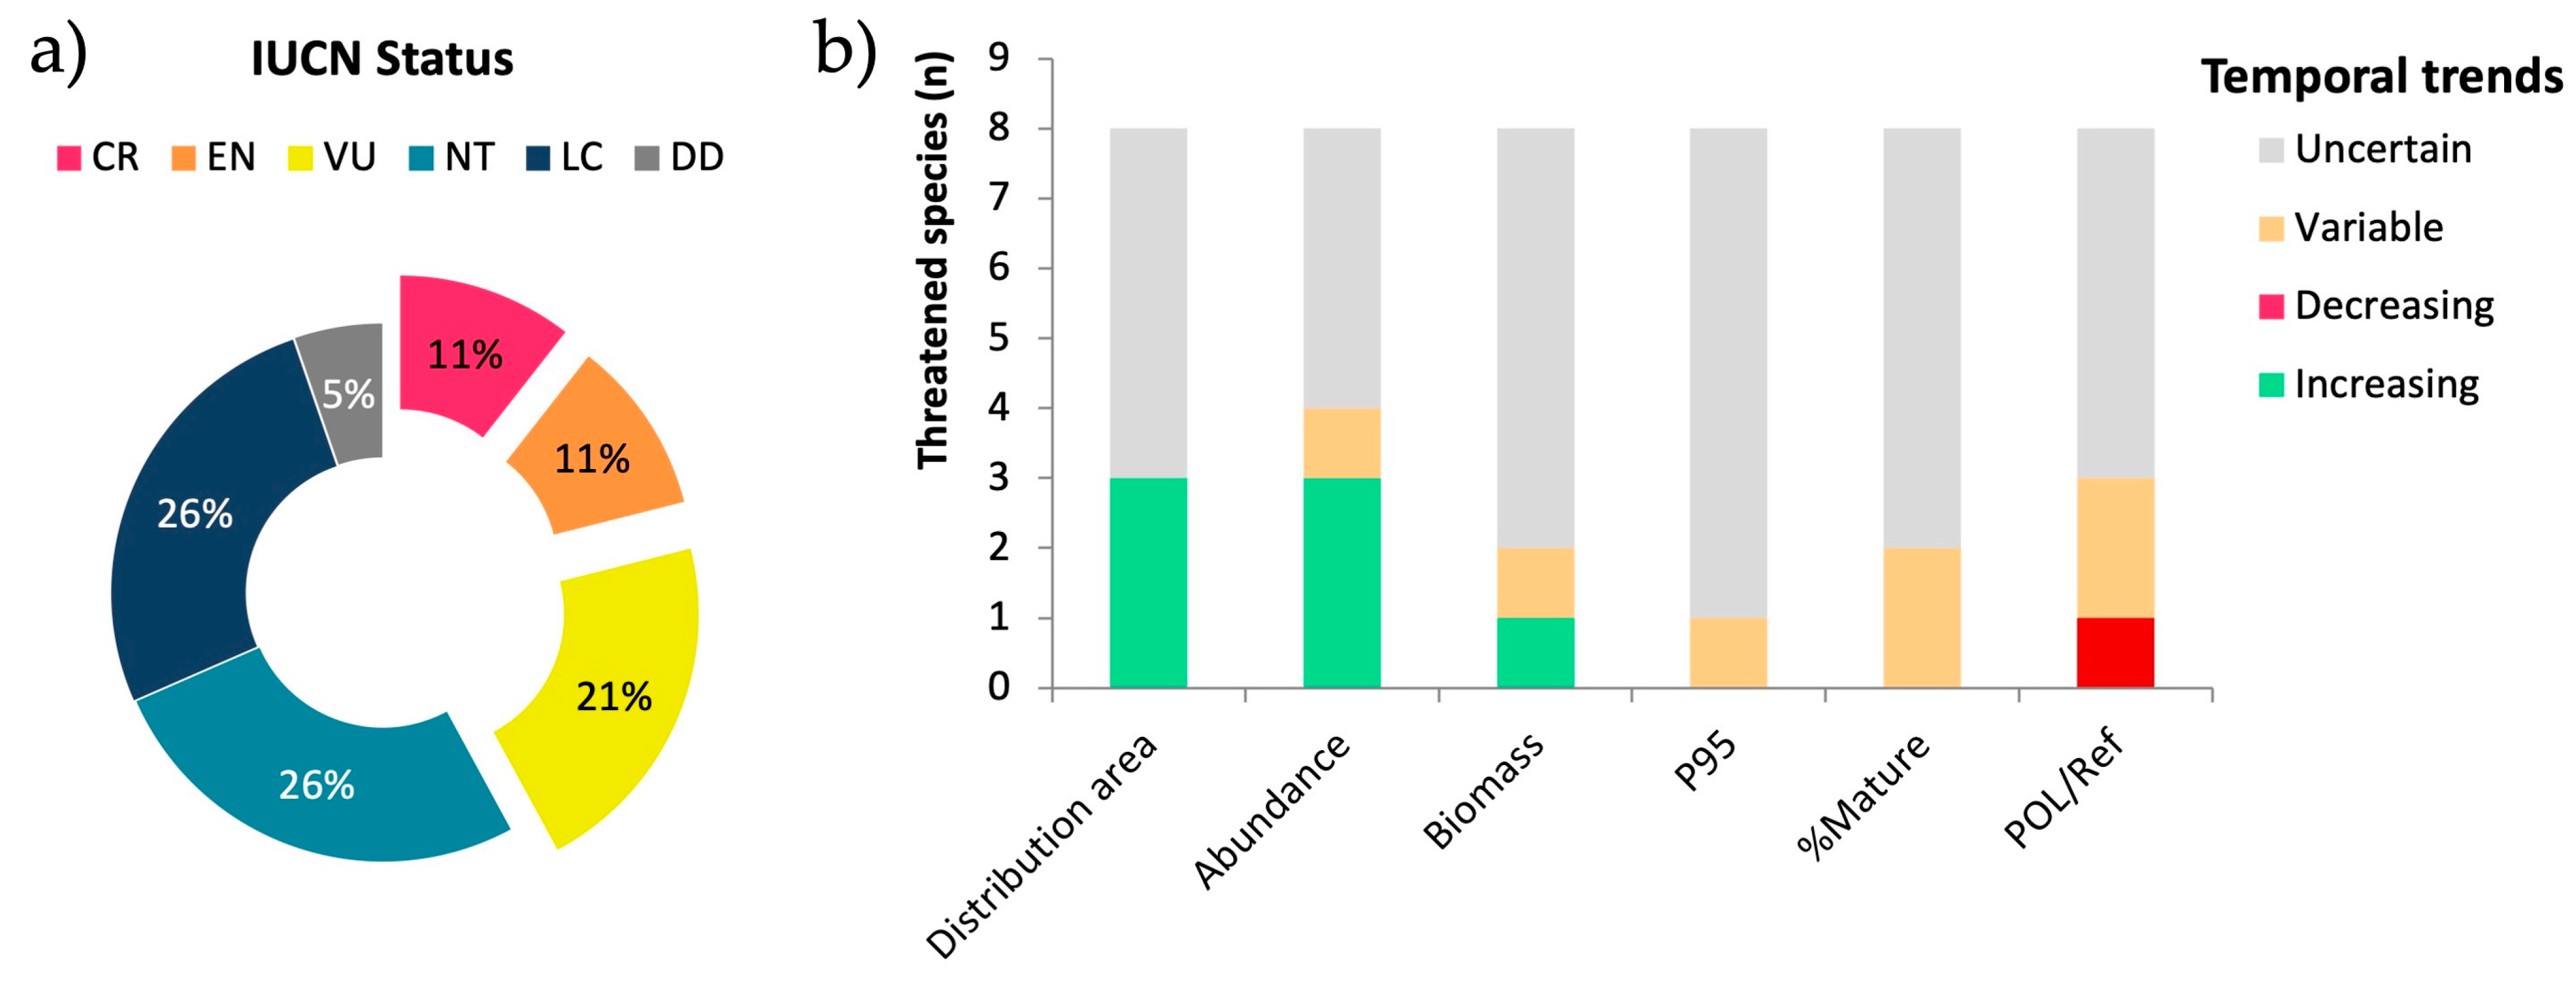
Over 40% of the species included in this work are recorded in the International Union for Conservation of Nature (IUCN) Red List of Threatened Species as vulnerable, endangered, or critically endangered in the Mediterranean (Figure 6a). Most of these species achieved the GES for the analyzed indicators (Figure 6b). However, the GES for population size was not achieved by 25% of the threatened species, which showed variable trends with negative slope on the last segment, and one species (R. radula) did not meet GES for CSFb.
According to the temporal distribution of breakpoints of temporal trends, there are some years in which several trend changes of indicators co-occurred for different species and functional groups (Figure 7). For instance, between 2004 and 2006, there were changes in abundance trend for several species, coinciding with a change in the trend of P95. Specifically, in 2004, three species of sharks (G. melastomus, S. canicula, and E. spinax) and one species of batoid (D. oxyrinchus) improved their abundance trend, although, in the same year, one species suffered a negative trend change for P95. Between the years 2011 and 2012, changes in distribution, population size, P95, and %Mat occurred for different species. In 2014 and 2017–2018, some trend changes also co-occurred. All these periods of change were also detected at the functional group level.

4. Discussion

In a highly multispecies fishery such as Mediterranean bottom trawling [10], the conservation status of the bycatch species should be monitored and included in the fishery assessment and management. This is especially relevant within the current context of the Ecosystem Approach to Fisheries [9] and even more in the case of vulnerable species, such as sharks and batoids, which represent an important fraction of the bycatch of this fishery [11,46,47].
Despite the high vulnerability and worsening threat status of elasmobranchs [14], this is a poorly studied group. The lack of reliable catch time series makes it not feasible to assess the status of their populations through stock assessment models, as conducted for target species of teleosts, decapod crustaceans, and cephalopods. However, fishery-independent scientific surveys provide valuable standardized data of nontarget species such as elasmobranchs. Here, we applied the indicators developed in the frame of the MSFD, to assess the conservation status of the demersal elasmobranch community in the Balearic Islands beyond its dominant species using data from the MEDITS survey, a program of scientific surveys developed with bottom trawl along the whole northern Mediterranean and included in the European framework for the collection, management, and use of data in the fisheries sector to support scientific advice to the Common Fisheries Policy [32].
In general, the elasmobranch community and populations assessed here showed nonsignificant trends for most of the analyzed indicators, and even showed some signs of recovery for several species, mostly batoids and mainly in relation to population distribution and size. Sharks did not show clear dominant trends, except for some specific cases, such as G. melastomus, S. canicula, and E. spinax, with negative slopes at the beginning of the time series, which, after 2004–2005, stabilized or even increased trends for the first two shark species. Regarding population status indicators, trends were not significant except for some particular cases.
Significant trends were mainly detected in the species with the highest frequency of occurrence (e.g., sharks from group S1 and most batoids from group B1), with some exceptions of less common species (e.g., R. alba), especially with regard to the indicators of distribution and population size. In the initial National Assessment Report for the implementation of the MSFD in Spain, only three elasmobranchs, the most common S. canicula, G. melastomus, and R. clavata, were included in Descriptor 1 for the Eastern and Balearic Demarcation, which covers the northeastern Iberian Peninsula and the Balearic Islands [48]. For each indicator, population temporal trends were described and classified into three categories: increasing, decreasing, and stable. The first two categories referred to significant trends with positive and negative slopes, respectively, while the latter category was assigned to species showing nonsignificant trends. In the present study, we expanded the MSFD evaluation beyond the most common species, including those with lower frequency of occurrence for which data are not available for all years (e.g., C. uyato and D. licha). For this reason, and to be more conservative regarding the potential scientific advice for the management of these vulnerable species, on the basis of our results, we adapted trend categories, classifying the nonsignificant trends as uncertain instead of stable. In the case of the most common species with nonsignificant slopes, herein classified as uncertain, trends could be considered stable, whereas, for less frequent species, the trend could not be described with certainty.
Elasmobranchs, due to their K-selected life-history strategies and their high trophic position [49], are species particularly vulnerable to fisheries and can be considered indicators of fishing pressure. Although it was already known that Balearic Islands have higher diversity and density of the demersal elasmobranch community than the adjacent waters of the Iberian Peninsula, probably due to a lower intensity in fishing exploitation together with some biogeographic factors [16,17], the apparent general stability or recovery trends described here contrast with the global and Mediterranean trends [2,14,15]. This may be explained by the temporal evolution of the fishing effort in this area, especially regarding the bottom trawl fleet, which represents the most important demersal fishery around the Balearic Archipelago [31]. This fleet uses low selective fishing gears, with high bycatch and discard rates, thus having a high impact on the benthic and nektobenthic species, including elasmobranchs [11,50,51].
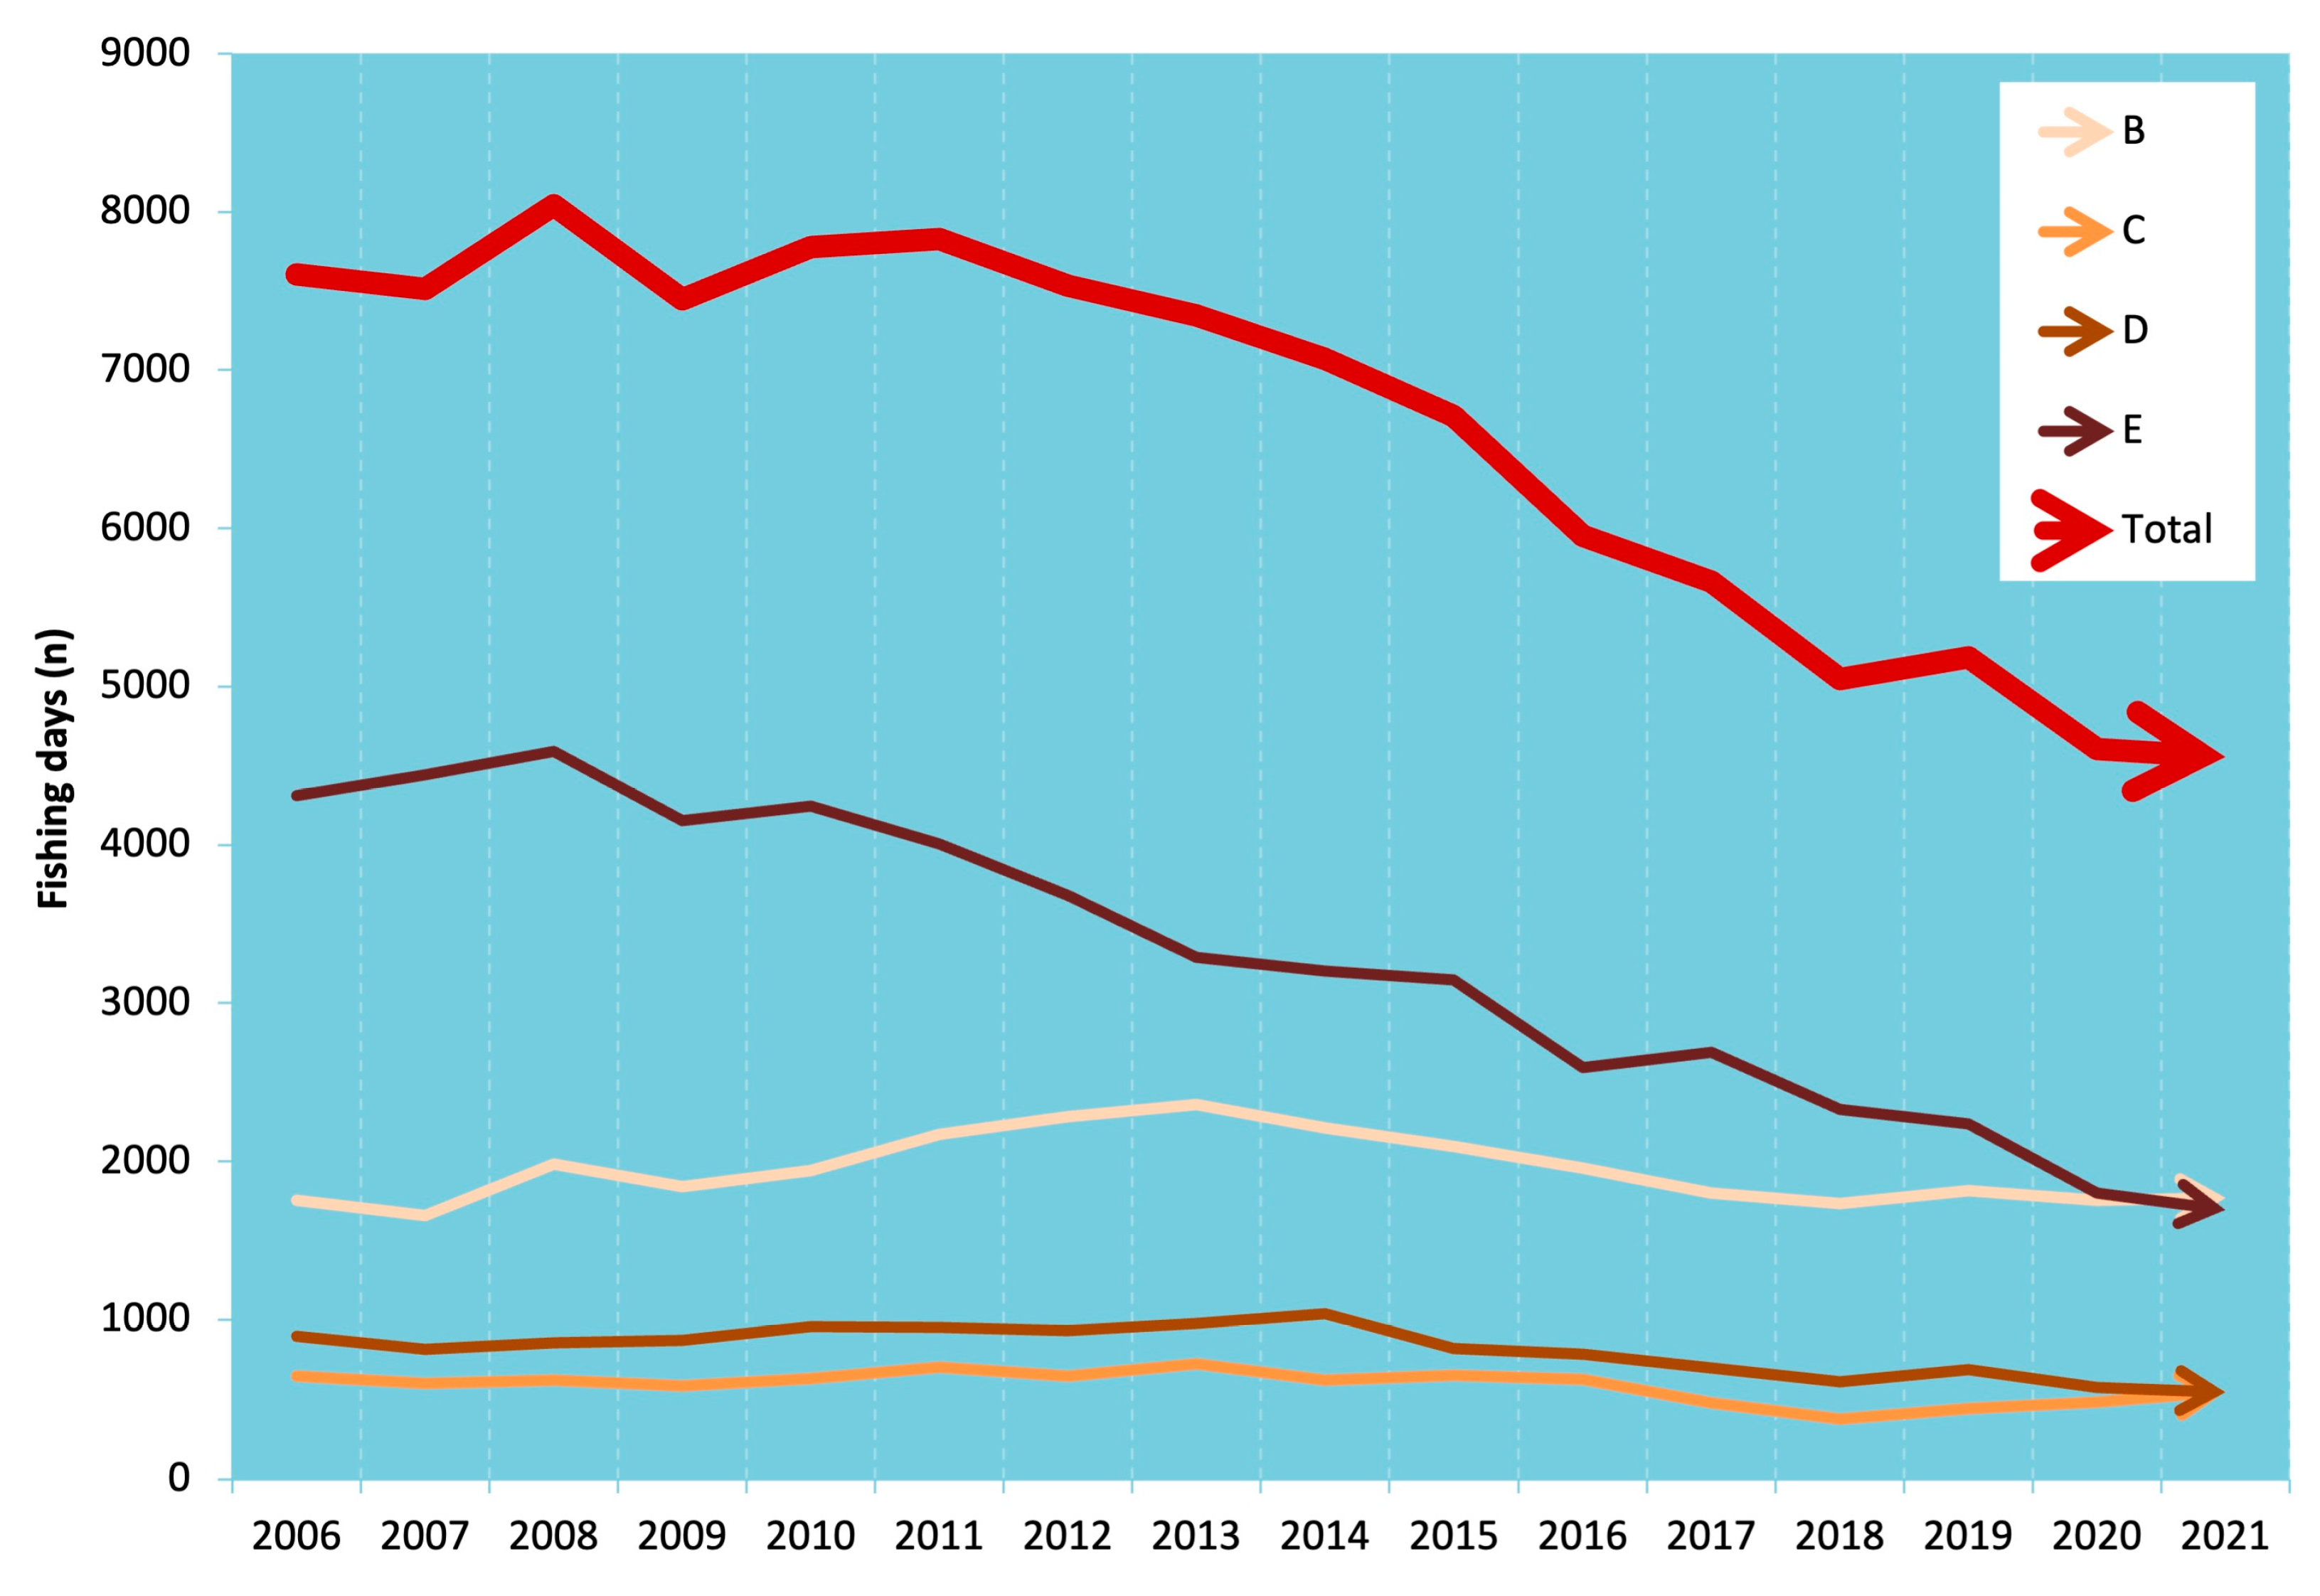
In this area, despite the sustained decrease in the number of bottom trawlers since the mid-1970s, the fishing capacity remained quite constant, and even higher, due to the continuous increase in the engine power of the vessels [52]. In fact, their landings did not show any decrease, and they remained fairly stable. However, during the last decade, the engine power of the vessels did not increase, mainly due to the continuous increase in oil prices (up to 45%), which represents a high percentage of running costs of the trawl fleet, but the number of vessels continued to decline [52]. Indeed, the analysis of the Vessel Monitoring by Satellite System (VMS), since its implementation in this fleet in 2006, showed a constant decrease of the number of trawl fishing days around the Balearic Islands (Figure 8). This reduction, which represents up to 60%, is especially pronounced in the intermediate slope fishing grounds (Figure 8, strata E), between 501 and 800 m depth. This could be explained by the greater distance between these fishing grounds and the ports and some episodes of sudden and strong reductions in the catches of red shrimp (Aristeus antennatus), the target species of bottom trawling at this depth, mainly due to environmental factors influencing the availability of this species to fishing exploitation [53,54], which have occurred in the study area (personal observations). Moreover, because the economic crisis during the recent years, consumption habits could have changed, reducing the demand for deep water decapod crustaceans of high economic value and increasing the demand for cheaper species, fish and cephalopods, which are caught on the continental shelf [55,56]. The continental shelf and upper slope (strata B–D, between 51 and 500 m depth) showed a fairly stable effort trend, but also a slightly decreasing one after 2013–2014. Therefore, it would be reasonable to attribute the observed trends here described in the elasmobranch community to the decrease in trawl fishing effort.
Our results agree with previous studies developed in the same area, but from different approaches [12,18], which also suggest similar optimistic recent trends for the elasmobranch community from the continental shelf, but not for deep water species. These authors attributed the increase in some slope-dwelling species during the last decades to (i) the change in the bathymetric distribution of the fishing effort due to the bottom trawl fleet displacement toward greater depths, targeting the red shrimp, which has resulted in an effort reduction on the continental shelf bottoms [57,58], and (ii) different degrees of resilience of species [1].
Environmental factors could also be playing a role in determining population dynamics and trends. It is expected that the multiage population structure of elasmobranchs could buffer to some extent the effects of environmental fluctuations [59]. However, fishery exploitation can lead to truncated age structures, increasing population sensitivity to environmental factors [60]. Climate change has been linked to the distributional shifts [61,62] and bathymetric range reductions [63] of elasmobranchs.
Despite the increasing abundance trend of S. canicula, our results showed a decrease in the 95th percentile of its size frequency distribution (P95) after 2004. A decrease in the value of size indicators is usually a sign of an increase in fishing pressure [39]; however, as previously mentioned, the bottom trawl fishing effort, the fishery that exploits this species almost exclusively in the Balearic Islands, has decreased since 2011. Interestingly, a decreasing trend in the length of first maturity for S. canicula was detected in the area, suggesting an evolutionary response to overfishing [18]. Fishing mortality can lead to changes in population dynamics, through compensatory changes or evolutionary response to overfishing [1]. Increased survival of juveniles, rather than increased fecundity, also provides greater resilience to fishing pressure [64]; thus, changes in P95 could be either a direct consequence of the fishery removal of larger specimens or an evolutionary response to it.
According to the temporal distribution of breakpoints, some periods of generalized changes in elasmobranch populations trends were identified. In 2004–2005, several trend changes co-occurred. In agreement, Ramirez-Amaro et al. (2020) [18] also described relevant changes in the diversity indices until 2004, when trends became stable. Between 2011 and 2012, several trend changes also took place, in this case coinciding with the decrease in the trawl fishery total effort.
The populations of threatened species showed uncertainty in general. Increasing trends were described for 30% of these species, e.g., M. mustelus or R. alba. Some species showed decreasing trends (e.g., R. radula for POL/Ref) or did not achieve GES for the population size indicators, e.g., the critically endangered C. uyato or the vulnerable D. licha. The GFCM recommendations require high protection from fishing activities for elasmobranch species listed in Annex II of the Barcelona Convention (GFCM/42/2018/2), as in the case of R. alba, including species-specific actions for some species (GFCM/44/2021/16). Given that, a bigger percentage of increasing trends would be desirable, and efforts should be made to improve the conservation status of threatened populations.
The Mediterranean has suffered intense fishing for centuries [65]. The community composition described here matches the descriptions from other recent studies [18], but it shows major changes compared to the elasmobranch community before the development of industrial fisheries in the 1960s. Species such as S. canicula and G. melastomus, which currently predominate in the elasmobranch assemblages and represent a significant fraction of their current catches, may have had lower occurrence and abundance. Bottom trawling can change benthic communities and modify the abundance of the preferred preys of these species, as well as increase the availability of fishing discards on which they have also been observed to feed in the northeast Atlantic [66,67,68]. This could also happen in the Mediterranean, where a very generalist diet for S. canicula [69] and a change in the feeding habits of G. melastomus have been suggested, due to the additional energy provided by fishing discards [70,71]. In contrast, previously fairly common species, such as Scyliorhinus stellaris, Galeorhinus galeus, and Oxynotus centrina have practically disappeared from current fishing catches, while other species such as Torpedo torpedo, Squalus acanthias, Rhinobathos spp., and Squatina spp. can even be considered locally extinct or near extinction [72]. Thus, the current apparent steady state could be interpreted as a new equilibrium. In this sense, it should be noted that shifting baselines may lead to failure to perceive true levels of decline [73]. Historical records and studies could provide more realistic perspective for the interpretation of current population status. In the northwestern Mediterranean, historical data have shown a clear decline in demersal elasmobranch species populations since the 1960s [74]. Given that, trends reported in studies covering only the last decades should be interpreted carefully. For instance, according to Aldebert, M. mustelus suffered an important decrease at the beginning of the intense industrial fishing period, due to its economic value; thus, the increasing trend in distribution and population size reported in the present work should not be interpreted as evidence of good conservation status, but a sign of possible recovery if the trend is maintained into the future.
The use of a set of indicators developed within the framework of the MDSF allowed us to obtain an evaluation of the status of conservation of the elasmobranch community, at both a general and a species level, using agreed parameters to define the GES. Given that elasmobranchs are K-strategists, the GES definitions for vulnerable species have been applied, despite not all elasmobranchs being equally vulnerable. Future evaluations could take into consideration the lower potential of recovery from exploitation of large and/or late-maturing species [15] such as D. oxyrinchus, R. alba, and E. spinax [75,76,77]. In the MSFD frame, the GES is defined on the basis of indicator trends and, when applicable, in relation to threshold values. In this study, as well as in the initial evaluation for the implementation of the MSFD [48], reference values were used for the indicators of population size and fish conservation status. Defining GES in this way gives interesting results since, for example, GES was not achieved by G. melastomus, D. licha, and C. uyato in terms of population size indicators, despite showing increasing or uncertain trends. Further work is required to define threshold values for all indicators.

5. Conclusions

Although elasmobranch populations in the Mediterranean have generally decreased over the last decades, the demersal sharks and rays of the Balearic Islands present certain stability and even signs of recovery, probably due to the reducing bottom trawl fishing intensity in the area. This was observed with regard to the distribution and size of batoid populations. For the indicators of the state of the population and their conservation, no clear trends were found, except for specific, particularly relevant cases. This is the case for species cataloged as vulnerable or endangered, such as M. mustelus or R. alba, respectively, which show clear increasing trends for the indicators of abundance and percentage of mature individuals, respectively. Altogether, these results allow for some optimism about the sustainability of elasmobranch populations around the Balearic Islands and highlight the importance of monitoring and assessing bycatch species in order to generate the required scientific knowledge to develop and apply the Ecosystem Approach to Fisheries. However, it remains difficult to predict whether the demersal elasmobranch community of the Balearic Islands will recover to the levels of more than half a century ago or whether this apparent current steady state should be interpreted as a new equilibrium.

Supplementary Materials

The following supporting information can be downloaded at https://www.mdpi.com/article/10.3390/fishes8050230/s1, Table S1: Summary of information related to length at first maturity (L50) for demersal elasmobranchs distributed in the Balearic Islands; Table S2: Total standardized density and standardized biomass for each stratum; Table S3: Density temporal trend fitted through linear or segmented regressions (slope, p-value, 95% confidence interval, and adjusted R2); Table S4: Density temporal trend fitted through linear or segmented regressions (slope, p-value, 95% confidence interval, and adjusted R2); Table S5: Area of distribution temporal trend fitted through linear or segmented regressions (slope, p-value, 95% confidence interval, and adjusted R2); Table S6: The 95th percentile temporal trend fitted through linear or segmented regressions (slope, p-value, 95% confidence interval, and adjusted R2); Table S7: Temporal trend of percentage of mature specimens fitted through linear or segmented regressions (slope, p-value, 95% confidence interval, and adjusted R2); Table S8: Mean maximum length of fish temporal trend fitted through linear or segmented regressions (slope, p-value, 95% confidence interval, and adjusted R2); Table S9: Large fish index temporal trend fitted through linear or segmented regressions (slope, p-value, 95% confidence interval, and adjusted R2); Table S10: Proportion of large individuals in relation to the reference period, temporal trend fitted through linear or segmented regressions (slope, p-value, 95% confidence interval, and adjusted R2); Table S11: Conservation status of fish temporal trend fitted through linear or segmented regressions (slope, p-value, 95% confidence interval, and adjusted R2).

Author Contributions

Conceptualization, A.S. and E.M.; formal analysis, A.S. and M.T.F.; funding acquisition, B.G. and E.M.; investigation, A.S., M.T.F., S.R.-A. and E.M.; methodology, A.S., M.T.F., S.R.-A. and E.M.; supervision, E.M.; validation, F.O.; visualization, A.S.; writing—original draft, A.S.; writing—review and editing, A.S., M.T.F., S.R.-A., F.O., F.F.-P., B.G. and E.M. All authors have read and agreed to the published version of the manuscript.

Funding

This research was developed within the 12-ESMARES2-C1A3 project, included in the scientific program “Asesoramiento científico-técnico para la protección del medio marino: Evaluación y seguimiento de las Estrategias Marinas, Seguimiento de los espacios marinos protegidos de competencia estatal (2018–2021)”, funded by the General Directorate of Sea Protection of the Ministry for the Ecological Transition and the Demographic Challenge, as well as the SosMed project “Mejora del conocimiento científico-técnico para la sostenibilidad de las pesquerías demersales del Mediterráneo occidental”, funded by UE-Next Generation (agreement between the Spanish Ministry of Agriculture, Fisheries and Food and the National Research Council CSIC, through the Spanish Institute of Oceanography IEO). The MEDITS research surveys were co-funded by the European Union through the European Maritime Fisheries and Aquaculture Fund (EMFAF) within the National Program of collection, management and use of data in the fisheries sector and support for scientific advice regarding the Common Fisheries Policy. F. Ferragut-Perello received financial support of the Department of European Funds, University, and Culture of the Regional Government of the Balearic Islands, through the grants for the training of research personnel 2021. S. Ramírez-Amaro also received financial support of the Government of the Balearic Islands and the European Social Fund through a postdoctoral contract within the “Vicenç Mut Estabilitat” program.

Institutional Review Board Statement

Data were obtained in the framework of the MEDITS project and refer to the Balearic Islands (GFCM/GSA5). The sampling scheme followed a standardized protocol approved by international authorities (EU/DG Mare, FAO/GFCM). If a live specimen of a rare species or a species subject to conservation measures was caught, it was quickly sampled (4–5 min) and returned to the sea unharmed, giving it a chance for survival, following the recommendation GFCM/36/2012/3 (http://www.gfcmonline.org/decisions/, accessed on 9 February 2023) on fisheries management measures for the conservation of sharks and rays in the GFCM area. In the cases the animal was alive when it arrived on the vessel during the scientific survey (MEDITS—DCF, EU Reg. 199/2008), it was suppressed by administering an overdose of anesthetic in compliance with the recommendation of Decree Law n. 26 of 4 March 2014. All efforts were made to minimize suffering.

Data Availability Statement

Restrictions apply to the availability of these data. Data were obtained from the fisheries sector and bottom trawl surveys, and they are available from the authors with the permission of the providers.

Acknowledgments

The authors thank the participants of the BALAR and MEDITS surveys and the crew of the research vessels on which they were carried out (Francisco de Paula Navarro, Cornide de Saavedra and Miguel Oliver). Joan P. Casas-Ruiz provided assessment and guidance on the statistical analysis and data visualization, as well as helped with Figure 7 and language revisions.

Conflicts of Interest

The authors declare no conflict of interest.

References

  1. Stevens, J.D.; Bonfil, R.; Dulvy, N.K.; Walker, P.A. The Effects of Fishing on Sharks, Rays, and Chimaeras (Chondrichthyans), and the Implications for Marine Ecosystems. ICES J. Mar. Sci. 2000, 57, 476–494. [Google Scholar] [CrossRef]
  2. Dulvy, N.K.; Allen, D.J.; Ralph, G.M.; Walls, R.H.L. The Conservation Status of Sharks, Rays and Chimaeras in the Mediterranean Sea; IUCN Centre for Mediterranean Cooperation: Málaga, Spain, 2016. [Google Scholar]
  3. Engelhard, G.H. One Hundred and Twenty Years of Change in Fishing Power of English North Sea Trawlers. In Advances in Fisheries Science: 50 Years on From Beverton and Holt; Payne, A.I.L., Cotter, J., Potter, T., Eds.; John Wiley & Sons: Hoboken, NJ, USA, 2008; pp. 1–25. [Google Scholar]
  4. Swartz, W.; Sala, E.; Tracey, S.; Watson, R.; Pauly, D. The Spatial Expansion and Ecological Footprint of Fisheries (1950 to Present). PLoS ONE 2010, 5, 15143. [Google Scholar] [CrossRef] [PubMed]
  5. Ferretti, F.; Worm, B.; Britten, G.L.; Heithaus, M.R.; Lotze, H.K. Patterns and Ecosystem Consequences of Shark Declines in the Ocean. Ecol. Lett. 2010, 13, 1055–1071. [Google Scholar] [CrossRef] [PubMed]
  6. Dulvy, N.K.; Fowler, S.L.; Musick, J.A.; Cavanagh, R.D.; Kyne, P.M.; Harrison, L.R.; Carlson, J.K.; Davidson, L.N.; Fordham, S.V.; Francis, M.P.; et al. Extinction Risk and Conservation of the World’s Sharks and Rays. Elife 2014, 3, e00590. [Google Scholar] [CrossRef] [PubMed]
  7. Castro, J.I.; Woodley, C.M.; Brudek, R.L. A Preliminary Evaluation of the Status of Shark Species; Food and Agriculture Organization of the United Nations: Rome, Italy, 1999. [Google Scholar]
  8. GFCM Recommendation GFCM/44/2021/16 on Additional Mitigation Measures for the Conservation of Elasmobranchs in the Mediterranean Sea. 2021. Available online: https://www.fao.org/gfcm/decisions/en/ (accessed on 9 February 2023).
  9. Browman, H.I.; Sterigou, K.I. Perspectives on Ecosystem-Based Approaches to the Management of Marine Resources. Mar. Ecol. Prog. Ser. 2004, 274, 269–303. [Google Scholar] [CrossRef]
  10. Lleonart, J.; Maynou, F. Fish Stock Assessments in the Mediterranean: State of the Art. Sci. Mar. 2003, 67, 37–49. [Google Scholar] [CrossRef]
  11. Carbonell, A.; Alemany, F.; Merella, P.; Quetglas, A.; Román, E. The By-Catch of Sharks in the Western Mediterranean (Balearic Islands) Trawl Fishery. Fish. Res. 2003, 61, 7–18. [Google Scholar] [CrossRef]
  12. Guijarro, B.; Quetglas, A.; Moranta, J.; Ordines, F.; Valls, M.; González, N.; Massutí, E. Inter- and Intra-Annual Trends and Status Indicators of Nektobenthic Elasmobranchs off the Balearic Islands (Northwestern Mediterranean). Sci. Mar. 2012, 76, 87–96. [Google Scholar] [CrossRef]
  13. Ellis, J.R.; Dulvy, N.K.; Jennings, S.; Parker-Humphreys, M.; Rogers, S.I. Assessing the Status of Demersal Elasmobranchs in UK Waters: A Review. J. Mar. Biol. Assoc. United Kingd. 2005, 85, 1025–1047. [Google Scholar] [CrossRef]
  14. Juan-Jordá, M.J.; Murua, H.; Arrizabalaga, H.; Merino, G.; Pacoureau, N.; Dulvy, N.K. Seventy Years of Tunas, Billfishes, and Sharks as Sentinels of Global Ocean Health. Science 2022, 378, eabj0211. [Google Scholar] [CrossRef]
  15. Walls, R.H.L.; Dulvy, N.K. Tracking the Rising Extinction Risk of Sharks and Rays in the Northeast Atlantic Ocean and Mediterranean Sea. Sci. Rep. 2021, 11, 15397. [Google Scholar] [CrossRef] [PubMed]
  16. Massutí, E.; Moranta, J. Demersal Assemblages and Depth Distribution of Elasmobranchs from the Continental Shelf and Slope off the Balearic Islands (Western Mediterranean). ICES J. Mar. Sci. 2003, 60, 753–766. [Google Scholar] [CrossRef]
  17. Ordines, F.; Massutí, E.; Moranta, J.; Quetglas, A.; Guijarro, B.; Fliti, K. Balearic Islands vs Algeria: Two Nearby Western Mediterranean Elasmobranch Assemblages with Different Oceanographic Scenarios and Fishing Histories. Sci. Mar. 2011, 75, 707–717. [Google Scholar] [CrossRef]
  18. Ramírez-Amaro, S.; Ordines, F.; Esteban, A.; García, C.; Guijarro, B.; Salmerón, F.; Terrasa, B.; Massutí, E. The Diversity of Recent Trends for Chondrichthyans in the Mediterranean Reflects Fishing Exploitation and a Potential Evolutionary Pressure towards Early Maturation. Sci. Rep. 2020, 10, 547. [Google Scholar] [CrossRef]
  19. Acosta, J.; Canals, M.; López-Martínez, J.; Muñoz, A.; Herranz, P.; Urgeles, R.; Palomo, C.; Casamor, J.L. The Balearic Promontory Geomorphology (Western Mediterranean): Morphostructure and Active Processes. Geomorphology 2003, 49, 177–204. [Google Scholar] [CrossRef]
  20. Canals, M.; Ballesteros, E. Production of Carbonate Particles by Phytobenthic Communities on TheMallorca–Menorca Shelf, Northwestern Mediterranean Sea. Deep-Sea Res. II 1997, 44, 611–629. [Google Scholar] [CrossRef]
  21. Group, E. Progress from 1989 to 1992 in Understanding the Circulation of the Western Mediterranean. Oceanol. Acta 1995, 18, 255–271. [Google Scholar]
  22. Arnone, R.A.; Wiesenburg, D.A.; Saunders, K.D. The Origin and Characteristics of the Algerian Current. J. Geophys. Res. 1990, 95, 1587–1598. [Google Scholar] [CrossRef]
  23. Pinot, J.M.; López-Jurado, J.L.; Riera, M. The CANALES Experiment (1996–1998). Interannual, Seasonal, and Mesoscale Variability of the Circulation in the Balearic Channels. Prog. Oceanogr. 2022, 55, 335–370. [Google Scholar] [CrossRef]
  24. Bosc, E.; Bricaud, A.; Antoine, D. Seasonal and Interannual Variability in Algal Biomass and Primary Production in the Mediterranean Sea, as Derived from 4 Years of SeaWiFS Observations. Glob. Biogeochem. Cycles 2004, 18, GB1005. [Google Scholar] [CrossRef]
  25. Estrada, M. Primary Production in the Northwestern Mediterranean. Sci. Mar. 1996, 60, 55–64. [Google Scholar]
  26. Ballesteros, E. Els Fons Rocosos Profunds Amb Osmundaria Volubilis (Linné) R.E. Norris a Les Balears. Bol. Soc. Hist. Nat. Balear. 1992, 35, 33–49. [Google Scholar]
  27. Ballesteros, E. The Deep-Water Peyssonnelia Beds from the Balearic Islands (Western Mediterranean). Mar. Ecol. 1994, 15, 233–253. [Google Scholar] [CrossRef]
  28. Joher, S.; Ballesteros, E.; Cebrian, E.; Sánchez, N.; Rodríguez-Prieto, C. Deep-Water Macroalgal-Dominated Coastal Detritic Assemblages on the Continental Shelf off Mallorca and Menorca (Balearic Islands, Western Mediterranean). Bot. Mar. 2012, 55, 485–497. [Google Scholar] [CrossRef]
  29. Joher, S.; Ballesteros, E.; Rodríguez-Prieto, C. Contribution to the Study of Deep Coastal Detritic Bottoms: The Algal Communities of the Continental Shelf off the Balearic Islands, Western Mediterranean. Medit. Mar. Sci. 2015, 16, 573–590. [Google Scholar] [CrossRef]
  30. Fernández de Puelles, M.L.; Valencia, J.; Jansá, J.; Morillas, A. Hydrographical Characteristics and Zooplankton Distribution in the Mallorca Cannel (Western Mediterranean): Spring 2001. ICES J. Mar. Sci. 2004, 61, 654–666. [Google Scholar] [CrossRef]
  31. Quetglas, A.; Guijarro, B.; Ordines, F.; Massutí, E. Stock Boundaries for Fisheries Assessment and Management in the Mediterranean: The Balearic Islands as a Case Study. Sci. Mar. 2012, 76, 17–28. [Google Scholar] [CrossRef]
  32. Spedicato, M.T.; Massutí, E.; Mérigot, B.; Tserpes, G.; Jadaud, A.; Relini, G. The MEDITS Trawl Survey Specifications in an Ecosystem Approach to Fishery Management. Sci. Mar. 2019, 83, 9–20. [Google Scholar] [CrossRef]
  33. Bertrand, J.A.; Gil de Sola, L.; Papaconstantinou, C.; Relini, G.; Souplet, A. The General Specifications of the MEDITS Surveys. Sci. Mar. 2002, 66, 9–17. [Google Scholar] [CrossRef]
  34. Farriols, M.T.; Ordines, F.; Somerfield, P.J.; Pasqual, C.; Hidalgo, M.; Guijarro, B.; Massutí, E. Bottom Trawl Impacts on Mediterranean Demersal Fish Diversity: Not so Obvious or Are We Too Late? Cont. Shelf Res. 2017, 137, 84–102. [Google Scholar] [CrossRef]
  35. Clarke, K.; Gorley, R.; Somerfield, P.; Warwick, R. Change in Marine Communities: An Approach to Statistical Analysis and Interpretation, 3rd ed.; PRIMER-E: Plymouth, UK, 2014. [Google Scholar]
  36. Available online: Https://Www.Miteco.Gob.Es/Es/Biodiversidad/Servicios/Banco-Datos-Naturaleza/Informacion-Disponible/Bdn-Cart-Aux-Malla-Marina.Aspx (accessed on 25 August 2022).
  37. Cochrane, S.K.J.; Connor, D.W.; Nilsson, P.; Mitchell, I.; Reker, J.; Franco, J.; Valavanis, V.; Moncheva, S.; Ekebom, J.; Nygaard, K.; et al. Marine strategy framework directive Task Group 1 Report Biological Diversity. EUR 2010, 24337, 110. [Google Scholar] [CrossRef]
  38. Piet, G.J.; Albella, A.J.; Aro, E.; Farrugio, H.; Lleonart, J.; Lordan, C.; Mesnil, B.; Petrakis, G.; Pusch, C.; Radu, G.; et al. Marine Strategy Framework Directive Task Group 3 Report Commercially Exploited Fish and Shellfish. 2010. Available online: https://publications.jrc.ec.europa.eu/repository/handle/JRC57750 (accessed on 25 August 2022).
  39. Shin, Y.J.; Rochet, M.J.; Jennings, S.; Field, J.G.; Gislason, H. Using Size-Based Indicators to Evaluate the Ecosystem Effects of Fishing. ICES J. Mar. Sci. 2005, 62, 384–396. [Google Scholar] [CrossRef]
  40. Muggeo, V.M.R. Segmented: An R Package to Fit Regression Models with Broken-Line Relationships. R News 2008, 8, 20–25. [Google Scholar]
  41. Muggeo, V.M.R. Estimating Regression Models with Unknown Break-Points. Stat. Med. 2003, 22, 3055–3071. [Google Scholar] [CrossRef]
  42. Vito, R.; Muggeo, M.M. Package “segmented” Type Package Title Regression Models with Break-Points/Change-Points (with Possibly Random Effects) Estimation. 2022. Available online: http://dirk.eddelbuettel.com/cranberries/2023/03/26/#segmented_1.6-3 (accessed on 1 February 2023).
  43. Muggeo, V.M.R. Selecting Number of Breakpoints in Segmented Regression: Implementation in the R Package Segmented. 2020, pp. 1–3. Available online: https://www.researchgate.net/publication/343737604 (accessed on 20 September 2022).
  44. Morey, G.; Moranta, J.; Massutí, E.; Grau, A.; Linde, M.; Riera, F.; Morales-Nin, B. Weight-Length Relationships of Littoral to Lower Slope Fishes from the Western Mediterranean. Fish. Res. 2003, 62, 89–96. [Google Scholar] [CrossRef]
  45. Pallaoro, A.; Jardas, I.; SANTIC, M. Weight-Length Relationships for 11 Chondrichthyan Species in the Eastern Adriatic Sea. Cybium 2005, 29, 93–96. [Google Scholar]
  46. Bonfil, R. Overview of World Elasmobranch Fisheries; Food and Agriculture Organization of the United Nations: Rome, Italy, 1994. [Google Scholar]
  47. Bertrand, J.; Gil-de-Sola-Simarro, L.; Papakonstantinou, C.; Relini, G.; Souplet, A. Contribution on the Distribution of Elasmobranchs in the Mediterranean (from MEDITS Surveys). Biol. Mar. Medit. 2000, 7, 1–15. [Google Scholar]
  48. IEO. Estrategia Marina. Demarcación Marina Levantino-Balear. Parte IV. Descriptores Buen Estado Ambiental. Descriptor 1: Biodiversidad. Evaluación Inicial y Buen Estado Ambiental. 2012. Available online: https://www.miteco.gob.es/es/costas/temas/proteccion-medio-marino/IV_D6_Levantino-Balear_tcm30-130922.pdf (accessed on 10 July 2022).
  49. Cortés, E. Standardized Diet Compositions and Trophic Levels of Sharks. ICES J. Mar. Sci. 1999, 56, 707–717. [Google Scholar] [CrossRef]
  50. Guijarro, B.; Massutí Guijarro, E.; Guijarro, B.; Massutí, E. Selectivity of Diamond- and Square-Mesh Codends in the Deepwater Crustacean Trawl Fishery off the Balearic Islands (Western Mediterranean). ICES J. Mar. Sci. 2006, 63, 52–67. [Google Scholar] [CrossRef]
  51. Ordines, F.; Massutí, E.; Guijarro, B.; Mas, R. Diamond vs. Square Mesh Codend in a Multi-Species Trawl Fishery of the Western Mediterranean: Effects on Catch Composition, Yield, Size Selectivity and Discards. Aquat. Living Resour. 2006, 19, 329–338. [Google Scholar] [CrossRef]
  52. Quetglas, A.; Merino, G.; González, J.; Ordines, F.; Garau, A.; Grau, A.M.; Guijarro, B.; Oliver, P.; Massutí, E. Harvest Strategies for an Ecosystem Approach to Fisheries Management in Western Mediterranean Demersal Fisheries. Front. Mar. Sci. 2017, 4, 106. [Google Scholar] [CrossRef]
  53. Company, J.B.; Puig, P.; Sardà, F.; Palanques, A.; Latasa, M.; Scharek, R. Climate Influence on Deep Sea Populations. PLoS ONE 2008, 3, e1431. [Google Scholar] [CrossRef] [PubMed]
  54. Amores, A.; Rueda, L.; Monserrat, S.; Guijarro, B.; Pasqual, C.; Massutí, E. Influence of the Hydrodynamic Conditions on the Accessibility of Aristeus Antennatus and Other Demersal Species to the Deep Water Trawl Fishery off the Balearic Islands (Western Mediterranean). J. Mar. Syst. 2014, 138, 203–210. [Google Scholar] [CrossRef]
  55. Mas, I.M. The Fishing Footprint of a Tourism-Based Economy: Displacing Seafood Consumption from Local to Distant Waters in the Balearic Islands. J. Polit. Ecol. 2015, 22, 211–238. [Google Scholar] [CrossRef]
  56. del Valle, I.; Guillen, J.; Astorkiza, K. Substituting Hake with Sardines? Economic Crisis and Fish Demand in Spain. Agribusiness 2017, 33, 600–610. [Google Scholar] [CrossRef]
  57. Moranta, J.; Quetglas, A.; Massutí, E.; Guijarro, B.; Hidalgo, M.; Diaz, P. Spatio-Temporal Variations in Deep-Sea Demersal Communities off the Balearic Islands (Western Mediterranean). J. Mar. Syst. 2008, 71, 346–366. [Google Scholar] [CrossRef]
  58. Hidalgo, M.; Tomás, J.; Moranta, J.; Morales-Nin, B. Intra-Annual Recruitment Events of a Shelf Species around an Island System in the NW Mediterranean. Estuar. Coast. Shelf Sci. 2009, 83, 227–238. [Google Scholar] [CrossRef]
  59. Quetglas, A.; Rueda, L.; Alvarez-Berastegui, D.; Guijarro, B.; Massutí, E. Contrasting Responses to Harvesting and Environmental Drivers of Fast and Slow Life History Species. PLoS ONE 2016, 11, e0148770. [Google Scholar] [CrossRef]
  60. Planque, B.; Fromentin, J.M.; Cury, P.; Drinkwater, K.F.; Jennings, S.; Perry, R.I.; Kifani, S. How Does Fishing Alter Marine Populations and Ecosystems Sensitivity to Climate? J. Mar. Syst. 2010, 79, 403–417. [Google Scholar] [CrossRef]
  61. Osgood, G.J.; White, E.R.; Baum, J.K. Effects of Climate-Change-Driven Gradual and Acute Temperature Changes on Shark and Ray Species. J. Anim. Ecol. 2021, 90, 2547–2559. [Google Scholar] [CrossRef]
  62. Dolgov, A.V.; Drevetnyak, K.V.; Gusev, E.V. The Status of Skate Stocks in the Barents Sea. J. Northw. Atl. Fish. Sci. 2005, 35, 249–260. [Google Scholar] [CrossRef]
  63. Vedor, M.; Queiroz, N.; Mucientes, G.; Couto, A.; da Costa, I.; dos Santos, A.; Vandeperre, F.; Fontes, J.; Afonso, P.; Rosa, R.; et al. Climate-Driven Deoxygenation Elevates Fishing Vulnerability for the Ocean’s Widest Ranging Shark. Elife 2021, 10, e62508. [Google Scholar] [CrossRef] [PubMed]
  64. Brander, K. Disappearance of Common Skate Raia Batis from Irish Sea. Nature 1981, 290, 48–49. [Google Scholar] [CrossRef]
  65. Farrugio, H.; Oliver, P.; Biagi, F. An Overview of the History, Knowledge, Recent and Future Research Trends in Mediterranean Fisheries. Sci. Mar. 1993, 57, 105–119. [Google Scholar]
  66. Olaso, I.; Velasco, F.; Sánchez, F.; Serrano, A.; Rodríguez-Cabello, C.; Cendrero, O. Trophic Relations of Lesser-Spotted Catshark (Scyliorhinus canicula) and Blackmouth Catshark (Galeus melastomus) in the Cantabrian Sea. J. Northw. Atl. Fish. Sci 2005, 35, 481–494. [Google Scholar] [CrossRef]
  67. Olaso, I.; Sánchez, F.; Rodríguez-Cabello, C.; Velasco, F. The Feeding Behaviour of Some Demersal Fish Species in Response to Artificial Discarding. Sci. Mar. 2002, 66, 301–311. [Google Scholar] [CrossRef]
  68. Olaso, I.; Velasco, F.; Pérez, N. Importance of Discarded Blue Whiting (Micromesistius poutassou) in the Diet of Lesser Spotted Dogfish (Scyliorhinus canicula) in the Cantabrian Sea. ICES J. Mar. Sci. 1998, 55, 331–341. [Google Scholar] [CrossRef]
  69. Valls-Mir, M.; Quetglas, A.; Ordines, F.; Moranta, J. Feeding Ecology of Demersal Elasmobranchs from the Shelf and Slope off the Balearic Sea (Western Mediterranean). Sci. Mar. 2011, 75, 633–639. [Google Scholar] [CrossRef]
  70. Capape, C.; Zaouali, J. Contribution À La Biologie Des Scyliorhinidae Des Côtes Tunisiennes. V. Galeus Melastomus Rafinesque, 1810. Régime Alimentaire. Arch. Inst. Pasteur. 1976, 53, 281–292. [Google Scholar]
  71. Macpherson, E. Régime Alimentaire de Galeus Melastomus Rafinesque, 1810 Etmopterus spinax (L., 1758) et Scymnorhinus licha (Bonnaterre, 1788) En Méditerranée Occidentale. Vie Milieu/Life Environ. 1980, 30, 139–148. Available online: https://hal.sorbonne-universite.fr/hal-03008169v1/file/VOLUME_1980_30_fasc2_06_p139-148.pdf (accessed on 9 February 2023).
  72. Grau, A.M.; Mayol, J.; Oliver, J.; Riera, M.A. Llibre Vermell Dels Peixos de Les Illes Balears; Conselleria de Medi Ambient, Agricultura i Pesca: Palma, Spain, 2015. Available online: http://www.caib.es/govern/organigrama/area.do?lang=ca&coduo=3329 (accessed on 9 February 2023).
  73. Pauly, D. Anecdotes and the Shifting Baseline Syndrome of Fisheries. Trends Ecol. Evol. 1995, 10, 430. [Google Scholar] [CrossRef] [PubMed]
  74. Aldebert, Y. Demersal resources of the gulf of lions (nw mediterranean). Impact of exploitation on fish diversity. Vie Milieu/Life Environ. 1997, 47, 275–284. [Google Scholar]
  75. Coelho, R.; Erzini, K. Length at First Maturity of Two Species of Lantern Sharks (Etmopterus spinax and Etmopterus pusillus) off Southern Portugal. J. Mar. Biol. Assoc. United Kingd. 2005, 85, 1163–1165. [Google Scholar] [CrossRef]
  76. Coelho, R.; Erzini, K. Effects of Fishing Methods on Deep Water Shark Species Caught as By-Catch off Southern Portugal. Hydrobiologia 2008, 606, 187–193. [Google Scholar] [CrossRef]
  77. Villagra, D.; van Bogaert, N.; Ampe, B.; Walker, P.; Uhlmann, S.S. Life-History Traits of Batoids (Superorder batoidea) in the Northeast Atlantic and the Mediterranean. Rev. Fish Biol. Fish. 2022, 32, 473–495. [Google Scholar] [CrossRef]
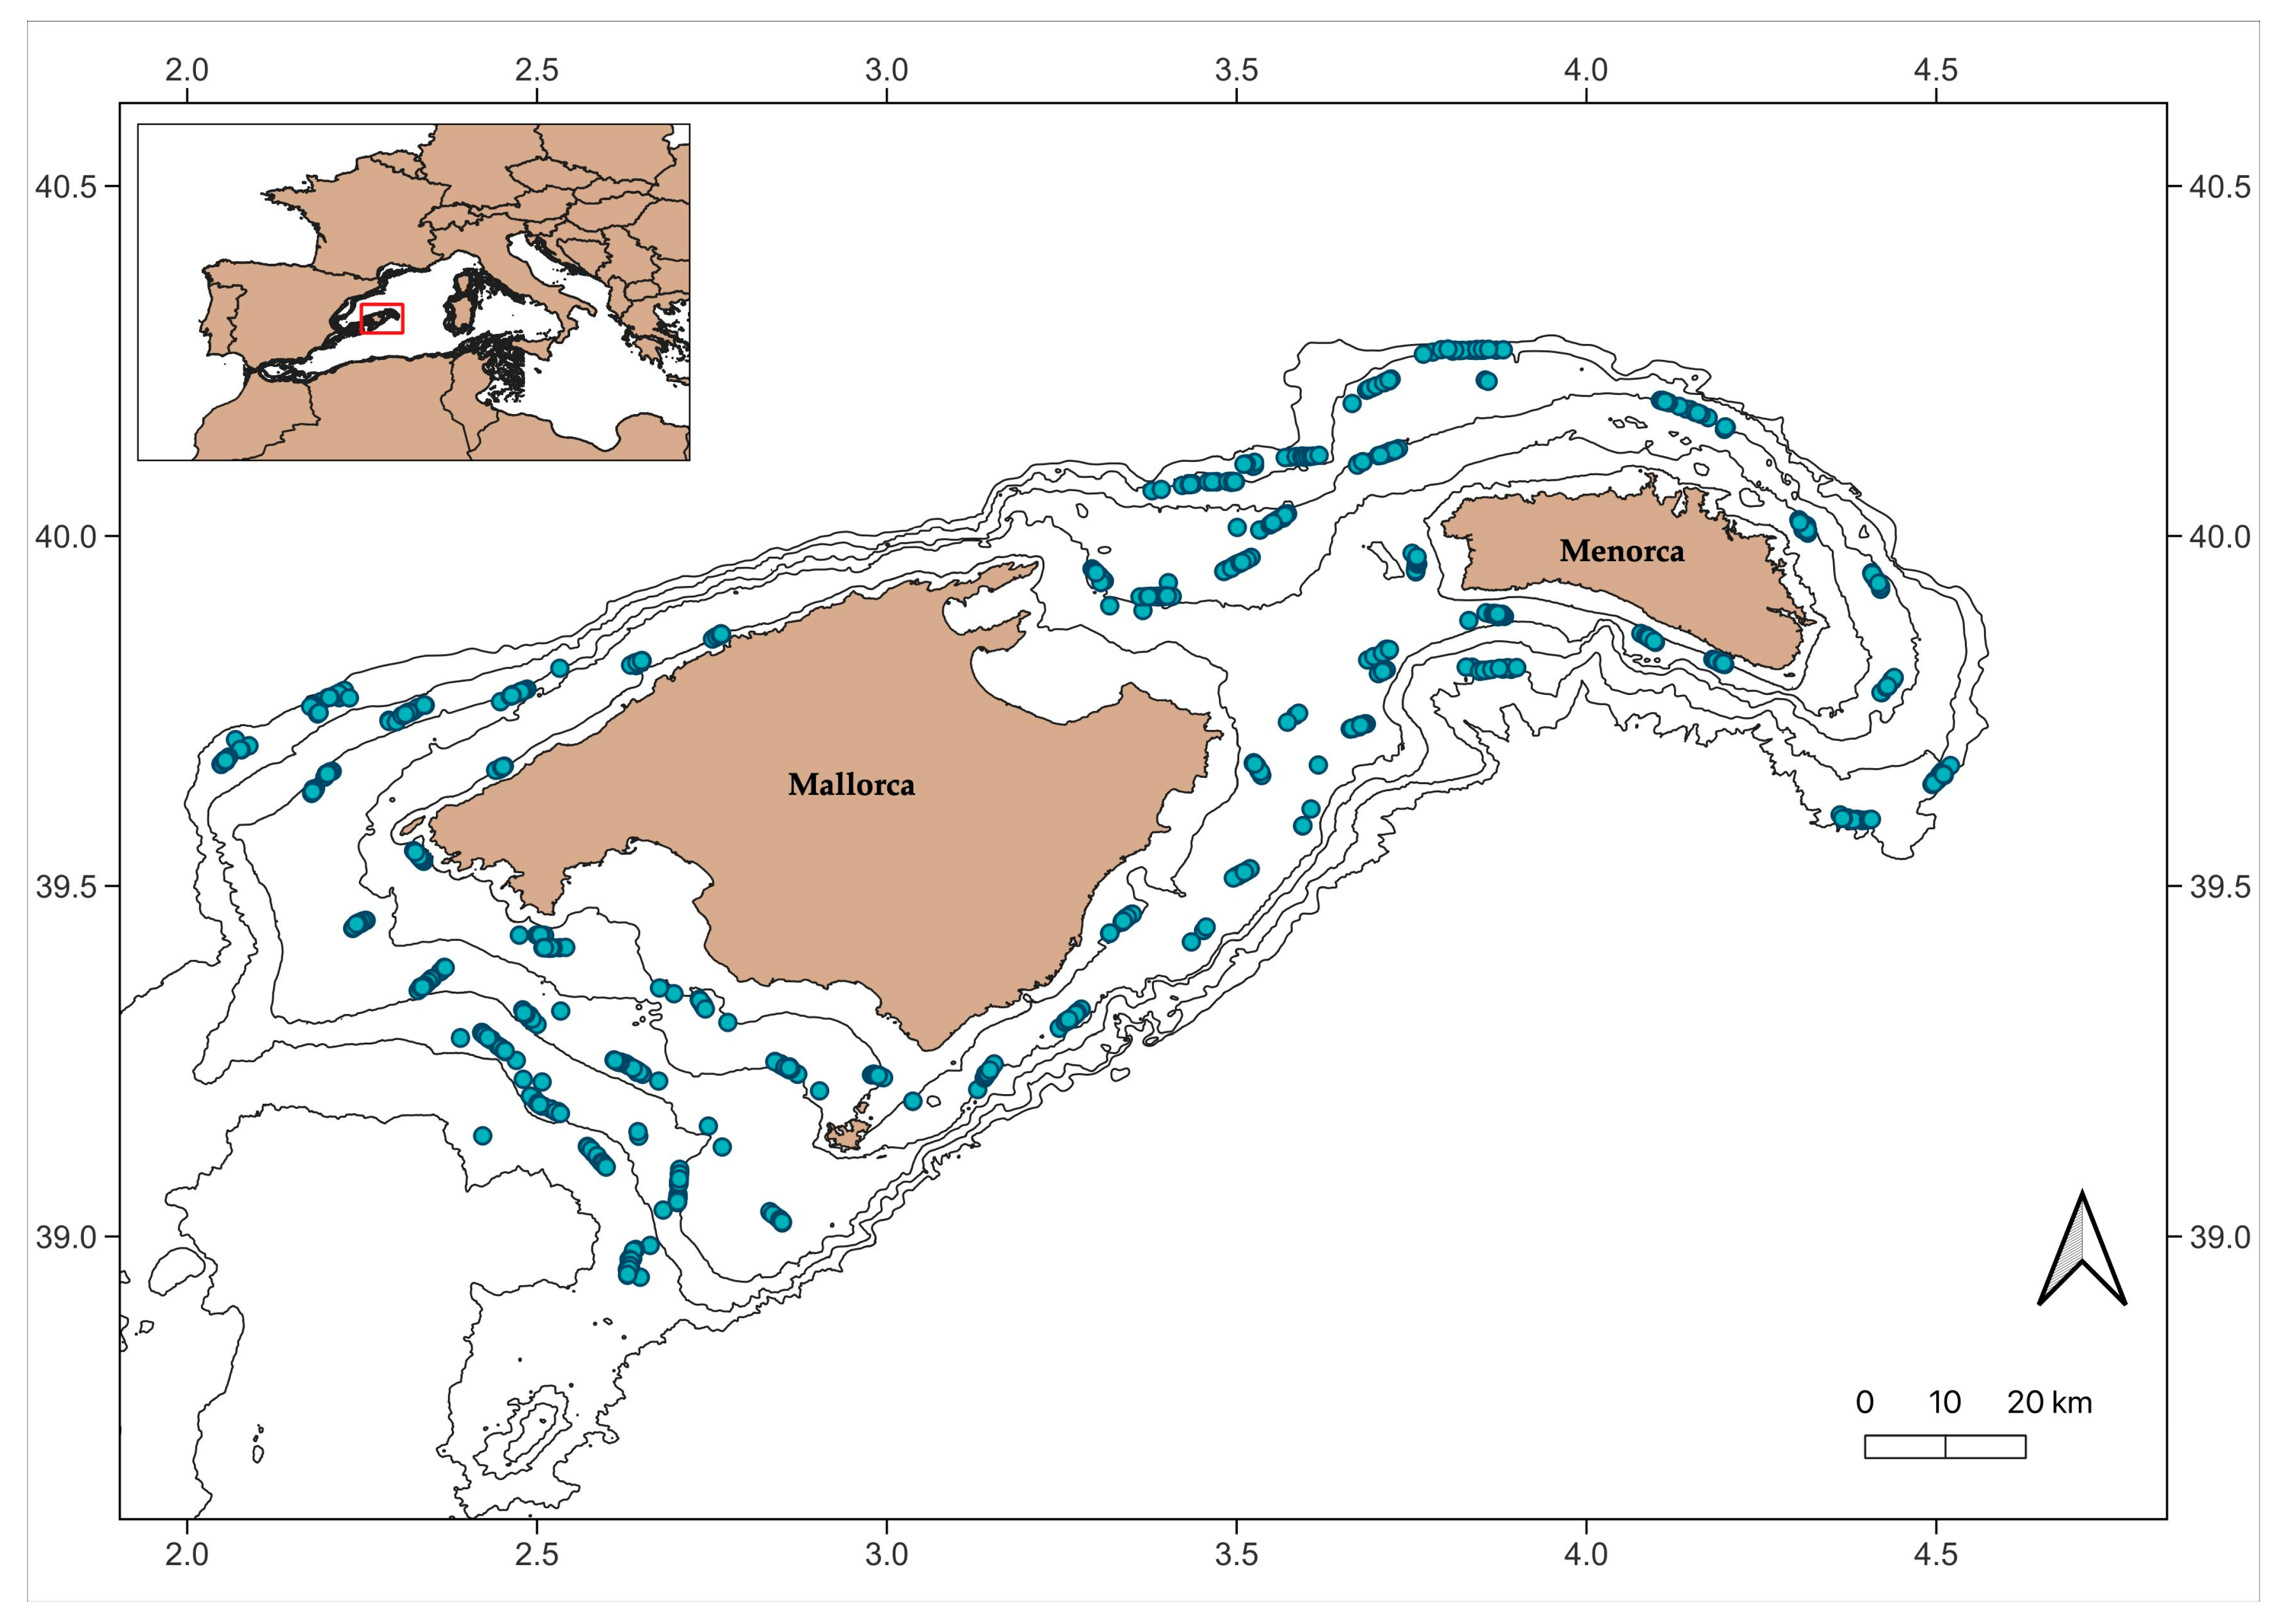
Figure 1. Location of the study area (Mallorca and Menorca, Balearic Islands, western Mediterranean), showing the BALAR/MEDITS stations (blue dots) from 2002 to 2021. The isobaths of 50, 100, 200, 500, and 800 m (lines in the periphery of islands), corresponding to MEDITS strata depth ranges, are shown.
Fishes 08 00230 g001
Figure 2. Trends (increasing: upward green arrow, decreasing: downward red arrow, uncertain: flat yellow arrow) and good environmental status achievement (GES: Y, achieved; N, not achieved) at the group (S1: sharks 1, S2: sharks 2, S3: sharks 3, B1: batoids 1, B2: batoids 2, B3: batoids 3) and community levels. Whole community: all species considered. Reduced community: excluding the dominant species Scyliorhinus canicula, Galeus melastomus, and Raja clavata. P95: 95th percentile of the size frequency distribution. %Mature: percentage of mature specimens (larger than the species-specific length at first maturity, L50). MMLF: mean maximum length of fish. LFI: large fish indicator. CSFb: conservation status of fish. For population size indicators (density and biomass), the achievement of GES was assessed on the basis of population size temporal trends and comparing the population Zlast value to the mean of the annual Z-score values over the time series as follows: populations were considered to be in GES when (a) the population size indicator showed a decreasing trend and Zlast ≥ 0.5, or (b) the population size indicator showed an increasing or stable trend and Zlast > −0.5. For the remaining indicators (distribution and population status), only the temporal trends were taken into consideration (groups showing increasing or uncertain trends were considered to be in GES).
Fishes 08 00230 g002
Figure 3. Trends at community level for the indicators. The first row of plots (ac) corresponds to the whole community; the second row (d,e) corresponds to the community, excluding the dominating species (Scyliorhinus canicula, Galeus melastomus, and Raja clavata). The first column (a,d) shows trends of the large fish indicator (LFI); the second column (b,e) shows the trends of the mean maximum length of fish (MMLF); the third column (c) shows the trend of the conservation status of fish (CSFb). Note that the CSFb was estimated for the whole community but considering only those species that surpassed the large fish threshold and occurred in all years (see Section 2 and Section 2.8.3).
Fishes 08 00230 g003
Figure 4. Trends (increasing: upward green arrow, decreasing: downward red arrow, uncertain: flat yellow arrow) and good environmental status achievement (GES: Y, achieved; N, not achieved) at the species level. P95: 95th percentile of the size frequency distribution. %Mature: percentage of mature specimens (larger than the species-specific length at first maturity, L50). POL/Ref: proportion of large individuals in relation to the reference period. For population size indicators (abundance and biomass), the achievement of GES was assessed on the basis of the population size temporal trends and comparing the population Zlast value to the mean of the annual Z-score values over the time series as follows: populations were considered to be in GES when (a) the population size indicator showed a decreasing trend and Zlast ≥ 0.5, or (b) the population size indicator showed an increasing or stable trend, and Zlast > −0.5. For the remaining indicators (distribution and population status), only the temporal trends were taken into consideration. Species showing increasing or uncertain trends were considered to be in GES. Functional groups are shown (S1: sharks 1, S2: sharks 2, S3: sharks 3, B1: batoids 1, B2: batoids 2, B3: batoids 3). * Trends should be interpreted cautiously.
Fishes 08 00230 g004
Figure 5. Number of species (a) and groups (b) by trend type for each indicator and number of species (a) and groups (b) achieving the good environmental status (GES). P95: 95th percentile of the size frequency distribution. %Mature: percentage of mature specimens (larger than the species-specific length at first maturity, L50). MMLF: mean maximum length of fish. LFI: large fish indicator. POL/Ref: proportion of large individuals in relation to the reference period. Trend “variable” refers to species showing trend changes throughout the time series (segmented regressions).
Fishes 08 00230 g005
Figure 6. Threatened species. (a) Percentage of species for each IUCN status category; (b) histogram showing the number of threatened species according to the type of temporal trend for each indicator. P95: 95th percentile of the size frequency distribution. %Mature: percentage of mature specimens (larger than the species-specific length at first maturity, L50). MMLF: mean maximum length of fish. LFI: large fish indicator. POL/Ref: proportion of large individuals in relation to the reference period. Trend “variable” refers to species showing trend changes throughout the time series (segmented regressions).
Fishes 08 00230 g006
Figure 7. Temporal distribution of changes in trend (breakpoints) for the different indicators assessed at the species level (filled circles), group level (empty circles), and community level (striped). P95: 95th percentile of the size frequency distribution. %Mature: percentage of mature specimens (larger than the species-specific length at first maturity, L50). MMLF: mean maximum length of fish. LFI: large fish indicator. POL/Ref: proportion of large individuals in relation to the reference period. CSFb: conservation status of fish. The size of the circles shows the number of trend changes (breakpoints) at each year. Each color refers to one indicator, detailed in the y axis.
Fishes 08 00230 g007
Figure 8. Temporal trends of bottom trawl fishing effort in the Balearic Islands. Number of fishing days from VMS records in total (red and wider arrow) and for each depth stratum (B: 50–100 m, C: 101–200 m, D: 201–500 m, E: 501–800 m).
Fishes 08 00230 g008
Table 1. Elasmobranchs registered in the Balearic Islands during the BALAR and MEDITS scientific surveys from 2002 to 2021 with a percentage of occurrence higher than 33%. Y: percentage of years. N: total catch. D: depth range in meters. Lmax: maximum total length (cm) registered during the time series. IUCN status: International Union for the Conservation of Nature status category. LC: least concern; NT: near-threatened; VU: vulnerable; EN: endangered; CR: critically endangered; DD: data-deficient.
FamilySpeciesGroupYND LmaxIUCN
PentanchidaeGaleus melastomusSharks 1 (S1)1003542554–79569LC
ScyliorhinidaeScyliorhinus canicula1004331043–76277LC
DalatiidaeDalatias lichaSharks 2 (S2)408492–717100VU
TriakidaeMustelus mustelus958843–140160VU
SqualidaeSqualus blainville7071877–76281.5DD
CentrophoridaeCentrophorus uyatoSharks 3 (S3)359636–764119CR
EtmopteridaeEtmopterus spinax100544319–79549LC
RajidaeDipturus oxyrinchusBatoidea 1 (B1)100451136–717128NT
Leucoraja circularis5522132–60587.5CR
Leucoraja naevus10057443–75961NT
Raja brachyura5016043–189119NT
Raja clavata100355443–751128NT
Raja miraletus10080243–18969.5NT
Raja polystigma10094043–75865LC
Raja radula10045443–18566.5EN
Rostroraja alba552145–251142EN
DasyatidaeDasyatis spp.Batoidea 2 (B2)10015543–99127VU
MylobatidaeMyliobatis aquila8521343–138142VU
TorpedinidaeTorpedo marmorataBatoidea 3 (B3)905443–25139LC
Table 2. Large fish threshold size (LFTS) and percentage (%) of fish with total length greater than the LFTS. Results are shown for the community on its whole (all species considered), for the reduced community (excluding the dominant species Scyliorhinus canicula, Galeus melastomus, and Raja clavate), and for each functional group (S1: sharks 1, S2: sharks 2, S3: sharks 3, B1: batoids 1, B2: batoids 2, B3: batoids 3).
GroupLFTS (cm)%
Whole community602.01
Reduced community951.84
S1501.45
S2802.37
S3501.28
B1851.86
B21151.94
B3351.89
Table 3. Categories of temporal trends and criteria used to define trends. Slope: sign of the regression slope. 95% CI range: range of the 95% confidence interval. Symbol: symbol used in the results table to describe trends. * The p-value is only available for simple linear regression.
TrendSlopep-Value *95% CI RangeSymbol
IncreasingPositive (+)≤0.05Over or below zero
DecreasingNegative (−)≤0.05Over or below zero
UncertainPositive or negative (+/−)>0.05Includes zero
Disclaimer/Publisher’s Note: The statements, opinions and data contained in all publications are solely those of the individual author(s) and contributor(s) and not of MDPI and/or the editor(s). MDPI and/or the editor(s) disclaim responsibility for any injury to people or property resulting from any ideas, methods, instructions or products referred to in the content.