Article

Does Size Matter? Small and Large Larvae of Pikeperch (Sander lucioperca) in a Comparative Gene Expression Analysis

1
Fish Growth Physiology Workgroup, Research Institute for Farm Animal Biology (FBN), Wilhelm-Stahl-Allee 2, 18196 Dummerstorf, Germany
2
Fish Genetics Workgroup, Research Institute for Farm Animal Biology (FBN), Wilhelm-Stahl-Allee 2, 18196 Dummerstorf, Germany
3
Institute of Pathophysiology, University Medicine of Greifswald, Martin-Luther-Straße 6, 17489 Greifswald, Germany
*
Authors to whom correspondence should be addressed.
Fishes 2024, 9(1), 33; https://doi.org/10.3390/fishes9010033
Submission received: 12 December 2023 / Revised: 5 January 2024 / Accepted: 10 January 2024 / Published: 12 January 2024
(This article belongs to the Special Issue Genetics and Breeding in Aquaculture)

Abstract

:
Size differences are common in the aquaculture of fishes. In the larviculture of cannibalistic species such as pikeperch, they majorly influence mortality rates and consequently provoke losses in the aquaculture industry. With this study, we aim to reveal molecular differences between small and large pikeperch of the same age using a set of 20 genes associated with essential developmental processes. Hereby, we applied a general study design to early and late larval pikeperch before the onset of piscivory to explore the causes of growth differences in these developmental groups. The analysis of the expression levels showed developmental but not size-related differences in PGC1A, TGFB1, MYOD1, MRF4, and the collagens COL1A1 and COL1A2. Furthermore, increased head lengths were found in larger late larvae compared to their smaller conspecifics. While no uniquely size-related expression differences were found, the expression patterns of PGC1A in combination with TGFB1 as regulators of the citric acid cycle indicate a possible influence of mitochondrial energy metabolism. Furthermore, expression differences of MYOD1 and MRF4 point out possible temporal advantages of myogenetic processes in the larger late larval group and hypothesise growth advantages of the larger late larvae resulting from various influences, which provide a promising target for future research.
Key Contribution: This study demonstrates that developmental stage rather than size-dependent factors significantly influence growth in pikeperch larvae. This is supported by molecular differences in genes associated with key developmental processes and provides evidence for potential factors influencing larval growth.

1. Introduction

Fish larval development is a critical aspect of aquaculture, as it directly affects the success of commercial fish farming. Effective management during this stage is essential to ensure the survival and optimal growth of fish larvae, which will influence the profitability of aquaculture companies. Also in pikeperch aquaculture, the husbandry of early-stage larvae is a significant bottleneck in the rearing process [1,2]. One of the main challenges are size differences during the larval stages, which are connected to the cannibalism of larger individuals towards their smaller conspecifics when the animals start hunting independently [3,4,5]. This influences the overall mortality rate in pikeperch aquaculture and consequently affects its economic success. Previously, differences between cannibalistic and non-cannibalistic pikeperch were considered to result from developmental differences [6,7]. In pikeperch, the first cannibalism was found to occur among individuals attaining 15 mm total length under rearing conditions in aquaculture [8]. In a study by Colchen and colleagues [6], piscivorous pikeperch larvae exhibited a more advanced digestive system, characterised by increased digestive enzyme activity, along with larger heads and tails compared to their non-piscivorous counterparts.
Since size differences are the foremost influence on the occurrence of cannibalism, the understanding of growth phases and ontogenetic processes is crucial to aiding pikeperch larviculture. The growth of pikeperch larvae does not occur steadily during development. A previous study described different phases of growth occurring during the larval development of pikeperch reared in a semi-natural environment [9]. Similarly, a study with a focus on skeletal development demonstrated an intermediate reduction in size increase for individual pikeperch reared in environments with constant temperatures [10]. As a result of these studies, a distinct early larval growth phase with a low to no size increase can be differentiated from a later larval growth phase with increasing size variants [9,10]. Based on the occurrence of characteristic ontogenetic events, these groups can be attributed to the larval stages L1 to L2 (early larval group) as well as L3 to L6 (late larval group) described by Peňáz [11]. The early larvae are characterised by a straight notochord and mixed feeding, whereas in late larvae, the notochord is bent upwards and caudal fin skeletal elements are formed. The appropriate timing for the initial feeding, differentiated by the feed type and the feed quality, is a well-known factor that influences the growth of larval pikeperch [12,13]. However, it is not fully understood how these growth differences still occur in groups that are fed the same type of feed and ad libitum, as exemplarily carried out by Ott and colleagues [10]. This opens the question of whether there are also transcription-level differences that result in variations in the growth of same-age specimens, thus influencing the cannibalism rate of pikeperch in later stages within a batch.
With the present study, we aim to investigate possible differences in the gene expression patterns of same-age larval pikeperch of smaller and larger size. For this purpose, we comparatively investigated the expression patterns of genes relevant for developmental processes in larval pikeperch [14,15,16]. Hereby, we tried to exclude the influence of piscivory/cannibalism on the expression levels by sampling individuals before the onset of cannibalism based on the age and size of first-time cannibalistic individuals provided by the literature [3,6,8]. By combining size comparisons and gene expression analyses, our approach can contribute to elucidating potential relationships in the genetic regulation of growth differences in aquaculture pikeperch.

2. Materials and Methods

2.1. Sample Collection and Size Sorting

Pikeperch larvae were obtained from a fishery at Lake Hohen Sprenz in Mecklenburg-Vorpommern, Germany, that applies semi-controlled pikeperch reproduction (compare with [9,14]). From a local population of breeders of three females and five males, a mixed clutch nest from one fertilisation date was sampled. Eggs were kept in Zuger jars until the eye-point stage. Afterwards, they were transferred to net cages in flow-through channels. Following the hatch, lake zooplankton, collected with an additional light trap, was provided as a food source (Daphnia sp., Bosmina sp., copepod nauplii).
During the rearing process, lake water was used, having a variable temperature regime with a mean of 17.1 ± 3.9 °C (min 11.8 °C, max 23.8 °C). Data on water temperature and quality and air temperature were collected continuously (Maxim Integrated iButton MF1921G, Hanna Instruments hi9829). Besides the age in days post fertilisation (dpf), the age in degree-days (dd) was calculated based on the daily average water temperature. Due to the natural temperature variances and different sampling days, the calculation of dd is used to determine the developmental age of the poikilothermic organisms. In accordance with developmental [11] as well as described growth differences during larval development [9], the specimens were separated into an early and late larval group. In total, we collected six larval age stages (early larval: 16 dpf/227 dd, 18 dpf/256 dd, 21 dpf/306 dd; late larval: 31 dpf/512 dd, 35 dpf/600 dd, 38 dpf/666 dd). Representative light microscope images of the pikeperch larvae from the examined early and late larval groups, with their corresponding ages, are shown in Figure 1. All pikeperch individuals used in morphometric measurements and gene expression analysis were euthanised using MS222 (Serva) in a 0.25 g/L concentration. For each individual age stage, specimens were collected and stored in ethanol for measurements and photography, as well as in RNAlater for molecular analyses. All sampling procedures followed national and international animal welfare regulations (Directive 2010/63/EU and Act (§ 4(3) TierSchG)).
For the morphometric measurements, the total length (TL) and head length (HL) were measured for 20 pikeperch of each age stage under a stereomicroscope (Leica SD9). Based on the individual TL in comparison to the overall sampling group mean TL and size range, the specimens were associated with the size class “small” or “large”. For this, “large” specimens were collected from the largest third of the size range of each sampling group and “small” specimens from the smallest third. Per size class within a sampling group, two sample pools were created, each with n = 15. For gene expression analysis, the separated age stages and size classes of specimens were stored in RNAlater at −80 °C.

2.2. RNA Isolation

For RNA isolation from pikeperch larvae, pools of 15 animals from each group were used. After a mechanical disruption (Precellys Evolution, VWR), RNA was isolated in two steps, following Rebl et al. [17]. The first step consisted of a Trizol-chloroform precipitation, and in the second step, the precipitated total RNA was purified using the RNeasy Micro Kit (Qiagen, Hilden, Germany) and treated with a DNase (Qiagen, Hilden, Germany). The final RNA concentration was determined with the NanoDrop ND-1000 spectrophotometer (Peqlab, Erlangen, Germany) according to the manufacturer’s instructions.

2.3. Design of Primer and Fluidigm Multiplex Real-Time PCR

A total of 20 genes of interest (GOI) and two reference genes (Ribosomal Protein L32 and Ribosomal Protein S5) were selected for analysis. The GOI and reference genes were established in previous studies on pikeperch and were selected to gain insight into the early ontogeny of pikeperch larvae, with a focus on general development and myogenesis [14,18].
The primers are based on pikeperch sequences (RefSeq NCBI: GCA_008315115) from the NCBI GenBank database. In the absence of sequence information, sequences of other perciform species, such as Perca flavaescens and Epinephelus coioides, were used. All primers were checked for homology via BLAST algorithms against the Sander lucioperca transcriptome. The polymerase chain reaction (PCR)-generated amplicons were evaluated by gel electrophoresis. Primer efficiency was also evaluated in quantitative PCR (qPCR) approaches at different temperatures in the LightCycler96 instrument (Roche) [14]. A full list of the primers for GOI and their properties is included in Supplementary Table S1. Expression analysis was performed on a 48.48 Gene Expression biochip (Standard BioTools) using the BioMark HD system (Standard BioTools) as described previously [17]. The data collection is based on two biological and two technical replicates per sample taken. Gene expressions within all experimental groups were output as normalised relative quantity (NRQ) using the delta-delta CT method [19].

2.4. Statistical Analyses

To check for the formation of significant size differences between the size classes per sampling, we compared their TL and HL using a Student’s test. To allow for the comparison of the influence of the developmental stage or the size class, a two-tailed ANOVA was applied that included the two factors of size class (small and large) as well as the two larval age groups (early larval group and late larval group). To check test prerequisites, the normal distribution was determined by the Shapiro–Wilk test, and the homogeneity of variances was tested using the Levene test. All statistical analyses were done using R (version 4.2.3) with RStudio (version 2023.03.0) with a significance level of p < 0.05. Graph plotting was done using GraphPad Prism (version 10.0.2). In the graphs, gene expression data is presented as mean + SEM (standard error of the mean). To highlight the differences between the statistical models, asterisks were used for the Student’s test and letters for the ANOVA and the Tukey test.

3. Results

3.1. Morphometry

Before the sorting procedures, all individuals in each early developmental group were similar in total lengths, i.e., 4.69 ± 0.17 mm at 227 dd, 4.20 ± 0.24 mm at 256 dd, and 4.94 ± 0.29 mm at 306 dd (linear regression, slope = 0.004). The late larval stages were characterised by an increase in total length and variance. This is reflected by the average total lengths of 4.98 ± 0.11 mm (512 dd), 7.30 ± 0.25 mm (600 dd), and 8.67 ± 0.29 mm (666 dd) (linear regression, slope = 0.024) (Figure 2).
The size separation of the individuals into the groups of small and large specimens resulted in significantly different TL of the size groups within each age stage (Figure 3a,b). The characteristic for the late larval group was the significantly higher values in head length (HL) in the large size class compared to their small conspecifics (p ≤ 0.05, Figure 3b).

3.2. Gene Expression Pattern

The variance analysis showed differences between the effects of the early and late larval developmental group but not between the small and large size classes (Table 1).
Overall, the factor developmental group showed significant influence on the expression of MYOD1 (Myogenic Differentiation 1), TGFB1 (Transforming growth factor beta1), FGF4 (Fibroblast growth factor 4), MRF4 (Myogenic regulatory factor 4), PGC1A (peroxisome proliferative activated receptor, gamma, coactivator 1 alpha) and the collagen-encoding genes COL1A1 (Collagen type 1 alpha 1) and COL1A2 (Collagen type 1 alpha 2). Furthermore, a combined effect of group and size class was determined for MYOD1. The size class alone, however, showed no influence on the expression of any of these genes.
No significant differences in the expression levels between size classes within a developmental group were determined. However, in the comparison of the age/size combination groups, significant gene expression differences were found for six genes.
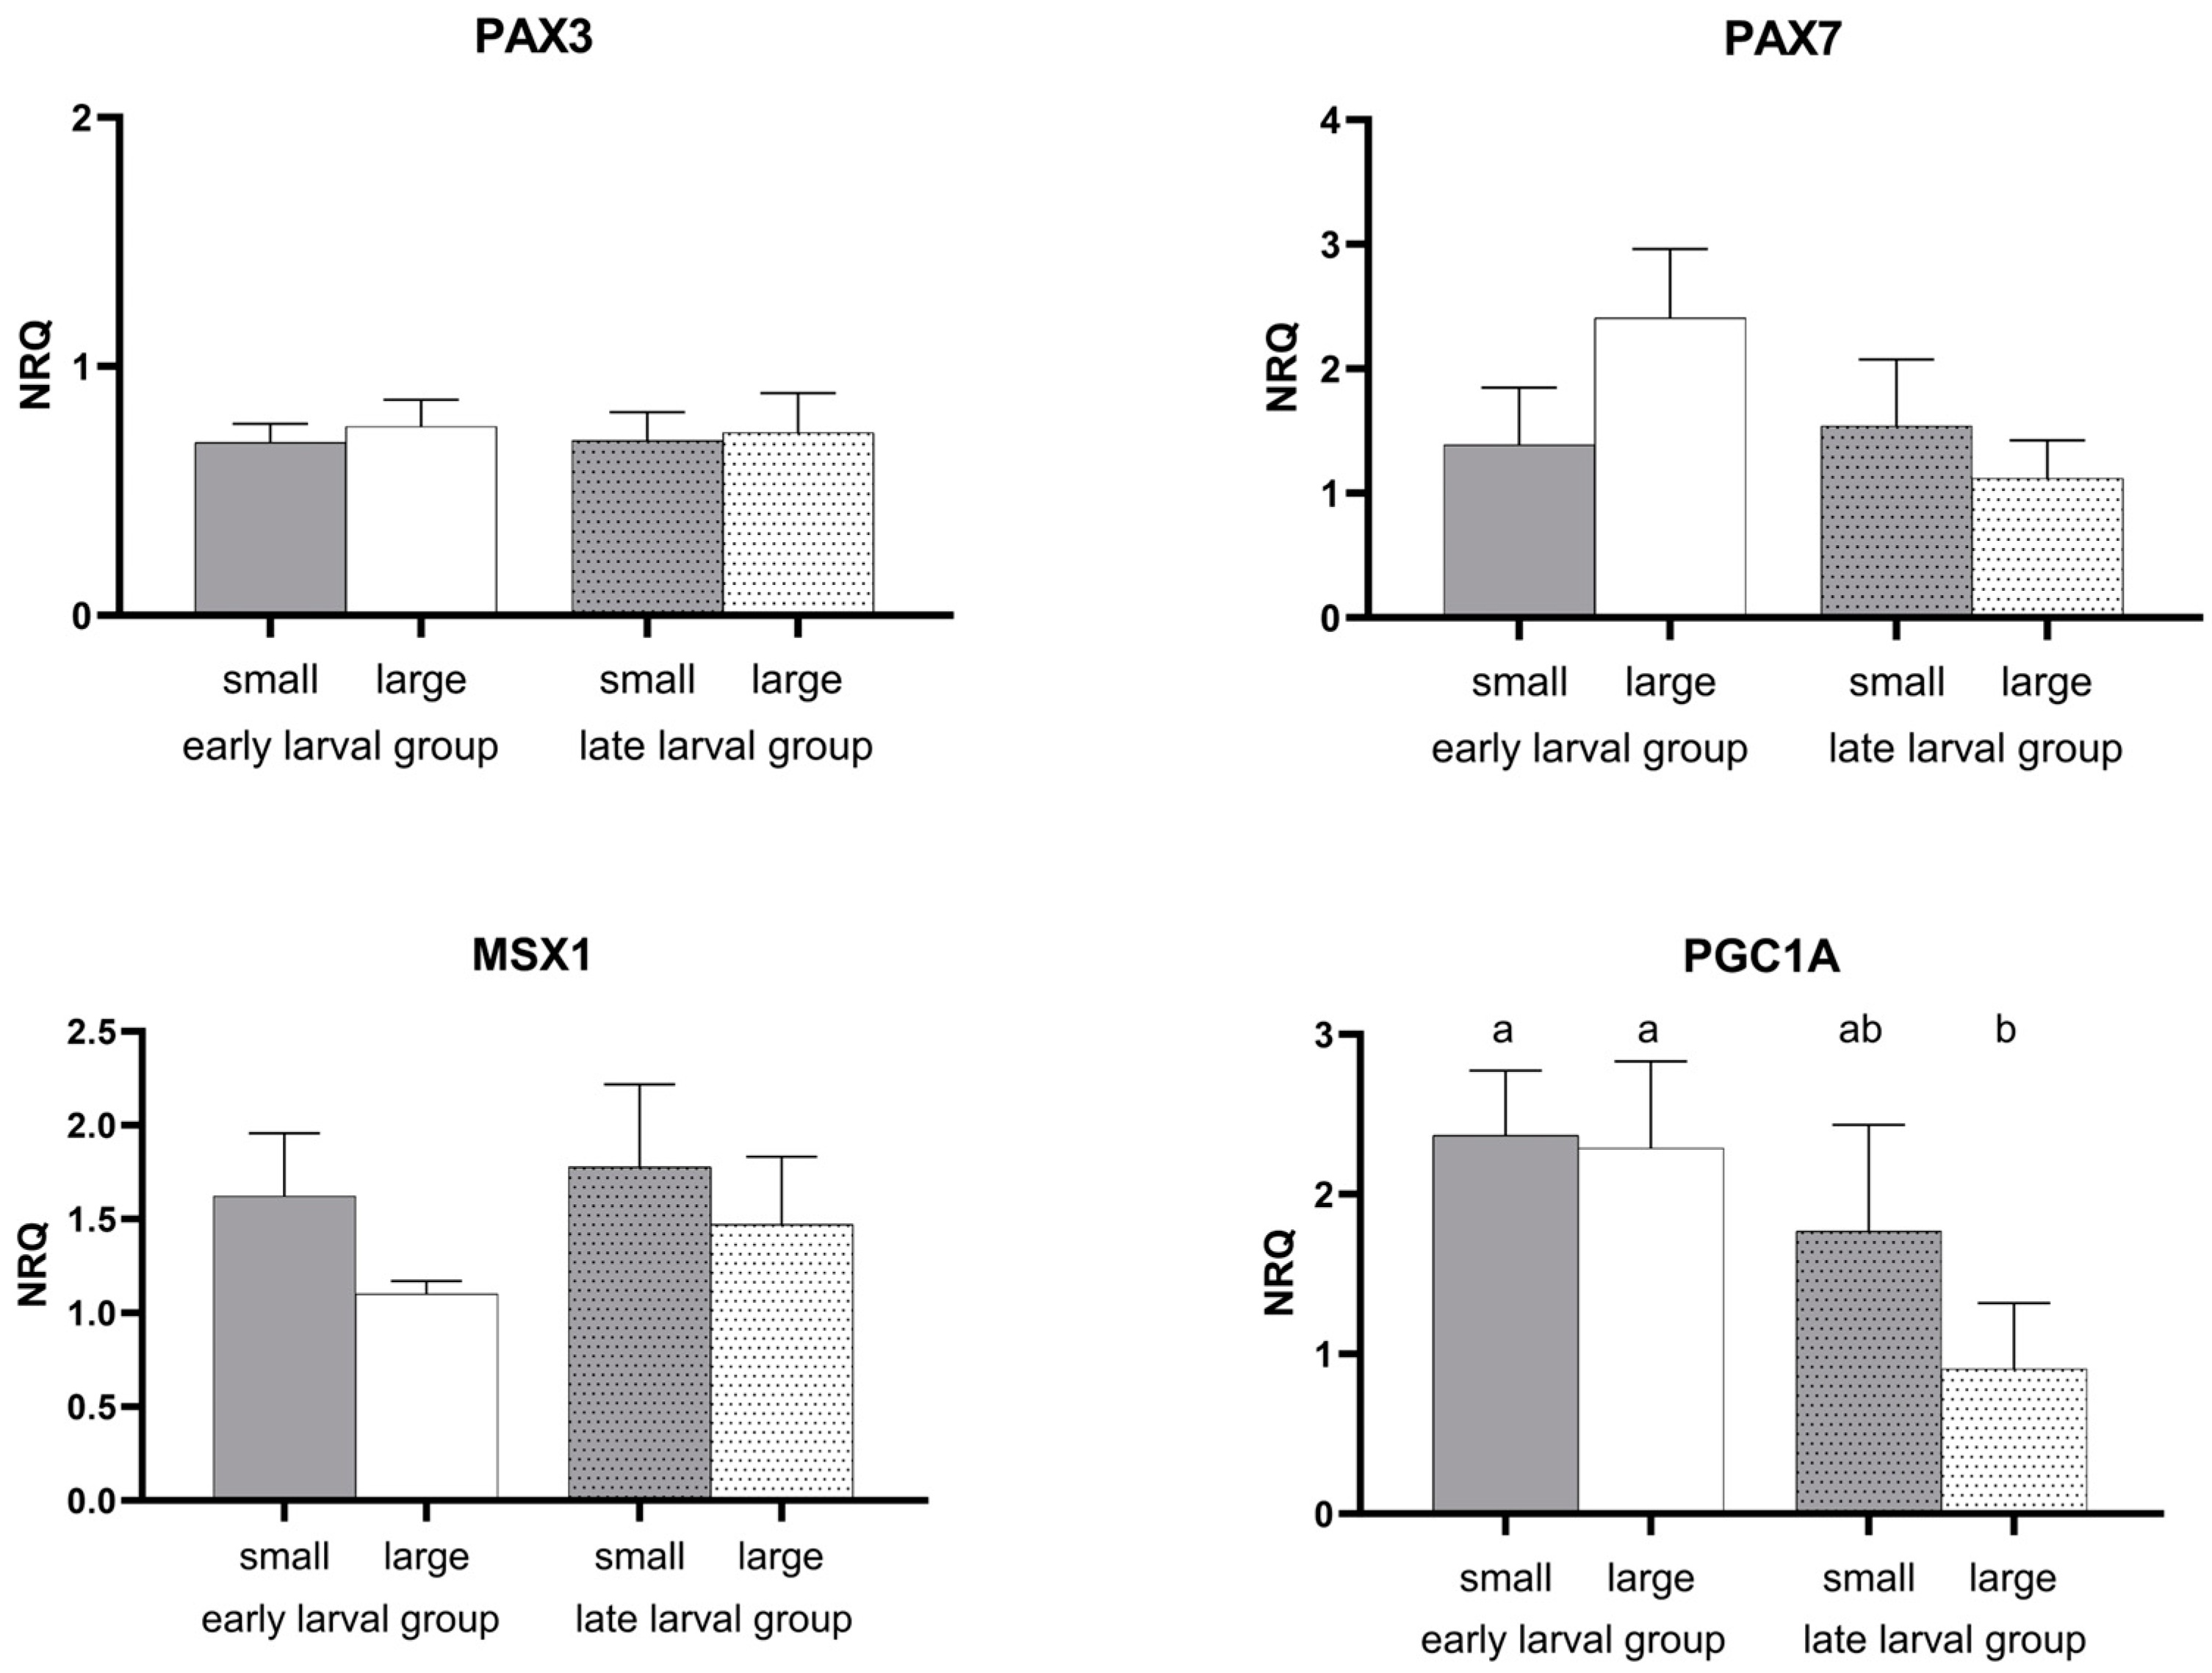
The expression pattern of genes associated with the activation of satellite cells and stem cells had no significantly different expression levels for three of the four genes analysed (Figure 4). PAX3 (Paired box gene 3) was constantly expressed. A slightly elevated expression level of PAX7 (Paired box gene 7) was found for the large early larval group. MSX1 (Msh homeobox) had moderately higher levels of expression in the small larvae of the early and late developmental groups. In contrast, PGC1A had significantly higher expression levels in both early larval groups compared to the lowest expression in the large larval group.
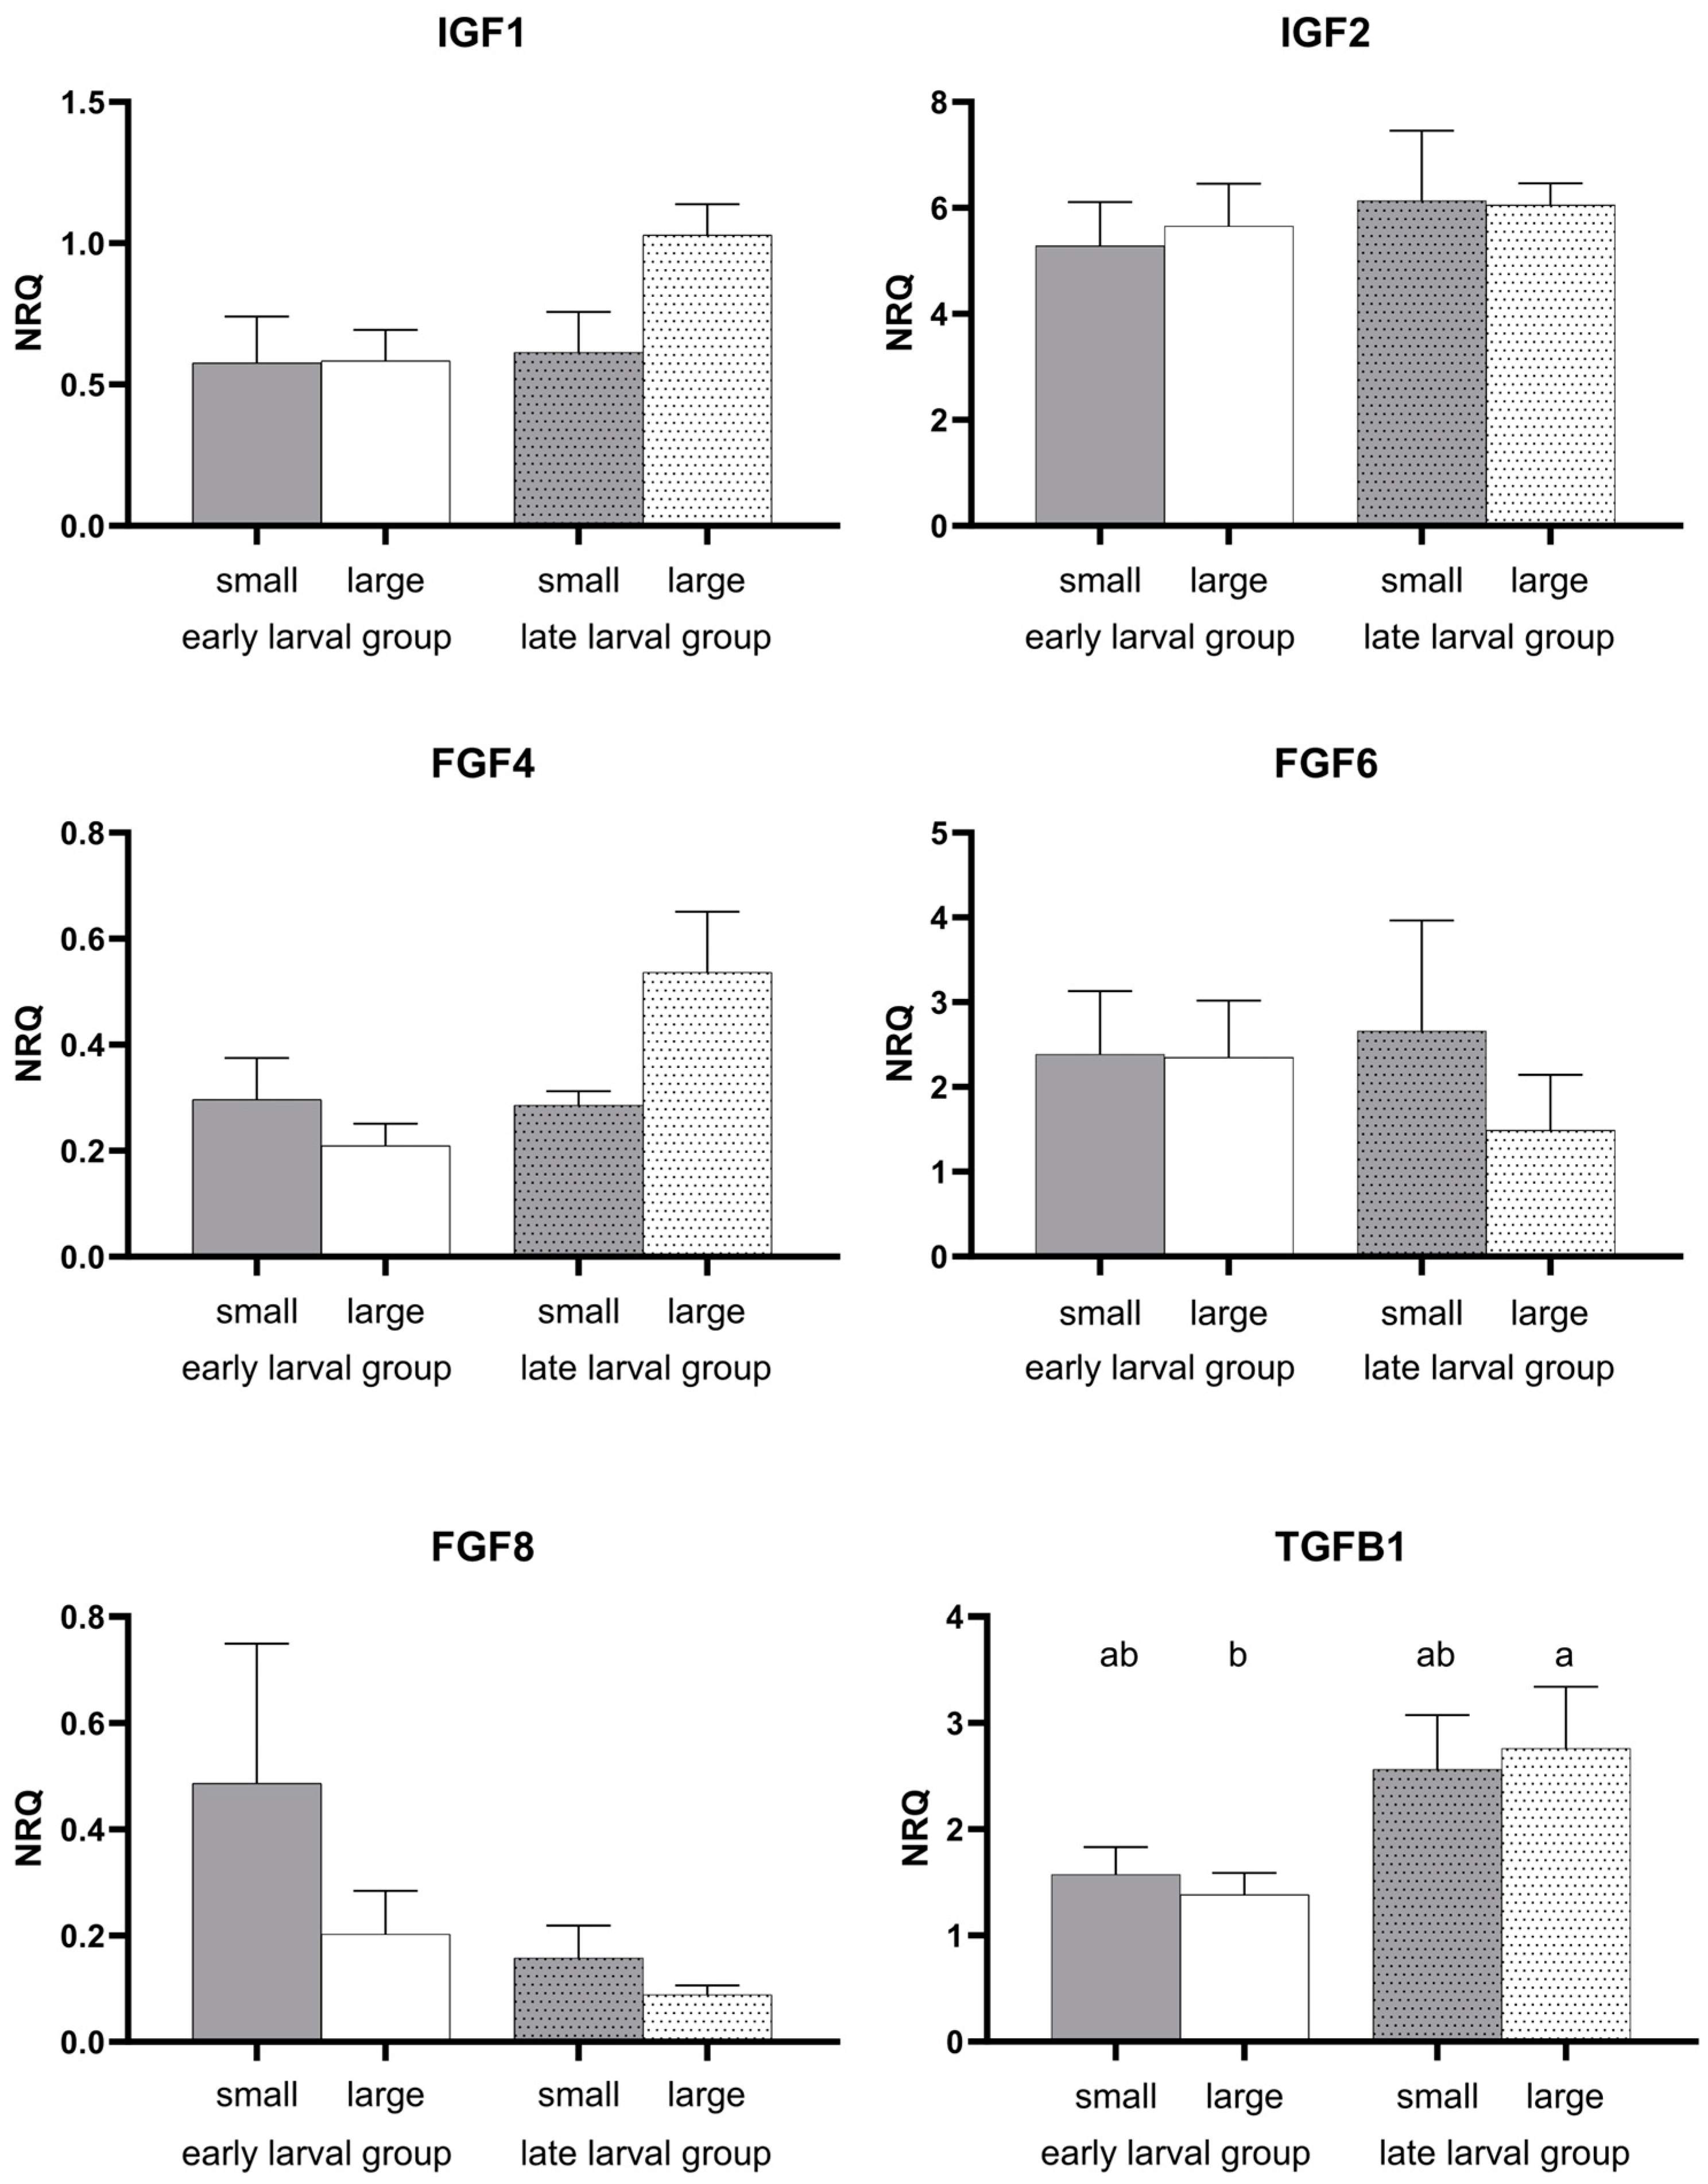
The expression levels of the insulin-like growth factor-encoding genes IGF1 and IGF2, as well as the fibroblast growth factor-encoding genes FGF4, FGF6, and FGF8, showed no significant differences across the samples (Figure 5). The expression of TGFB1 (Transforming growth factor beta 1) was significantly increased between the early large larval and late large larval samples (Figure 5).
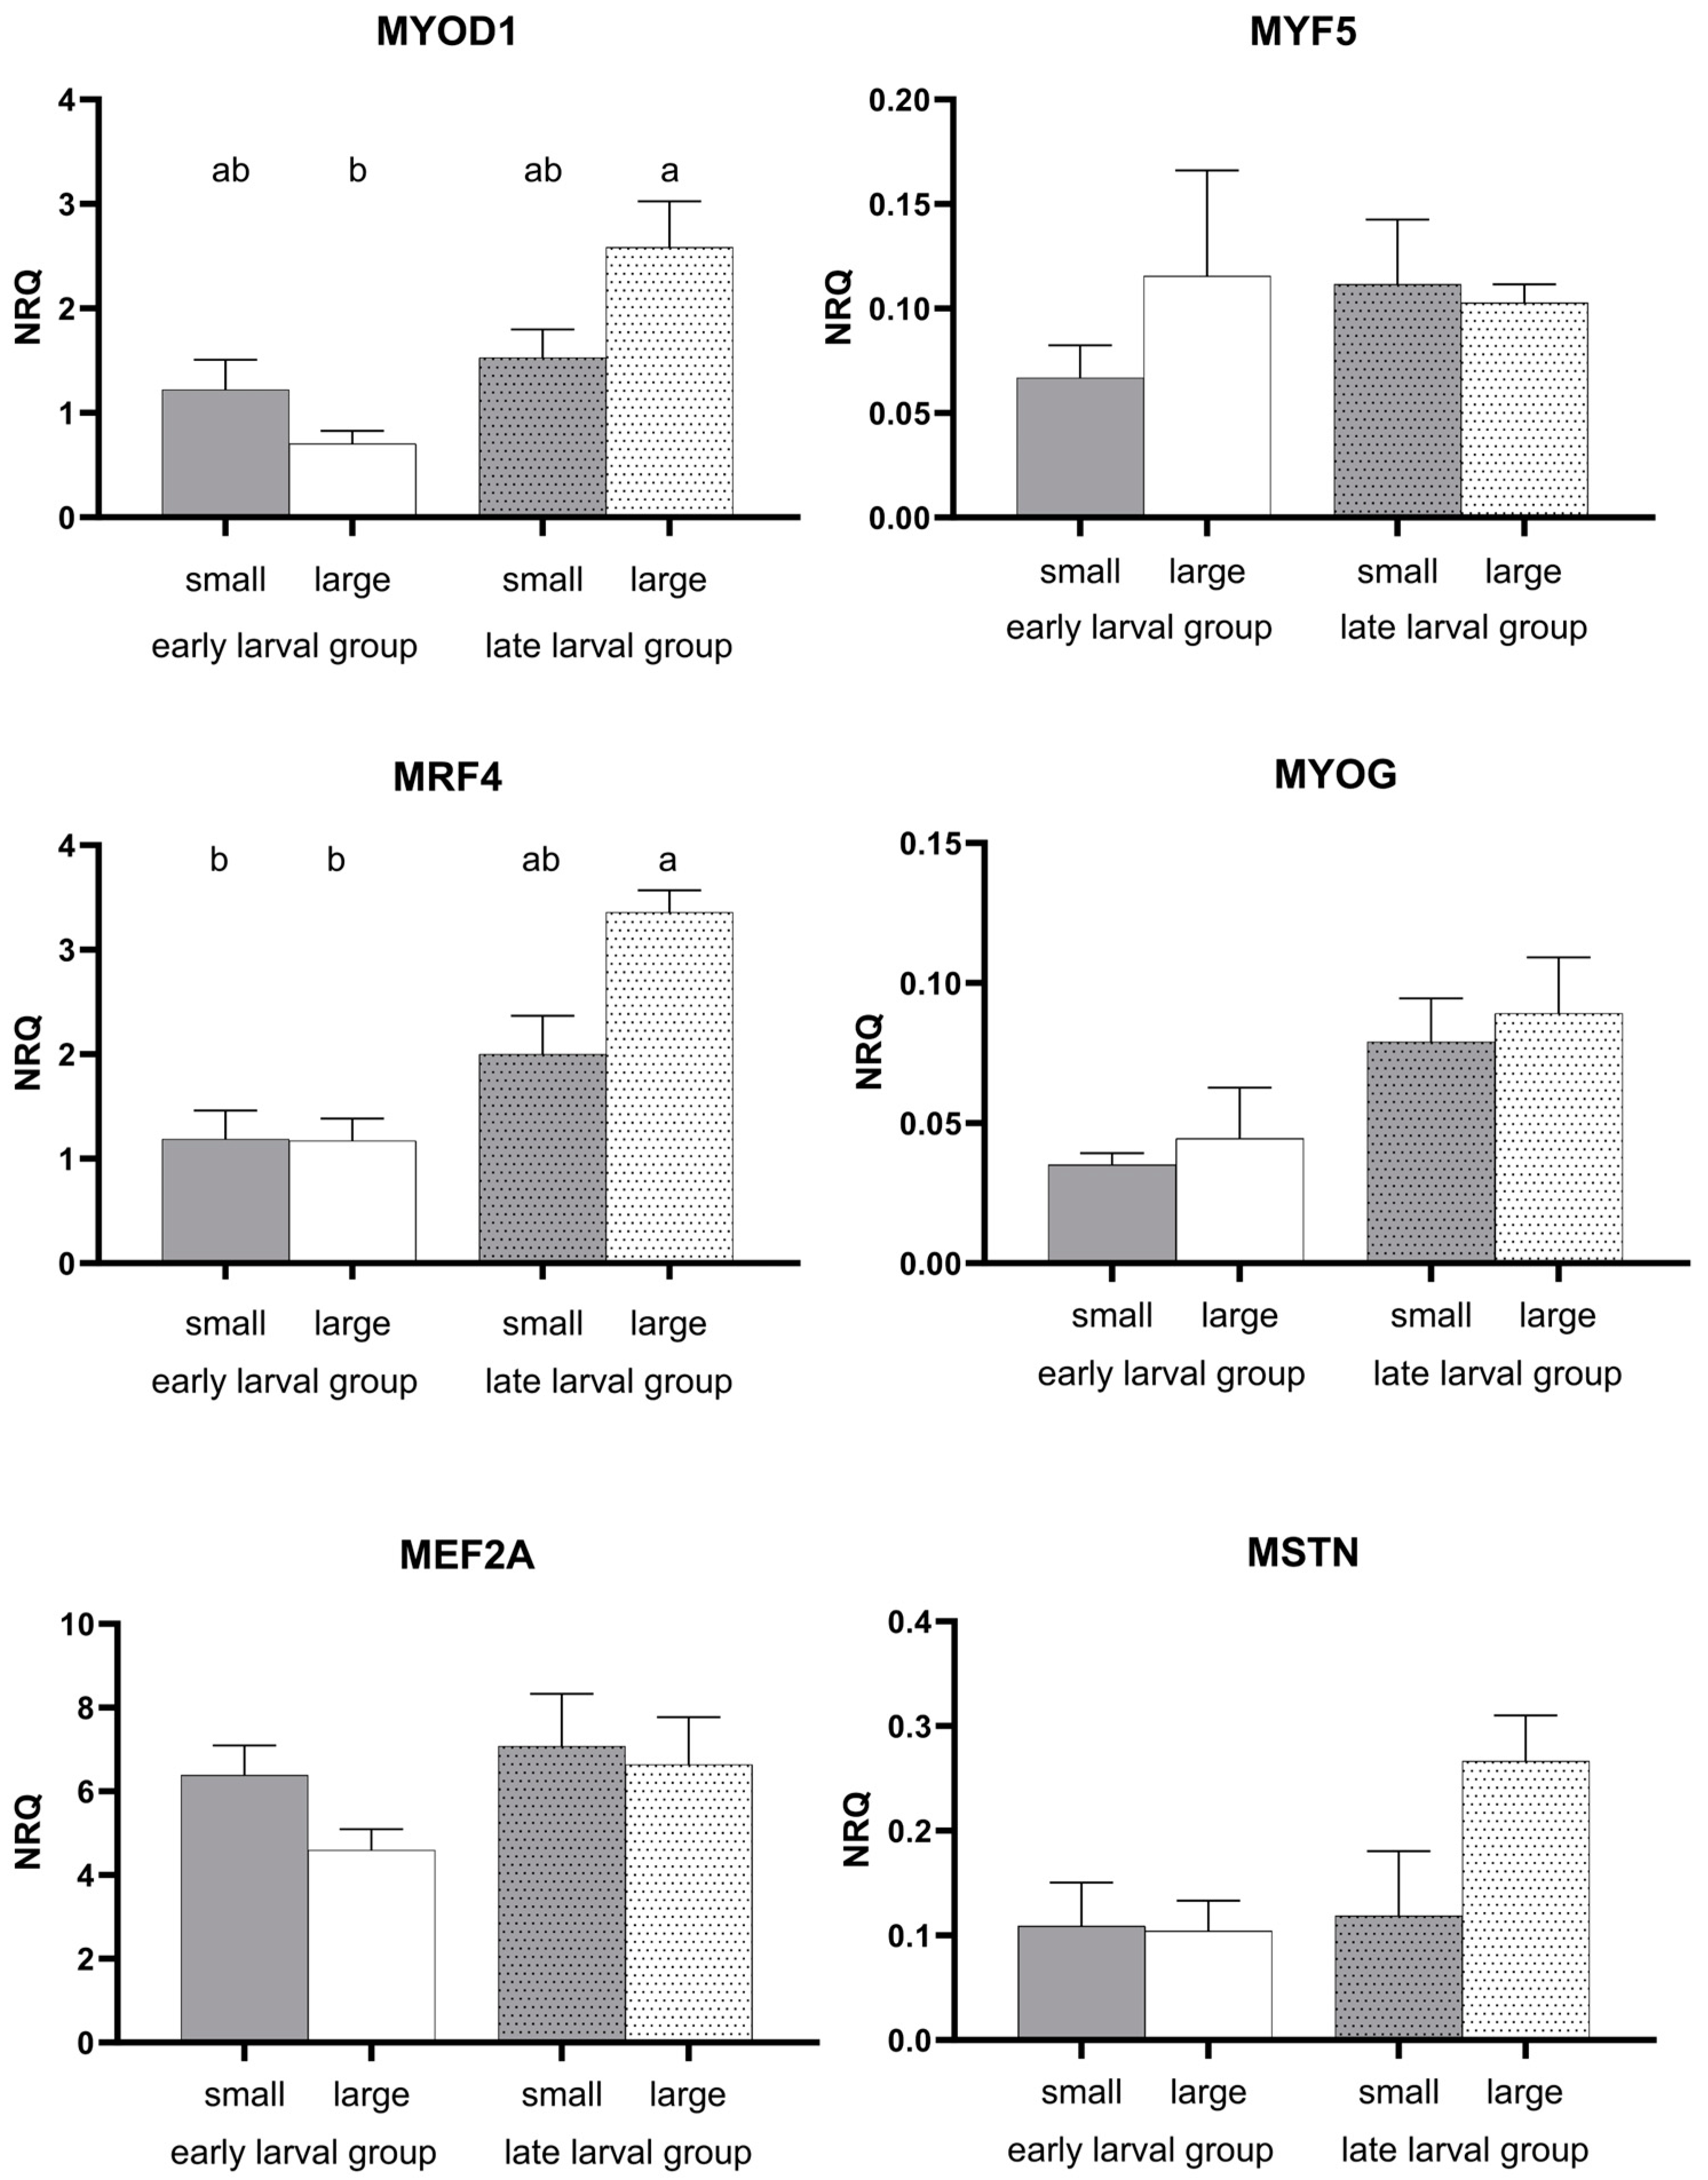
Two of the six genes coding for myogenic regulator factors and the muscle development regulators were significantly differentially expressed between the samples (Figure 6). The gene MYOD1 had a significantly lower expression in the early larval group compared to the late larval group. Furthermore, in the early large larval stage, MYOD1 is significantly less expressed than in the late large larval group. These differences in the expression pattern between small and large larvae could not be found for MYF5 (Myogenic factor 5), which also initiates myoblast formation. However, the transcription factor MRF4, which is active later in myofibre formation, also showed a similar pattern to MYOD1, having significant lower expressions in both early larval sizes compared to the large late larval group. MYOG (Myogenin) had no significant expression-level differences. Nevertheless, a slight increase was observed between the small and large larvae within the developmental groups and between the early larval and late larval groups themselves. Of the genes that influence muscle development, MEF2A (Myocyte enhancer factor 2A) was uniformly expressed in all developmental groups and size classes. The muscle growth inhibitor-encoding gene MSTN (Myostatin) showed no significant differences in the examined developmental groups. However, there is a trend towards a higher MSTN expression in the large, late larvae.
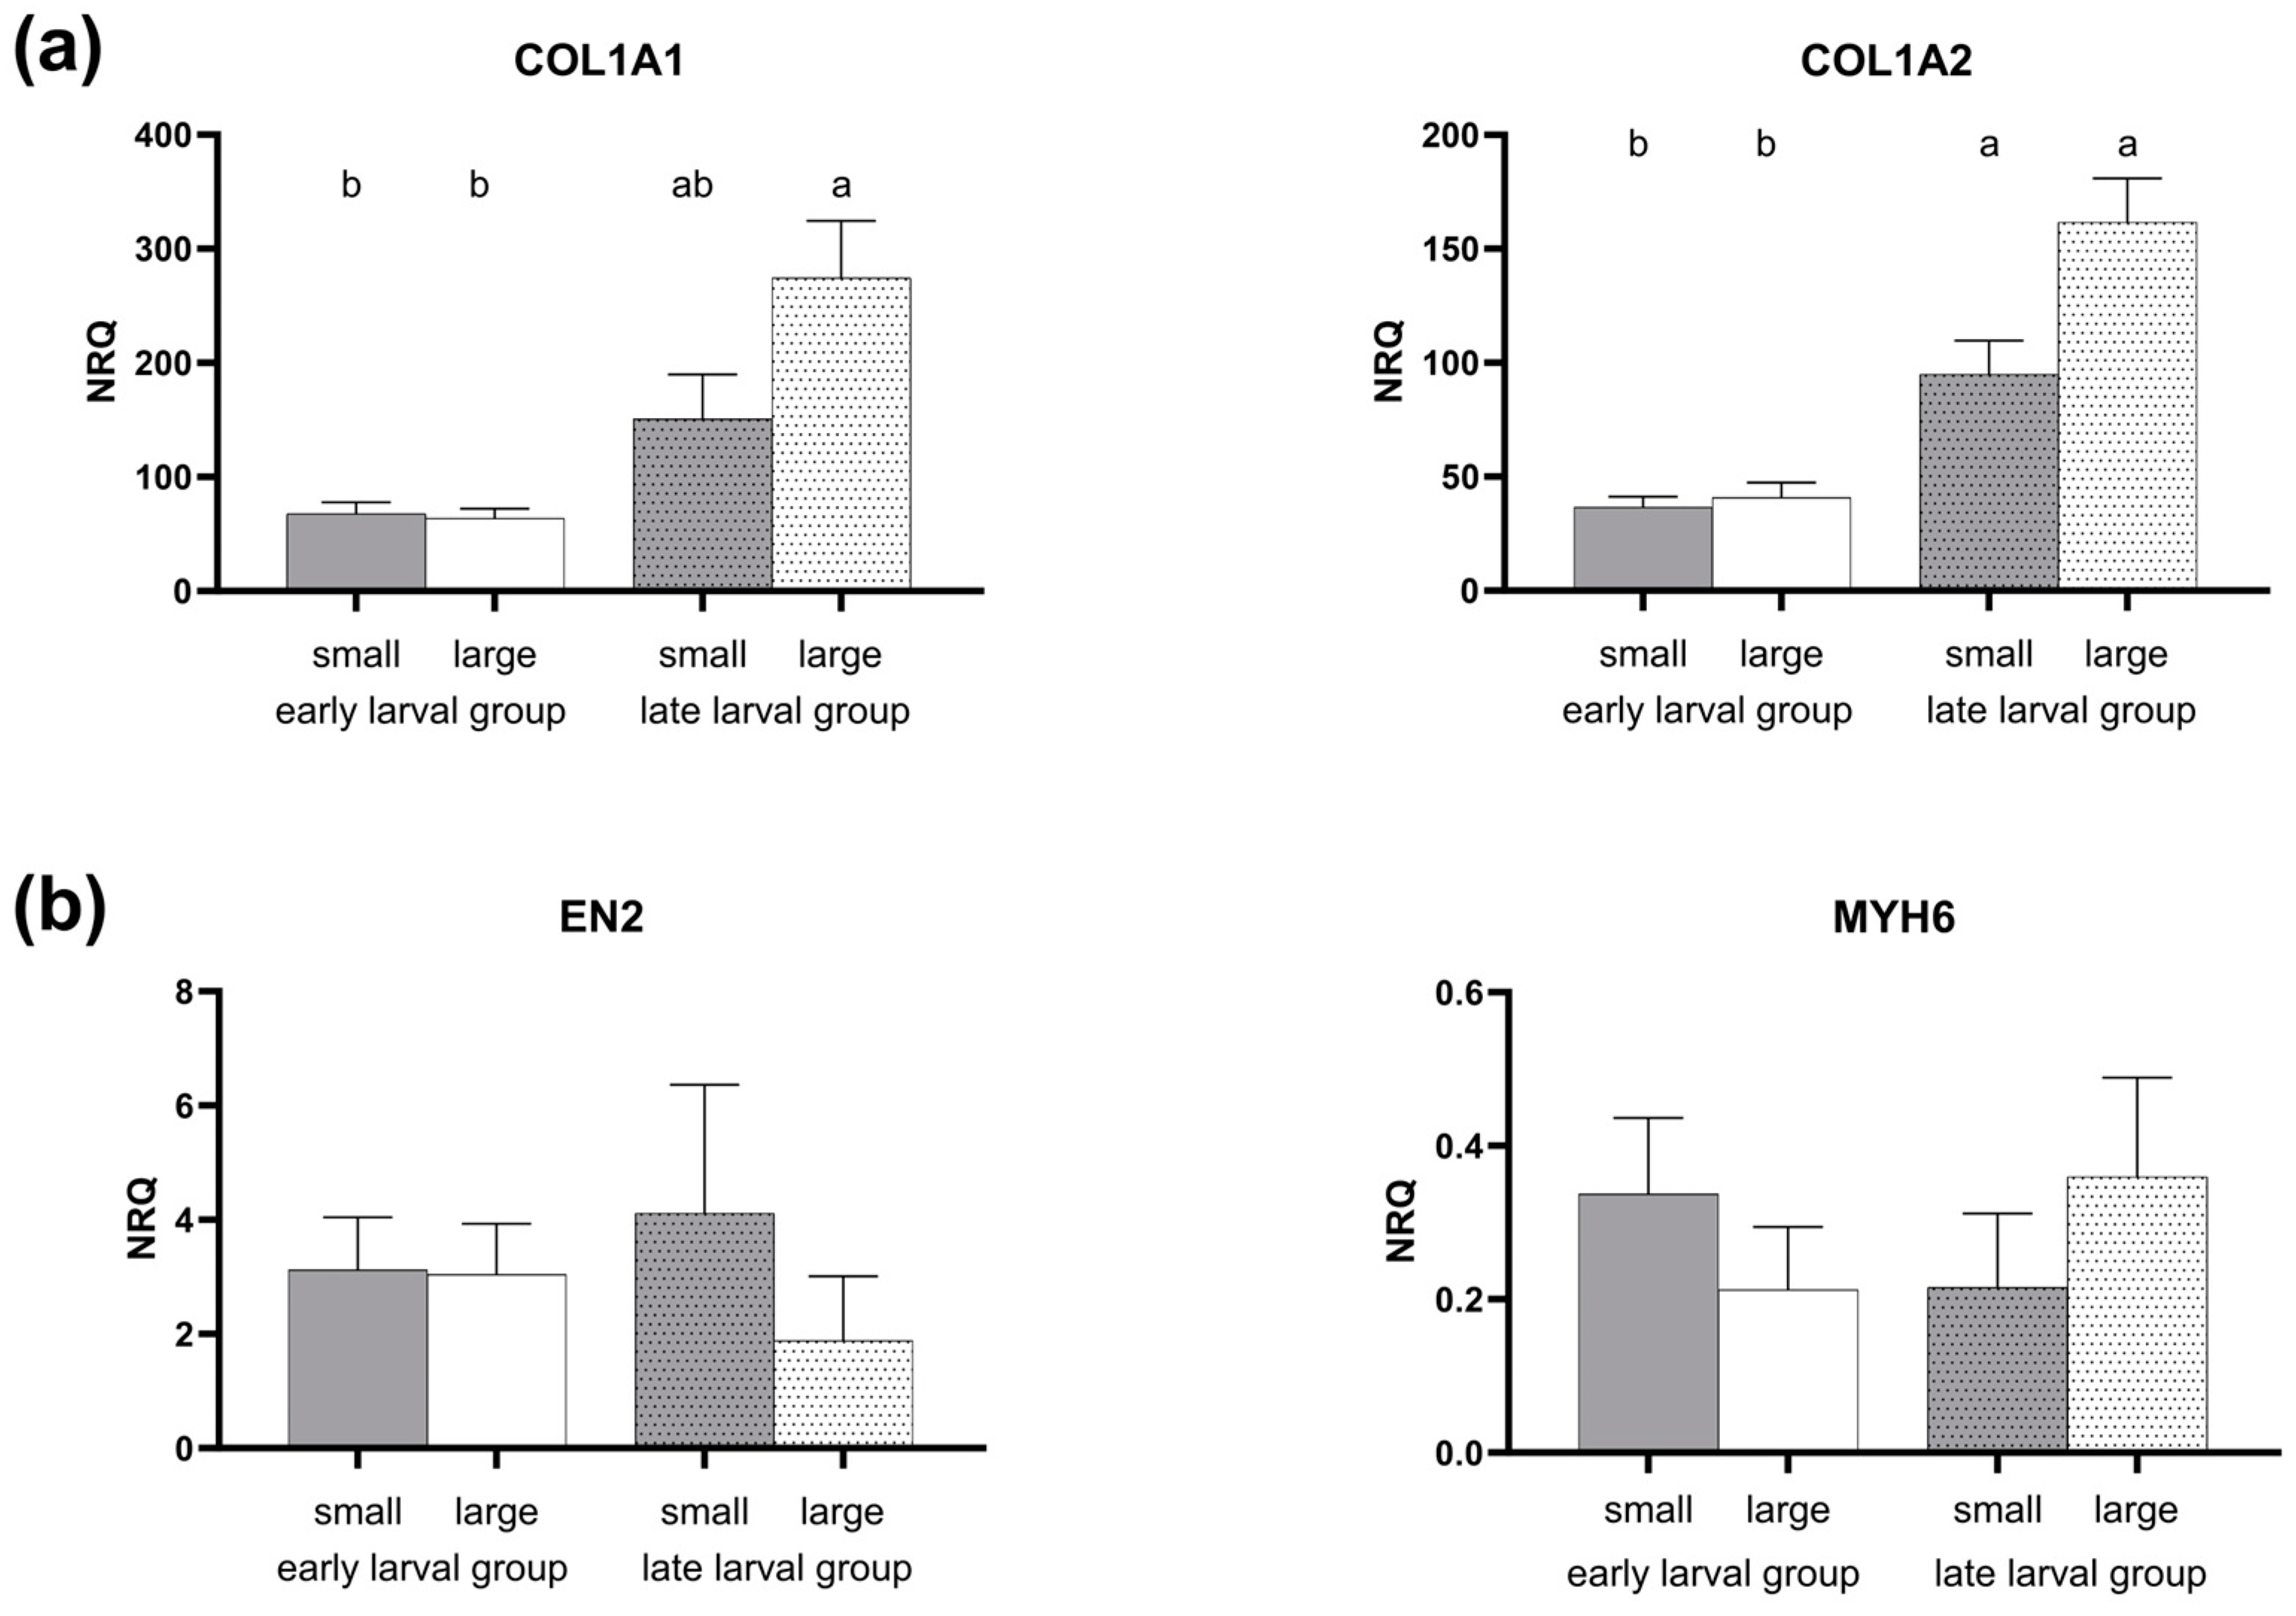
The structural marker genes COL1A1 and COL1A2 were significantly differently expressed in the larval groups (Figure 7a). COL1A1 was significantly more expressed in the large late larval samples compared to both early larval sizes. COL1A2 was significantly more expressed in both late larval samples compared to the early larval sizes. The gene expression of EN2 (Mandibular arch-muscle specific engrailed 2), responsible for the development of the jaw elements, had no significantly different expression between the samples (Figure 7b). This was also the case for the heart-specific transcription factor MYH6 (Cardiac-specific myosin heavy chain 6) (Figure 7b).

4. Discussion

4.1. Morphometric Distinctions of Size Classes and Growth

For the size comparisons, individuals were separated into either a small or a large size class based on the mean total length of the sampling groups. The pronounced distinction between small and large size classes during the ontogeny was already evident in the early larval group. Overall, general growth tendencies were positive in both developmental groups, with a higher regression slope in the late larval group. However, an intermediate decrease in the group mean total length was present in between the 227 dd and 256 dd stages, which we consider to be related to the sampling size for the number of measured individuals and the influence of temperature variation. It is worth noting that, in the subsequent late larval group, the increasing size differences were accompanied by significant size differences in head length. Given the interrelation between head development and the development of the jaw elements [20], we hypothesise that in pikeperch larvae, a large head is correlated with larger jaw bones, which could allow the larger larvae to take up a wider range of prey. This is supported by a strong correlation between fish length and mouth gape size in pikeperch [21] and further between head length and fish length [9]. Furthermore, previous studies have shown that pikeperch have size-dependent predator-prey relationships [22], with gape size being the limiting factor for prey ingestion [22,23]. Additionally, the size of the mouth has been shown to be associated with the occurrence of cannibalism, including the sister species Sander vitreum [24]. Consequently, the greater head length of the large pikeperch larvae would give these individuals a competitive advantage in the ingestion of prey. The sampling for this study, between mouth gape opening [25,26] and the start of piscivory [6,8], allowed to exclude potential influences of piscivory on the growth and gene expression. However, the differently sized natural zooplancton spectrum might have an effect on the growth and gene expression, especially for the later larval group with their differently sized head lengths.
Contradicting this, the expression of EN2 is similar for all groups. EN2 is expressed in the jaw muscles of vertebrates [27,28] and was previously found to be expressed more dominantly after the switch to external feeding [9]. However, since EN2 also influences midbrain development in fish [29,30] and generally determines muscle fibre type [31], the temporal and spatial expression changes of EN2 cannot be differentiated by the grouped sample setup here. In the expression analysis of genes of interest, significant differences only occurred between the two developmental groups and not between the size classes within them. The expression patterns showed that initial transcription factors for general growth as well as muscle growth were active in the two developmental phases investigated.

4.2. Regulatory Genes Connected to Stem Cell Activation

Generally, considering genes related to the activation of satellite cells and stem cells, PAX3 and PAX7 are mainly expressed by cells in the dermomyotome [32]. In the dermomyotome of fishes, these regulatory genes are necessary for, but are also suppressed by, myogenesis [33,34]. Both transcription factors interact together with MSX1 in myogenic development [35], but are not affected by the developmental group or size class investigated in pikeperch larvae within this study. The complex interrelations of muscle development are reflected in the different expression patterns of the genes studied. The higher expression of MRF4 and MYOD1 in the older larval pikeperch stages, contrasted by the partly lower expression in the early larval group, indicates parallels to wave-like embryonic muscle development [36]. The expression of genes related to growth and muscle development exhibits a pattern that is dependent on development [14,37]. As already mentioned, in the present study, no significant difference was found in the expression of stem cell activation-related genes, with the exception of PGC1A. Here, significantly lower expressions in the large late larval stage compared to the early larval group were present. The transcription factor PGC1A is also a master regulator for mitochondrial function and organismal metabolism (reviewed in [38]). In interaction with other regulatory factors like TGFB1, an activation of PGC1A increases oxygen consumption in mammalian cells [39]. In the pikeperch larvae of the present study, no differences in gene expression were detected for general growth factors (see Figure 5). The transcript levels of the genes coding for the transcription factors PGC1A and TGFB1 were decreased as well as increased in specifically the large late larvae in comparison to the other larval groups. As shown by Nam and colleagues [40], the interaction of these two transcription factors can lead to regulation of the tricarboxylic acid (TCA) cycle of energy metabolism. Such findings suggest that the investigation into the factors contributing to the divergence in growth could be related to mitochondrial energy metabolism. However, an upregulation of genes related to energy metabolism pathways was previously found to occur in transcriptomic analyses of Dicentrarchus labrax larvae [41].

4.3. Genes of Growth and General Development

As shown by the stable gene expression of different growth factors (IGF1, IGF2, FGF4, FGF6, and FGF8), the genetic potential for growth of pikeperch larvae seems to be similar in the early and late larval groups, regardless of the size. The indications of a different utilisation in the energy metabolism (PGC1A and TGFB1) could lead to individual effects up to divergent growth. These individual strategies are not captured in our generalised experimental approach, which has been designed to examine rather general molecular mechanisms of size differences in pikeperch larvae. By using a mixed clutch approach (2–3 female spawners combined with five males), potential biases that may influence egg quality and subsequent development through both maternal and paternal effects were minimised [42,43].

4.4. Myogenic Development and Structural Marker Genes

Considering muscle development and based on the dynamic wave-like expression pattern in muscle development during pikeperch ontogeny [14,15], we detected significant differences in MYOD1 and MRF4 expression between the developmental groups. In contrast, the effects of other master regulators such as MYF5 and MYOG and their interactions within the myogenesis cascade [44] could be overlaid by the selection of groups of pikeperch larvae that has been carried out in the present study. Nevertheless, the significant patterns of the expression levels might indicate possible differences in the developmental progress between the size classes of the same developmental group.
The generally higher expression of MYOD1 and collagen genes (COL1A1 and COL1A2) in the late larval developmental groups gives an indication of a temporal advance in ontogenesis and, furthermore, in the development of skin, bones, and scales through the formation of extracellular matrix proteins [45,46]. The development and interaction of muscles and bones together with other elements of the musculoskeletal system ensure the functionality of locomotion [47]. A resulting better locomotion could lead to a benefit for larvae with stronger and faster growth due to better hunting and escape abilities. This hypothesis is supported by the larger tail area of older pikeperch larvae in comparison to our studied age stages [3], as this area consists of the largest degree of locomotory muscle tissue.

5. Conclusions

The investigation of some of the genetic determinants contributing to growth differences in pikeperch rearing did not yield conclusive evidence. However, this in turn also means that the fundamental basis for our genes of interest is size-independent in the larval stages prior to the onset of piscivory. Following indications from the gene expression patterns, we hypothesise that influences on the individual level affect mitochondrial energy metabolism as well as myogenesis, resulting in size differences.
Our objective was to identify gene expression variations associated with development, growth, and muscle in early and late pikeperch larvae (227 dd to 666 dd), specifically comparing conspecifics of small and large size. The sampling strategy was designed to capture overall size effects across two development groups while mitigating the impact of later-onset cannibalism. Based on our data, we could not determine any size-related influence on gene expression patterns, either overall or within the developmental groups. Consequently, the capacity for growth appears to be largely independent of the expression of the analysed genes of interest. Nevertheless, variations in gene expression levels, particularly in the mitochondrial energy pathway (PGC1A and TGFB1) and myogenesis (MYOD1 and MRF4), were observed, suggesting potential outcomes being influenced at the individual level.

Supplementary Materials

The following supporting information can be downloaded at: https://www.mdpi.com/article/10.3390/fishes9010033/s1, Table S1: Alphabetical primer list of genes of interest (GOI) for Fluidigm multiplex quantitative PCR.

Author Contributions

Conceptualisation, B.G.; methodology, K.T., G.P.F. and P.L.; validation, K.T., G.P.F. and A.R.; formal analysis, K.T.; investigation, K.T. and G.P.F.; resources, B.G.; data curation, K.T.; writing—original draft preparation, K.T.; writing—review and editing, K.T., G.P.F., A.R., P.L. and B.G.; visualisation, K.T.; supervision, B.G.; project administration, B.G.; funding acquisition, B.G. All authors have read and agreed to the published version of the manuscript.

Funding

This research was funded by the European Maritime and Fisheries Fund (EMFF, MV-II.1-LM-013). The publication of this article was funded by the Open Access Fund of the FBN.

Institutional Review Board Statement

This study does not contain any animal experiments. Fishes used in this study were euthanised according to the animal welfare law Directive 2010/63/EU and TierSchG § 4(3) before sampling.

Data Availability Statement

All relevant data are within the manuscript.

Acknowledgments

We would like to thank Julian Krinitskij for the technical support in performing the fluidigm multiplex real-time PCR.

Conflicts of Interest

The authors declare no conflicts of interest. The funders had no role in the design of the study; in the collection, analyses, or interpretation of data; in the writing of the manuscript; or in the decision to publish the results.

References

  1. Policar, T.; Schaefer, F.J.; Panana, E.; Meyer, S.; Teerlinck, S.; Toner, D.; Zarski, D. Recent progress in European percid fish culture production technology-tackling bottlenecks. Aquac. Int. 2019, 27, 1151–1174. [Google Scholar]
  2. Colchen, T.; Gisbert, E.; Krauss, D.; Ledoré, Y.; Pasquet, A.; Fontaine, P. Improving pikeperch larviculture by combining environmental, feeding and populational factors. Aquac. Rep. 2020, 17, 100337. [Google Scholar] [CrossRef]
  3. Colchen, T.; Fontaine, P.; Ledoré, Y.; Teletchea, F.; Pasquet, A. Intra-cohort cannibalism in early life stages of pikeperch. Aquac. Res. 2019, 50, 915–924. [Google Scholar] [CrossRef]
  4. Steenfeldt, S.; Lund, I.; Höglund, E. Is batch variability in hatching time related to size heterogeneity and cannibalism in pikeperch (Sander lucioperca)? Aquac. Res. 2011, 42, 727–732. [Google Scholar] [CrossRef]
  5. Szczepkowski, M.; Zakęś, Z.; Szczepkowska, B.; Piotrowska, I. Effect of size sorting on the survival, growth and cannibalism in pikeperch (Sander lucioperca L.) larvae during intensive culture in RAS. Czech. J. Anim. Sci. 2011, 56, 483–489. [Google Scholar] [CrossRef]
  6. Colchen, T.; Dias, A.; Gisbert, E.; Teletchea, F.; Fontaine, P.; Pasquet, A. The onset of piscivory in a freshwater fish species: Analysis of behavioural and physiological traits. J. Fish Biol. 2020, 96, 1463–1474. [Google Scholar] [CrossRef] [PubMed]
  7. Pereira, L.S.; Agostinho, A.A.; Winemiller, K.O. Revisiting cannibalism in fishes. Rev. Fish Biol. Fish. 2017, 27, 499–513. [Google Scholar]
  8. Szkudlarek, M.; Zakęś, Z. Effect of stocking density on survival and growth performance of pikeperch, Sander lucioperca (L.), larvae under controlled conditions. Aquac. Int. 2007, 15, 67–81. [Google Scholar]
  9. Franz, G.P.; Lewerentz, L.; Grunow, B. Observations of growth changes during the embryonic-larval-transition of pikeperch (Sander lucioperca) under near-natural conditions. J. Fish Biol. 2021, 99, 425–436. [Google Scholar] [CrossRef]
  10. Ott, A.; Löffler, J.; Ahnelt, H.; Keckeis, H. Early development of the postcranial skeleton of the pikeperch Sander lucioperca (Teleostei: Percidae) relating to developmental stages and growth. J. Morphol. 2012, 273, 894–908. [Google Scholar] [CrossRef]
  11. Penaz, M. A general framework of fish ontogeny: A review of the ongoing debate. Folia Zool. 2001, 50, 241–256. [Google Scholar]
  12. El Kertaoui, N.; Lund, I.; Assogba, H.; Dominguez, D.; Izquierdo, M.S.; Baekelandt, S.; Cornet, V.; Mandiki, S.N.M.; Montero, D.; Kestemont, P. Key nutritional factors and interactions during larval development of pikeperch (Sander lucioperca). Sci. Rep. 2019, 9, 7074. [Google Scholar] [CrossRef] [PubMed]
  13. Imentai, A.; Gilannejad, N.; Martínez-Rodríguez, G.; López, F.J.M.; Martínez, F.P.; Pěnka, T.; Dzyuba, V.; Dadras, H.; Policar, T. Effects of First Feeding Regime on Gene Expression and Enzyme Activity in Pikeperch (Sander lucioperca) Larvae. Front. Mar. Sci. 2022, 9, 864536. [Google Scholar] [CrossRef]
  14. Franz, G.P.; Tönißen, K.; Rebl, A.; Lutze, P.; Grunow, B. The expression of myogenic gene markers during the embryo-larval-transition in Pikeperch (Sander lucioperca). Aquac. Res. 2022, 53, 14. [Google Scholar] [CrossRef]
  15. Lavajoo, F.; Falahatkar, B.; Perelló-Amorós, M.; Moshayedi, F.; Efatpanah, I.; Gutiérrez, J. The pattern of gene expression (IGF family, muscle growth regulatory factors and osteogenesis related genes) involved in growth of skeletal muscle in pikeperch (Sander lucioperca) during ontogenesis. Preprint 2023. [Google Scholar] [CrossRef]
  16. Schäfer, N.; Kaya, Y.; Rebl, H.; Stüeken, M.; Rebl, A.; Nguinkal, J.A.; Franz, G.P.; Brunner, R.M.; Goldammer, T.; Grunow, B.; et al. Insights into early ontogenesis: Characterization of stress and development key genes of pikeperch (Sander lucioperca) in vivo and in vitro. Fish Physiol. Biochem. 2021, 47, 515–532. [Google Scholar] [CrossRef]
  17. Rebl, A.; Rebl, H.; Verleih, M.; Haupt, S.; Köbis, J.M.; Goldammer, T.; Seyfert, H.-M. At Least Two Genes Encode Many Variants of Irak3 in Rainbow Trout, but Neither the Full-Length Factor Nor Its Variants Interfere Directly With the TLR-Mediated Stimulation of Inflammation. Front. Immunol. 2019, 10, 2246. [Google Scholar] [CrossRef]
  18. Swirplies, F.; Wuertz, S.; Baßmann, B.; Orban, A.; Schäfer, N.; Brunner, R.M.; Hadlich, F.; Goldammer, T.; Rebl, A. Identification of molecular stress indicators in pikeperch Sander lucioperca correlating with rising water temperatures. Aquaculture 2019, 501, 260–271. [Google Scholar] [CrossRef]
  19. Hellemans, J.; Mortier, G.; De Paepe, A.; Speleman, F.; Vandesompele, J. qBase relative quantification framework and software for management and automated analysis of real-time quantitative PCR data. Genome Biol. 2007, 8, R19. [Google Scholar] [CrossRef]
  20. Löffler, J.; Ott, A.; Ahnelt, H.; Keckeis, H. Early development of the skull of Sander lucioperca (L.) (Teleostei: Percidae) relating to growth and mortality. J. Fish Biol. 2008, 72, 233–258. [Google Scholar] [CrossRef]
  21. Mehner, T.; Hüulsmann, S.; Worischka, S.; Plewa, M.; Benndorf, J. Is the midsummer decline of Daphnia really induced by age-0 fish predation? Comparison of fish consumption and M Daphnia mortality and life history parameters in a biomanipulated reservoir. J. Plankton Res. 1998, 20, 1797–1811. [Google Scholar] [CrossRef]
  22. Dörner, H.; Hülsmann, S.; Hölker, F.; Skov, C.; Wagner, A. Size-dependent predator–prey relationships between pikeperch and their prey fish. Ecol. Freshw. Fish 2007, 16, 307–314. [Google Scholar] [CrossRef]
  23. Vehanen, T.; Hyvärinen, P.; Huusko, A. Food consumption and prey orientation of piscivorous brown trout (Salmo trutta) and pikeperch (Stizostedion lucioperca) in a large regulated lake. J. Appl. Ichthyol. 1998, 14, 15–22. [Google Scholar] [CrossRef]
  24. Baras, E.; Jobling, M. Dynamics of intracohort cannibalism in cultured fish. Aquac. Res. 2002, 33, 461–479. [Google Scholar] [CrossRef]
  25. Xu, Z.; Li, C.; Ling, Q.; Gaughan, S.; Wang, G.; Han, X. Early development and the point of no return in pikeperch (Sander lucioperca L.) larvae. Chin. J. Oceanol. Limnol. 2017, 35, 1493–1500. [Google Scholar] [CrossRef]
  26. Güralp, H.; Pocherniaieva, K.; Blecha, M.; Policar, T.; Psenicka, M.; Saito, T. Development, and effect of water temperature on development rate, of pikeperch Sander lucioperca embryos. Theriogenology 2017, 104, 94–104. [Google Scholar] [CrossRef] [PubMed]
  27. Hatta, K.; Schilling, T.F.; BreMiller, R.A.; Kimmel, C.B. Specification of Jaw Muscle Identity in Zebrafish: Correlation with engrailed-Homeoprotein Expression. Science 1990, 250, 802–805. [Google Scholar] [CrossRef]
  28. Knight, R.D.; Mebus, K.; Roehl, H.H. Mandibular arch muscle identity is regulated by a conserved molecular process during vertebrate development. J. Exp. Zool. Part B Mol. Dev. Evol. 2008, 310B, 355–369. [Google Scholar] [CrossRef]
  29. Vecino, E.; Ekström, P. Expression of the homeobox engrailed gene during the embryonic development of the nervous system of the trout (Salmo fario L.). Neurosci. Lett. 1991, 129, 311–314. [Google Scholar] [CrossRef]
  30. Scholpp, S.; Brand, M. Morpholino-induced knockdown of zebrafish engrailed genes eng2 and eng3 reveals redundant and unique functions in midbrain--hindbrain boundary development. Genesis 2001, 30, 129–133. [Google Scholar] [CrossRef]
  31. Degenhardt, K.; Sassoon, D.A. A role for Engrailed-2 in determination of skeletal muscle physiologic properties. Dev. Biol. 2001, 231, 175–189. [Google Scholar] [CrossRef] [PubMed]
  32. Relaix, F.; Rocancourt, D.; Mansouri, A.; Buckingham, M. A Pax3/Pax7-dependent population of skeletal muscle progenitor cells. Nature 2005, 435, 948–953. [Google Scholar] [CrossRef] [PubMed]
  33. Hammond, C.L.; Hinits, Y.; Osborn, D.P.S.; Minchin, J.E.N.; Tettamanti, G.; Hughes, S.M. Signals and myogenic regulatory factors restrict pax3 and pax7 expression to dermomyotome-like tissue in zebrafish. Dev. Biol. 2007, 302, 504–521. [Google Scholar] [CrossRef] [PubMed]
  34. Akolkar, D.B.; Asaduzzaman, M.; Kinoshita, S.; Asakawa, S.; Watabe, S. Characterization of Pax3 and Pax7 genes and their expression patterns during different development and growth stages of Japanese pufferfish Takifugu rubripes. Gene 2016, 575, 21–28. [Google Scholar] [CrossRef] [PubMed]
  35. Bendall, A.J.; Ding, J.; Hu, G.; Shen, M.M.; Abate-Shen, C. Msx1 antagonizes the myogenic activity of Pax3 in migrating limb muscle precursors. Development 1999, 126, 4965–4976. [Google Scholar] [CrossRef]
  36. Rossi, G.; Messina, G. Comparative myogenesis in teleosts and mammals. Cell Mol. Life Sci. 2014, 71, 3081–3099. [Google Scholar] [CrossRef] [PubMed]
  37. Franz, A.C.; Faass, O.; Kollner, B.; Shved, N.; Link, K.; Casanova, A.; Wenger, M.; D’Cotta, H.; Baroiller, J.F.; Ullrich, O.; et al. Endocrine and Local IGF-I in the Bony Fish Immune System. Biology 2016, 5, 9. [Google Scholar] [CrossRef]
  38. Puigserver, P. Tissue-specific regulation of metabolic pathways through the transcriptional coactivator PGC1-alpha. Int. J. Obes. 2005, 29 (Suppl. S1), S5–S9. [Google Scholar] [CrossRef]
  39. Yu, E.; Foote, K.; Bennett, M. Mitochondrial function in thoracic aortic aneurysms. Cardiovasc. Res. 2018, 114, 1696–1698. [Google Scholar] [CrossRef]
  40. Nam, H.; Kundu, A.; Karki, S.; Brinkley, G.J.; Chandrashekar, D.S.; Kirkman, R.L.; Liu, J.; Liberti, M.V.; Locasale, J.W.; Mitchell, T.; et al. The TGF-β/HDAC7 axis suppresses TCA cycle metabolism in renal cancer. JCI Insight 2021, 6, e148438. [Google Scholar] [CrossRef]
  41. Darias, M.J.; Zambonino-Infante, J.L.; Hugot, K.; Cahu, C.L.; Mazurais, D. Gene Expression Patterns During the Larval Development of European Sea Bass (Dicentrarchus Labrax) by Microarray Analysis. Mar. Biotechnol. 2008, 10, 416–428. [Google Scholar] [CrossRef] [PubMed]
  42. Bobe, J.; Labbé, C. Egg and sperm quality in fish. Gen. Comp. Endocrinol. 2010, 165, 535–548. [Google Scholar] [CrossRef] [PubMed]
  43. Sullivan, C.V.; Chapman, R.W.; Reading, B.J.; Anderson, P.E. Transcriptomics of mRNA and egg quality in farmed fish: Some recent developments and future directions. Gen. Comp. Endocrinol. 2015, 221, 23–30. [Google Scholar] [CrossRef] [PubMed]
  44. Schnapp, E.; Pistocchi, A.S.; Karampetsou, E.; Foglia, E.; Lamia, C.L.; Cotelli, F.; Cossu, G. Induced early expression of mrf4 but not myog rescues myogenesis in the myod/myf5 double-morphant zebrafish embryo. J. Cell Sci. 2009, 122, 481–488. [Google Scholar] [CrossRef]
  45. Gelse, K.; Pöschl, E.; Aigner, T. Collagens—Structure, function, and biosynthesis. Adv. Drug Deliv. Rev. 2003, 55, 1531–1546. [Google Scholar] [CrossRef]
  46. Rescan, P.Y. Development of myofibres and associated connective tissues in fish axial muscle: Recent insights and future perspectives. Differentiation 2019, 106, 35–41. [Google Scholar] [CrossRef]
  47. Sefton, E.M.; Kardon, G. Chapter Five—Connecting muscle development, birth defects, and evolution: An essential role for muscle connective tissue. In Current Topics in Developmental Biology; Wellik, D.M., Ed.; Academic Press: Cambridge, MA, USA, 2019; Volume 132, pp. 137–176. [Google Scholar]
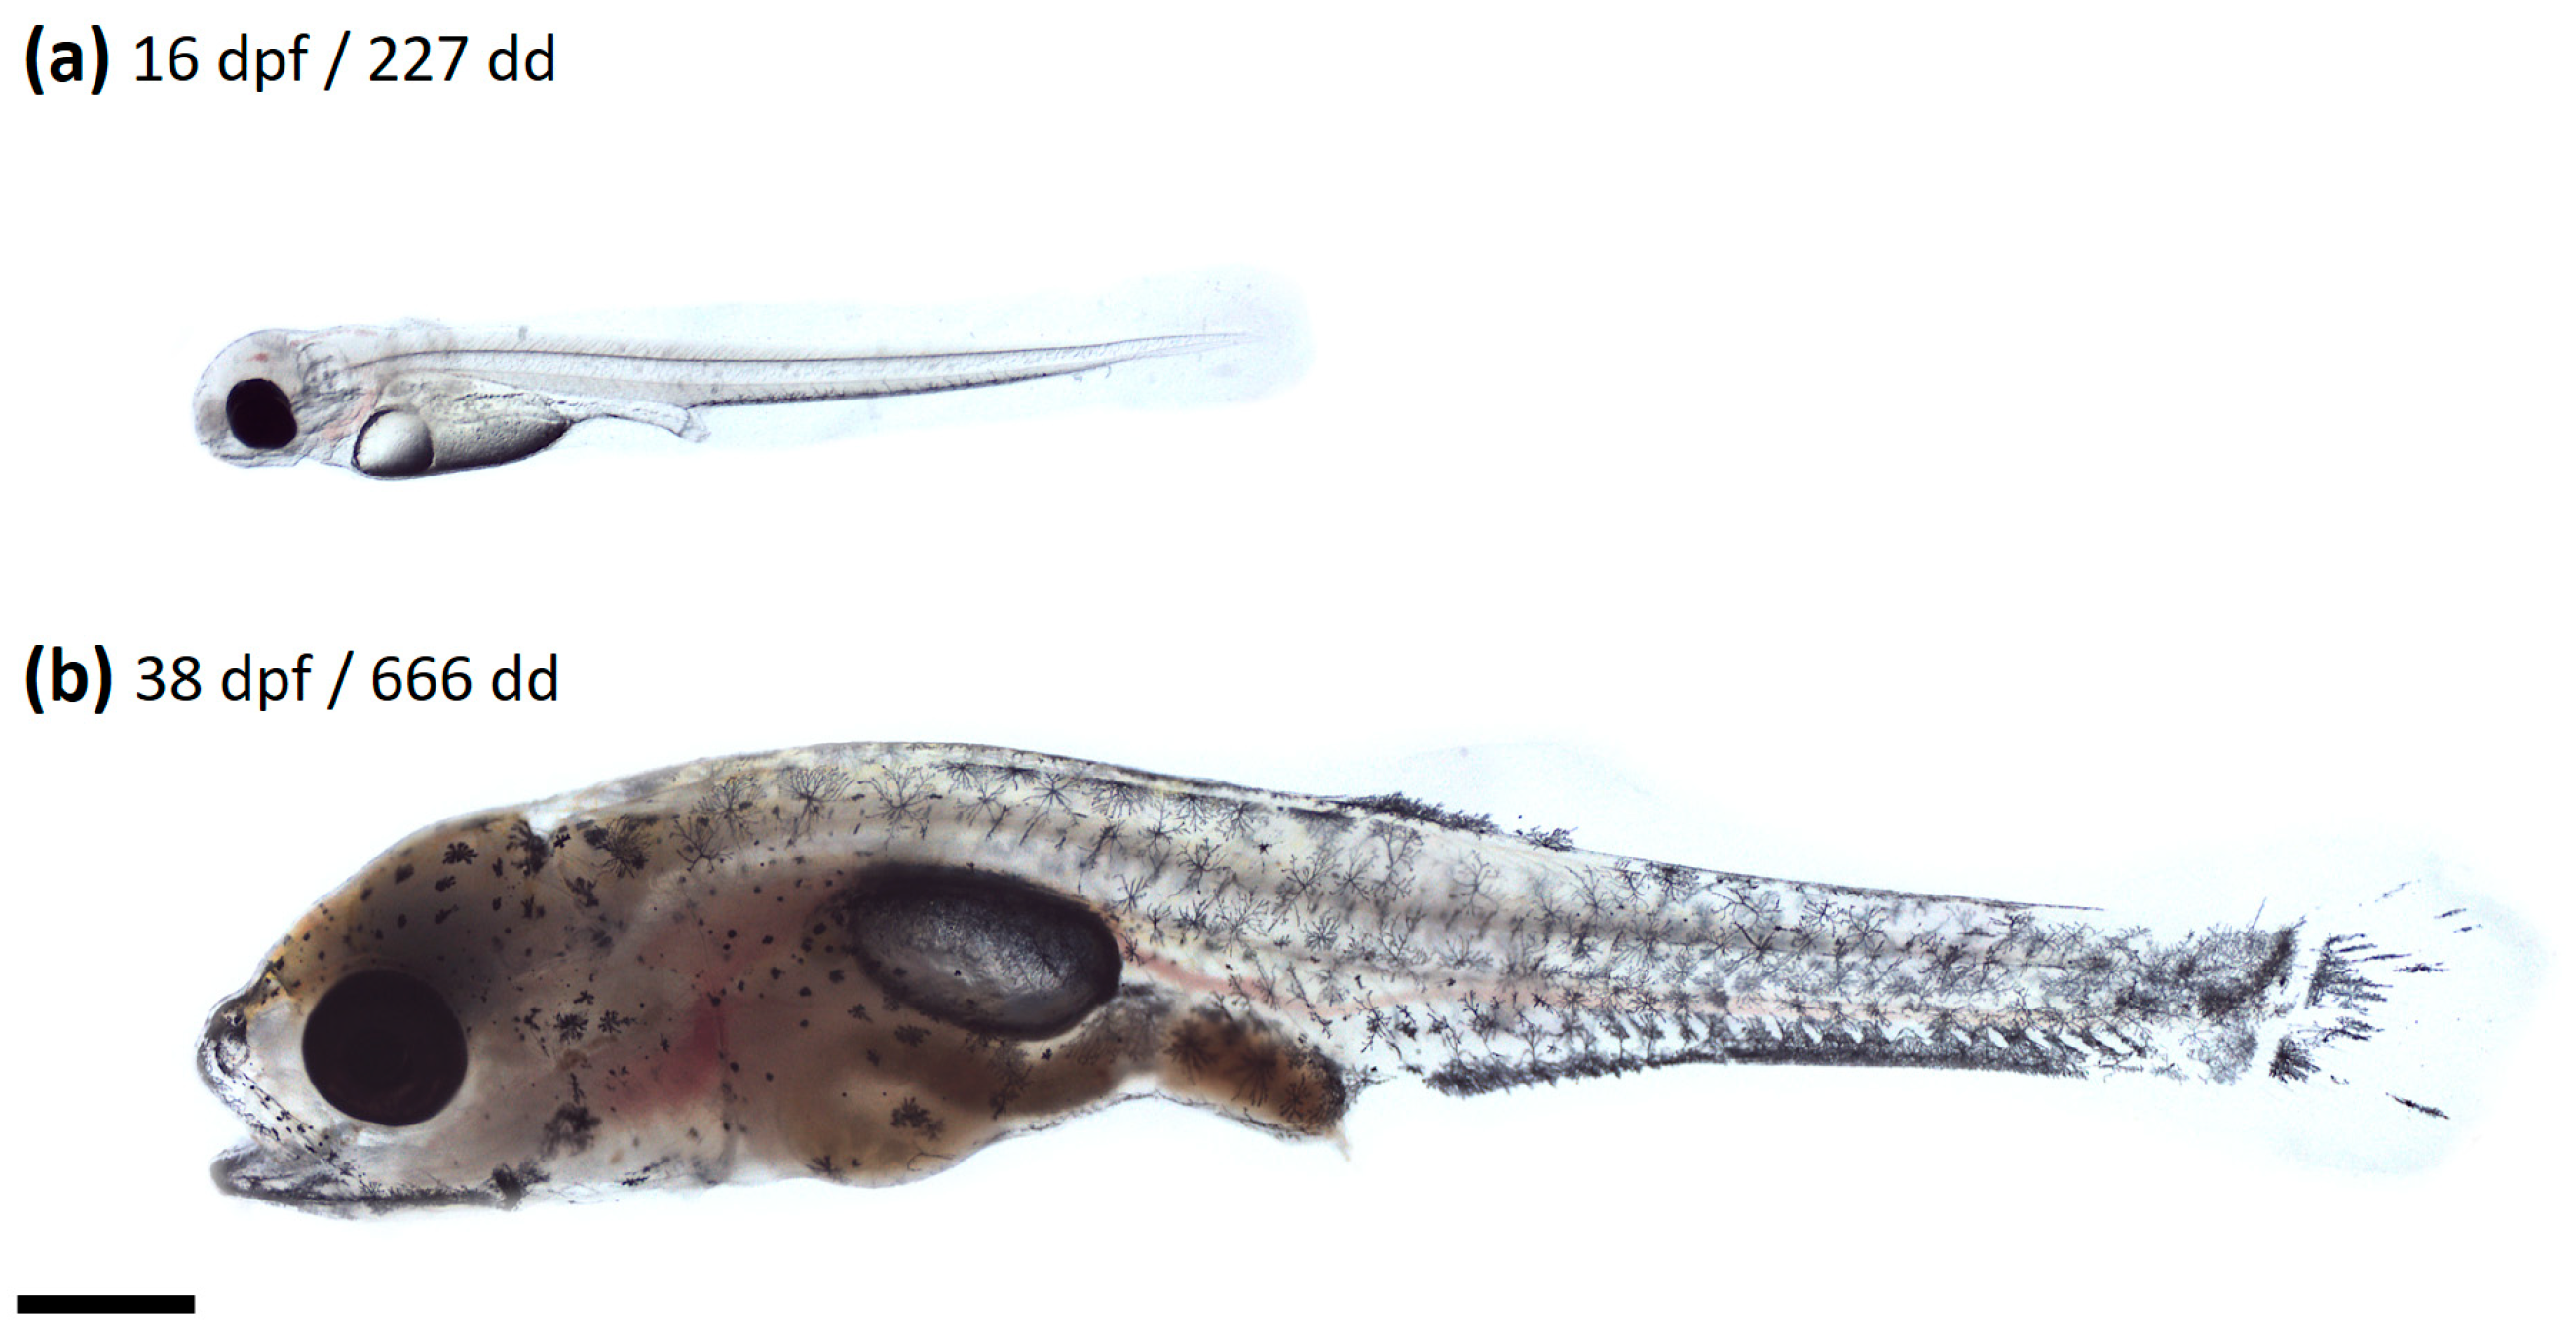
Figure 1. Exemplary light microscope images of pikeperch from the two distinguished larval developmental groups. (a) Larvae of the early larval group at the start of the exogenous feeding. (b) Late larval group specimen after the completed change to exogenous feeding but before the onset of cannibalism. Ages are given in days after fertilisation (dpf) and degree-days (dd). Scale: 1 mm.
Fishes 09 00033 g001
Figure 2. Total length (TL in mm) of pikeperch larval stages prior to the size separations (n = 20 per age stage) starting from 227 dd. Dots indicate the total length of single individuals. A linear regression line has been plotted within both developmental larval groups. The corresponding developmental groups for the expression analysis are added (early larval group: aged 227 to 306 dd, late larval group: aged 512 to 666 dd).
Fishes 09 00033 g002
Figure 3. Total length (TL in mm) and head length (HL in mm) of the “small” (grey blots) and “large” (white blots) size class pikeperch larvae of the developmental groups. (a) Early larval group (blots without dots), age 227 to 306 dd. (b) Late larval group (blots with dots), age 512 to 666 dd. Abbreviations: * p < 0.05, using the Student’s test.
Fishes 09 00033 g003
Figure 4. Expression patterns of selected genes during satellite cell and stem cell activation. Normalised relative quantity (NRQ) of pikeperch larvae of the early larval (blots without dots) and late larval groups (blots with dots) in the two size classes small (grey blots) and large (white blots) is illustrated by its mean and SEM. Small letters indicate significance p ≤ 0.05 between age groups using ANOVA and Tukey’s test. PAX3—Paired box 3; PAX7—Paired box 7; MSX1—Msh homeobox 1; PGC1A—Peroxisome proliferative activated receptor gamma coactivator 1 alpha.
Fishes 09 00033 g004
Figure 5. Expression patterns of the regulatory genes of growth and development. Normalised relative quantity (NRQ) of pikeperch larvae of the early larval (blots without dots) and late larval (blots with dots) groups in the two size classes small (grey blots) and large (white blots) is illustrated by its mean and SEM. Small letters indicate significance p ≤ 0.05 between groups using ANOVA and Tukey’s test. IGF1—Insulin-like growth factor 1; IGF2—Insulin-like growth factor 2; FGF4—Fibroblast growth factor 2; FGF6—Fibroblast growth factor 6; FGF8—Fibroblast growth factor 8; TGFB1—Transforming growth factor beta1.
Fishes 09 00033 g005
Figure 6. Expression patterns of genes in myogenic development. Normalised relative quantity (NRQ) of pikeperch larvae of the early larval (blots without dots) and late larval (blots with dots) groups in the two size classes small (grey blots) and large (white blots) is illustrated by its mean and SEM. Small letters indicate significance p ≤ 0.05 between groups using ANOVA and Tukey’s test. MYOD1—Myogenic Differentiation 1; MYF5—Myogenic factor 5; MRF4—Myogenic regulatory factor 4; MYOG—Myogenin; MEF2A—Myocyte enhancer factor 2A; MSTN—Myostatin.
Fishes 09 00033 g006
Figure 7. Expression patterns of genes for (a) structural markers and (b) regional markers. Normalised relative quantity (NRQ) of pikeperch larvae of the early larval (blots without dots) and late larval (blots with dots) groups in the two size classes small (grey blots) and large (white blots) is illustrated by its mean and SEM. Small letters indicate significance p ≤ 0.05 between groups using ANOVA and Tukey’s test. COL1A1—Collagen type 1 alpha 1; COL1A2—Collagen type 1 alpha 2; EN2—Engrailed 2; MYH6—Myosin heavy chain 6.
Fishes 09 00033 g007
Table 1. Resulting effect influences with their p-values of the calculated ANOVA. The effects of the factors developmental group (early larval, late larval), size class (small and large), and their effect interaction are given. p-values below 0.05 are highlighted in bold. COL1A1—Collagen type 1 alpha 1; COL1A2—Collagen type 1 alpha 2; EN2—Engrailed 2; FGF4—Fibroblast growth factor 2; FGF6—Fibroblast growth factor 6; FGF8—Fibroblast growth factor 8; IGF1—Insulin-like growth factor 1; IGF2—Insulin-like growth factor 2; MEF2A—Myocyte enhancer factor 2A; MRF4—Myogenic regulatory factor 4; MSTN—Myostatin; MSX1—Msh homeobox 1; MYF5—Myogenic factor 5; MYH6—Myosin heavy chain 6; MYOD1—Myogenic Differentiation 1; MYOG—Myogenin; PAX3—Paired box 3; PAX7—Paired box 7; PGC1A—Peroxisome proliferative activated receptor gamma coactivator 1 alpha; TGFB1—Transforming growth factor beta1.
Gene SymbolDevelopmental Group
p Value
Size Class
p Value
Effect Interaction
(Group × Size)
p Value
COL1A10.0000.1960.100
COL1A20.0000.0650.130
EN20.1950.4450.423
FGF40.0320.6520.143
FGF60.2740.6910.594
FGF80.1780.3530.887
IGF10.0640.2010.237
IGF20.4540.6840.915
MEF2A0.1970.1330.432
MRF40.0010.1610.353
MSTN0.2950.1350.105
MSX10.5440.2540.837
MYF50.1930.3760.386
MYH60.9390.7990.362
MYOD10.0000.9770.018
MYOG0.0540.9140.830
PAX30.8130.9010.838
PAX70.3280.3240.101
PGC1A0.0050.1990.280
TGFB10.0040.8880.603
Disclaimer/Publisher’s Note: The statements, opinions and data contained in all publications are solely those of the individual author(s) and contributor(s) and not of MDPI and/or the editor(s). MDPI and/or the editor(s) disclaim responsibility for any injury to people or property resulting from any ideas, methods, instructions or products referred to in the content.