Article

Rapid Monitoring of Aquatic Organism Biodiversity Based on Environmental DNA in a Medium-Sized Reservoir

1
School of Marine Sciences, Ningbo University, Ningbo 315823, China
2
CAS Key Laboratory of Marine Ecology and Environmental Sciences, Institute of Oceanology, Chinese Academy of Sciences, Qingdao 266071, China
3
University of Chinese Academy of Sciences, Beijing 100049, China
*
Author to whom correspondence should be addressed.
Fishes 2024, 9(10), 396; https://doi.org/10.3390/fishes9100396
Submission received: 26 August 2024 / Revised: 28 September 2024 / Accepted: 28 September 2024 / Published: 30 September 2024
(This article belongs to the Special Issue Assessment and Management of Fishery Resources)

Abstract

:
Environmental DNA (eDNA) has emerged as a highly sensitive and efficient tool for the biomonitoring of aquatic ecosystems. In this study, we investigated fish and benthic species communities using eDNA techniques in a medium-sized reservoir (about 3 square kilometers) in Anhui, China. A total of 12 water samples and 11 sediment samples were analyzed by 12S and 18S primers, respectively. We analyzed the composition of species diversity and the effect of seven environmental factors using the Mantel test. A total of 42 fish taxa were present in the water samples, and 188 benthic taxa in the sediment samples. Species composition was different in disparate stations. We found that water temperature and salinity are pivotal factors influencing the composition of fish communities, while chlorophyll-a is a primary environmental determinant for benthic species assembly structures across different zones. Biodiversity information generated by eDNA techniques can be used to reflect the resource status of this reservoir. The relevant results will provide important scientific reference information for the development and exploitation of medium-sized reservoirs.
Key Contribution: eDNA surveys showed that 42 fish taxa were detected from water samples, and 188 benthic taxa were detected from sediment samples using eDNA techniques, which successfully verified that eDNA can be applied to rapid assessment of ecological status in a medium-sized reservoir.

1. Introduction

With the long-term exploitation and utilization of water resources, the degradation of aquatic habitats and the attenuation of aquatic living resources have gradually emerged [1]. To promote the construction of urban ecological civilization, biodiversity and freshwater environment protection have become a key research topic [2]. Fish represent a taxon that reflects the integrity and health of the water ecosystem [3]. In addition, benthic species are widely used to monitor water quality, assess river health, and investigate environmental contamination [4,5]. However, because they are the most diverse groups in the freshwater ecosystem, it is difficult to conduct large-scale sampling surveys. In addition, aquatic organisms have a wide range of living environments, and the assessment of species diversity by morphological methods may lead to species omission and diversity underestimation [6].
Accurate biological monitoring data are of great significance to the conservation of freshwater ecosystems, biodiversity conservation, and water environment management [7]. Traditional assessments of biodiversity may lead to incomplete descriptions of changes in species biodiversity based on a limited number of morphologically identified taxa [8]. In addition, benthic species biodiversity is difficult to assess through traditional methods, which may lead to inaccurate assessment results [9]. Therefore, it is essential to establish a simple, rapid, and efficient monitoring approach to gain information on the species’ presence and distribution.
The environmental DNA (eDNA) technique is a method of collecting DNA shed by the target organism through filtered water and detecting species-specific DNA sequences by polymerase chain reaction (PCR) or sequencing [10,11]. As a high-efficiency, non-damaging monitoring technology, eDNA has been shown to have great potential in identifying community compositions in freshwater regions [12,13,14]. Phytoplankton communities and small metazoa in freshwater fauna are difficult to investigate because of their small size and rapid movement, while molecular monitoring methods represent a promising alternative to traditional methods [15]. The rapid capture of monitored species information based on the collection of environmental samples such as water and sediment has great potential for taxa identification. Moreover, with the development of sequencing technology, eDNA can be monitored for species diversity, including both the presence/absence of species and the abundance of species [16,17,18,19]. It has recently attracted considerable attention for its potential use in biomonitoring methods that can be applied at a large scale [20]. Species composition, species richness, and multiple biodiversity facets could be extracted from eDNA data, which can be used to understand the complex ecosystem processes comprehensively [21]. Up to now, this technology has been successfully used to monitor species in different ecosystems, including single species and multiple species [22,23,24,25].
The Shuimen Pond, situated in the North Development Zone of Huoqiu County, Anhui Province, is divided into various reservoir areas by dikes and islands. It is in the middle reaches of the Huaihe Water basin in the north-central part of Anhui Province, and it has existed for more than 2600 years [26]. As a medium-sized reservoir, Shuimen Pond has a total area of approximately 3 square kilometers, the water depth is about 2–3 m, the storage capacity is 10.4 million cubic meters, the irrigation area is 90,800 mu, and there are 46 islands distributed in the pond, known as the “Qiandao Lake in West Anhui” [22]. In recent years, with the rapid economic development of Huoqiu County, human activities (chemical fertilizer invasion, sewage discharge, industrial wastewater, urban construction, etc.) have intensified, causing varying degrees of pollution in the local water resources [2]. However, the status of biodiversity is unknown, there is a lack of resource monitoring and biodiversity reporting to guide its sustainable development and construction.
To investigate the status of biodiversity and water resources, this study tried to use eDNA techniques to analyze the species composition of Shuimen Pond. We collected different environmental samples for the target organisms because water samples are more representative of fish samples, and sediment DNA is more reflective of benthic composition. This study analyzed (i) the composition of the fish community in water samples, (ii) the composition of the benthic species community in sediment samples, and (iii) the relationship between environmental factors and species distribution. This research laid a good foundation for the construction of Shuimen Pond in the future, and relevant monitoring data provided an important scientific reference for the development and utilization of the local resource status. Such an efficient approach allowed us to evaluate aquatic organism biodiversity quickly and can serve as a pilot case for similar ecosystem monitoring.

2. Materials and Methods

2.1. Sample Collection Sites

Sampling in the Shuimen Pond (32°21′47″ N to 32°23′30″ N, 116°17′09″ E to 116°18′15″ E) was carried out in May 2021, with all samples collected within a single day. We collected 12 water eDNA (W-eDNA) and 11 sediment eDNA (S-eDNA) samples from representative sites across different reservoir areas (Figure 1a). Notably, there were no sediment samples from site S12, as it is a sewage outlet. To prevent contamination, all field equipment was sterilized before transportation to this study site. During the sampling process, laboratory attire and nitrile disposable gloves were strictly worn.

2.2. eDNA Workflows

The eDNA workflows in this study mainly consisted of two sections: (1) field sampling and (2) eDNA analysis, including eDNA extraction, sequencing, and analysis (Figure 1b). Detailed experimental treatment will be described below.
For water samples collection, 2 L water samples were collected from a surface depth of about two meters using a plexiglass water sampler. We sampled three replicates within each site, and then the water samples were put in a brown bottle with DNA preservation solution (Urine DNA locker, Tiandz Inc., Beijing, China) and brought back to the laboratory for DNA filtration. The water samples were filtered using a Sterivex TM-GP filter unit (pore size, 0.22 μm; EMD Millipore Corp., Billerica, MA, USA), and DNA preservation buffer (Tiandz Inc., Beijing, China) was added to the filter unit. In addition, deionized water (2 L) was filtrated as a negative control to test for possible cross-contamination during fieldwork.
In the same reach where environmental DNA (eDNA) samples were collected, a total of 11 sediment samples were gathered to analyze the composition of the benthic species community. The sediment samples were obtained using a sediment grab sampler (Van Veen Grab (2500 cm2), KC-Denmark, Silkeborg, Denmark). Approximately 1 L of sediment from the middle layer was collected, sealed, and frozen for storage until extraction. Sediment samples were extracted exclusively from the intermediate layer of the grab using a syringe. To prevent contamination, syringes were cleaned with a dilute bleach solution (3% sodium hypochlorite) between stations. Additionally, the grab sampler was rinsed with ultrapure water (Millipore Milli-Q) prior to sampling at each station to minimize cross-contamination. Sediment samples from each sampling station were divided into three parts for preservation.
In summary, the total number of various sample types collected from 12 stations for environmental DNA (eDNA) analysis was as follows: 12 water eDNA samples for fish surveys and 11 sediment eDNA samples for benthic species. Additionally, real-time environmental data were recorded onboard using a multiparameter device (YSI 650 MDS, Yellow Springs, OH, USA). The YSI detector was gradually lowered into the water at each station to collect comprehensive data across different water layers. After the operation was completed, the probe instrument was thoroughly cleaned with ultra-pure water before conducting tests at the next station. The measured parameters included temperature (T), salinity (SAL), depth (D), dissolved oxygen (DO), blue-green algae phycoerythrin (BGA-PE), nephelometric turbidity (NTU), specific conductance (SPC), and chlorophyll-a (Chl-a).

2.3. DNA Extraction and PCR Assay

DNA of water and sediment samples were extracted separately using the DNeasy Blood and Tissue Kit (Qiagen, Hilden, Germany) and the OMEGA Soil DNA Kit (M5635-02) (Omega Bio-Tek, Norcross, GA, USA) following the manufacturer’s instructions, and then stored at −20 °C prior to further analysis. The quantity and quality of extracted DNA were measured using a NanoDrop NC2000 spectrophotometer (Thermo Fisher Scientific, Waltham, MA, USA) and agarose gel electrophoresis, respectively. Because of the particularity of these eDNA samples, DNA extraction and detection results could not be used as a qualitative judgment standard. Therefore, the DNA was fully extracted and identified by PCR amplification.
We created amplicon libraries with two reference markers: the MiFish 12S marker (approximately 200 bp) was used to characterize the fish assemblages in water samples, and the 18Sv9 marker (approximately 130 bp) was used for targeting benthic species in sediment samples separately. The 12S rRNA gene was amplified using the fish universal primers MiFish-U (forward: 5′-ACACTCTTTCCCTACACGACGCTCTTCCGATCTNNNNNNGTCGGTAAAACTCGTGCCAGC-3′) and (reverse: 5′-GTGACTGGAGTTCAGACGTGTGCTCTTCCGATCTNNNNNNCATAGTGGGGTATCTAATCCCAGTTTG-3′) [27], and the V9 region of the 18S rRNA gene was amplified using the primer set 1380F (5′-CCCTGCCHTTTGTACACAC-3′) and 1510R (5′-CCTTCYGCAGGTTCACCTAC 3′) [28].
PCR amplicons were purified with Vazyme VAHTSTM DNA Clean Beads (Vazyme, Nanjing, China) and quantified using the Quant-iT PicoGreen dsDNA Assay Kit (Invitrogen, Carlsbad, CA, USA) and a Microplate reader (BioTek, FLx800, Winooski, VT, USA). The 25 μL PCR amplification system mainly contained 5 μL of 5 × reaction buffer, 5 μL of 5 × GC buffer, 2 μL of dNTP (2.5 mM), 1 μL of Forward primer (10 μM), 1 μL of Reverse primer (10 μM), 2 μL of DNA Template, 8.75 μL of ddH2O, and 0.25 μLof Q5 DNA Polymerase. Thermal cycling consisted of initial denaturation at 98 °C for 2 min, followed by 28 cycles consisting of denaturation at 98 °C for 15 s, annealing at primer pair-specific annealing temperatures for 30 s, and extension at 72 °C for 30 s, with a final extension of 5 min at 72 °C. After the individual quantification step, amplicons were pooled in equal amounts, and pair-end sequencing was performed using the NovaSeqPE250 platform with MiSeq Reagent Kit v3 at Shanghai Personal Biotechnology Co., Ltd. (Shanghai, China).

2.4. Bioinformatics Analysis

The sequences were filtered and performed with QIIME2 2019.4 with slight modifications according to the official tutorials (https://docs.qiime2.org/2019.4/tutorials/, accessed at 1 March 2024) [29]. Briefly, raw sequence data were demultiplexed using the demux plugin, followed by primers cutting with the cutadapt plugin [30]. The sequences were then quality filtered, denoised, merged, and chimera removed using the DADA2 plugin [31]. Non-singleton amplicon sequence variants (ASVs) were aligned with mafft and used to construct a phylogeny with fasttree2 [32,33]. Then, representative ASV sequencing was performed using the classify-sklearn naive Bayes taxonomy classifier in the feature-classifier plugin against the reference database [34]. First, blastn was used to compare the sequences with nucleic acid sequences in the NT database [35]. Then, the brocc.py script was called to obtain comment information based on the recommended parameters. The sequence annotation amplified by the 18S primer was based on the nucleotide sequence database of NCBI (http://ftp.ncbi.nih.gov/blast/db/, accessed at 1 March 2024). The taxonomic annotations for the 12S primer were compared with the NCBI Organelle Genome Resources database and MitoFish [24]. According to the results of ASV annotation and the ASV abundance table of each sample, the species abundance table of different levels (domain, phylum, class, order, family, genus, and species) was obtained.

2.5. Statistical Analysis

2.5.1. Species Composition

Sequence data analyses were mainly performed using QIIME2 and pheatmap package of R package (v.3.2.0). To further compare the differences in species composition among samples; species statistics were performed on eDNA monitoring data obtained from different samples (12 water samples and 11 sediment samples from Shuimen Pond). The species identification results of the two primer sets were counted separately. After revision of the taxonomic assignment, the ASVs assigned to the same taxa were condensed together, and taxonomy assignment results were finally formed. We searched and confirmed the species taxonomic information obtained from water samples and sediment through Fishbase (https://fishbase.mnhn.fr/search.php, accessed at 10 March 2024) and Global Biodiversity Information Facility (GBIF, https://www.gbif.org/, accessed at 10 March 2024), respectively. Then, species were ordered by average abundance in the sample. These data were normalized by z-scores, and the main species composition in each sample was shown by a heat map [36]. The mapping tool was developed from the pheatmap package (V1.0.8), which was slightly modified to improve the layout style. The Euclidean distance and complete (default) clustering methods were used to make Heat maps. The focus of hierarchical clustering was on classification, which is based on Euclidean distance to group more similar sample classifications together. The package used popular clustering distances and methods implemented in dist and hclust functions in R [36].
In addition, we used the default fandom forests algorithm to calculate the importance of species to distinguish different samples. Random forest is a classic and efficient machine-learning algorithm based on a decision tree. It belongs to the nonlinear classifier, which can deeply dig into complex nonlinear interdependence between variables. Therefore, it is especially suitable for species community data with discrete and discontinuous distributions [37]. Recent studies have proved that this algorithm can effectively, robustly, and accurately classify microbial community samples [38]. The analysis was to invoke the “classify_samples_ncv” function in QIIME2 (2019.4) q2-sample-classifier for random forest analysis [39]. Fish were counted using the top 20 species levels produced by W-eDNA identification; benthic species were counted by the top 20 family levels produced by S-eDNA identification.

2.5.2. Community Diversity Analysis

Alpha diversity and beta diversity indices were used to characterize species diversity within and between habitats, respectively, in order to evaluate their overall diversity comprehensively [40,41]. Here, we used beta diversity analysis to investigate the structural variation of species communities across samples. The uclust function of the stat package in R (v. 4.0.3) was used to cluster the sample composition by the UPGMA algorithm, and the ggtree package of the R script was used for visualization [41]. The differences in community composition were visualized using a hierarchical cluster diagram. Hierarchical cluster analysis requires that the number of groups is greater than 2 and the number of samples is greater than 3. Similar to ranking analysis, cluster analysis can evaluate the similarity between samples using any distance. We used the combination of cluster tree and bar chart to display the similarity between samples, as well as the species composition information within the samples.

2.5.3. Environmental Analysis

Mantel’s test was executed using the“linkET” package in the R project Vegan package (https://www.r-project.org/, accessed at 15 March 2024) to clarify the influence of environmental factors on species community composition. Species composition was determined based on the analysis of the relative abundance of the obtained sequence [42]. To analyze the different correlations for these two sample methods, fish and benthic species communities were divided into two groups. The Euclidean distances were used to measure compositional and environmental data, and a correlation heat diagram and network diagram were employed. Pearson and Spearman correlation coefficients between environmental factors and species were calculated using the R Project Psych package [43]. Based on the correlation coefficients, we constructed a co-occurrence network with nodes representing ASVs and edges representing correlations between these ASVs. The network was visualized using the R packages igraph and ggraph [44].

3. Results

3.1. Biodiversity Status Assessed by eDNA

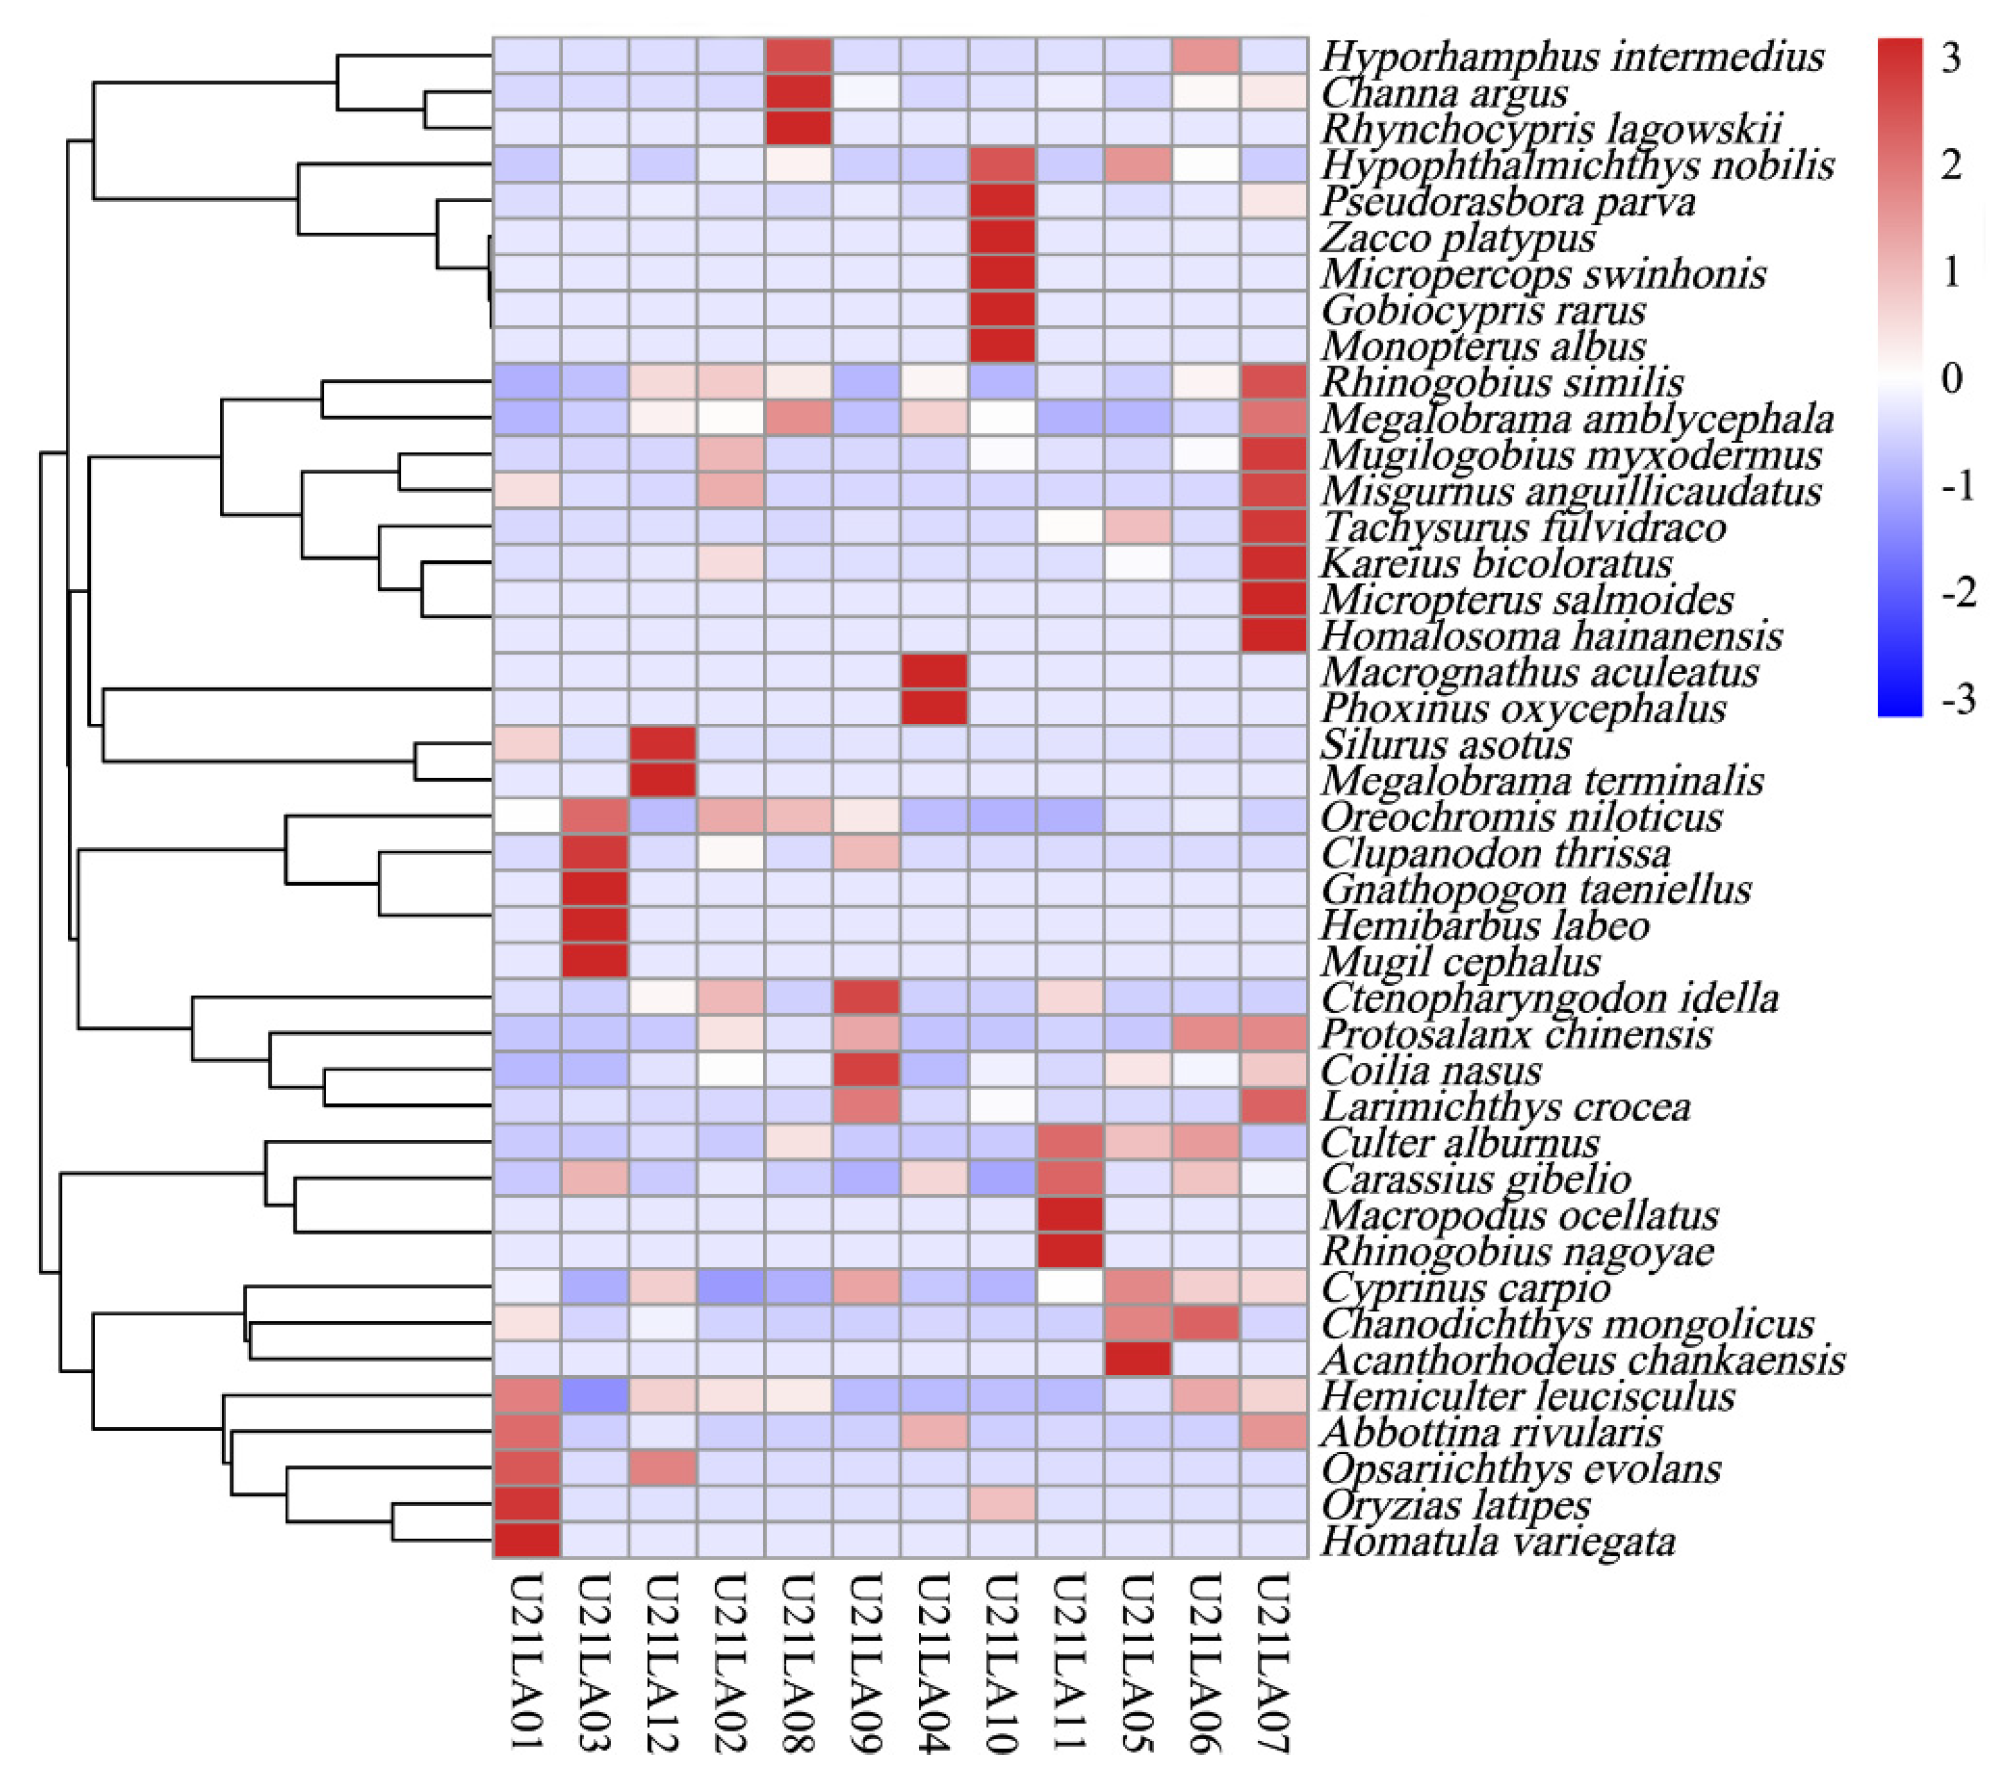
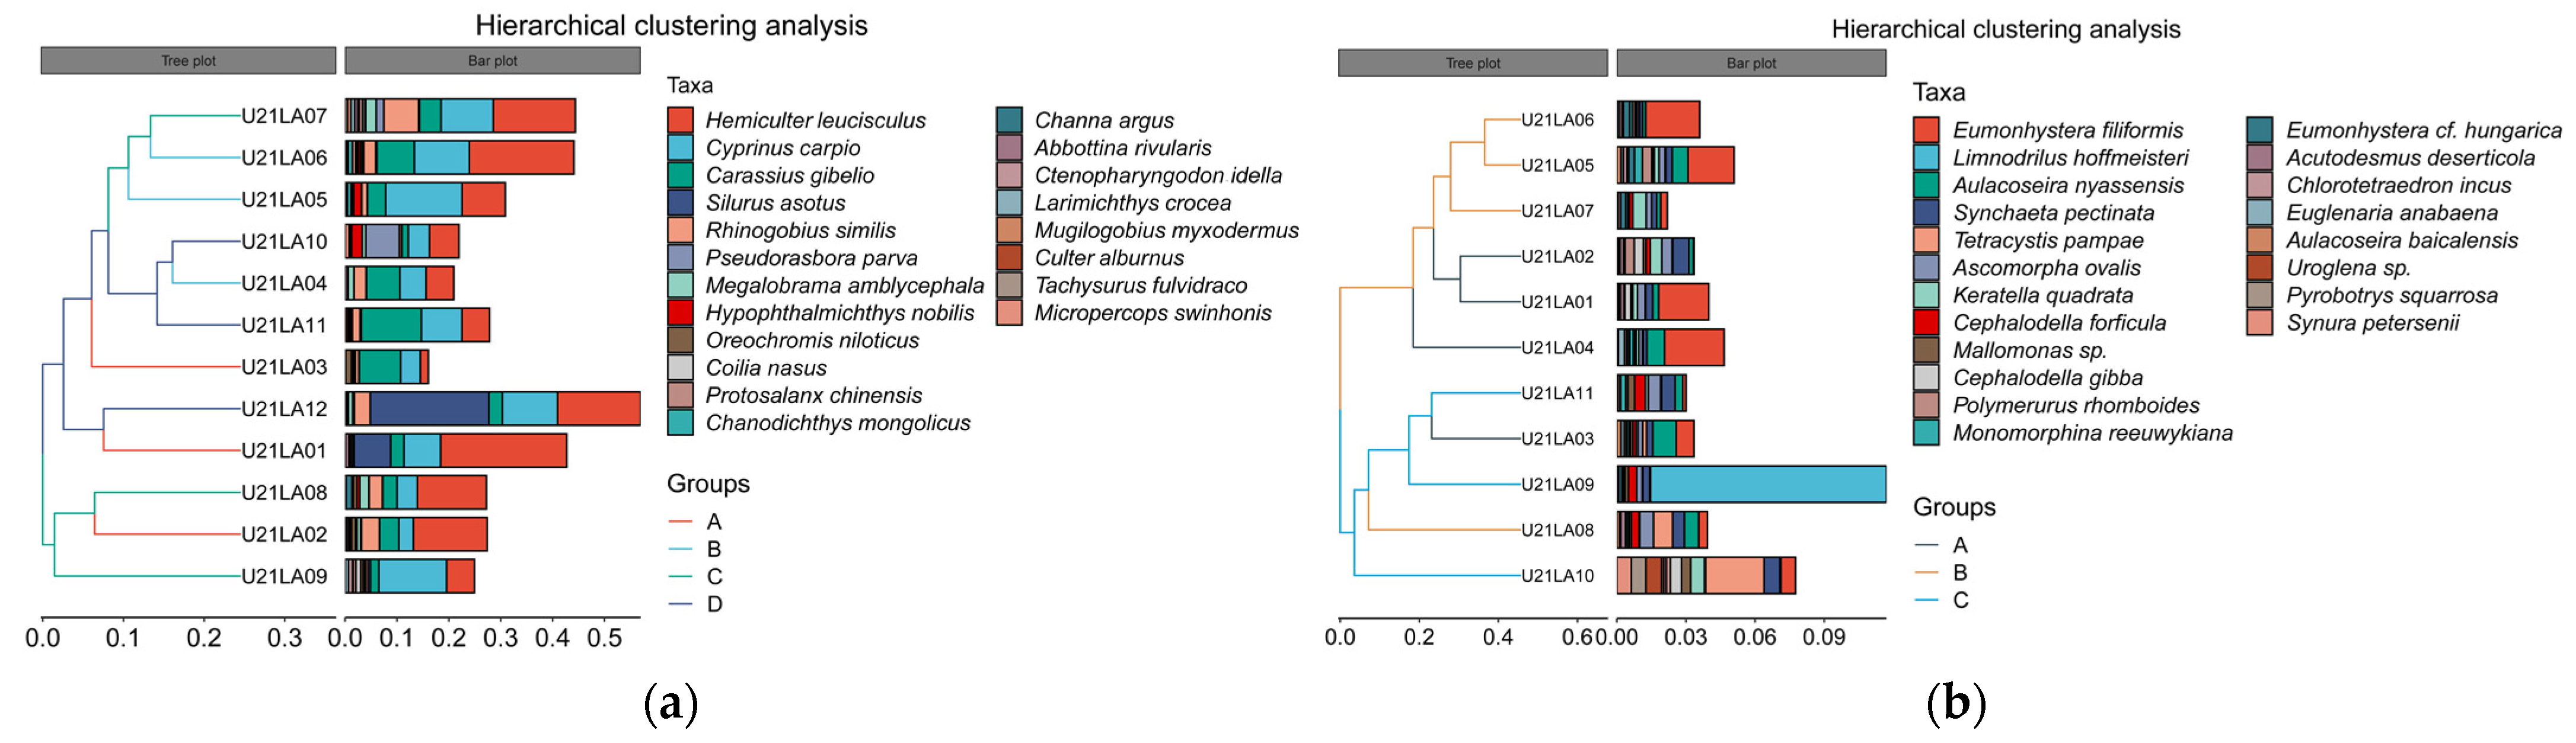
3.1.1. Fish Composition

A total of 1,316,419 high-quality sequences were obtained from W-eDNA samples. 42 fish taxa belonging to 40 genus, 22 family, were detected by 12S rRNA gene. The family Cyprinidae was the most dominant, followed by Gobiidae. Fish abundance values were presented using the relative expression change (z-score) after normalization (scale). The depth of color of the heat map grid indicates the strength of the signal detected by the fish (Figure 2). For example, high signals of Japanese rice fish Oryzias latipes, Homatula variegata, were detected in station U21LA01. The heatmap indicated that U21LA01, U21LA03, U21LA07, and U21LA10 had higher fish diversity and richness than other stations (Figure 2). The hierarchical cluster diagram on the left brings together species that are in close taxonomic proximity, showing the classification of the sample. Overall, there were significant differences in the abundance of fish detected in different reservoir areas (Figure 2).

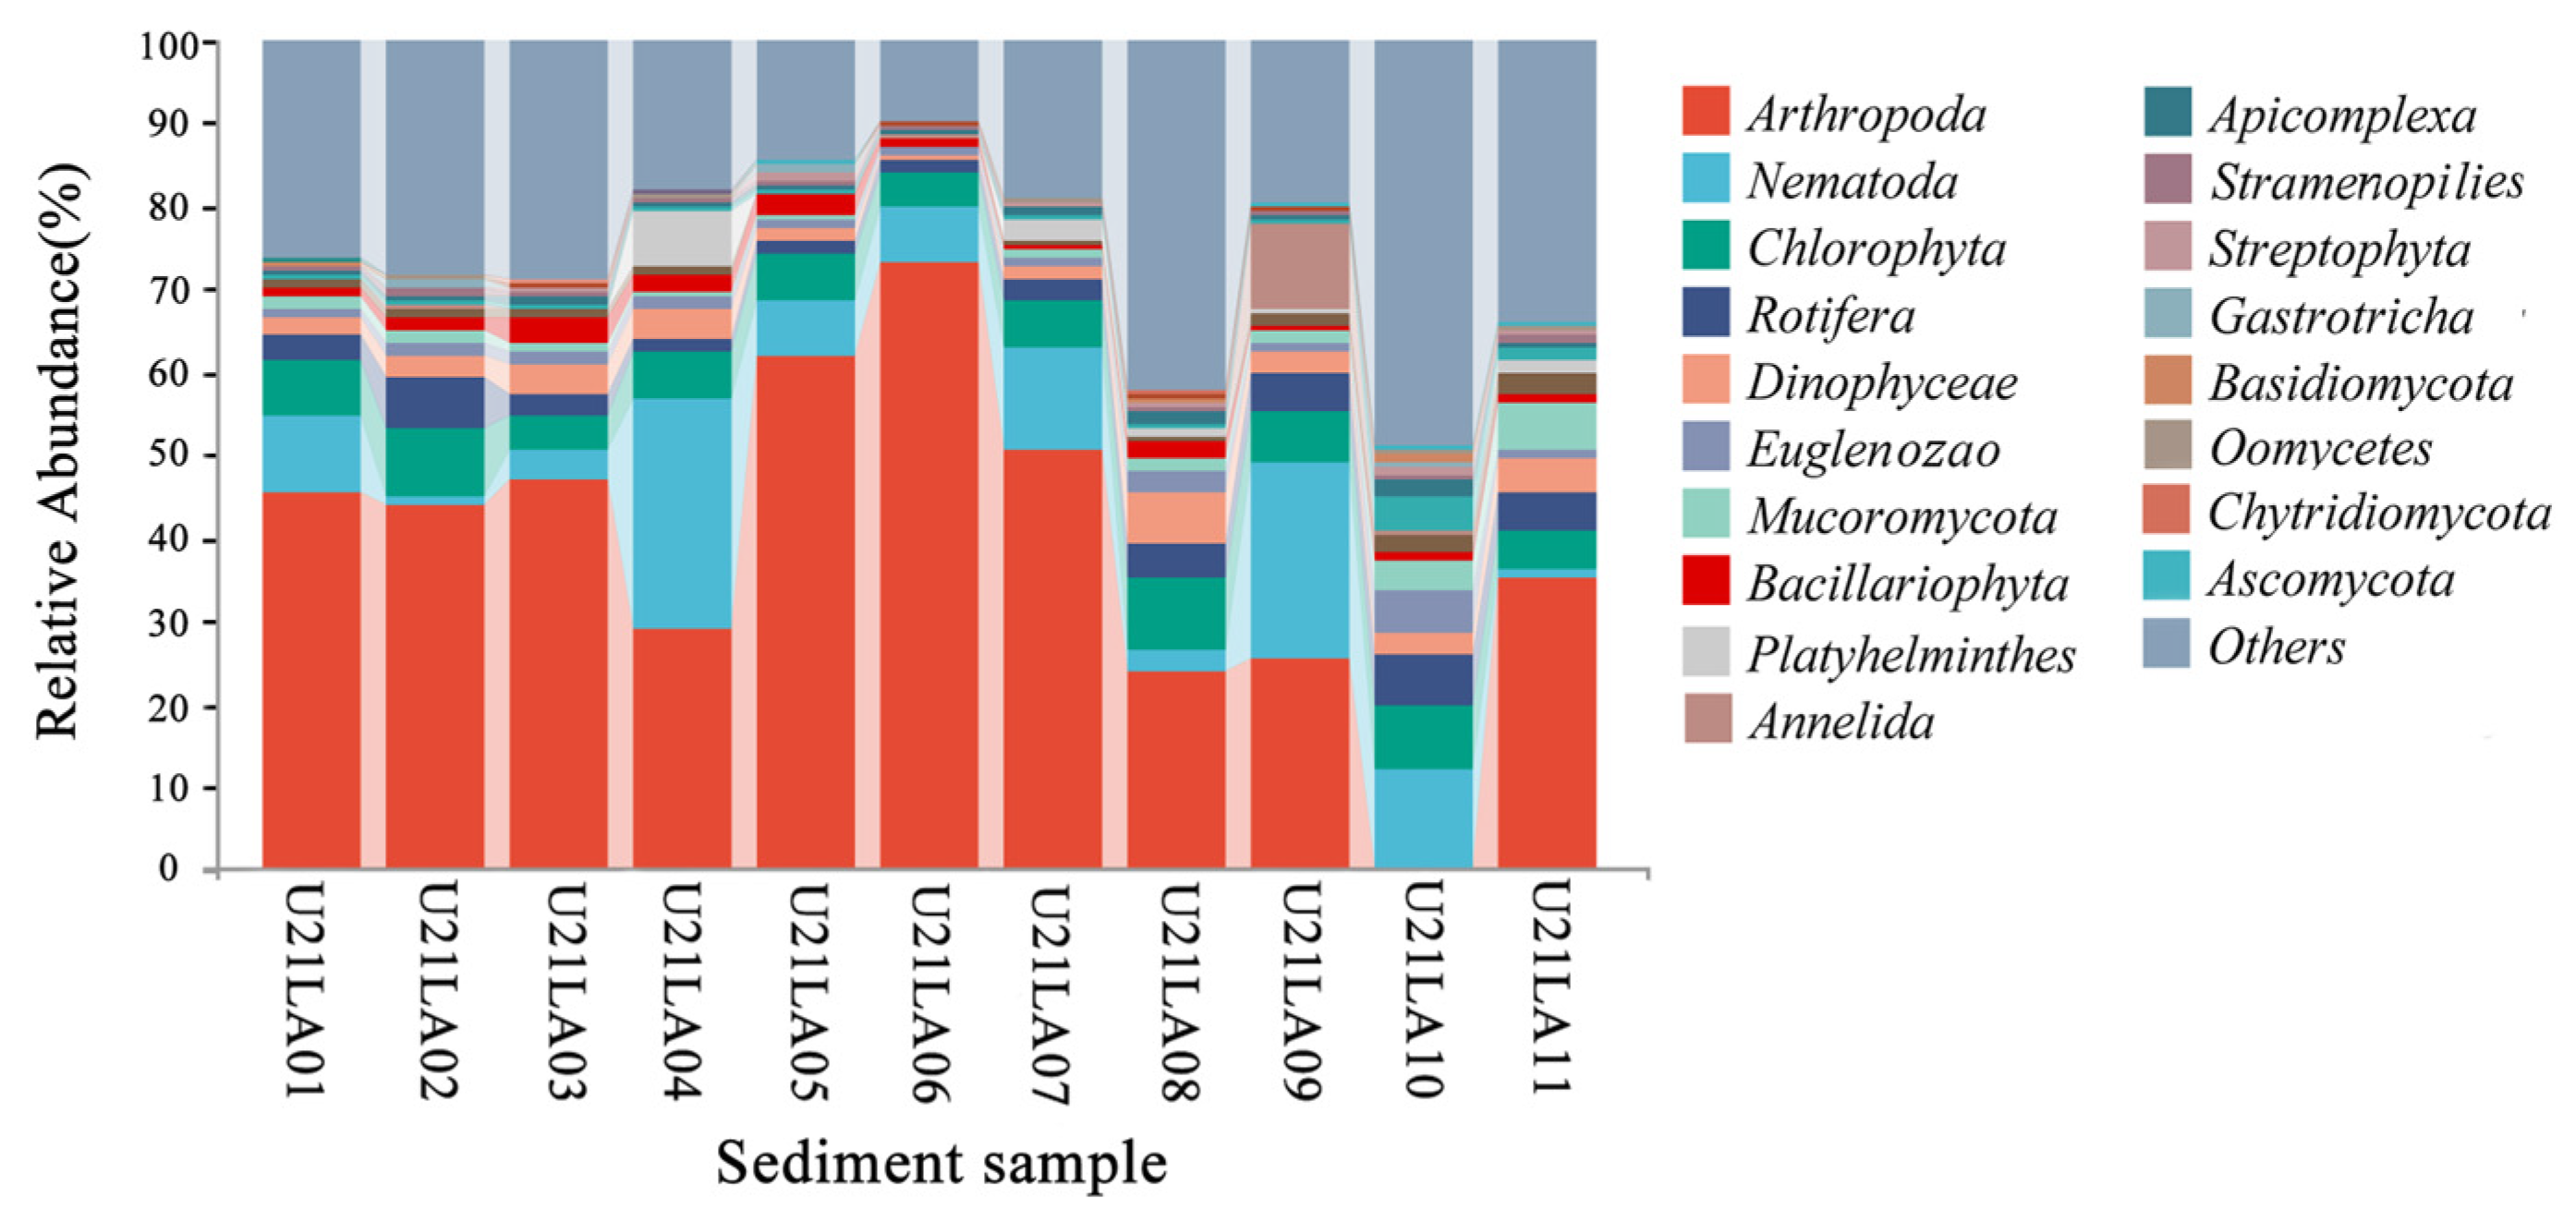
3.1.2. Benthic Species Composition

A total of 1,397,261 high-quality sequences were obtained from S-eDNA samples. A total of 188 benthic taxa were detected by the 18S rRNA gene, belonging to 144 genera, 100 families, 64 orders, 44 classes, 27 phyla, and 1 domain (Supplementary Material Table S1). Due to the large number of species, the result sorted out dominant species detected by 18S V9 at the top 18 phylum across different stations (Figure 3). The detection frequency of Arthropoda, Nematoda, Chlorophyta, Rotifera, and Dinophyceae were higher than those of other species.

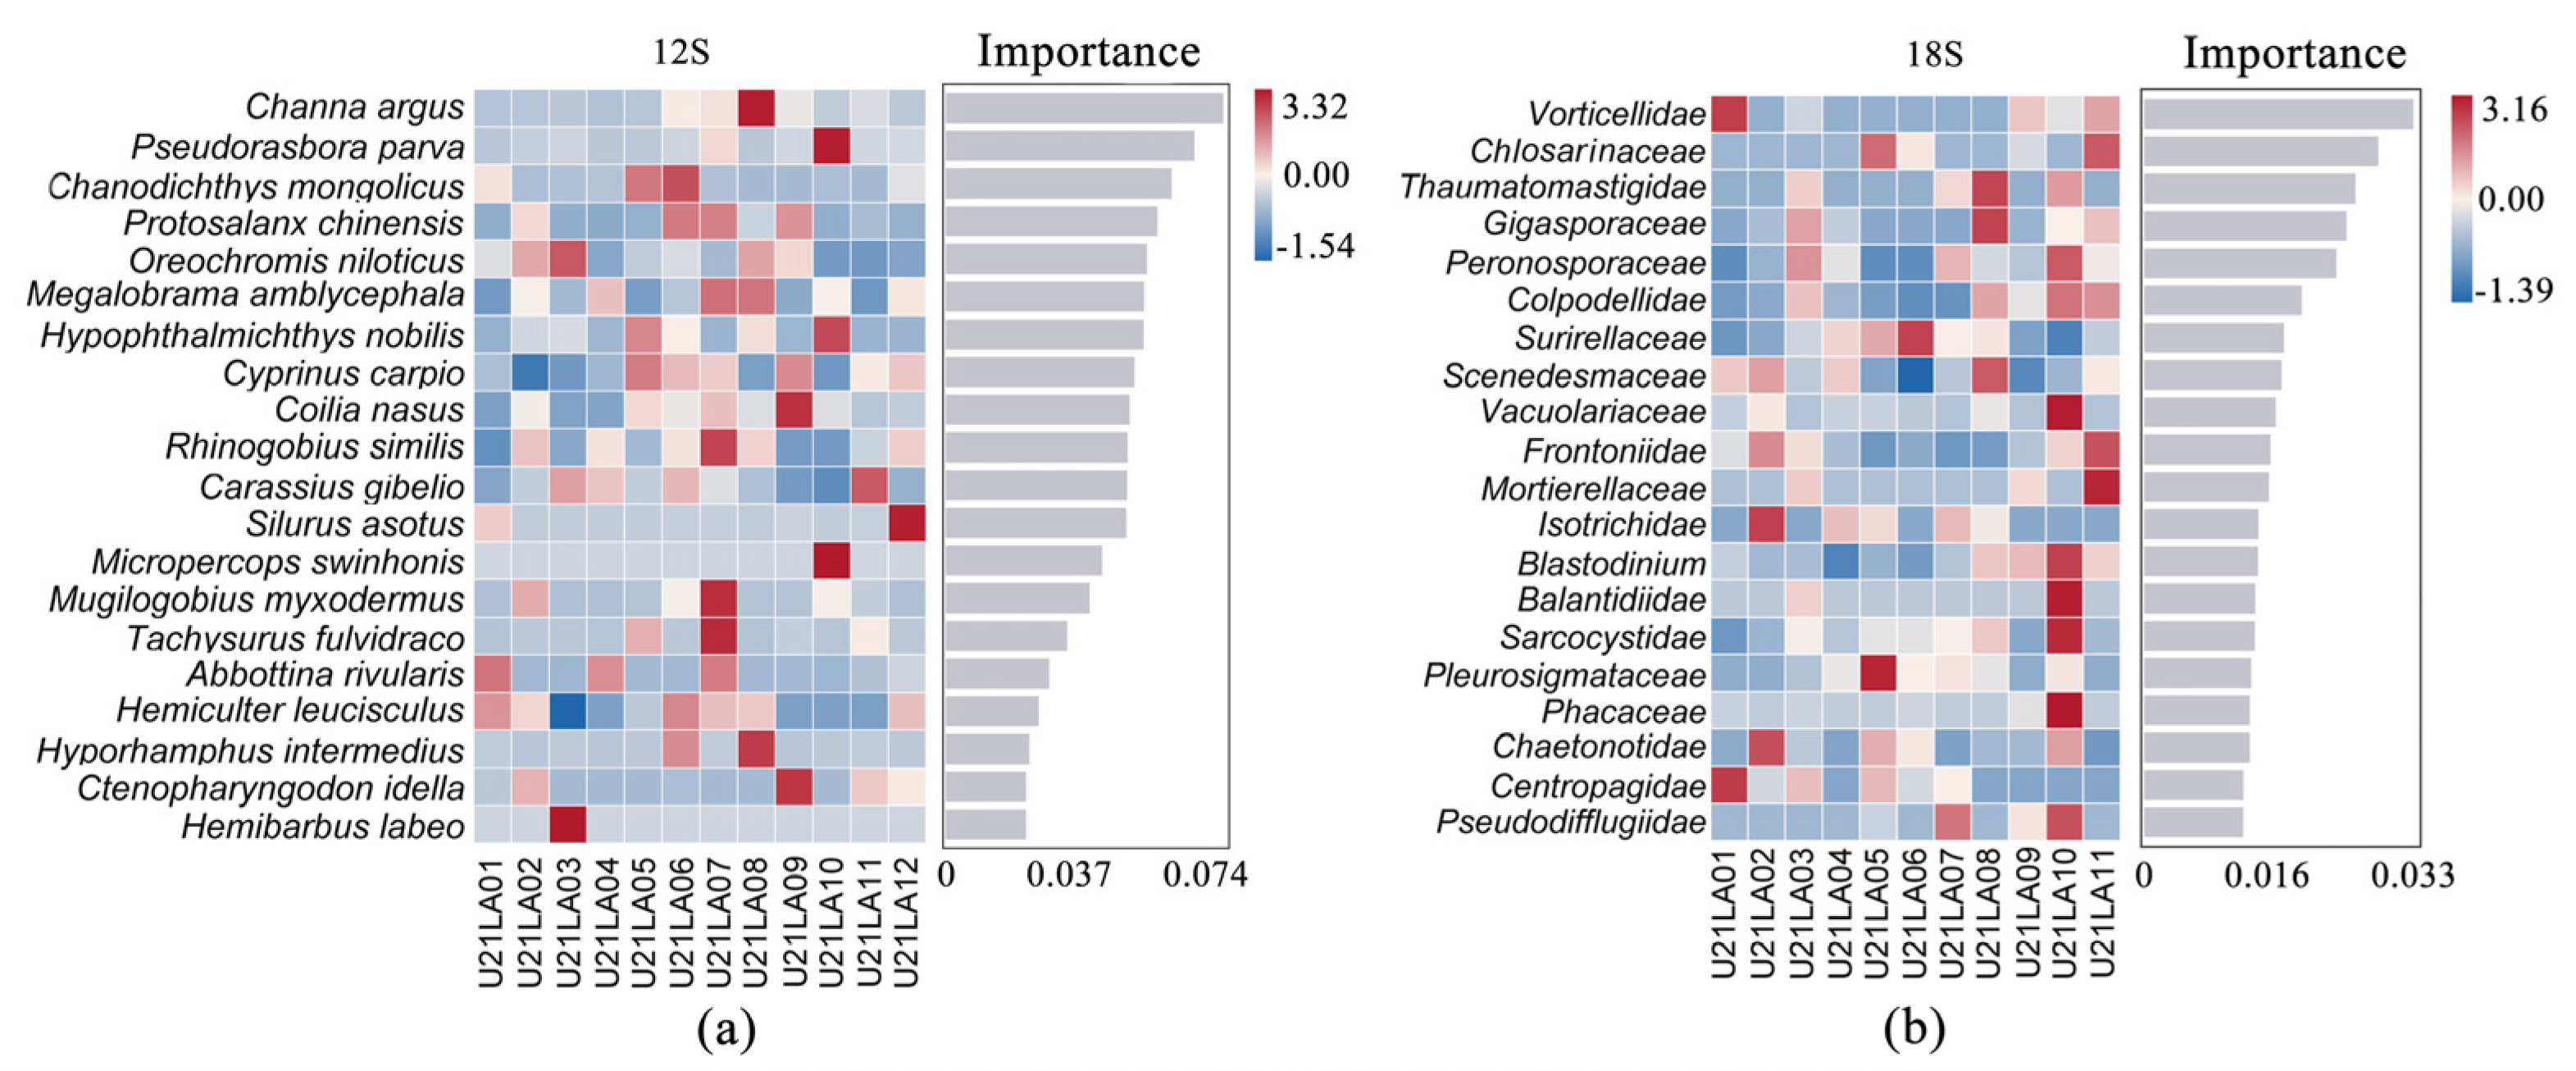
3.1.3. Biomarker Identification

The random forest heat map showed the abundance distribution of these species across the sample. The importance of species to the model decreases from top to bottom. These most important species (top 20 in abundance) can be considered as markers of differences between samples (Figure 4). The important fish identified by W-eDNA in the 2021 spring survey of Shuimen Pond were Snakehead Channa argus, Stone moroko Pseudorasbora parva, Mongolian redfin Chanodichthys mongolicus (Figure 4a). The important benthic taxa identified by S-eDNA at the family level were Vorticellidae, Chlorosarcinaceae, Thaumatomastigidae, Gigasporaceae, and Peronosporaceae (Figure 4b).

3.2. Diversity Analysis

In beta diversity cluster analysis, hierarchical clustering was used to show the similarity between samples in the form of a hierarchical tree. The longer the branch length between the samples, the greater the difference between the two samples, and conversely, the shorter the more similar (Figure 5). According to the distance of the sampling station, the W-eDNA samples and S-eDNA samples were divided into four groups and three groups, respectively, for better display. Due to the large number of annotations of species, all taxa were selected for display based on the top 20 species level.
The results of W-eDNA sample identification showed that the fish composition of U21LA06 and U21LA07, U21LA10 and U21LA04, U21LA12 and U21LA01, U21LA08, and U21LA02 were similar. In addition, the fish composition of U21LA09 was different from that of other sampling sites. The results found that Sharpbelly Hemiculter leucisculus, Common carp Cyprinus carpio, and Prussian carp Carassius gibelio were detected at almost every station, which showed the highest species abundance. The highest number of Amur catfish Silurus asotus was detected at U21LA12, followed by U21LA01. The highest amount of Stone moroko Pseudorasbora parva was detected at U21LA10. The eDNA monitoring showed that fish diversity did not become more similar to the adjacent sampling range (Figure 5a).
For S-eDNA benthic species data, the analysis results of different diversity also showed that the species composition of U21LA05, U21LA06, and U21LA07 were similar. In contrast, U21LA10 and U21LA08 were significantly different from the other stations (Figure 5b). Eumonhystera filiformis showed the highest species diversity in U21LA01, U21LA04, U21LA05, and U21LA06. The highest number of Eumonhystera filiformis was detected at U21LA01, U21LA04, U21LA05, and U21LA06. A large number of Limnodrilus hoffmeisteri were detected at U21LA09. The highest number of Tetracystis pampae was detected at U21LA10, followed by U21LA08. The species clusters detected by the S-eDNA assay development showed relatively high diversity and various sampling stations of benthic taxa were widely distributed in this study area.

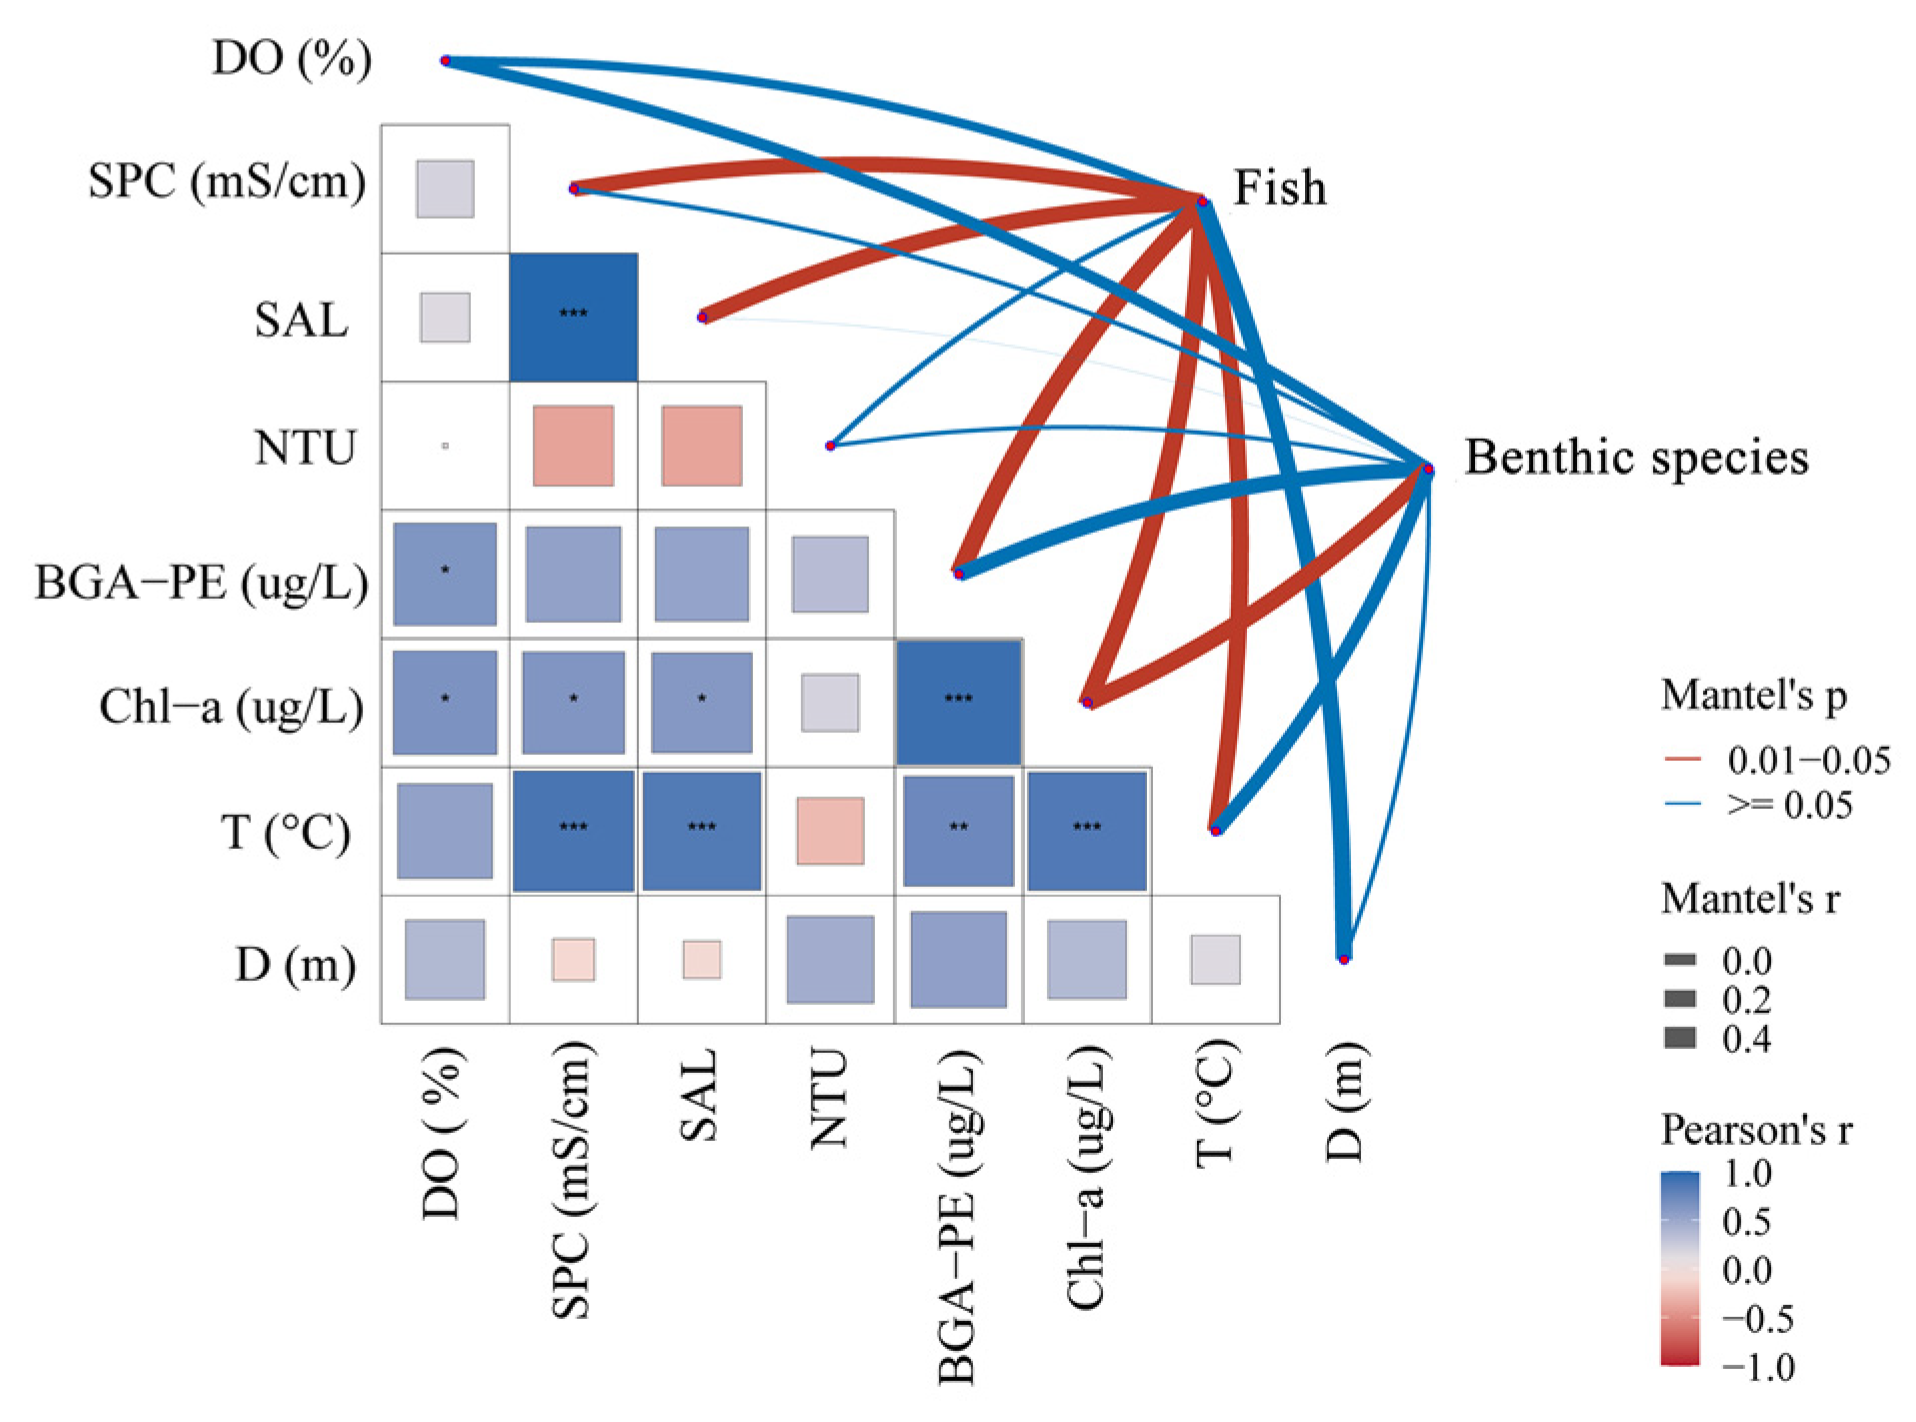
3.3. Environmental Factor Influence

The Mantel test correlation heat diagram conducted in this study revealed significant predictions of the influence of environmental variables on the species community in Shuimen Pond. The detailed environmental factor parameters of each station are shown in Table S2. The correlation between environmental factors and the distribution of different species was inconsistent. The heat diagrams showed that among the tested environmental factors (T, SAL, D, DO, PE, NTU, SPC, and Chl-a), T, S, and Chl-a showed a significantly positive effect, while NTU showed a negative correlation with other environmental factors. Across the network diagram, the T, SAL, SPC, BGA-PE, and Chl-a were the key factors affecting fish community composition in Shuimen Pond, and Chl-a had the same effect on the benthic species (0.05 > p > 0.01). In addition, DO, BGA-PE, and T also had a strong correlation with benthic species composition. However, NTU did not show a significant effect on the two groups, and the water depth had no effect on the benthic species community (Figure 6).

4. Discussion

4.1. eDNA Assessment for Surveying Biodiversity in Shuimen Pond

Assessment and monitoring of aquatic ecosystems is becoming increasingly important to inform fisheries management strategies [45]. A full understanding of the status of biological resources provides an effective guarantee for the development of freshwater aquaculture [46]. eDNA techniques have been shown to have great potential in identifying community composition in freshwater regions [12]. Invertebrates, as important indicator species of ecosystem processes, have been widely applied to assess the environmental impacts associated with human activities [47]. Especially benthic invertebrates because of their small size and special living environment, it is difficult to survey them by traditional methods (e.g., visual census and microscopic analysis) [48]. In contrast, eDNA techniques based on high-throughput sequencing hold great potential to identify taxa.
In this study, we successfully used eDNA to assess species diversity in different stations of Shuimen Pond, Anhui Province. The samples we used are essential elements of aquatic ecosystems (the water phase and the sediment), which are sources of survival and important transport mechanisms for aquatic organisms, and thus can be used as media for monitoring aquatic biodiversity. In fact, many studies have shown sediment samples can be used to monitor biological and benthic environmental health [49,50]. In addition, another study demonstrated that eDNA extracted from archived suspended particulate matter (SPM) samples can be used for identifying fish species using metabarcoding of the 12S rRNA gene [19,51]. Our results demonstrated that eDNA techniques can be used to assess fish and benthic species status in freshwater ponds and this was the first time to monitor the resource status of Shuimen Pond. Our survey results have successfully established an eDNA system that provides guidance for subsequent investigations of Shuimen Pond.
In addition, eDNA techniques use DNA fragments as a proxy for the presence of organisms, so false positive pollution is also a problem at present, resulting from differences in eDNA shedding among taxa and experimental operation [24,52]. Therefore, late verification of eDNA surveys is very important, and an accurate database will make the technology more scientific. In this study, we compared and verified these eDNA monitoring data of Shuimen Pond by referring to the relevant literature [53]. The fish were all common species in the local area. For benthic taxa, because it is a complex ecological group, the species it includes and their lifestyle are much more complex than fish. At present, the relevant database is not perfect enough, and our monitoring results can only be used as a methodological attempt and reference. In addition, for more accurate biodiversity monitoring, the ecological properties of the complex and dynamic environments from which eDNA is sampled need to be considered in the future [18].

4.2. Population Specific Primer Selection

Species-specific primers or universal primers for taxonomic groups of interest can be applied to elucidate the compositions of species [54]. Species identity can be assigned to each unique sequence by comparing those sequences with sequences in a reference database, and the species community composition of the sampled system can be resolved [55]. More species information can be obtained through universal primers, and many studies have used the eDNA technique to capture multi-group species information. They are also superior in terms of survey efficiency and labor and cost-effectiveness in a wide range of aquatic environments [56,57]. Multiple barcodes to recover biodiversity across all taxa were very effective; both compositional structures within ecological assemblages and population dynamics across space and time can be constructed [57]. Therefore, the selection of the most suitable primer for this study’s area of interest can make the monitoring work more efficient. Studies have shown that the 12S rRNA gene has been successfully used several times to identify fish [24,27]. In this study, eDNA survey results suggested that the 12S primer sets can amplify fish samples, which demonstrated the applicability and effectiveness of the primer sets for this application.
The 18S rRNA gene was commonly used as a marker to explore the community composition of benthic taxa [58]. Different phyla of eukaryotes were detected, which further confirms the wide versatility of the cited 18S primer set, including protists, fungi, plants, and animals. The metabarcoding analysis conducted in the present study showed that most unassigned ASVs belong to under-represented phyla. In general, the benthic taxa were common, mostly rotifers, they are the main food source for many economically important fish [59]. In addition, the detection frequency of plankton algae and fungi was higher than other taxa. Invertebrates with higher trophic levels, such as arthropods and mollusks, showed few or no results. Moreover, some of the taxa monitored were exclusively species present in the ocean, such as the sea-spider Austropallene cornigera. This may be related to the limitation of the primer set, while it does not rule out that there are hidden dangers in the water environment of Shuimen Pond. Therefore, future investigations of benthic organisms can be more refined and precise; for example, specific primers will be used to monitor benthic invertebrates.

4.3. Dominant Species Assemblage and Diversity in Shuimen Pond

Fish species based on eDNA detected were diverse in the Shuimen Pond. The eDNA technique detected fish with higher signals that were also common species in Shuimen Pond, such as Common carp Cyprinus carpio, Bighead carp Hypophthalmichthys nobilis, and Snakehead Channa argus, which are also common local economic fish. Notably, among the species monitored by the eDNA techniques in this study, marine fish species Large yellow croaker Larimichthys crocea and Japanese Grenadier Anchovy Coilia nasus were detected in the pond area near the living quarters. Since they are also common food fishes, we speculated this might be the false positive pollution from domestic wastewater.
A clustering tree was used to show species classification composition differences; our study analyzed both taxonomic differences in fish composition within species (Figure 2) and differences in sample composition (Figure 5). The taxonomic composition of fish species varied greatly (Figure 2). This study also revealed some particularities in the composition of fish species at each sampling site, such as the highest number of Amur catfish Silurus asotus was detected at U21LA12, followed by U21LA01 (Figure 5). The results of eDNA monitoring revealed the difference in fish composition at different plate stations, which may be related to environmental factors in different regions and the degree of human intervention [22,55]. Protecting and maintaining the living environment of fish is of great significance to maintaining the ecological balance of waters.
For the eDNA-based monitoring of benthic taxa composition, we aggregated statistics at different taxonomic levels to quickly grasp species information. Because the aim of our study was to survey regional benthic species composition based on S-eDNA monitoring, and the benthic taxa are highly diverse, we have refrained from analyzing individual ASVs in detail but instead considered taxonomic level composition. We observed large differences in compositional diversity between the same phyla, which may be caused by differences in the intensity or effect of feeding by organisms such as fish [59]. Based on the above findings, our ecological monitoring is particularly important, and these preliminary results further emphasize the importance of biodiversity monitoring in Shuimen Pond.

4.4. Relationship between Species Community and Environmental Factors

Environmental factors have a great influence on species community variations, and the mutual restriction between environmental factors will also produce different effects [60]. Variations in pond size, geographic position, and structure have a profound effect on species composition and eDNA persistence; therefore, estimating the impact of environmental factors could be useful for species conservation and resource development [61]. According to research, water eutrophication caused by excessive organic matter input has become a typical characteristic of freshwater ecosystem degradation, especially in the closed freshwater ecosystems represented by lakes [62]. Aquatic ecosystems are being threatened by a variety of environmental stressors, causing dramatic losses of biodiversity [17]. Therefore, a detailed analysis of the relationship between the differences of different taxa and environmental factors can further understand the ecological environment status of the whole water area of Shuimen Pond.
In fact, in freshwater ecosystems, each environmental factor does not function independently but is always associated with other environmental factors to affect species composition [62]. Here, correlation analysis showed that temperature was positively correlated with other factors, while turbidity was negatively correlated with other factors (Figure 6). Any species lives within a strict temperature range, and changes in temperature directly or indirectly affect species community structure. In addition, the temperature may also correlate with eDNA release and degradation. Higher water temperature can promote the metabolism and activities of fish to release DNA, thus influencing the detected fish communities [63].
The spatial pattern of a fish community is affected not only by its own living habits but also by the spatial heterogeneity of environmental factors [64]. Our study showed that SAL, T, and Chl-a had a strong positive effect on Shuimen Pond’s fish communities (Figure 6). These factors have a certain impact on the feeding and growth of fish and also affect the physiological processes of fish metabolism and respiration [65]. Other studies also found that SAL, BGA-PE, and Chl-a have an impact on the composition of fish communities [11,66]. In fact, the overall temperature and salinity environmental factors of the Shuimen Pond have a small variation range (Table S2), so these results need long-term verification and monitoring. In addition, this study showed that NTU is negatively correlated with fish communities, which may be due to its direct effect on fish feeding physiology [65]. Thus, more monitoring management should be performed to maintain the water environment quality of Shuimen Pond.
Additionally, the result showed that the key environmental factor of benthic species communities was Chl-a (Figure 6); this is probably explained by the high proportion of the species list that themselves contain Chl-a, such as Bacillariophyta and Chlorophyta. Shuimen Pond covers a number of islands with lush vegetation and a wide variety of aquatic plants, providing excellent habitats such as shelter, breeding, and habitat for benthic species, which also creates a typical high Chl-a environment. Therefore, aquatic plants provide a sanctuary for invertebrates and directly affect the total number of benthic species [67]. In addition, chlorophyll and algae in water are one of the food sources of benthic species, so they may directly affect the number and biomass of some benthic species [68]. Conducted species detection was performed using the collected sediment samples, which may be the reason why turbidity does not have a high effect on the composition of the monitored benthic species. It is still necessary to improve and strengthen the exploration and research on the relationship between environmental factors and species community structure in the future.

5. Conclusions

In summary, 42 fish taxa were detected from water samples, and 188 benthic taxa were detected from sediment samples using eDNA techniques. The dominant fish species were Snakehead Channa argus, Stone moroko Pseudorasbora parva, and Mongolian redfin Chanodichthys mongolicus; the dominant benthic taxa were Arthropoda, Nematoda, and Chlorophyta. The diversity analysis revealed that the difference of species composition was different in different pond areas. T, SAL, SPC, BGA-PE, and Chl-a were the key factors affecting fish community composition; DO, BGA-PE, and T had a strong correlation with benthic species composition. Our study revealed the application of eDNA techniques to enable rapid monitoring of fish and benthic species communities. This study provided the first eDNA-based report of the composition of aquatic biological resources in Shuimen Pond. The monitoring results will provide a key scientific basis for the conservation of local biodiversity and the sustainable development and utilization of resources.

Supplementary Materials

The following supporting information can be downloaded at: https://www.mdpi.com/article/10.3390/fishes9100396/s1, Table S1: 18S sequencing statistics, Table S2: Environmental factor parameters of each station.

Author Contributions

Conceptualization, H.J., M.X. and H.Z.; methodology, H.J. and H.Z.; software, H.J.; validation, T.Z. and H.Z.; formal analysis, H.J. and M.X.; investigation, H.J.; resources, T.Z. and H.Z.; data curation, H.Z.; writing—original draft preparation, H.J. and M.X.; writing—review and editing, H.J.; T.Z. and H.Z.; visualization, H.J. and M.X.; supervision, H.Z.; project administration, H.Z. All authors have read and agreed to the published version of the manuscript.

Funding

This work is supported by the National Key Research and Development Program (No. 2023YFD2401104), the Taishan Scholars Program, and the Youth Innovation Promotion Association Chinese Academy of Sciences (No. 2020211).

Institutional Review Board Statement

This study did not involve animal subjects, and thus, no ethical approval was required.

Informed Consent Statement

Not applicable.

Data Availability Statement

The original data file for the article will be accessible with the following link after the indicated release date: https://www.ncbi.nlm.nih.gov/sra/PRJNA1086692, accessed on 12 April 2024.

Acknowledgments

We are grateful to the local authorities and crew for their assistance in collecting eDNA samples during the research investigation. The present work was supported by the Hefei Institutes of Physical Science, Chinese Academy of Sciences. We thank all staff and students involved in the field and laboratory work.

Conflicts of Interest

The authors declare no conflicts of interest.

References

  1. Desrosiers, M.; Usseglio-Polatera, P.; Archaimbault, V.; Larras, F.; Méthot, G.; Pinel-Alloul, B. Assessing anthropogenic pressure in the St. Lawrence River using traits of benthic macroinvertebrates. Sci. Total Environ. 2019, 649, 233–246. [Google Scholar] [CrossRef] [PubMed]
  2. Wu, D.; Liu, H.; Wu, J.; Gao, X. Spatial distribution, ecological risk assessment and source analysis of heavy metals pollution in urban lake sediments of Huaihe river basin. Int. J. Environ. Res. Public Health 2022, 19, 14653. [Google Scholar] [CrossRef] [PubMed]
  3. Osathanunkul, M. An eDNA detection of captive-bred Mekong Giant Catfish in the Chao Phraya River basin for further environmental impacts assessment. Aquaculture 2022, 564, 737328. [Google Scholar] [CrossRef]
  4. Mwaijengo, G.N.; Vanschoenwinkel, B.; Dube, T.; Njau, K.N.; Brendonck, L. Seasonal variation in benthic macroinvertebrate assemblages and water quality in an afrotropical river catchment, northeastern Tanzania. Limnologica 2020, 82, 125780. [Google Scholar] [CrossRef]
  5. Wang, Y.; Chen, K.; Gao, J.; Wang, M.; Dong, J.; Xie, Y.W.; Giesy, J.P.; Jin, X.W.; Wang, B.X. Environmental DNA of preservative ethanol performed better than water samples in detecting macroinvertebrate diversity using metabarcoding. Divers. Distrib. 2021, 27, 1989–2002. [Google Scholar] [CrossRef]
  6. Minamoto, T.; Hayami, K.; Sakata, M.K.; Imamura, A. Real-time polymerase chain reaction assays for environmental DNA detection of three salmonid fish in Hokkaido, Japan: Application to winter surveys. Ecol. Res. 2019, 34, 237–242. [Google Scholar] [CrossRef]
  7. Takahashi, M.; Saccò, M.; Kestel, J.H.; Nester, G.; Campbell, M.A.; van der Heyde, M.; Heydenrych, M.J.; Juszkiewicz, D.J.; Nevill, P.; Dawkins, K.L.; et al. Aquatic environmental DNA: A review of the macro-organismal biomonitoring revolution. Sci. Total Environ. 2023, 873, 162322. [Google Scholar] [CrossRef]
  8. Maurer, D. The dark side of taxonomic sufficiency. Mar. Pollut. Bull. 2000, 40, 98–101. [Google Scholar] [CrossRef]
  9. Bush, A.; Monk, W.A.; Compson, Z.G.; Peters, D.L.; Porter, T.M.; Shokralla, S.; Wright, M.T.G.; Hajibabaei, M.; Baird, D.J. DNA metabarcoding reveals metacommunity dynamics in a threatened boreal wetland wilderness. Proc. Natl. Acad. Sci. USA 2020, 117, 8539–8545. [Google Scholar] [CrossRef]
  10. Thomsen, P.F.; Møller, P.R.; Sigsgaard, E.E.; Knudsen, S.W.; Jørgensen, O.A.; Willerslev, E. Environmental DNA from seawater samples correlate with trawl catches of subarctic, deepwater fishes. PLoS ONE 2016, 11, e0165252. [Google Scholar] [CrossRef] [PubMed]
  11. Zhang, H.; Yoshizawa, S.; Iwasaki, W.; Xian, W.W. Seasonal fish assemblage structure using environmental DNA in the Yangtze Estuary and its adjacent waters. Front. Mar. Sci. 2019, 6, 515. [Google Scholar] [CrossRef]
  12. Boivin-Delisle, D.; Laporte, M.; Burton, F.; Dion, R.; Normandeau, E.; Bernatchez, L. Using environmental DNA for biomonitoring of freshwater fish communities: Comparison with established gillnet surveys in a boreal hydroelectric impoundment. Environ. DNA 2021, 3, 105–120. [Google Scholar] [CrossRef]
  13. Li, H.; Yang, F.; Zhang, R.; Liu, S.G.; Yang, Z.J.; Lin, L.S.; Ye, S.Z. Environmental DNA metabarcoding of fish communities in a small hydropower dam reservoir: A comparison between the eDNA approach and established fishing methods. J. Freshw. Ecol. 2022, 37, 337–358. [Google Scholar] [CrossRef]
  14. Carraro, L.; Hartikainen, H.; Jokela, J.; Bertuzzo, E.; Rinaldo, A. Estimating species distribution and abundance in river networks using environmental DNA. Proc. Natl. Acad. Sci. USA 2018, 115, 11724–11729. [Google Scholar] [CrossRef] [PubMed]
  15. Malashenkov, D.V.; Dashkova, V.; Zhakupova, K.; Vorobjev, I.A.; Barteneva, N.S. Comparative analysis of freshwater phytoplankton communities in two lakes of Burabay National Park using morphological and molecular approaches. Sci. Rep. 2021, 11, 16130. [Google Scholar] [CrossRef] [PubMed]
  16. Doi, H.; Inui, R.; Akamatsu, Y.; Kanno, K.; Yamanaka, H.; Takahara, T.; Minamoto, T. Environmental DNA analysis for estimating the abundance and biomass of stream fish. Freshw. Biol. 2017, 62, 30–39. [Google Scholar] [CrossRef]
  17. Cilleros, K.; Valentini, A.; Allard, L.; Dejean, T.; Etienne, R.; Grenouillet, G.; Iribar, A.; Taberlet, P.; Vigouroux, R.; Brosse, S. Unlocking biodiversity and conservation studies in high-diversity environments using environmental DNA (eDNA): A test with Guianese freshwater fishes. Mol. Ecol. Resour. 2019, 19, 27–46. [Google Scholar] [CrossRef] [PubMed]
  18. Harrison, J.B.; Sunday, J.M.; Rogers, S.M. Predicting the fate of eDNA in the environment and implications for studying biodiversity. Proc. R. Soc. B 2019, 286, 20191409. [Google Scholar] [CrossRef] [PubMed]
  19. Díaz, C.; Wege, F.F.; Tang, C.Q.; Crampton-Platt, A.; Rüdel, H.; Eilebrecht, E.; Koschorreck, J. Aquatic suspended particulate matter as source of eDNA for fish metabarcoding. Sci. Rep. 2020, 10, 14352. [Google Scholar] [CrossRef]
  20. Jarzyna, M.A.; Jetz, W. Detecting the multiple facets of biodiversity. Trends Ecol. Evol. 2016, 31, 527–538. [Google Scholar] [CrossRef] [PubMed]
  21. Osathanunkul, M.; Minamoto, T. A molecular survey based on eDNA to assess the presence of a clown featherback (Chitala ornata) in a confined environment. PeerJ 2020, 8, e10338. [Google Scholar] [CrossRef] [PubMed]
  22. Jiao, R.J.; Huang, Y.B.; Zhou, H.Y.; Liu, J.; Wang, S. Bird diversity and its seasonal dynamic in Shuimentang national water resources scenic area, Anhui province, China. J. Jinggangshan Univ. 2018, 39, 99–105. (In Chinese) [Google Scholar]
  23. Lor, Y.; Schreier, T.M.; Waller, D.L.; Merkes, C.M. Using environmental DNA (eDNA) to detect the endangered Spectaclecase mussel (Margaritifera monodonta). Freshw. Sci. 2020, 39, 837–847. [Google Scholar] [CrossRef]
  24. Jia, H.; Zhang, H.; Xian, W.W. Fish Diversity Monitored by Environmental DNA in the Yangtze River mainstream. Fishes 2022, 7, 1. [Google Scholar] [CrossRef]
  25. Yamamoto, S.; Masuda, R.; Sato, Y.; Sado, T.; Araki, H.; Kondoh, M.; Minamoto, T.; Miya, M. Environmental DNA metabarcoding reveals local fish communities in a species-rich coastal sea. Sci. Rep. 2017, 7, 40368. [Google Scholar] [CrossRef]
  26. Robert, S.H. The southern boundary of the Palaearctic realm in China and adjacent countries. Acta Zool. Sin. 2001, 47, 121–131. [Google Scholar]
  27. Miya, M.; Sato, Y.; Fukunaga, T.; Sado, T.; Poulsen, J.Y.; Sato, K.; Minamoto, T.; Yamamoto, S.; Yamanaka, H.; Araki, H.; et al. MiFish, a set of universal PCR primers for metabarcoding environmental DNA from fishes: Detection of more than 230 subtropical marine species. R. Soc. Open Sci. 2015, 2, 150088. [Google Scholar] [CrossRef] [PubMed]
  28. Amaral-Zettler, L.A.; McCliment, E.A.; Ducklow, H.W.; Huse, S.M. A method for studying protistan diversity using massively parallel sequencing of V9 hypervariable regions of small-subunit ribosomal RNA genes. PLoS ONE 2009, 4, e6372. [Google Scholar] [CrossRef]
  29. Bolyen, E.; Rideout, J.R.; Dillon, M.R.; Bokulich, N.A.; Abnet, C.C.; Al-Ghalith, G.A.; Alexander, H.; Alm, E.J.; Arumugam, M.; Asnicar, F.; et al. Reproducible, interactive, scalable, and extensible microbiome data science using QIIME 2. Nat. Biotechnol. 2019, 37, 852–857. [Google Scholar] [CrossRef] [PubMed]
  30. Martin, M. Cutadapt removes adapter sequences from high-throughput sequencing reads. EMBnet. J. 2011, 17, 10–12. [Google Scholar] [CrossRef]
  31. Callahan, B.J.; Mcmurdie, P.J.; Rosen, M.J.; Han, A.W.; Johnson, A.J.A.; Holmes, S.P. Dada2: High-resolution sample inference from illumina amplicon data. Nat. Methods 2016, 13, 581–583. [Google Scholar] [CrossRef] [PubMed]
  32. Katoh, K.; Misawa, K.; Kuma, K.; Miyata, T. MAFFT: A novel method for rapid multiple sequence alignment based on fast Fourier transform. Nucleic Acids Res. 2002, 30, 3059–3066. [Google Scholar] [CrossRef] [PubMed]
  33. Price, M.N.; Dehal, P.S.; Arkin, A.P. FastTree 2-approximately maximum-likelihood trees for large alignments. PLoS ONE 2010, 5, e9490. [Google Scholar] [CrossRef] [PubMed]
  34. Bokulich, N.A.; Kaehler, B.D.; Rideout, J.R.; Dillon, M.; Bolyen, E.; Knight, R.; Huttley, G.A.; Caporaso, J.G. Optimizing taxonomic classification of marker-gene amplicon sequences with QIIME 2′s q2-feature-classifier plugin. Microbiome 2018, 6, 90. [Google Scholar] [CrossRef] [PubMed]
  35. Camacho, C.; Coulouris, G.; Avagyan, V.; Ma, N.; Papadopoulos, J.; Bealer, K.; Madden, T.L. BLAST+: Architecture and applications. BMC Bioinf. 2009, 10, 421. [Google Scholar] [CrossRef] [PubMed]
  36. Zhang, J.; Zhang, N.; Liu, Y.X.; Zhang, X.N.; Hu, B.; Qin, Y.; Xu, H.R.; Wang, H.; Guo, X.X.; Qian, J.M.; et al. Root microbiota shift in rice correlates with resident time in the field and developmental stage. Sci. China Life Sci. 2018, 61, 613–621. [Google Scholar] [CrossRef] [PubMed]
  37. Breiman, L. Random forests. Mach. Learn. 2001, 45, 5–32. [Google Scholar] [CrossRef]
  38. Yatsunenko, T.; Rey, F.E.; Manary, M.J.; Trehan, I.; Dominguez-Bello, M.G.; Contreras, M.; Magris, M.; Hidalgo, G.; Baldassano, R.N.; Anokhin, A.P.; et al. Human gut microbiome viewed across age and geography. Nature 2012, 486, 222–227. [Google Scholar] [CrossRef] [PubMed]
  39. Liaw, A.; Wiener, M. Classification and regression by random forest. R News 2002, 2, 18–22. [Google Scholar]
  40. Whittaker, R.H. Vegetation of the Siskiyou mountains, Oregon and California. Ecol. Monogr. 1960, 30, 279–338. [Google Scholar] [CrossRef]
  41. Whittaker, R.H. Evolution and measurement of species diversity. Taxon 1972, 21, 213–251. [Google Scholar] [CrossRef]
  42. Jia, H.; Ji, D.P.; Zhang, L.B.; Zhang, T.; Xian, W.W.; Zhang, H. Application of environmental DNA technology in marine ranching-case study of Bailong Pearl Bay Demonstration area in Beibu Gulf. Ecol. Indic. 2023, 154, 110906. [Google Scholar] [CrossRef]
  43. R Core Team. A Language and Environment for Statistical Computing; R Foundation for Statistical Computing: Vienna, Austria, 2016. [Google Scholar]
  44. Sunagawa, S.; Coelho, L.P.; Chaffron, S.; Kultima, J.R.; Labadie, K.; Salazar, G.; Djahanschiri, B.; Zeller, G.; Mende, D.R.; Alberti, A.; et al. Structure and function of the global ocean microbiome. Science 2015, 348, 1261359. [Google Scholar] [CrossRef] [PubMed]
  45. Reiss, M.; Martin, P.; Gerecke, R.; von Fumetti, S. Limno-ecological characteristics and distribution patterns of spring habitats and invertebrates from the Lowlands to the Alps. Environ. Earth Sci. 2016, 75, 1033. [Google Scholar] [CrossRef]
  46. Laporte, M.; Berger, C.S.; García-Machado, E.; Côté, G.; Morissette, O.; Bernatchez, L. Cage transplant experiment shows weak transport effect on relative abundance of fish community composition as revealed by eDNA metabarcoding. Ecol. Indic. 2022, 137, 108785. [Google Scholar] [CrossRef]
  47. Keeley, N.B.; Forrest, B.M.; Crawford, C.; Macleod, C.K. Exploiting salmon farm benthic enrichment gradients to evaluate the regional performance of biotic indices and environmental indicators. Ecol. Indic. 2012, 23, 453–466. [Google Scholar] [CrossRef]
  48. Ji, F.F.; Han, D.Y.; Yan, L.; Yan, S.H.; Zha, J.M.; Shen, J.Z. Assessment of benthic invertebrate diversity and river ecological status along an urbanized gradient using environmental DNA metabarcoding and a traditional survey method. Sci. Total Environ. 2022, 806, 150587. [Google Scholar] [CrossRef] [PubMed]
  49. Pochon, X.; Wood, S.A.; Keeley, N.B.; Lejzerowicz, F.; Esling, P.; Drew, J.; Pawlowski, J. Accurate assessment of the impact of salmon farming on benthic sediment enrichment using foraminiferal metabarcoding. Mar. Pollut. Bull. 2015, 100, 370–382. [Google Scholar] [CrossRef]
  50. He, X.P.; Gilmore, S.R.; Sutherland, T.F.; Hajibabaei, M.; Miller, K.M.; Westfall, K.M.; Pawlowski, J.; Abbott, C.L. Biotic signals associated with benthic impacts of salmon farms from eDNA metabarcoding of sediments. Mol. Ecol. 2020, 30, 3158–3174. [Google Scholar] [CrossRef] [PubMed]
  51. Schubert, B.; Heiniger, P.; Keller, M.; Claus, E.; Ricking, M. Monitoring of contaminants in suspended particulate matter as an alternative to sediments. TrAC Trends Anal. Chem. 2012, 36, 58–70. [Google Scholar] [CrossRef]
  52. Roussel, J.M.; Paillisson, J.M.; Treguier, A.; Petit, E. The downside of eDNA as a survey tool in water bodies. J. Appl. Ecol. 2015, 52, 823–826. [Google Scholar] [CrossRef]
  53. Yao, W.Q. Systematic Synopsis of Fishes in Anhui; Anhui University Press: Hefei, China, 2020. [Google Scholar]
  54. Yao, M.; Zhang, S.; Lu, Q.; Chen, X.Y.; Zhang, S.Y.; Kong, Y.Q.; Zhao, J.D. Fishing for fish environmental DNA: Ecological applications, methodological considerations, surveying designs, and ways forward. Mol. Ecol. 2022, 31, 5132–5164. [Google Scholar] [CrossRef] [PubMed]
  55. Deiner, K.; Bik, H.M.; Machler, E.; Seymour, M.; Lacoursière-Roussel, A.; Altermatt, F.; Creer, S.; Bista, I.; Lodge, D.M.; de Vere, N.; et al. Environmental DNA metabarcoding: Transforming how we survey animal and plant communities. Mol. Ecol. 2017, 26, 5872–5895. [Google Scholar] [CrossRef] [PubMed]
  56. Bylemans, J.; Gleeson, D.M.; Hardy, C.M.; Furlan, E. Toward an ecoregion scale evaluation of eDNA metabarcoding primers: A case study for the freshwater fish biodiversity of the Murray-Darling Basin (Australia). Ecol. Evol. 2018, 8, 8697–8712. [Google Scholar] [CrossRef] [PubMed]
  57. Goutte, A.; Molbert, N.; Guérin, S.; Richoux, R.; Rocher, V. Monitoring freshwater fish communities in large rivers using environmental DNA metabarcoding and a long-term electrofishing survey. J. Fish Biol. 2020, 97, 444–452. [Google Scholar] [CrossRef]
  58. Liu, J.; Zhang, H.B. Combining multiple markers in environmental DNA metabarcoding to assess deep-sea benthic biodiversity. Front. Mar. Sci. 2021, 8, 9. [Google Scholar] [CrossRef]
  59. Leray, M.; Yang, J.Y.; Meyer, C.P.; Mills, S.C.; Agudelo, N.; Ranwez, V.; Boehm, J.T.; Machida, R.J. A new versatile primer set targeting a short fragment of the mitochondrial COI region for metabarcoding metazoan diversity: Application for characterizing coral reef fish gut contents. Front. Zool. 2013, 10, 34. [Google Scholar] [CrossRef] [PubMed]
  60. Xie, R.L.; Zhao, G.F.; Yang, J.H.; Wang, Z.H.; Xu, Y.P.; Zhang, X.W.; Wang, Z.J. eDNA metabarcoding revealed differential structures of aquatic communities in a dynamic freshwater ecosystem shaped by habitat heterogeneity. Environ. Res. 2021, 201, 111602. [Google Scholar] [CrossRef] [PubMed]
  61. Barnes, M.A.; Turner, C.R.; Jerde, C.L.; Renshaw, M.A.; Chadderton, W.L.; Lodge, D.M. Environmental conditions influence eDNA persistence in aquatic systems. Environ. Sci. Technol. 2014, 48, 1819–1827. [Google Scholar] [CrossRef]
  62. Carroll, M.L.; Cochrane, S.; Fieler, R.; Velvin, R.; White, P. Organic enrichment of sediments from salmon farming in Norway: Environmental factors, management practices and monitoring techniques. Aquaculture 2003, 226, 165–180. [Google Scholar] [CrossRef]
  63. Shu, L.; Chen, S.J.; Li, P.; Peng, Z.G. Environmental DNA metabarcoding reflects fish DNA dynamics in lentic ecosystems: A case study of freshwater ponds. Fishes 2022, 7, 257. [Google Scholar] [CrossRef]
  64. Sun, X.; Wang, K.; Zhang, G.; Ren, H.; Yu, H. Spatial–temporal patterns of fish trophic guilds in a freshwater river wetland ecosystem of northeastern China. Ecol. Evo. 2024, 14, e11711. [Google Scholar] [CrossRef]
  65. Volkoff, H. The effects of environmental changes on the endocrine regulation of feeding in fishes. Phil. Trans. R. Soc. B 2024, 379, 20220503. [Google Scholar] [CrossRef] [PubMed]
  66. Jia, H.; Wang, Y.; Yoshizawa, S.; Iwasaki, W.; Li, Y.Q.; Xian, W.W.; Zhang, H. Seasonal variation and assessment of fish resources in the Yangtze Estuary based on environmental DNA. Water 2020, 12, 2874. [Google Scholar] [CrossRef]
  67. Kaenel, B.R.; Matthaei, C.D.; Uehlinger, U. Disturbance by aquatic plant management in streams: Effects on benthic invertebrates. Regul. Ric. Res. Manag. 1998, 14, 341–356. [Google Scholar] [CrossRef]
  68. Tokeshi, M. Resource utilization, overlap and temporal community dynamics: A null model analysis of an epiphytic chironomid community. J. Anim. Ecol. 1986, 55, 491–506. [Google Scholar] [CrossRef]
Figure 1. Location of the field area in the Shuimen Pond, China (a) sampling sites; (b) eDNA workflow: Technological process of Field sampling and laboratory eDNA analysis.
Fishes 09 00396 g001
Figure 2. The heat map of fish. The diagram displays the diversity and abundance variation of fishes in 12 water samples. The horizontal coordinate shows the name of the sample, the right side shows the names of all monitored fish species and the left side shows the species clustering results.
Fishes 09 00396 g002
Figure 3. Dominant benthic taxa based on eDNA metabarcoding. The horizontal coordinate shows the name of each sample, and the vertical coordinate shows the relative abundance of each taxon at the phylum level.
Fishes 09 00396 g003
Figure 4. Random forest distribution map of the top 20 species in importance. (a) denotes the top 20 fish taxa identified by 12S, and (b) denotes the top 20 benthic taxa with 18S primers at family level. The horizontal coordinate of the bar chart is the importance of species to the classifier model, and the vertical coordinate is the taxon name at different classification levels.
Fishes 09 00396 g004
Figure 5. Hierarchical cluster analysis diagram. The panel on the left is a hierarchical clustering tree in which samples are grouped according to their similarity. The shorter the branch length between samples, the more similar the two samples are. The panel on the right is a stacked bar chart of the top 20 species in abundance. The panel is a stacked bar chart of the top 20 taxa identified by W-eDNA and S-eDNA for abundance. (a) W-eDNA samples are grouped into four groups based on sampling point distance. (b) S-eDNA samples are grouped into three groups based on sampling point distance.
Fishes 09 00396 g005
Figure 6. The correlation heat diagram of the relationship between species abundance and environmental factors. In the relational heat diagram, the correlation value is mapped by heat diagram color and grid size at the same time. The heat grid displays values as correlations between environmental factors; asterisks indicate significance (“*” represents p < 0.05, “**” represents p < 0.01, “***” represents p < 0.001.). The line width reflects the strength of the correlation, and the line color represents the positive or negative correlation relationship.
Fishes 09 00396 g006
Disclaimer/Publisher’s Note: The statements, opinions and data contained in all publications are solely those of the individual author(s) and contributor(s) and not of MDPI and/or the editor(s). MDPI and/or the editor(s) disclaim responsibility for any injury to people or property resulting from any ideas, methods, instructions or products referred to in the content.

