Article

The Effect of Copper–Cadmium Co-Exposure and Hormone Remediation on the Ovarian Transcriptome of Nile Tilapia (Oreochromis niloticus)

1
Guangxi Key Laboratory of Aquatic Genetic Breeding and Healthy Aquaculture, Guangxi Academy of Fishery Science, Nanning 530021, China
2
College of Aquaculture and Life Sciences, Shanghai Ocean University, Shanghai 201306, China
3
Key Laboratory of Comprehensive Development and Utilization of Aquatic Germplasm Resources of China (Guangxi) and ASEAN (Co-Construction by Ministry and Province), Ministry of Agriculture and Rural Affairs, Nanning 530021, China
*
Authors to whom correspondence should be addressed.
These authors contribute equally to this work.
Fishes 2024, 9(2), 67; https://doi.org/10.3390/fishes9020067
Submission received: 3 January 2024 / Revised: 1 February 2024 / Accepted: 6 February 2024 / Published: 8 February 2024

Abstract

:
The escalating problem of copper (Cu) and cadmium (Cd) pollution in aquatic environments poses a significant threat to the ovarian tissue and reproductive capacity of fish, hindering the development of the aquaculture industry. However, the combined effects of Cu and Cd on fish gonadal development remain unclear. In this study, the fish species Nile tilapia was stressed with rearing water containing 300 μg/L Cu2+ and 100 μg/L Cd2+ for 30 days, followed by an intraperitoneal injection of luteinizing hormone-releasing hormone (LHRH-α) and human chorionic gonadotropin (HCG) at various concentrations. We investigated the ovarian transcriptome profiles before and after injection. Prior to injection, combined treatment with Cu and Cd resulted in reproductive dysfunction and metal ion imbalance in tilapia. Transcriptomic profiling revealed differential gene annotation concentrated in the MAPK signaling pathway and regulation of GTPase activity. Post-injection, all concentrations of LHRH-α and HCG groups showed an upregulated gonadosomatic index (G.S.I) and higher levels of vitellogenin (VTG), gonadotropin-releasing hormone (GnRH), gonadotropin (GTH), and estrogen (E2) in serum compared to the negative control group. Transcriptomic analysis revealed alterations in various ovarian signaling pathways, preliminarily revealing the in vivo molecular mechanisms and differences in LHRH-α and HCG. The findings from this study could help us better understand how to counteract the effects of combined Cu and Cd exposure on tilapia ovarian development, which has significant implications for the Nile tilapia aquaculture industry.
Key Contribution: A comprehensive database of Nile tilapia gonadal transcriptome was created, revealing how Cu-Cd exposure and hormone treatments affect ion metabolism and ovarian development, with specific insights into the roles of GTPase Rab, chemokine receptors, and the mTOR signaling pathway in these processes.

1. Introduction

Aquaculture is crucial for ensuring global food security and driving economic growth [1]. However, the sustainability of this industry is under threat from environmental pollution, particularly heavy metal contamination such as copper (Cu) and cadmium (Cd), which has emerged as a global issue [2]. Toxic heavy metals such as Cu and Cd have been detected in both marine aquaculture species like Atlantic salmon and freshwater species like Cyprinus carpio [3,4]. From shrimp hatcheries in Mexico to cage aquaculture facilities in Indonesian reservoirs and mussel farms in the Mediterranean, heavy metals like Cu and Cd have woven a vast network across the globe, posing a significant threat to global aquaculture facilities and seafood safety [5,6,7]. The sources of heavy metals in aquatic environments are twofold: natural processes such as erosion, rock weathering, and volcanic eruptions, and human activities, including mining, agricultural practices, and urban sewage sludge [2,8]. Our research team conducted a survey on the heavy metal content in pond sediment across multiple tilapia-producing regions in Guangxi, China, during 2016–2017. We found Cu and Cd levels ranging from approximately 5.667 to 48.90 mg/kg and 0.0273 to 2.483 mg/kg, respectively (unpublished data). Although the regulation of water quality in commercial aquaculture is stringent, ensuring the timely replacement of water that exceeds quality standards, no heavy metals exceeding the permissible limits have been detected in aquaculture water. However, due to the characteristic of sediment to release metals into the overlying water body [9], there is a significant safety risk in ponds lacking proper management or during the replacement of benthic fish species in aquaculture. Both Cu and Cd are toxic metals ubiquitously present in the environment, known for their high bioaccumulation and toxicity, which severely affect the physiological functions of aquatic life [10]. Cu, an essential trace element, is vital for the growth and development of organisms, but an excessive intake can induce toxic reactions [11]. In contrast, Cd, a non-essential toxic metal, is highly bioaccumulative and can inflict various types of damage, including physiological and biochemical [12,13]. Research indicates that heavy metals like Cu and Cd significantly impede the growth, development, and reproductive functions of fish ovaries [14,15]. These metals can disrupt the endocrine system, damage cellular structure and function, and induce oxidative stress, leading to reduced reproductive capacity, reproductive disorders, and even infertility in fish [16,17]. While numerous studies have reported the effects of individual pollution from Cu and Cd on aquatic life [18], these studies fall short considering that in real-world ecological environments, aquatic organisms often encounter combined stress from multiple heavy metals [19]. However, the impact of combined pollution from Cu and Cd on organisms remains largely unexplored [20]. It is noteworthy that combined heavy metal stress may produce synergistic effects within the body [21,22]. For instance, when fish are exposed to a mixture of zinc (Zn) and Cd, the concentration of these metals in their serum is lower than in fish exposed to a single metal. One metal can obstruct or even antagonize the gill epithelial absorption of another metal, thereby limiting the distribution of metals in the blood [21]. One study suggested that combined heavy metal pollution could further disrupt metal ion balance in the body, exacerbating adverse effects on growth, reproduction, and immunity [22]. Other research shows that combined heavy metal exposure can further induce metal ion disorders in the body, increasing the bioaccumulation of metal ions which can then cause abnormalities in physiological functions such as growth, reproduction, and immunity [23]. Could this be related to the gene regulatory functions of heavy metals? Reports have indicated that sub-lethal concentrations of Cd and Cu can alter the gene expression levels of proteins to varying degrees [24]. The intake of heavy metals in organisms is also regulated by a variety of transport proteins [25]. A study conducted in brewing yeast has provided us with a research direction. Utilizing multiple analytical techniques, it was discovered that Cd inhibits the expression of genes related to Cu metabolism in yeast, subsequently leading to Cu deficiency in yeast [26]. In fish, is there a similar regulatory mechanism? The interactions of heavy metal ions under combined exposure conditions and the gene regulatory mechanisms of heavy metals on transport proteins remain unclear. Relevant research should be conducted in a representative species of fish to further understand these mechanisms.
The Nile tilapia (Oreochromis niloticus), an omnivorous fish species known for its rapid growth, robust reproductive capacity, and tolerance to low oxygen levels, is one of the most significant farmed fish worldwide, contributing significantly to global food security [27]. Given its economic importance, adaptability to environmental constraints, sensitivity to various pollutants, and the convenience of experimental manipulation, the Nile tilapia has been extensively used in environmental research to assess the toxicity of pollutants in aquatic ecosystems [28,29]. In this study, we developed a female Nile tilapia animal model exposed to a combination of heavy metals (Cu and Cd). Using this model, we first evaluated the impact of combined exposure to Cu and Cd on ovarian development. We then attempted to mitigate ovarian damage under this stress using hormone treatment. Using transcriptomic analysis, we delved into the damage mechanism of combined heavy metal exposure and the repair mechanism of the hormone.

2. Materials and Methods

2.1. Materials

CuSO4·5H2O, purchased from Sinopharm Chemical Reagent Co., Ltd., (Shanghai, China). CdCl2·2.5H2O, purchased from Tianjin Damao Chemical Reagent Factory (Tianjin, China). Both materials were analytically pure and were used for exposure treatment.

2.2. Animals and Sample Collection

All female Nile tilapia used in this study (age, ~3 months old; average weight, 38.0 ± 8.3 g) were obtained from the National Tilapia Breeding Farm of Guangxi Academy of Fisheries Science (Naning, China). Prior to starting the experiment, all fish underwent a two-week acclimation period in several 200-L PVC containers. Throughout this acclimation phase and the subsequent experimental period, the culture water was kept under natural conditions, with a temperature range of 26–32 °C, a pH range of 7.4–8.3, and a dissolved oxygen content of 5.3 ± 1.1 mg/L. During the experiment, the fish were fed daily with a full-price expanded pellet feed (Guangxi Baiyang, Nanning, China; protein content 30%) at a rate of 1–1.5% of their body weight.
Following the acclimation period, healthy and active tilapia were selected and randomly assigned to two groups: a blank control group (pure aerated water adhering to fishery water quality standards) [30] and a treatment group. After initial grouping, 24 fish were randomly selected from each group, weighed, and then euthanized humanely. Their ovaries were carefully excised and weighed for a preliminary assessment of their body weight, the bioaccumulation of copper and cadmium, and the gonadosomatic index. The composition within each group was continuously adjusted to determine the final experimental groups. Subsequently, the two groups of tilapia were exposed to 300 μg/L Cu2+ and 100 μg/L Cd2+, respectively. There were 6 replicates in each group. To mitigate the potential influence of the container on the heavy metal ions in the culture water, a specialized water tank (200 L capacity, PE plastic) was used for breeding the fish. Each tank was designed to hold 150 L of water and 50 fish. The culture water was replaced every 2 d to maintain a stable concentration of heavy metals in each group’s culture medium. In total, 10 tanks were established, with 8 designated for the treatment group undergoing heavy metal exposure (300 μg/L Cu2+ and 100 μg/L Cd2+), while the remaining 2 tanks were used for the blank control group, housing fish in pure aerated water. The number of organisms in the control group and treatment group is shown in Table 1. Throughout the exposure experiment, the heavy metal content in each group’s culture water was kept relatively constant: control group: 1.9 ± 0.9 μg/L Cu and 0.5 ± 0.3 μg/L Cd; treatment group: 259.6 ± 0.9 μg/L Cu and 106.1 ± 0.3 μg/L Cd. After 30 days of exposure, samples were collected.
Subsequent to this, the fish in the treatment group underwent hormone treatment via intraperitoneal injection. The entire treatment group was divided into seven subgroups: the negative control group received an intraperitoneal injection of 200 μL PBS, and groups of low (low-LHRH-α), medium (mid-LHRH-α), and high (hig-LHRH-α) LHRH-α concentration received intraperitoneal injections of 5, 10, and 20 μg/g body weight of LHRH-α (LHRH-α dissolved in 200 μL of PBS), and the groups of low (low-HCG), medium (mid-HCG), and high (hig-HCG) HCG concentration received intraperitoneal injections of 0.5, 1.0, and 1.5 IU/g body weight of HCG (HCG dissolved in 200 μL of PBS). There were 6 replicates in each group, and the number of organisms contained in each group is shown in Table 1. After a 72 h recovery period, samples were collected again. Prior to each sampling, 48 tilapia fish were randomly selected from each group. Initially, the fish were anesthetized with MS-222 (200 mg/L, Sigma-Aldrich, Burlington, MA, USA), and then they were weighed individually. Blood samples were then drawn from the caudal vein of each fish to obtain serum samples, and then the serum from eight fish was pooled together to form one sample for hormone level testing. After serum collection, the fish were euthanized using MS-222, and their entire ovaries were surgically removed and weighed. From each group, the ovaries of two randomly selected fish were used for histomorphological analysis. For the remaining 48 fish in each group, the ovaries of every 4 fish were pooled to create 1 biological replicate sample. Six of these pooled ovarian samples were used to calculate the gonadosomatic index (G.S.I) values and assess the bioaccumulation levels of Cu and Cd. The other 6 pooled ovarian samples were used for transcriptomic analysis and qRT-PCR analysis.

2.3. Determination of Cu and Cd Bioaccumulation

The concentration of Cu and Cd in ovary tissue was detected using the method of inductively coupled plasma mass spectrometry (ICP-MS), as occurred in a previous study [31]. Ovary tissue samples were weighed (accurate to 0.0001 g) and digested. Ultra-pure water was added to the samples to a total volume of 10 mL, and the concentration of Cu and Cd (μg/mL) was determined using ICP-MS. The heavy metal content in the samples was calculated as follows, and the validation of the digestion method and the accuracy of the method are shown in Supplementary Text S1.

2.4. Histomorphological Analysis

A total of 2 repeated samples were collected from each group for histomorphological analysis. In brief, ovarian tissues were fixed in Bouin’s fixative for 24 h, routinely dehydrated, embedded in paraffin, sectioned into 5 μm sections, stained with hematoxylin and eosin (H&E staining), and observed and photographed using a light microscope (Leica, Wetzlar, Germany). LAS X (Leica Application Suite X, version 1.4.5) software was used to measure the diameter of each oocyte, and the average diameter of oocytes observed in the visual field was taken as the diameter of the oocyte in the replicate group.

2.5. Biochemical Analysis

The blood samples collected were allowed to rest at 4 °C for a duration of 24 h. Subsequently, serum samples were collected using centrifugation at 8000× g for 10 min, as described by Benjamin et al. [32]. The serum levels of VTG, GnRH, GTH, and E2 were then determined. The determination process utilized enzyme-linked immunosorbent assay (ELISA) kits provided by mlbio Biotechnology Co., Ltd. (Shanghai, China). Initially, the antigen under test was coated, followed by a washing and blocking process. The next steps involved incubation with the primary antibody (overnight at 4 °C) and the secondary antibody (1–2 h), each performed separately. After a subsequent washing, the absorbance was read at the specified wavelength using a Rayto RT-6100 enzyme marker (RAYTO, Chicago, IL, USA), as per the manufacturer’s instructions. The final step involved determining the content of each sample by comparing it with the standard curve.

2.6. Total RNA Isolation, Library Construction, and Sequencing

Total RNA was isolated from the samples using TRIzol® Reagent (Invitrogen, Carlsbad, CA, USA), as per the manufacturer’s guidelines. The integrity of the total RNA was verified using an Agilent 2100 Bioanalyzer (Agilent Technologies, Palo Alto, CA, USA). mRNA with polyA tails was enriched via Oligo (dT) magnetic beads. Ultrasonication was employed to fragment the mRNA, followed by cDNA synthesis via reverse transcription using a random oligonucleotide primer in the M-MuLV reverse transcriptase system. This was followed by RNA strand degradation with RNaseH and second-strand cDNA synthesis in the DNA polymerase I system using dNTPs as substrates. The cDNA fragments were subsequently purified with a Qiaquick PCR kit (Qiagen, Venlo, The Netherlands), end-repaired, poly(A) added, and connected with Illumina sequencing adapters. cDNA of 250–300 bp was selected using AMPure XP Beads, of which it was then PCR-amplified, and the PCR products were once again purified using AMPure XP beads to generate the final library.

2.7. Bioinformatics Analysis

To ensure our data were of a high quality, we utilized fastp [33] for the quality control of the original reads to obtain clean reads. These clean reads were then aligned with the tilapia reference genome (https://www.ncbi.nlm.nih.gov/genome/197, accessed on 29 June 2018) using HISAT2 [34]. Based on the alignment results from HISAT2, we used Stringtie [35] to reconstruct the transcriptome and calculate and display the expression levels (FPKM) of all the genes in each sample. Subsequently, Deseq2 [36] was used to screen for differentially expressed genes. We performed enrichment analysis of the significantly differentially expressed genes using Gene Ontology (GO)[37] and the Kyoto Encyclopedia of Genes and Genomes (KEGG) [38] (corrected p-value ≤ 0.05).
All the original data results of this study can be obtained from the NCBI Sequence Read Archive database (https://www.ncbi.nlm.nih.gov/bioproject/PRJNA1001065, accessed on 7 February 2024).

2.8. qRT-PCR Analysis of Selected Genes

In order to validate the reliability of transcriptome sequencing in identifying differentially expressed genes, we selected nine differentially expressed genes (DEGs) for validation using quantitative real-time PCR (qRT-PCR): JNK, RAB5, RAB7, PREX1, PI3K, NR3C1, NADK, DGAT, and XRCC4. A total of 500 ng of RNA was used for cDNA synthesis using the PrimeScript RT Master Mix (TaKaRa). qPCR was performed using a two-step SYBR QRT-PCR kit (TaKaRa) and a fluorescence quantitative PCR system (Bio-Rad Laboratories) with the following thermal cycling conditions: initial denaturation at 95 °C for 15 s, followed by 40 cycles of denaturation at 95 °C for 10 s, annealing at 60 °C for 30 s, and extension at 72 °C for 15 s. The specificity of the amplification products was verified based on melting curve analysis. Each sample was run in triplicate. The literature suggests that there is no universal reference gene for organisms [39]; however, previous heavy metal stress experiments in tilapia have shown that beta-actin is a stable factor that can be used as an internal reference to normalize the mRNA levels of the target genes [40,41]. Therefore, beta-actin was chosen as the reference gene in this study. Primers were designed using Primer Premier 6 software (version 6.25) and synthesized by Biotech Bio (Shanghai, China). The primer sequence is shown in Table 2. The expression levels of the target genes were calculated using the 2−ΔΔCt method [42].

2.9. Statistical Analysis

Statistical analyses were conducted using SPSS (version 22; IBM Corp., Armonk, NY, USA). Initially, the Shapiro–Wilk test was employed to assess the normality of the data distribution for each variable. This test was applied to all continuous variables before proceeding with further analysis. Upon establishing normality, we performed Levene’s test to evaluate the homogeneity of the variances between different groups, ensuring the validity of subsequent comparisons using parametric tests. For data satisfying the assumptions of the normality and homogeneity of variances, comparisons between two groups were conducted using a t-test, while comparisons among more than two groups were performed using a one-way ANOVA. In cases where one-way ANOVA indicated significant differences, post hoc analyses were carried out using Dunnett’s multiple comparison test and Tukey’s test. Initially, Dunnett’s test was used to make individual comparisons between each hormone group and the negative control group. Upon detecting differences, Tukey’s test was then employed to make pairwise comparisons among multiple groups, integrating the results to determine intergroup differences. A p-value (p) of less than 0.05 was considered statistically significant. For the ease of representation, *, **, ***, and **** were used to denote p < 0.05, p < 0.01, p < 0.001, and p < 0.0001, respectively.

3. Results

3.1. Metal Bioaccumulation in the Ovaries of Nile tilapia

In order to control the variables in this experiment, the initial heavy metal content in the ovaries of the tilapia was measured before the combined treatment of heavy metals was performed, as shown in Figure 1A,B. Compared with the control group, there was no significant difference in the content of Cu2+ and Cd2+ in the treatment group. Subsequently, before the injection, the total ion content of Cu2+ and Cd2+ in the ovaries of the treatment group tilapia was found to have decreased by 17.16% compared with the blank control group (p > 0.05) (Figure 1C). Upon investigating each metal ion component individually, it was found that the level of Cd2+ detected in the ovaries of the treatment group tilapia increased by 631.48% (p < 0.05), while the level of Cu2+ decreased by 41.87% (p < 0.01). Seventy-two hours after the injection, compared with the control group, the content of Cd2+ in the negative control group still increased by 846.17 (p < 0.001), while the change in Cu2+ was not significant. The comparison results between the negative control group, all LHRH-α groups, and HCG groups showed that there was no significant difference in the total heavy metal content, Cu2+ content, and Cd2+ content (p > 0.05) (Figure 1D).

3.2. Effects on Growth and Ovarian Development of Nile tilapia

The initial weight and G.S.I values of tilapia before the combined treatment of Cu and Cd are shown in Figure 2A,B. Compared with the control group, there were no significant differences in the weight and G.S.I values of the tilapia in the treatment group, further verifying the uniqueness of the variables in this experiment. Subsequently, before injection, the weight and G.S.I of the tilapia in the treatment group decreased by 35.71% (p < 0.0001) and 18.93% (p > 0.05), respectively, compared with the blank control group. Seventy-two hours after injection, compared with the blank control group, the weight and G.S.I of the tilapia in the negative control group decreased by 50.35% (p < 0.0001) and 10.42% (p > 0.05), respectively. There were no significant differences in the weight and G.S.I values between the negative control group and all LHRH-α groups and HCG groups (p > 0.05) (Figure 2C,D).

3.3. Effects on Histopathological Changes in the Ovaries of Nile Tilapia

Before injection, the structure of oocytes in the blank control group was intact, with an average diameter of 306.10 ± 42.08 μm, mostly at the stage of yolk beginning to fill (IV1 phase). The yolk granules began to fill the entire oocyte, and lipid droplets formed a lipid ring at the edge of the egg. The follicular cells outside the egg membrane became columnar, and a radiating ring could be seen outside the egg membrane. A few oocytes were at the stage of yolk completely filling (IV2 phase), and the entire oocyte was filled with large yolk granules, lipid droplets, and vesicles (Figure 3A). At the same time, the development of oocytes in the treatment group was delayed, with an average diameter of 64.11 ± 5.96 μm, downregulated by 79.06% compared with the blank control group. Most oocytes were at the juvenile stage and single-layer follicle stage (II phase). The cell nucleus was mostly round, and the nuclear membrane was very obvious. There were many nucleoli of different sizes, most of which were distributed in the center of the nucleus. The chromatin was filamentous, and the chromatin granules could be clearly seen. According to the type and number of oocytes, it was judged that the ovaries of the blank control group had developed to stage IV, while the ovaries of the treatment group had developed to stage II (Figure 3B). Seventy-two hours after injection, the structure of the ovaries in the blank control group was similar to that at zero hours after injection, with an average oocyte diameter of 284.00 ± 44.76 μm, mostly at the stage of yolk beginning to fill (IV1 phase), and the ovaries developed to stage IV (Figure 3C). Interestingly, compared with before injection, more small blood vessels were observed in the ovaries of the negative control group, all LHRH-α groups, and HCG groups. In addition, most oocytes were at the single-layer follicle stage (II phase) (Figure 3D–J). Certain oocytes at the stage of fat beginning to deposit (III-1 phase) were observed in the hig-LHRH-α group and hig-HCG group. These cells had two layers of follicular epithelium outside the egg membrane, composed of colorless and transparent rings, and fat droplets were beginning to be deposited at the edge of the cell. Compared with the blank control group, the average diameter of oocytes in the negative control group was 62.40 ± 7.93 μm, downregulated by 78.03%. At the same time, compared with the negative control group, the diameters of the oocytes in all LHRH-α groups and HCG groups were upregulated by 48.96%, 52.04%, 83.97%, 30.18%, 52.32%, and 90.22%, respectively, but the differences were not significant (p > 0.05) (Figure 3K).

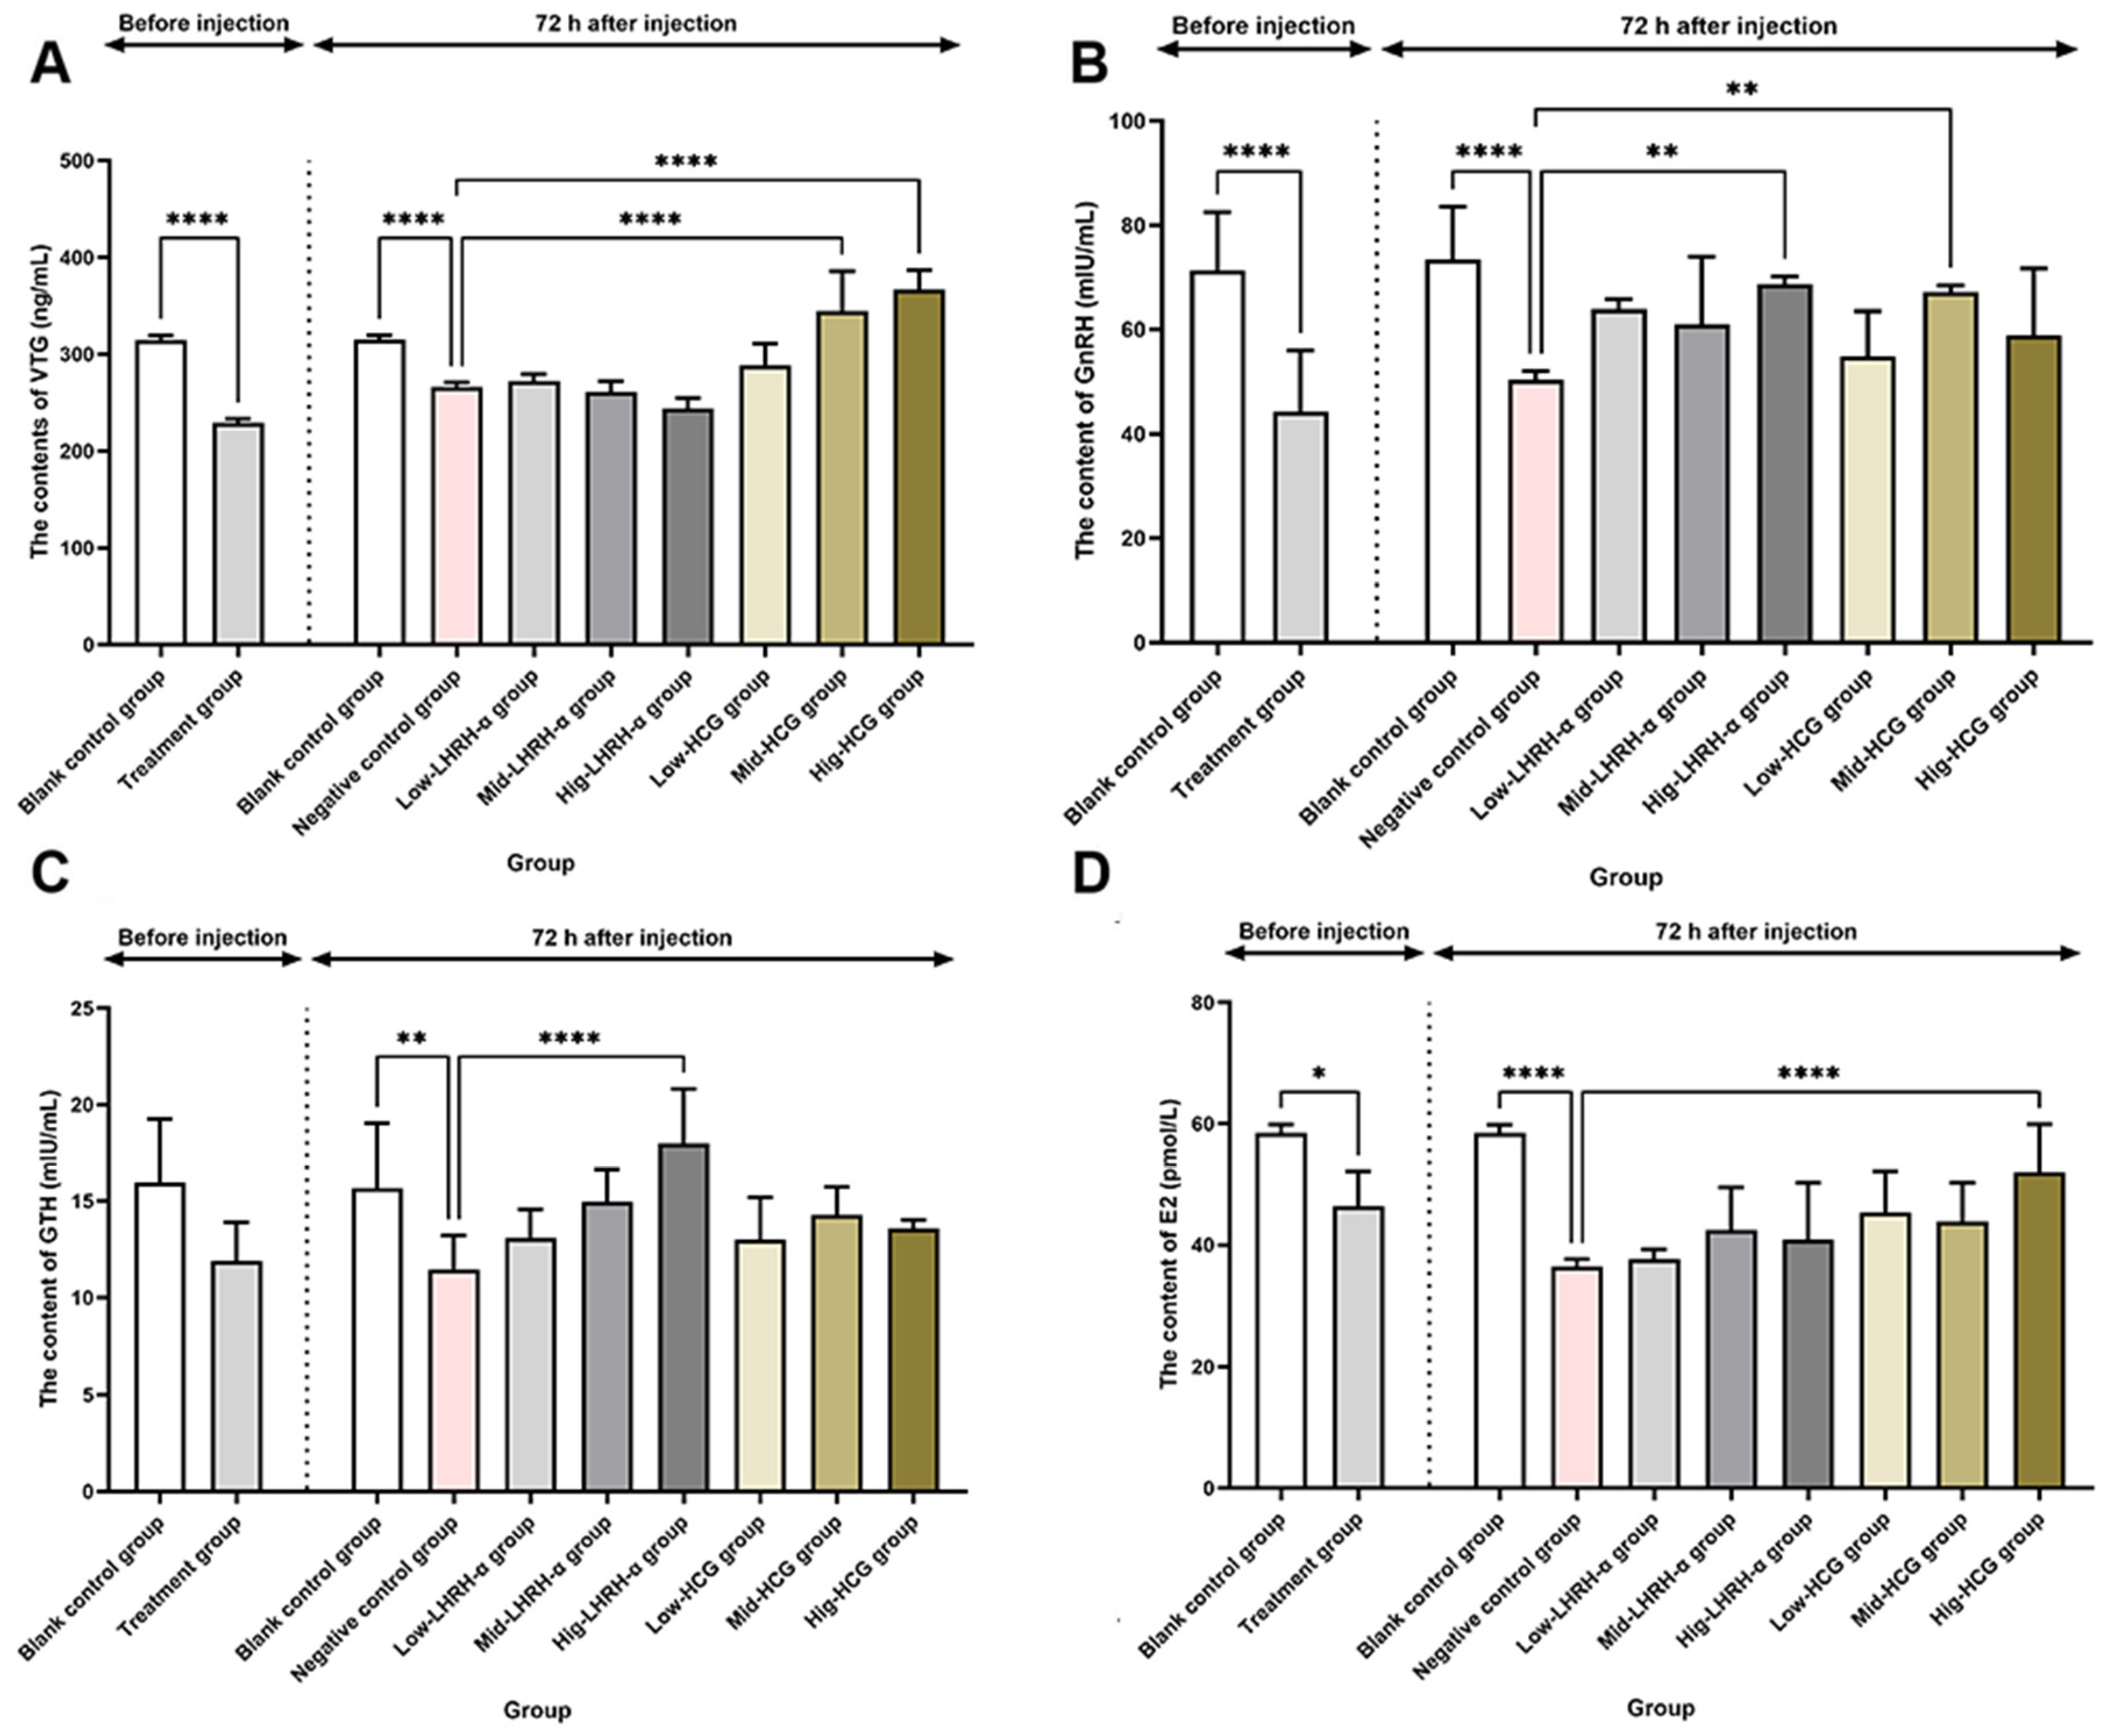
3.4. Effects of Hormone Levels on Nile Tilapia

Before injection, compared with the blank control group, the VTG content, GnRH content, and E2 content of the treatment group decreased by 27.21%, 25.30%, and 38.01% (p < 0.05), respectively. At this stage, the GTH content decreased by 20.53%, but the difference was not significant (p > 0.05). Seventy-two hours after injection, compared with the blank control group, the VTG content, GnRH content, GTH content, and E2 content of the negative control group decreased by 15.50%, 26.83%, 37.56%, and 31.38% (p < 0.05), respectively. Compared with the negative control group, the VTG content of the mid-HCG group and hig-HCG group increased by 29.14% and 37.77% (p < 0.001), respectively; the GnRH content of the hig-LHRH group and mid-HCG group increased by 56.71% and 24.56% (p < 0.01), respectively; the GTH content of the hig-LHRH group increased by 42.36% (p < 0.01); and the E2 content of the hig-LHRH group increased by 36.30% (p < 0.0001) (Figure 4).

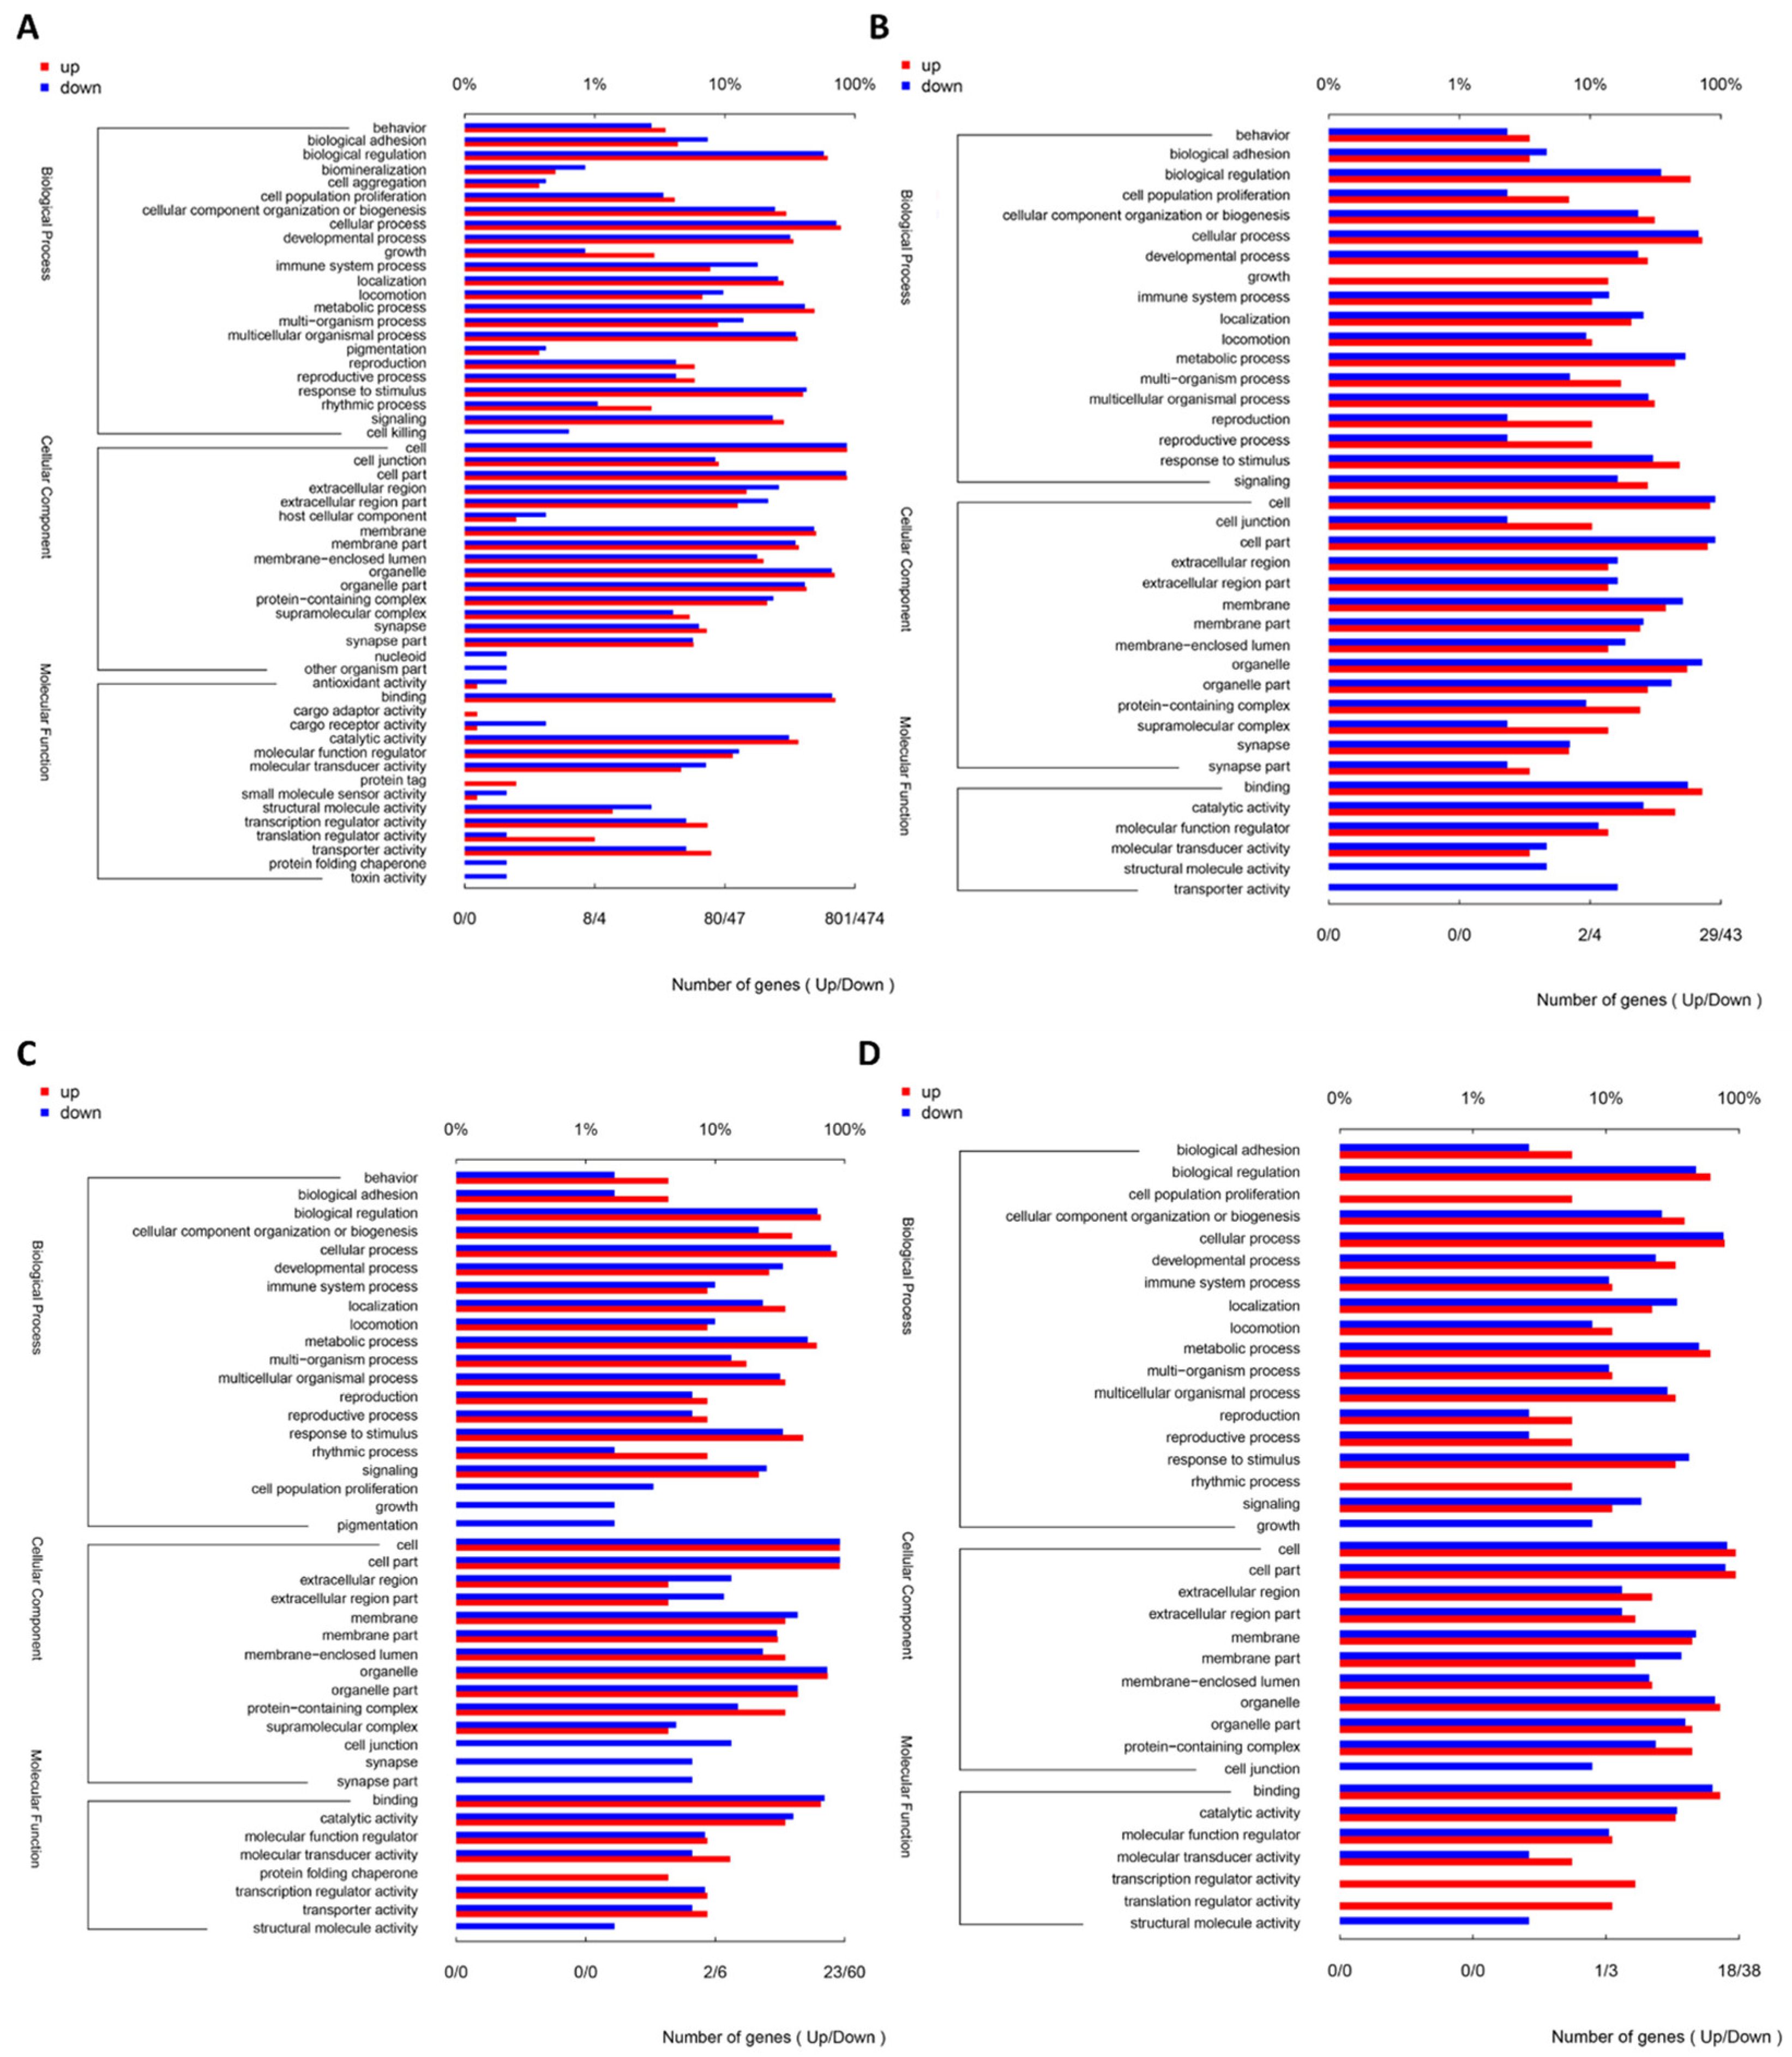
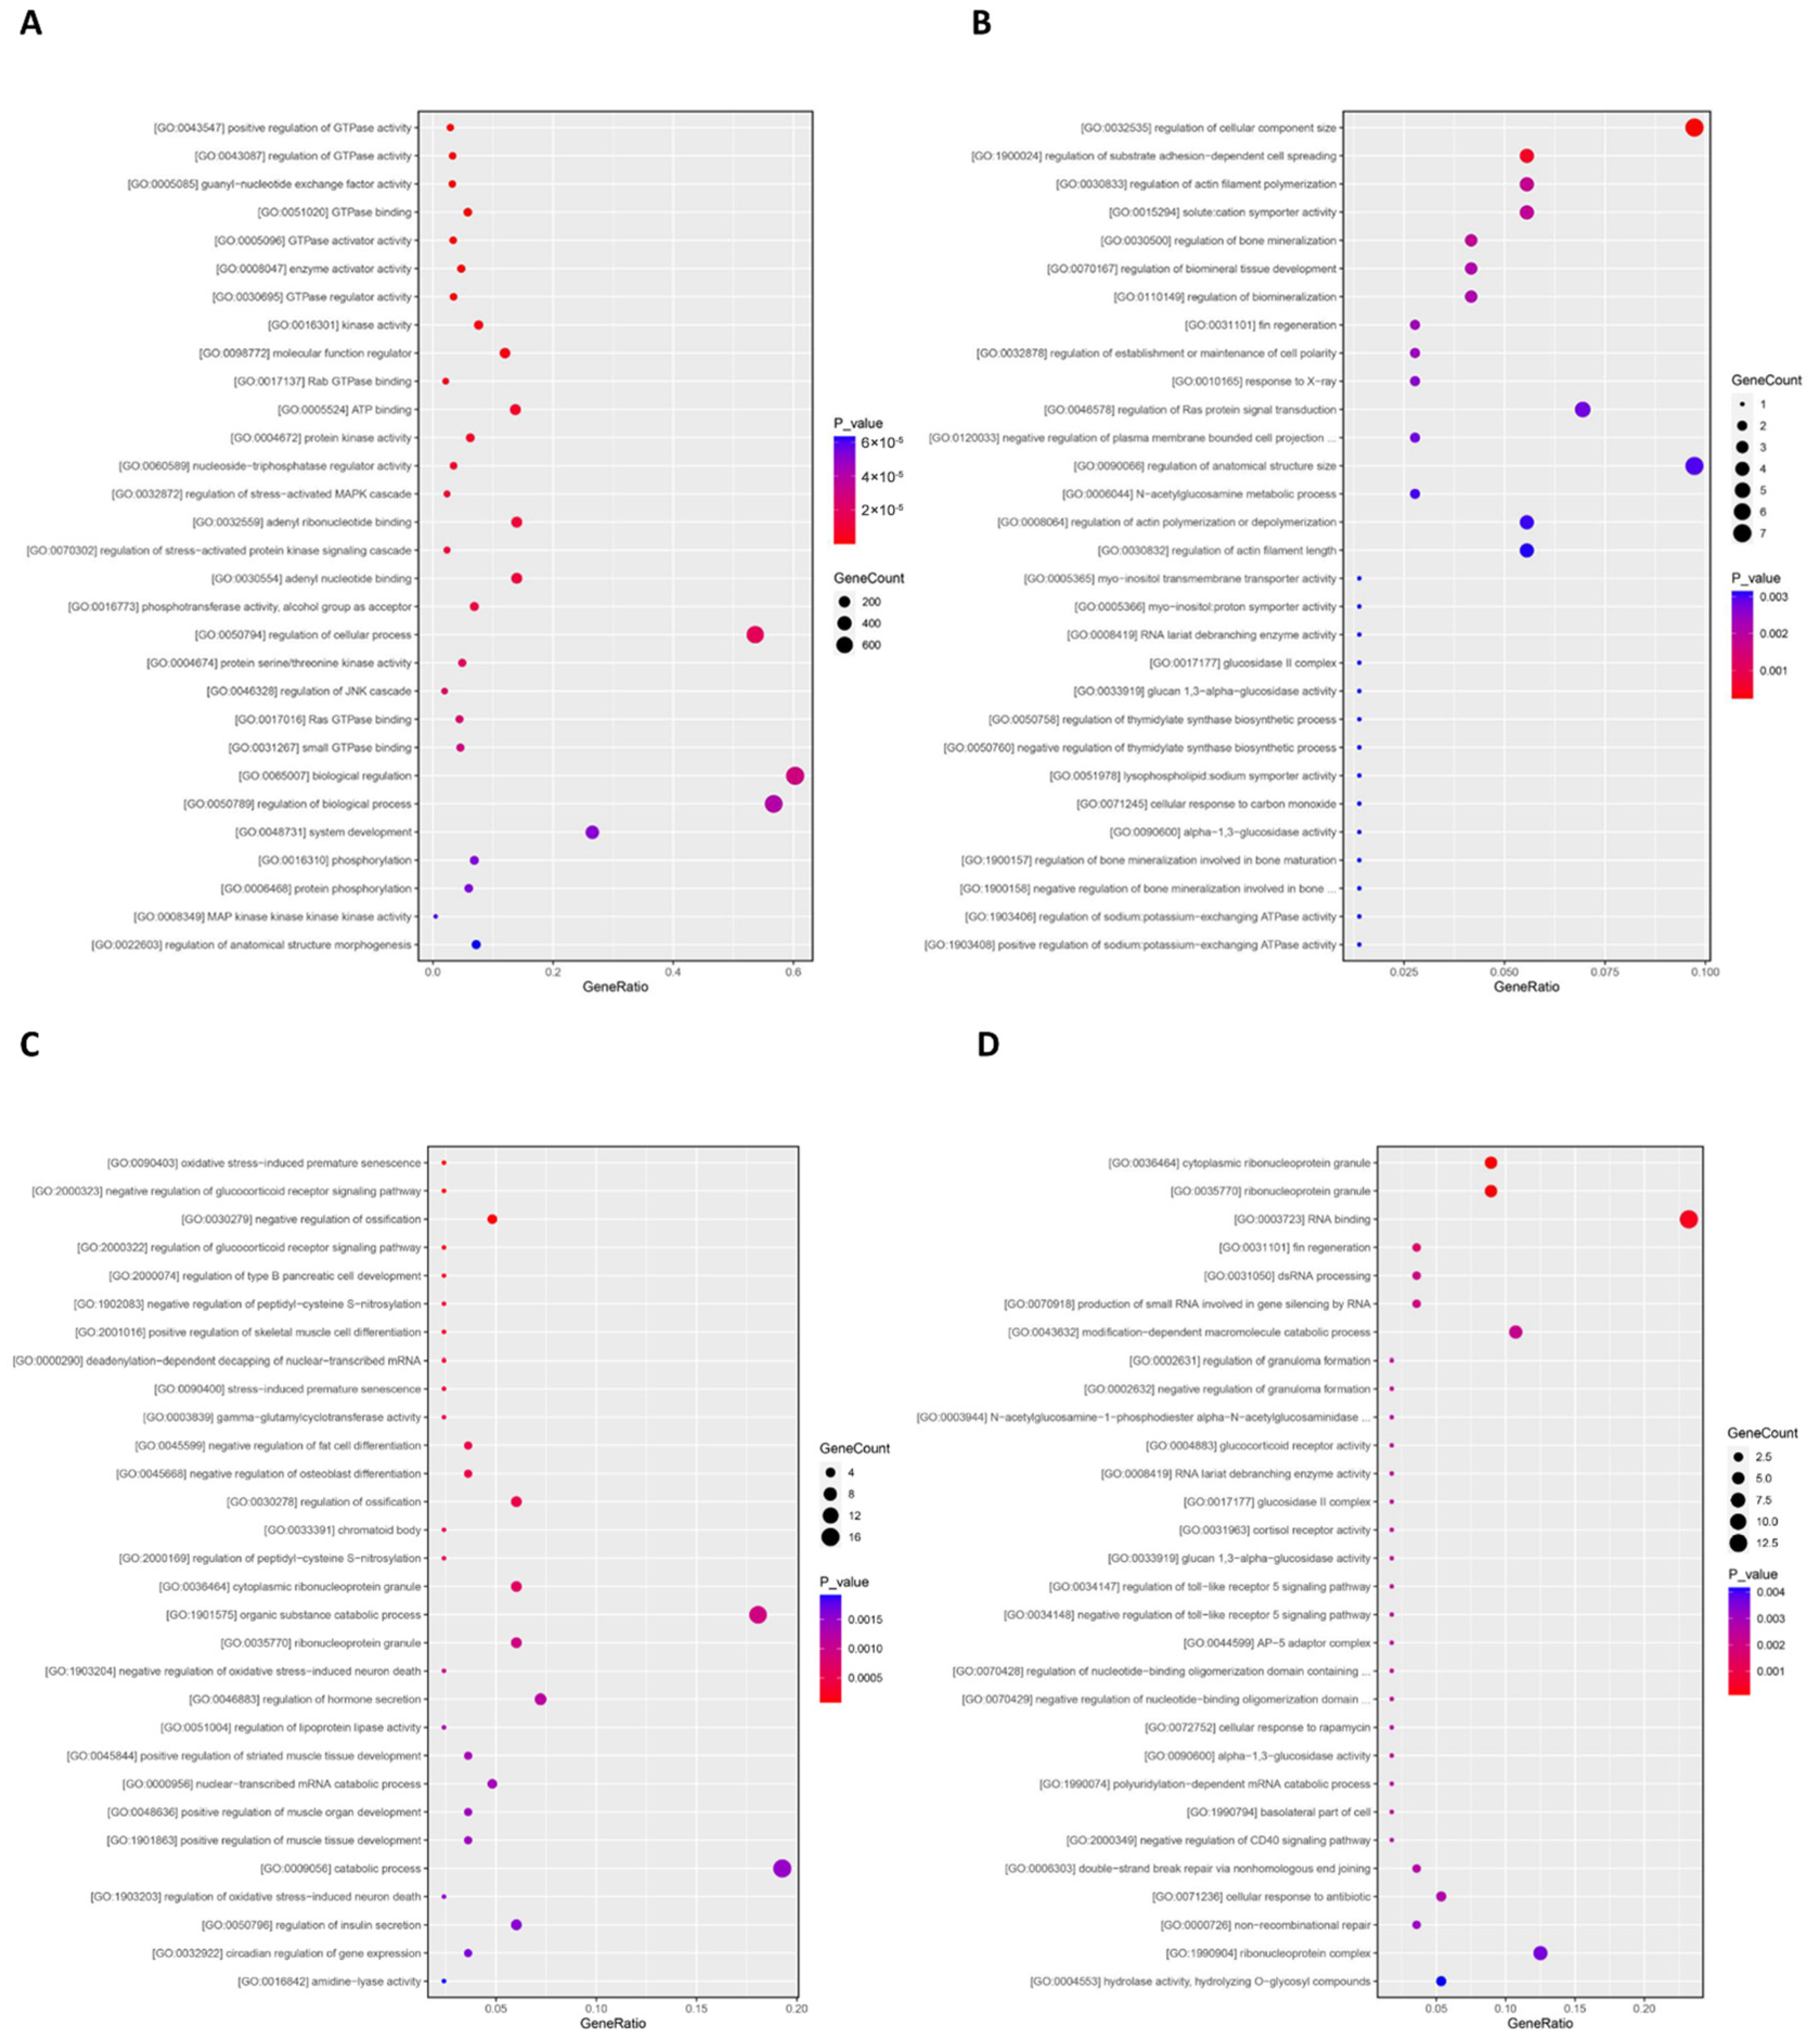
3.5. Quality Analysis of Transcriptome Sequencing and Identification of Differential Genes in Nile Tilapia Ovaries

In total, five cDNA libraries were obtained. The quality-controlled sequencing data of each sample were aligned with the designated reference genome, with alignment rates ranging from 22.24% to 87.16%. Based on the quantification results of gene or transcript expression, an intergroup difference analysis was performed to identify differentially expressed genes or transcripts between the two groups. Using the edgeR software (version 3.8.0), differentially expressed genes that were upregulated or downregulated were screened based on the criteria of (log2FoldChange) ≥ 1.00 and FDR < 0.05. The statistical results are shown in Table 3.
Significantly differentially expressed genes (DEGs) were enriched and classified using GO, as shown in Figure 5. Overall, the differences in all the comparison groups were concentrated in the cellular component. Further screening of significantly enriched signaling pathways revealed the top 30 signaling pathways with the lowest p-values in each comparison group (Figure 6). Subsequently, we enriched and classified DEGs using KEGG. Figure 7 shows the top 30 signaling pathways with the lowest p-values in each comparison group.
By comparing the results of GO and KEGG enrichment analyses, we identified some important comparison characteristics. These characteristics indicate that changes in related pathways may play a key role in the experiment. In the comparison of the blank control group and treatment group, the MAPK signaling pathway was enriched in both the GO and KEGG enrichment results. In addition, the regulation of GTPase activity was frequently mentioned in the GO enrichment pathways, and these processes also play an important role in many disease infections and signaling pathways in the KEGG enrichment pathways. This may indicate that GTPase plays a key role in the biological processes of heavy metal exposure.
In the comparison group of the negative control group and the hig-LHRH-α group, the regulation of the Ras protein signal transduction pathway enriched using GO is related to the chemokine signaling pathway and mTOR signaling pathway enriched using KEGG, which all involve the regulation of cell signal transduction. In the comparison group of the negative control group and the hig-HCG group, the regulation of the glucocorticoid receptor signaling pathway enriched using GO may be related to the nicotinate and nicotinamide metabolism pathway in the KEGG enrichment pathways, both of which involve hormone regulation. In addition, the negative regulation of fat cell differentiation enriched using GO may be related to the fat digestion and absorption pathway in the KEGG enrichment analysis as these pathways are all involved in the development and function of fat cells. In the comparison group of the hig-LHRH-α group and the hig-HCG group, the non-homologous end-joining pathway was mentioned in both GO and KEGG enrichment, showing the differences in ovarian repair mechanisms between the two hormones.

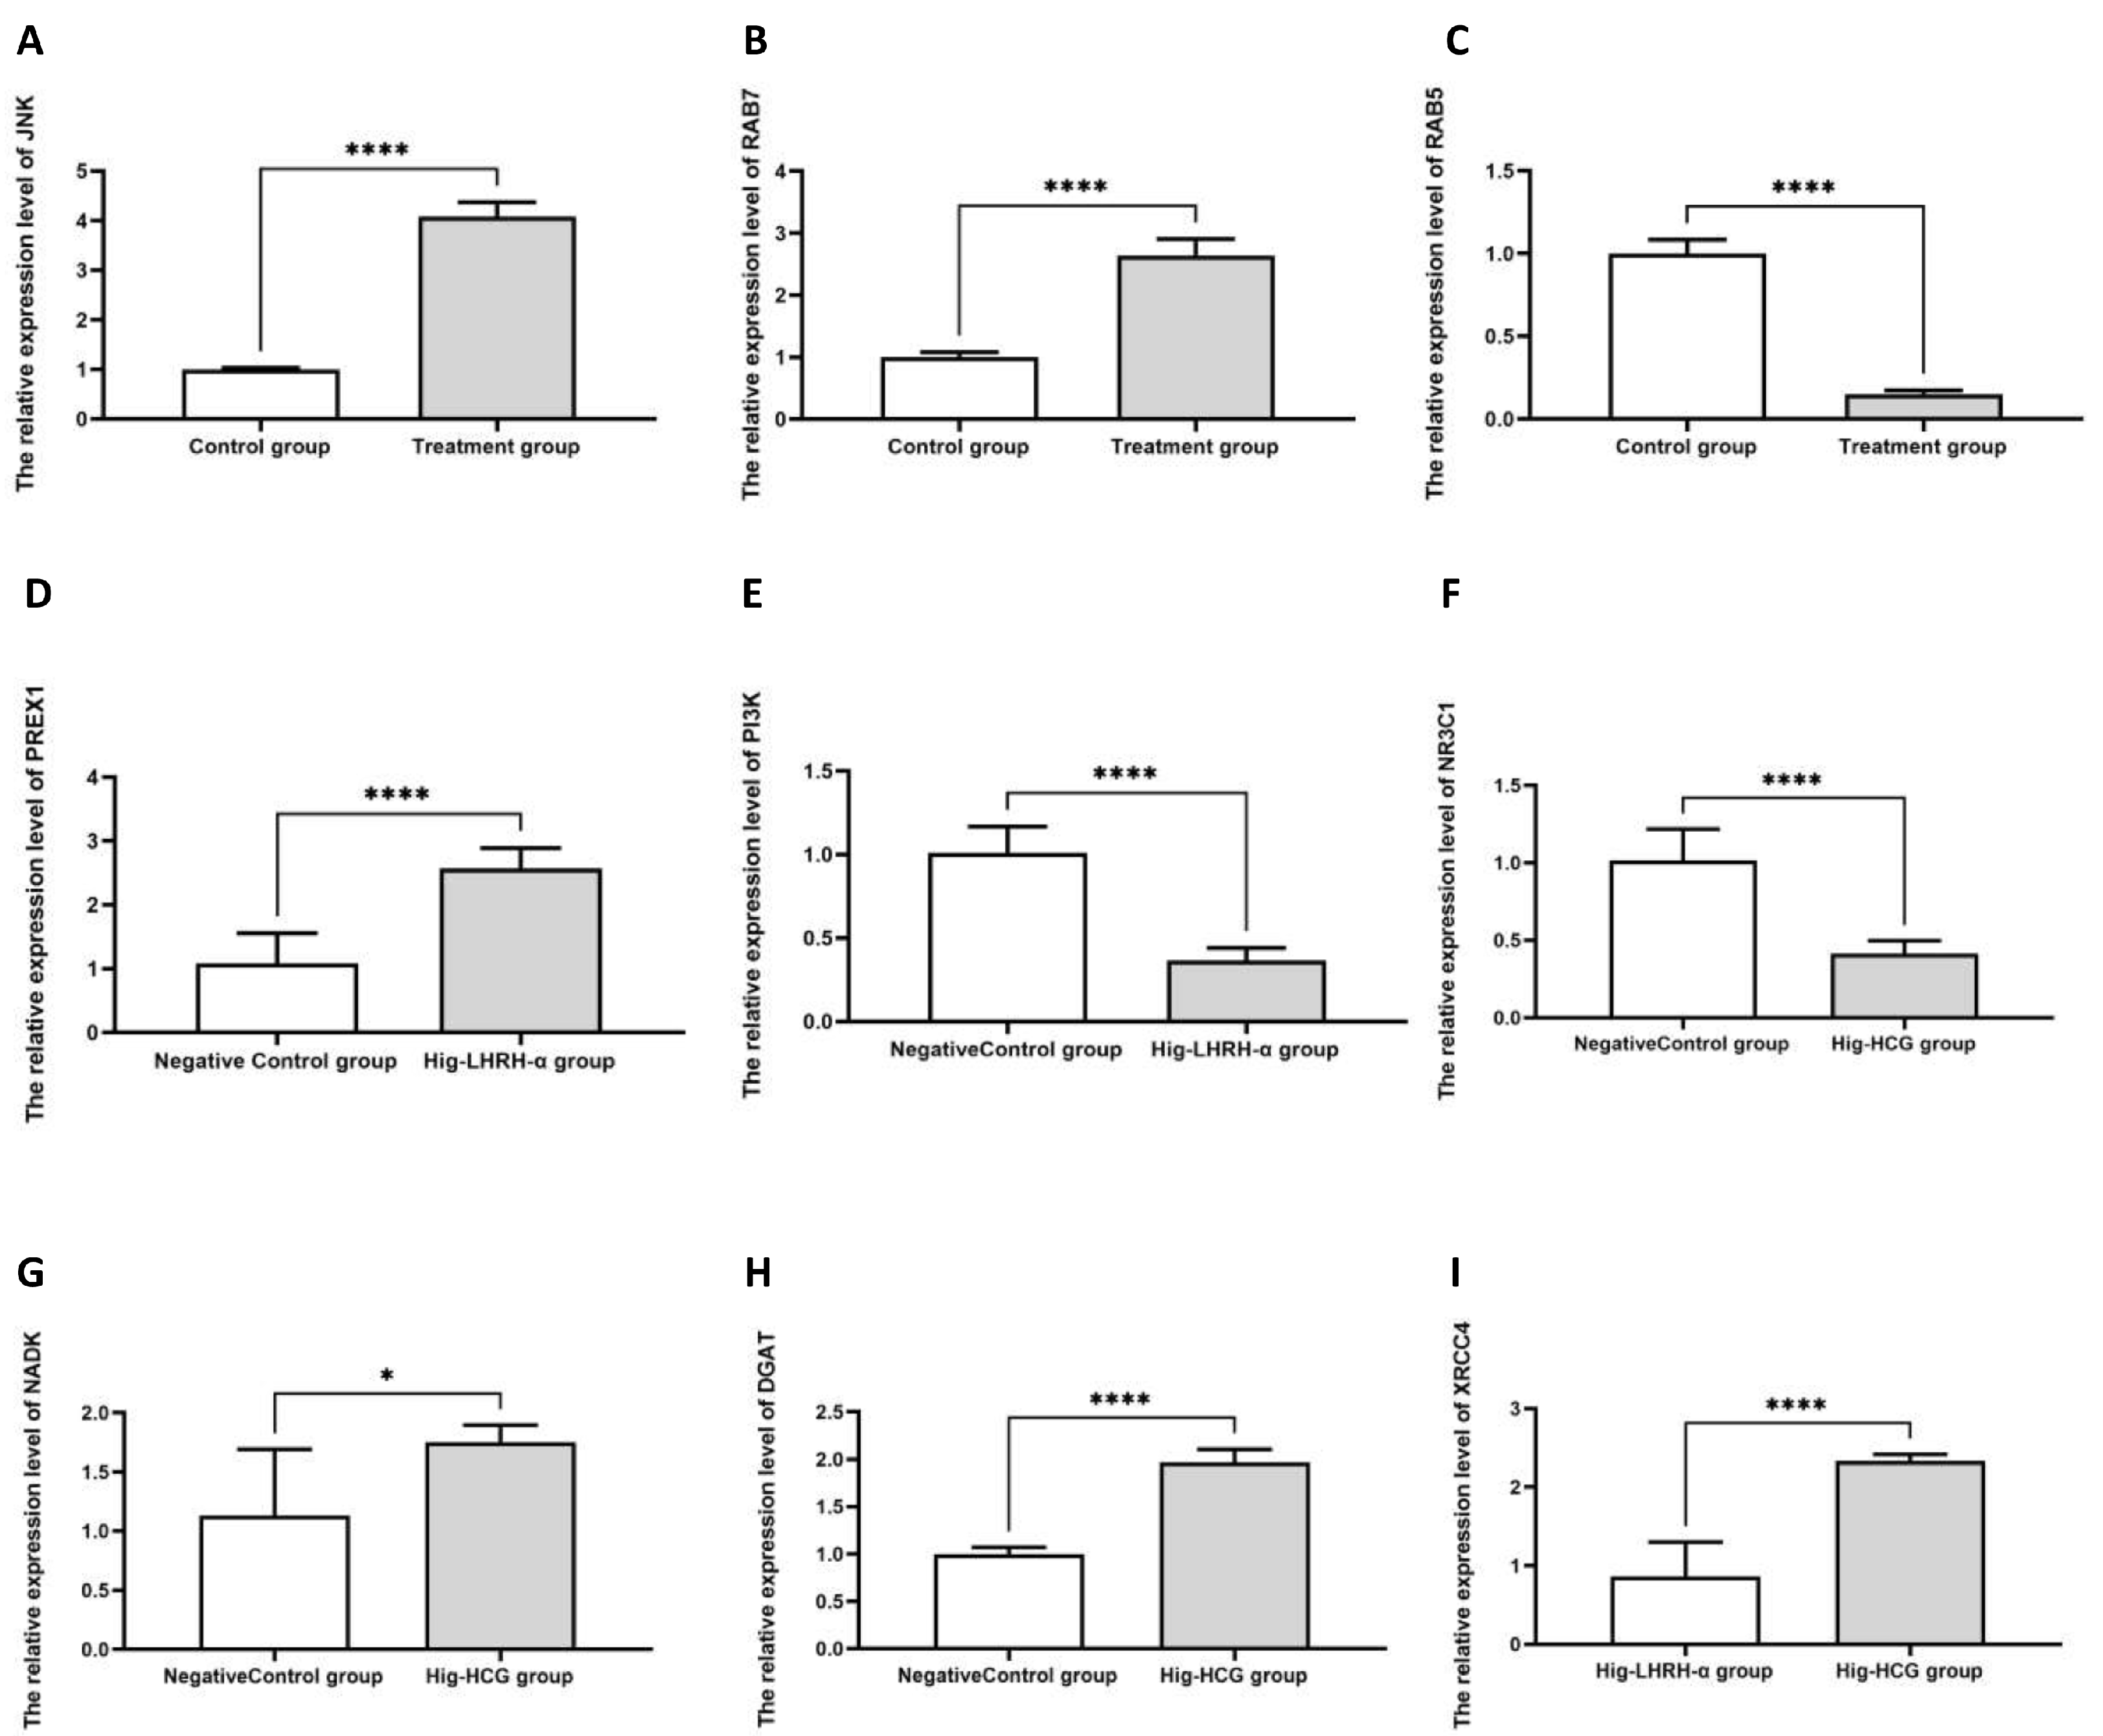
3.6. The Validated Results of qRT-PCR

To verify the accuracy of the transcriptome sequencing data, we validated nine DEGs in this study using qRT-PCR. The relative expression levels of each gene are shown in Figure 8. The results show that the gene expression trends are consistent, indicating the reliability of the transcriptome sequencing data in this study.

4. Discussion

Prior research has demonstrated that under singular exposure conditions, both Cu and Cd can disrupt the reproduction, hatching, and larval development of various aquatic species [43,44]. For example, Cd exposure can decrease the release of ovarian steroids in Japanese medaka (Oryzias latipes) [45]. Similarly, exposure to high levels of Cu can cause endocrine disruption in the three-spined stickleback (Gasterosteus aculeatus) [46]. Both Cu and Cd induce similar signs of reproductive toxicity in fish; however, Cd, a non-essential element for fish, can be toxic to aquatic life even at trace levels [47]. Conversely, Cu is an essential metal for fish at trace levels, but it can be toxic at excessive levels [48]. Tilapia can slowly adapt to high Cu levels and gradually regulate its homeostasis when exposed to sub-lethal concentrations of Cu [49]. It has been reported that the integrity of specific tissues in tilapia is restored 10 days after the reduction in the Cu concentration [50]. The mechanisms of reproductive toxicity caused by different heavy metal exposures are apparently different. Given that many heavy metal pollutants in the aquatic environment often exist in the form of complexes [51], the effects of Cu-Cd interactions have been rarely reported. In this study, we found that while Cu and Cd compete for absorption in the reproductive tissues of tilapia, co-exposure also results in growth and reproductive impairments in tilapia. On a microscopic level, it delays the development of oocytes. Meanwhile, on a macroscopic level, exposure to these heavy metals reduces the G.S.I of fish, an important indicator for assessing the ovarian development status of fish [52]. The downregulation of G.S.I caused by co-exposure to Cu and Cd indicates that the reproductive capacity of tilapia has been severely affected. The hypothalamic–pituitary–gonadal (HPG) axis is a crucial regulatory pathway for gonadal development in fish [53] and plays a central role in the regulation of reproductive development in fish [54]. Changes in the regulatory level of the HPG axis under environmental disturbances can hinder gametogenesis [55]. GnRH, located upstream of the HPG axis, is a key regulatory factor [56]. Once GnRH (secreted by the hypothalamus) reaches the pituitary, it activates the specific signaling pathway, upregulating the transcription, synthesis, and secretion of GTH. GTH enters the gonads through the blood, regulating gonadal development and promoting sexual maturation by stimulating the production of sex steroid hormones (such as E2). Subsequently, sex steroid hormones inhibit the synthesis of GnRH in the hypothalamus through negative feedback [54]. To determine the specific mechanisms of ovarian tissue microstructural damage, we measured the serum sex hormone levels of the treated tilapia. The levels of GnRH, GTH, and E2 were all downregulated to varying degrees. On the other hand, VTG is a precursor of vitellogenin, which is produced after estrogen binds to specific estrogen receptors (SERs) in the liver, and VTG is either absent or present at very low concentrations in males and juvenile fish [57]. The content of VTG marks the level of nutrient transport and deposition in oocytes [58]. The current results show that after heavy metal treatment, the serum VTG level of tilapia is downregulated, showing the result of the disorder of the regulation of the HPG axis in tilapia, which in turn leads to a decrease in the nutrient transport capacity of the ovaries, exacerbating ovarian developmental delay. In summary, these observations suggest that exposing tilapia to mixed heavy metal culture water regulates several levels of HPG axis signaling and VTG levels, each of which could potentially impair reproductive performance, ultimately leading to delayed ovarian development.
Research into the interactions among different metals in animals has been conducted since the 1990s [59]. Initial in vivo studies on heavy metal interactions were carried out on mammals, such as investigations into whether Cd or mercury could replace Zn and Cu in metallothioneins in rat livers exposed to Cu [60]. More recently, aquatic organisms were used for in vivo studies of heavy metal interactions. For instance, a study on rainbow trout (Oncorhynchus mykiss) exposed to combined Cu-Cd for 28 days found that systemic Cu accumulation was enhanced in the early stages, while Cd accumulation was enhanced in the later stages [61].
In this study, at the beginning of the experiment, a slight decrease in the Cu2+ content was observed in the treatment group. We believe that this might be attributed to copper being an essential trace element in biological organisms, playing a significant role in the development of gonads [62]. This illusion is caused by the varying capacities of individuals to absorb metal ions. Under the current experimental conditions, this variance cannot be eliminated. In this study, we primarily selected tilapia from the same source to minimize the impact of individual absorption differences, and we also controlled the content of all heavy metals across groups to ensure that the inter-group differences were not significant. Therefore, it can be inferred that the metal ion content was approximately the same between the control and treatment groups at the start. However, after the combined exposure to heavy metals, a decrease in the total content of Cu2+ and Cd2+ ions in the ovaries of the tilapia was able to be observed. Further analysis revealed that the decrease in Cu2+ was the primary cause, while a significant increase in Cd2+ content was detected. This suggests the occurrence of in vivo interactions between the two heavy metal ions in tilapia ovaries. To investigate the molecular implications of heavy metal interactions and elucidate their restorative role in hormone therapy, we performed transcriptomic analyses on five groups, namely the control group, treated group, negative control group, hig-HCG group, and hig-LHRH-α group. The selection criteria for the study subjects were based on serum sex hormone levels, with the hig-HCG group and hig-LHRH-α group inducing higher specific serum sex hormone levels in tilapia under identical recovery conditions after injection. Therefore, these groups were selected for transcriptomic analysis.
Fish maintain a Cu2+ balance system through a hierarchical network of Cu-binding proteins, which control the cellular uptake, storage, transport, and excretion of Cu [63]. Key proteins regulating cellular Cu homeostasis include the high-affinity copper transporter CTR1, responsible for cellular copper uptake [64], and copper ATPase (ATP7A), responsible for delivering Cu to copper enzymes and excreting Cu in cases of Cu overload [65]. ATP7A is an ATP-dependent Cu transporter present in all vertebrates and is crucial for maintaining intracellular and whole-body Cu homeostasis [63]. In our study, the regulation of GTPase activity was frequently mentioned in the GO enrichment pathway of the comparison groups of the blank control group and the treatment group. GTPase plays a vital “gate” role in many biological processes and is a widely used “molecular switch” [66]. It can effectively open or close interactions with other macromolecules by causing conformational changes through binding and hydrolysis [67]. Among them, many small GTPase Rab proteins are specific components involved in the recognition and pairing regulation process of transport vesicles in the membrane transport process [68,69,70]. The complexity of these Rab proteins constitutes the diversity of membrane transport pathways [71]. Rab5 and Rab7, both members of the small GTPase superfamily, have been the focus of numerous studies [72]. These studies have demonstrated that Rab5 and Rab7 each regulate distinct processes, ranging from the plasma membrane to the endosome [73,74,75]. Furthermore, both have been confirmed as key factors in the cellular regulation of ATP7A [72]. By analyzing the transcriptome of the blank control group and the treatment group, we detected 1792 differential genes, including Rab5 and Rab7. We later used qRT-PCR to verify the reliability of the transcriptome, indicating that Cd may affect the level of Cu2+ in cells by affecting specific transport receptors for Cu. It is worth mentioning that we did not identify changes in the gene expression of CTR1 protein related to Cu uptake in the differential genes, indicating that ATP7A may be a key site for heavy metal regulation. However, the experimental results need to be analyzed further. In summary, the functional changes in ATP7A initially explain the molecular mechanism of Cu-Cd interactions in vivo.
It is generally believed that the toxicity of Cu and Cd to aquatic organisms may be related to the production of reactive oxygen species (ROS), which can disrupt the physiological process of ovarian development [76,77,78] and induce oxidative stress. In an experiment on rare minnow (Gobiocypris rarus), researchers exposed female rare minnow in water to single and compound Cu and Cd. The results showed that single or combined exposure to Cu and Cd caused significant damage to the lipid and tissue structure of fish gills, liver, and ovaries. Compared with single Cu or Cd exposure, combined exposure to Cu and Cd can induce an increase in the mRNA expression of most antioxidant genes and cause more severe damage to fish tissues. In our study, the MAPK (mitogen-activated protein kinase) signaling pathway was enriched in both the GO and KEGG enrichment results of the comparison groups of the blank control group and the treatment group. The MAPK signaling pathway is a key element in the cellular response to various biological stimuli and environmental stresses [79]. ROS can directly or indirectly activate various enzymes in the MAPK pathway, such as ERK, JNK, and p38 MAPK [79,80]. The activation of these enzymes can lead to cellular stress responses, such as inflammation and cell death [81,82]. Therefore, abnormal activation of the MAPK signaling pathway is often closely related to oxidative stress [83]. Therefore, the activation of the MAPK signaling pathway can be seen as a marker of oxidative stress in tilapia ovaries and is an important regulatory mechanism for the ovarian response to oxidative stress. On the other hand, Cu is an important element in biology, and all organisms need Cu to complete basic physiological functions, including oxidative phosphorylation, blood clotting, angiogenesis, synthesis of polypeptide hormones, iron export, etc. [84]. Under physiological conditions, the availability of Cu in cells is particularly limited due to the presence of excess chelating capacity [85]. The presence of excess Cu is harmful to the body [86], but a lack of Cu is equally harmful, sometimes resulting in the occurrence of Menkes disease, demonstrating the importance of this element [87]. Copper/zinc superoxide dismutase (SOD1) is a ubiquitous cytoplasmic enzyme that requires a single bound Cu ion to catalyze the dismutation of superoxide, which is crucial for the antioxidant defense of all cells [87]. Studies have pointed out that the downregulation of the content of essential elements such as Cu in hepatocellular carcinoma tissues may lead to impaired liver superoxide dismutase activity [88]. Therefore, the decrease in Cu content may weaken the defense mechanism of antioxidant enzymes such as SOD in the body, leading to an increase in oxidative stress. This, in turn, affects the physiological process of ovarian development. It is worth mentioning that this effect may be a potential pathway for reproductive impairment caused by heavy metal exposure which may lead to delayed ovarian development, but further research into these results is needed.
In this study, we aimed to counteract the delay in ovarian development in tilapia caused by disruptions in the hypothalamic–pituitary–gonadal (HGP) axis. To achieve this, we utilized synthetically produced hormones to stimulate the normal function of the HGP axis. The hormone concentrations used were based on a previous study [89], and three concentration gradients were designed to demonstrate dosage effects. Overall, the injection of LHRH-α and HCG successfully upregulated the G.S.I value of the ovaries of tilapia exposed to heavy metals, as well as the serum levels of vtg, GnRH, Gth, and E2. Despite certain limitations in this experiment, such as the lack of significant differences between some groups due to insufficient recovery time, the observed changes in hormone levels suggest that our proposed remediation method is effective. In fish, LHRH-α is known to be a key regulator of ovarian development, stimulating the pituitary gland to secrete the GTH hormone, which subsequently influences ovarian development and maturation [90]. LHRH-α plays a similar role in inducing maturation and ovulation in fish [91]. Our study revealed that the injection of LHRH-α led to changes in the regulation of cellular signaling pathways in the ovaries, such as the chemokine signaling pathway and the mTOR signaling pathway. These changes may highlight the role of LHRH-α in promoting ovarian development. The chemokine signaling pathway is a complex network involved in cell-to-cell communication, playing a pivotal role in biological processes such as cell migration, inflammation, and immune responses [92]. The mTOR signaling pathway is a key cellular growth and metabolic regulation pathway, playing a crucial role in many biological processes, including protein synthesis, cell growth and proliferation, and autophagy [93]. The injection of LHRH-α may stimulate some mechanisms, enhancing the activity of chemokine receptors and mTOR signaling, thereby promoting ovarian development and the migration and proliferation of ovarian cells. HCG is widely used in fish as a tool for inducing ovulation and reproduction [94]. HCG promotes ovarian development and ovulation by mimicking the action of the luteinizing hormone (LH) [95]. In this experiment, we observed that the injection of HCG led to changes in the regulation of the glucocorticoid receptor signaling pathway and nicotinate and nicotinamide metabolism, as well as changes in the negative regulation of fat cell differentiation and fat digestion and absorption, pathways involved in the regulation of adipocyte development and function. These changes, different from those seen with LHRH-α, suggest that the injection of different drugs may activate multiple mechanisms to promote ovarian development. In summary, glucocorticoids are a class of important hormones that can regulate many physiological processes, including immune responses, metabolism, and development [96,97]. In the ovaries, glucocorticoid receptors may regulate follicle maturation and ovulation [98]. Therefore, HCG may influence ovarian development by regulating the glucocorticoid receptor signaling pathway. Secondly, nicotinate and nicotinamide are two forms of vitamin B3, important precursors for the synthesis of NAD+ and NADP+, which play key roles in many biological processes, including energy metabolism and DNA repair [99]. In the ovaries, NAD+ and NADP+ may influence follicle maturation and ovulation [100]. Therefore, HCG may influence ovarian development by altering the nicotinate and nicotinamide metabolism pathway. Additionally, changes in the negative regulation of adipocyte differentiation and fat digestion and absorption pathways may also influence ovarian development. In the ovaries, adipocytes may influence follicle maturation and ovulation [101]. Therefore, HCG may influence ovarian development by regulating adipocyte differentiation and fat digestion and absorption pathways. We also analyzed the comparison groups in the hig-LHRH-α group and the hig-HCG group. Only changes in the non-homologous end-joining (NHEJ) pathway were found. This is somewhat perplexing, as the NHEJ pathway is a major DNA double-strand break (DSB) repair mechanism which plays a critical role in maintaining genome stability and preventing gene mutations [102]. Limited by our experimental conditions, we cannot offer an explanation for this difference. These results require further experimental verification, and further study of how HCG and LHRH affect ovarian development through the NHEJ pathway may be of great significance.

5. Conclusions

Our study on Nile tilapia under concurrent Cu and Cd stress reveals significant insights into the impact of these heavy metals on fish reproductive health. We found that Cu and Cd compete for absorption in reproductive tissues, particularly in the ovaries, leading to Cu deficiency and associated growth and reproductive disorders. Our intervention using LHRH-α and HCG injections proved effective in mitigating these effects, as evidenced by improved ovarian development markers, such as G.S.I values, and increased levels of VTG, GnRH, GTH, and E2. Transcriptome analysis of the collected samples unveiled abnormal expression of the MAPK signaling pathway and GTPase activity regulation pathway in the group treated with heavy metals. In addition, transcriptome analysis performed post-treatment highlighted the distinct molecular actions of LHRH-α and HCG, suggesting their potential to promote ovarian health beyond the HPG axis.

Supplementary Materials

The following supporting information can be downloaded at: https://www.mdpi.com/article/10.3390/fishes9020067/s1, Text S1: Sample digestion methods and validation of methods.

Author Contributions

Conceptualization, T.H. and Y.L.; methodology, Y.W.; software, Y.W.; validation, X.Y., L.C. and J.X.; formal analysis, L.C., X.W. and L.L.; investigation, Y.W.; resources, Z.M., Z.T. and Z.G.; data curation, Z.T, F.C. and G.T.; writing—original draft preparation, Y.W.; writing—review and editing, T.H.; visualization, H.T. and X.W.; supervision, Y.L.; project administration, Y.L.; funding acquisition, Y.L. All authors have read and agreed to the published version of the manuscript.

Funding

This research was funded by the National Natural Science Foundation of China (31960733), the Construction Project of National Modern Agricultural Industrial Technology System (CARS-46), National Key Research and Development Program of China “Technological Innovation of Blue Granary” (2018YFD0900601), and the National Modern Agricultural Industrial Technology System Guangxi Characteristic Freshwater Fish Innovation Team Disease Prevention and Control post Functional Expert Project (nycytxgxcxtd-2021–08).

Institutional Review Board Statement

This study was conducted in accordance with the Chinese guidelines for the care and use of laboratory animals and was approved by the Ethics Committee of the Animal Experimentation Ethics Review Form of Guangxi Academy of Fisheries Sciences (No. GAFS2021001).

Informed Consent Statement

Not applicable.

Data Availability Statement

The results of all the raw data can be obtained from the NCBI Sequence Read Archive database (https://www.ncbi.nlm.nih.gov/bioproject/PRJNA1001065, accessed on 7 February 2024).

Conflicts of Interest

The authors declare no conflicts of interest.

References

  1. Béné, C.; Arthur, R.; Norbury, H.; Allison, E.H.; Beveridge, M.; Bush, S.; Campling, L.; Leschen, W.; Little, D.; Squires, D.; et al. Contribution of Fisheries and Aquaculture to Food Security and Poverty Reduction: Assessing the Current Evidence. World Dev. 2016, 79, 177–196. [Google Scholar] [CrossRef]
  2. Emenike, E.C.; Iwuozor, K.O.; Anidiobi, S.U. Heavy Metal Pollution in Aquaculture: Sources, Impacts and Mitigation Techniques. Biol. Trace Elem. Res. 2022, 200, 4476–4492. [Google Scholar] [CrossRef] [PubMed]
  3. Dean, R.J.; Shimmield, T.M.; Black, K.D. Copper, zinc and cadmium in marine cage fish farm sediments: An extensive survey. Environ. Pollut. 2007, 145, 84–95. [Google Scholar] [CrossRef]
  4. Adhikari, S.; Ghosh, L.; Rai, S.P.; Ayyappan, S. Metal concentrations in water, sediment, and fish from sewage-fed aquaculture ponds of Kolkata, India. Environ. Monit. Assess. 2009, 159, 217–230. [Google Scholar] [CrossRef] [PubMed]
  5. Perea-Juárez, R.N.; Frías-Espericueta, M.G.; Páez-Osuna, F.; Voltolina, D. Copper, zinc, cadmium and lead inputs and outputs in the maternity section of a commercial shrimp hatchery. Lat. Am. J. Aquat. Res. 2016, 44, 595–601. [Google Scholar] [CrossRef]
  6. Salami, I.R.S.; Rahmawati, S.; Indri, R.; Sutarto, H.; Jaya, P.M. Accumulation of Heavy Metals in Freshwater Fish in Cage Aquaculture at Cirata Reservoir, West Java, Indonesia. In Environmental Challenges in the Pacific Basin; Carpenter, D.O., Ed.; Wiley-Blackwell: Malden, MA, USA, 2008; Volume 1140, pp. 290–296. [Google Scholar]
  7. Squadrone, S.; Brizio, P.; Stella, C.; Prearo, M.; Pastorino, P.; Serracca, L.; Ercolini, C.; Abete, M.C. Presence of trace metals in aquaculture marine ecosystems of the northwestern Mediterranean Sea (Italy). Environ. Pollut. 2016, 215, 77–83. [Google Scholar] [CrossRef]
  8. Dixit, R.; Wasiullah; Malaviya, D.; Pandiyan, K.; Singh, U.B.; Sahu, A.; Shukla, R.; Singh, B.P.; Rai, J.P.; Sharma, P.K.; et al. Bioremediation of Heavy Metals from Soil and Aquatic Environment: An Overview of Principles and Criteria of Fundamental Processes. Sustainability 2015, 7, 2189–2212. [Google Scholar] [CrossRef]
  9. Chen, C.W.; Kao, C.M.; Chen, C.F.; Dong, C.D. Distribution and accumulation of heavy metals in the sediments of Kaohsiung Harbor, Taiwan. Chemosphere 2007, 66, 1431–1440. [Google Scholar] [CrossRef]
  10. Tchounwou, P.B.; Yedjou, C.G.; Patlolla, A.K.; Sutton, D.J. Heavy metal toxicity and the environment. Mol. Clin. Environ. Toxicol. 2012, 3, 133–164. [Google Scholar] [CrossRef]
  11. Malhotra, N.; Ger, T.R.; Uapipatanakul, B.; Huang, J.C.; Chen, K.H.C.; Hsiao, C.D. Review of Copper and Copper Nanoparticle Toxicity in Fish. Nanomaterials 2020, 10, 28. [Google Scholar] [CrossRef]
  12. Thompson, J.; Bannigan, J. Cadmium: Toxic effects on the reproductive system and the embryo. Reprod. Toxicol. 2008, 25, 304–315. [Google Scholar] [CrossRef]
  13. Liu, Y.A.; Chen, Q.Q.; Li, Y.Q.; Bi, L.L.; Jin, L.B.; Peng, R.Y. Toxic Effects of Cadmium on Fish. Toxics 2022, 10, 19. [Google Scholar] [CrossRef]
  14. Jezierska, B.; Witeska, M. The metal uptake and accumulation in fish living in polluted waters. In Proceedings of the NATO Advanced Research Workshop on Viable Methods of Soil and Water Pollution Monitoring, Protection and Remediation, Cracow, Poland, 27 June–1 July 2006; pp. 107–114. [Google Scholar]
  15. Milla, S.; Depiereux, S.; Kestemont, P. The effects of estrogenic and androgenic endocrine disruptors on the immune system of fish: A review. Ecotoxicology 2011, 20, 305–319. [Google Scholar] [CrossRef] [PubMed]
  16. Schreck, C.B.; Tort, L. The concept of stress in fish. Fish Physiol. 2016, 35, 1–34. [Google Scholar]
  17. Atli, G.; Canli, M. Response of antioxidant system of freshwater fish Oreochromis niloticus to acute and chronic metal (Cd, Cu, Cr, Zn, Fe) exposures. Ecotox. Environ. Saf. 2010, 73, 1884–1889. [Google Scholar] [CrossRef] [PubMed]
  18. Atli, G.; Canli, M. Responses of metallothionein and reduced glutathione in a freshwater fish Oreochromis niloticus following metal exposures. Environ. Toxicol. Pharmacol. 2008, 25, 33–38. [Google Scholar] [CrossRef] [PubMed]
  19. Wang, X.L.; Sato, T.; Xing, B.S.; Tao, S. Health risks of heavy metals to the general public in Tianjin, China via consumption of vegetables and fish. Sci. Total Environ. 2005, 350, 28–37. [Google Scholar] [CrossRef] [PubMed]
  20. Wang, W.X.; Lampi, M.A.; Huang, X.D.; Gerhardt, K.; Dixon, D.G.; Greenberg, B.M. Assessment of Mixture Toxicity of Copper, Cadmium, and Phenanthrenequinone to the Marine Bacterium Vibrio fischeri. Environ. Toxicol. 2009, 24, 166–177. [Google Scholar] [CrossRef] [PubMed]
  21. Firat, Ö.; Kargin, F. Individual and Combined Effects of Heavy Metals on Serum Biochemistry of Nile Tilapia Oreochromis niloticus. Arch. Environ. Contam. Toxicol. 2010, 58, 151–157. [Google Scholar] [CrossRef] [PubMed]
  22. Cao, F.B.; Wang, N.B.; Zhang, M.; Dai, H.X.; Dawood, M.; Zhang, G.P.; Wu, F.B. Comparative study of alleviating effects of GSH, Se and Zn under combined contamination of cadmium and chromium in rice (Oryza sativa). Biometals 2013, 26, 297–308. [Google Scholar] [CrossRef]
  23. Yang, X.X.; Song, Y.F.; Kai, J.R.; Cao, X.F. Enzymatic biomarkers of earthworms Eisenia fetida in response to individual and combined cadmium and pyrene. Ecotoxicol. Environ. Saf. 2012, 86, 162–167. [Google Scholar] [CrossRef]
  24. Jeppe, K.J.; Carew, M.E.; Long, S.M.; Lee, S.F.; Pettigrove, V.; Hoffmann, A.A. Genes involved in cysteine metabolism of Chironomus tepperi are regulated differently by copper and by cadmium. Comp. Biochem. Physiol. C-Toxicol. Pharmacol. 2014, 162, 1–6. [Google Scholar] [CrossRef]
  25. Gebeyew, K.; Jiang, C.Y.; Gao, Q.H.; Zhang, L.P.; Zhu, H.H.; Tian, Y.S.; Wang, Q.; Wei, Y.Q.; Tan, Z.L.; Han, X.F. Cadmium Accumulation in the Goat Liver and Kidney Is Partially Promoted by the Upregulation of Metal Transporter Genes. Animals 2022, 12, 15. [Google Scholar] [CrossRef]
  26. Heo, D.H.; Baek, I.J.; Kang, H.J.; Kim, J.H.; Chang, M.; Jeong, M.Y.; Kim, T.H.; Choi, I.D.; Yun, C.W. Cadmium regulates copper homoeostasis by inhibiting the activity of Mac1, a transcriptional activator of the copper regulon, in Saccharomyces cerevisiae. Biochem. J. 2010, 431, 257–265. [Google Scholar] [CrossRef]
  27. El Asely, A.M.; Reda, R.M.; Salah, A.S.; Mahmoud, M.A.; Dawood, M.A.O. Overall performances of Nile tilapia (Oreochromis niloticus) associated with using vegetable oil sources under suboptimal temperature. Aquac. Nutr. 2020, 26, 1154–1163. [Google Scholar] [CrossRef]
  28. Almeida, J.A.; Diniz, Y.S.; Marques, S.F.G.; Faine, L.A.; Ribas, B.O.; Burneiko, R.C.; Novelli, E.L.B. The use of the oxidative stress responses as biomarkers in Nile tilapia (Oreochromis niloticus) exposed to in vivo cadmium contamination. Environ. Int. 2002, 27, 673–679. [Google Scholar] [CrossRef] [PubMed]
  29. Wu, S.M.; Lin, H.C.; Yang, W.L. The effects of maternal Cd on the metallothionein expression in tilapia (Oreochromis mossambicus) embryos and larvae. Aquat. Toxicol. 2008, 87, 296–302. [Google Scholar] [CrossRef] [PubMed]
  30. Parra, L.; Lloret, G.; Lloret, J.; Rodilla, M. Physical Sensors for Precision Aquaculture: A Review. IEEE Sens. J. 2018, 18, 3915–3923. [Google Scholar] [CrossRef]
  31. Wu, Y.J.; Huang, T.; Yan, X.; Xiao, J.; Ma, Z.R.; Luo, L.M.; Chen, L.T.; Cao, J.L.; Tang, Z.Y.; Wei, X.X.; et al. Effects of four hormones on the mitigation of ovarian damage in tilapia (Oreochromis niloticus) after copper and cadmium exposure. Aquat. Toxicol. 2023, 258, 8. [Google Scholar] [CrossRef] [PubMed]
  32. LaFrentz, B.R.; Shoemaker, C.A.; Klesius, P.H. Immunoproteomic analysis of the antibody response obtained in Nile tilapia following vaccination with a Streptococcus iniae vaccine. Vet. Microbiol. 2011, 152, 346–352. [Google Scholar] [CrossRef] [PubMed]
  33. Chen, S.F.; Zhou, Y.Q.; Chen, Y.R.; Gu, J. fastp: An ultra-fast all-in-one FASTQ preprocessor. Bioinformatics 2018, 34, 884–890. [Google Scholar] [CrossRef] [PubMed]
  34. Kim, D.; Landmead, B.; Salzberg, S.L. HISAT: A fast spliced aligner with low memory requirements. Nat. Methods 2015, 12, 357-U121. [Google Scholar] [CrossRef] [PubMed]
  35. Pertea, M.; Pertea, G.M.; Antonescu, C.M.; Chang, T.C.; Mendell, J.T.; Salzberg, S.L. StringTie enables improved reconstruction of a transcriptome from RNA-seq reads. Nat. Biotechnol. 2015, 33, 290–295. [Google Scholar] [CrossRef] [PubMed]
  36. Love, M.I.; Huber, W.; Anders, S. Moderated estimation of fold change and dispersion for RNA-seq data with DESeq2. Genome Biol. 2014, 15, 38. [Google Scholar] [CrossRef] [PubMed]
  37. Ashburner, M.; Ball, C.A.; Blake, J.A.; Botstein, D.; Butler, H.; Cherry, J.M.; Davis, A.P.; Dolinski, K.; Dwight, S.S.; Eppig, J.T.; et al. Gene Ontology: Tool for the unification of biology. Nat. Genet. 2000, 25, 25–29. [Google Scholar] [CrossRef] [PubMed]
  38. Mao, X.Z.; Cai, T.; Olyarchuk, J.G.; Wei, L.P. Automated genome annotation and pathway identification using the KEGG Orthology (KO) as a controlled vocabulary. Bioinformatics 2005, 21, 3787–3793. [Google Scholar] [CrossRef] [PubMed]
  39. Kozera, B.; Rapacz, M. Reference genes in real-time PCR. J. Appl. Genet. 2013, 54, 391–406. [Google Scholar] [CrossRef]
  40. Wang, J.J.; Xiao, J.; Zhang, J.Y.; Chen, H.X.; Li, D.; Li, L.Q.; Cao, J.L.; Xie, L.T.; Luo, Y.J. Effects of dietary Cu and Zn on the accumulation, oxidative stress and the expressions of immune-related genes in the livers of Nile tilapia (Oreochromis niloticus). Fish Shellfish Immunol. 2020, 100, 198–207. [Google Scholar] [CrossRef]
  41. Younis, N.A.; Laban, S.E.; Al-Mokaddem, A.K.; Attia, M.M. Immunological status and histopathological appraisal of farmed Oreochromis niloticus exposed to parasitic infections and heavy metal toxicity. Aquac. Int. 2020, 28, 2247–2262. [Google Scholar] [CrossRef]
  42. Livak, K.J.; Schmittgen, T.D. Analysis of relative gene expression data using real-time quantitative PCR and the 2-ΔΔCT method. Methods 2001, 25, 402–408. [Google Scholar] [CrossRef]
  43. Capriello, T.; Grimaldi, M.C.; Cofone, R.; D’Aniello, S.; Ferrandino, I. Effects of aluminium and cadmium on hatching and swimming ability in developing zebrafish. Chemosphere 2019, 222, 243–249. [Google Scholar] [CrossRef] [PubMed]
  44. Driessnack, M.K.; Matthews, A.L.; Raine, J.C.; Niyogi, S. Interactive effects of chronic waterborne copper and cadmium exposure on tissue-specific metal accumulation and reproduction in fathead minnow (Pimephales promelas). Comp. Biochem. Physiol. C-Toxicol. Pharmacol. 2016, 179, 165–173. [Google Scholar] [CrossRef]
  45. Tilton, S.C.; Foran, C.M.; Benson, W.H. Effects of cadmium on the reproductive axis of Japanese medaka (Oryzias latipes). Comp. Biochem. Physiol. C-Toxicol. Pharmacol. 2003, 136, 265–276. [Google Scholar] [CrossRef] [PubMed]
  46. Suvi, R.; Giovanna, M.; Katja, A. Experimental copper exposure, but not heat stress, leads to elevated intraovarian thyroid hormone levels in three-spined sticklebacks (Gasterosteus aculeatus). Ecotoxicology 2020, 29, 1431–1440. [Google Scholar] [CrossRef] [PubMed]
  47. Genchi, G.; Sinicropi, M.S.; Lauria, G.; Carocci, A.; Catalano, A. The Effects of Cadmium Toxicity. Int. J. Environ. Res. Public Health 2020, 17, 24. [Google Scholar] [CrossRef]
  48. Akan, J.C.; Mohmoud, S.; Yikala, B.S.; Ogugbuaja, V.O. Bioaccumulation of some heavy metals in fish samples from River Benue in Vinikilang, Adamawa State, Nigeria. Am. J. Anal. Chem. 2012, 3, 24468. [Google Scholar] [CrossRef]
  49. Pelgrom, S.; Lock, R.A.C.; Balm, P.H.M.; Bonga, S.E.W. Integrated physiological response of tilapia, Oreochromis mossambicus, to sublethal copper exposure. Aquat. Toxicol. 1995, 32, 303–320. [Google Scholar] [CrossRef]
  50. Bettini, S.; Ciani, F.; Franceschini, V. Recovery of the olfactory receptor neurons in the African Tilapia mariae following exposure to low copper level. Aquat. Toxicol. 2006, 76, 321–328. [Google Scholar] [CrossRef]
  51. Mowat, F.S.; Bundy, K.J. A mathematical algorithm to identify toxicity and prioritize pollutants in field sediments. Chemosphere 2002, 49, 499–513. [Google Scholar] [CrossRef]
  52. West, G. Methods of assessing ovarian development in fishes: A review. Aust. J. Mar. Freshw. Res. 1990, 41, 199–222. [Google Scholar] [CrossRef]
  53. Nagahama, Y. Endocrine regulation of gametogenesis in fish. Int. J. Dev. Biol. 1994, 38, 217–229. [Google Scholar]
  54. Chen, J.; Hu, W.; Zhu, Z.Y. Progress in studies of fish reproductive development regulation. Chin. Sci. Bull. 2013, 58, 7–16. [Google Scholar] [CrossRef]
  55. Bock, S.L.; Chow, M.I.; Forsgren, K.L.; Lema, S.C. Widespread alterations to hypothalamic-pituitary-gonadal (HPG) axis signaling underlie high temperature reproductive inhibition in the eurythermal sheepshead minnow (Cyprinodon ariegatus). Mol. Cell. Endocrinol. 2021, 537, 16. [Google Scholar] [CrossRef] [PubMed]
  56. Kavanaugh, S.I.; Nozaki, M.; Sower, S.A. Origins of gonadotropin-releasing hormone (GnRH) in vertebrates: Identification of a novel GnRH in a basal vertebrate, the sea lamprey. Endocrinology 2008, 149, 3860–3869. [Google Scholar] [CrossRef] [PubMed]
  57. Tyler, C.R.; vanderEerden, B.; Jobling, S.; Panter, G.; Sumpter, J.P. Measurement of vitellogenin, a biomarker for exposure to oestrogenic chemicals, in a wide variety of cyprinid fish. J. Comp. Physiol. B-Biochem. Syst. Environ. Physiol. 1996, 166, 418–426. [Google Scholar] [CrossRef]
  58. Zheng, X.C.; Liu, W.B.; Liu, J.D.; Zhang, C.Y.; Zhang, L.; Gao, F.; Zhang, D.D.; Chi, C. Dietary Supplementation With Icariin Affects Estrogen Synthesis, Vitellogenesis, and Oocyte Development in the Chinese Mitten Crab, Eriocheir sinensis. Front. Mar. Sci. 2020, 7, 13. [Google Scholar] [CrossRef]
  59. Babich, H.; Shopsis, C.; Borenfreund, E. In vitro cytotoxicity testing of aquatic pollutants (cadmium, copper, zinc, nickel) using established fish cell lines. Ecotoxicol. Environ. Saf. 1986, 11, 91–99. [Google Scholar] [CrossRef] [PubMed]
  60. Funk, A.E.; Day, F.A.; Brady, F.O. Displacement of zinc and copper from copper-induced metallothionein by cadmium and by mercury: In vivo and ex vivo studies. Comp. Biochem. Physiol. Part C Comp. Pharmacol. 1987, 86, 1–6. [Google Scholar] [CrossRef] [PubMed]
  61. Kamunde, C.; MacPhail, R. Metal-metal interactions of dietary cadmium, copper and zinc in rainbow trout, Oncorhynchus mykiss. Ecotoxicol. Environ. Saf. 2011, 74, 658–667. [Google Scholar] [CrossRef] [PubMed]
  62. Tuormaa, T.E. Chromium, selenium and copper and other trace minerals in health and reproduction. J. Orthomol. Med. 2000, 15, 145–156. [Google Scholar]
  63. Minghetti, M.; Leaver, M.J.; Taggart, J.B.; Casadei, E.; Auslander, M.; Tom, M.; George, S.G. Copper induces Cu-ATPase ATP7A mRNA in a fish cell line, SAF1. Comp. Biochem. Physiol. C-Toxicol. Pharmacol. 2011, 154, 93–99. [Google Scholar] [CrossRef]
  64. Puig, S.; Thiele, D.J. Molecular mechanisms of copper uptake and distribution. Curr. Opin. Chem. Biol. 2002, 6, 171–180. [Google Scholar] [CrossRef] [PubMed]
  65. Lutsenko, S.; Gupta, A.; Burkhead, J.L.; Zuzel, V. Cellular multitasking: The dual role of human Cu-ATPases in cofactor delivery and intracellular copper balance. Arch. Biochem. Biophys. 2008, 476, 22–32. [Google Scholar] [CrossRef] [PubMed]
  66. Blaby-Haas, C.E.; Flood, J.A.; de Crécy-Lagard, V.; Zamble, D.B. YeiR: A metal-binding GTPase from Escherichia coli involved in metal homeostasis. Metallomics 2012, 4, 488–497. [Google Scholar] [CrossRef] [PubMed]
  67. Vetter, I.R.; Wittinghofer, A. Signal transduction—The guanine nucleotide-binding switch in three dimensions. Science 2001, 294, 1299–1304. [Google Scholar] [CrossRef] [PubMed]
  68. Mukherjee, S.; Maxfield, F.R. Role of membrane organization and membrane domains in endocytic lipid trafficking. Traffic 2000, 1, 203–211. [Google Scholar] [CrossRef] [PubMed]
  69. McNew, J.A.; Parlati, F.; Fukuda, R.; Johnston, R.J.; Paz, K.; Paumet, F.; Söllner, T.H.; Rothman, J.E. Compartmental specificity of cellular membrane fusion encoded in SNARE proteins. Nature 2000, 407, 153–159. [Google Scholar] [CrossRef] [PubMed]
  70. Parlati, F.; McNew, J.A.; Fukuda, R.; Miller, R.; Söllner, T.H.; Rothman, J.E. Topological restriction of SNARE-dependent membrane fusion. Nature 2000, 407, 194–198. [Google Scholar] [CrossRef] [PubMed]
  71. Zerial, M.; McBride, H. Rab proteins as membrane organizers. Nat. Rev. Mol. Cell Biol. 2001, 2, 107–117. [Google Scholar] [CrossRef]
  72. Pascale, M.C.; Franceschelli, S.; Moltedo, O.; Belleudi, F.; Torrisi, M.R.; Bucci, C.; La Fontaine, S.; Mercer, J.F.B.; Leone, A. Endosomal trafficking of the Menkes copper ATPase ATP7A is mediated by vesicles containing the Rab7 and Rab5 GTPase proteins. Exp. Cell Res. 2003, 291, 377–385. [Google Scholar] [CrossRef]
  73. Lemmon, S.K.; Traub, L.M. Sorting in the endosomal system in yeast and animal cells. Curr. Opin. Cell Biol. 2000, 12, 457–466. [Google Scholar] [CrossRef] [PubMed]
  74. Sönnichsen, B.; De Renzis, S.; Nielsen, E.; Rietdorf, J.; Zerial, M. Distinct membrane domains on endosomes in the recycling pathway visualized by multicolor imaging of Rab4, Rab5 and Rab11. J. Cell Biol. 2000, 149, 901–913. [Google Scholar] [CrossRef] [PubMed]
  75. Bucci, C.; Parton, R.G.; Mather, I.H.; Stunnenberg, H.; Simons, K.; Hoflack, B.; Zerial, M. The small GTPase rab5 functions as a regulatory factor in the early endocytic pathway. Cell 1992, 70, 715–728. [Google Scholar] [CrossRef] [PubMed]
  76. Yuan, S.S.; Lv, Z.M.; Zhu, A.Y.; Zheng, J.L.; Wu, C.W. Negative effect of chronic cadmium exposure on growth, histology, ultrastructure, antioxidant and innate immune responses in the liver of zebrafish: Preventive role of blue light emitting diodes. Ecotoxicol. Environ. Saf. 2017, 139, 18–26. [Google Scholar] [CrossRef] [PubMed]
  77. Eyckmans, M.; Celis, N.; Horemans, N.; Blust, R.; De Boeck, G. Exposure to waterborne copper reveals differences in oxidative stress response in three freshwater fish species. Aquat. Toxicol. 2011, 103, 112–120. [Google Scholar] [CrossRef] [PubMed]
  78. Lushchak, V.I. Environmentally induced oxidative stress in aquatic animals. Aquat. Toxicol. 2011, 101, 13–30. [Google Scholar] [CrossRef] [PubMed]
  79. Cowan, K.J.; Storey, K.B. Mitogen-activated protein kinases: New signaling pathways functioning in cellular responses to environmental stress. J. Exp. Biol. 2003, 206, 1107–1115. [Google Scholar] [CrossRef] [PubMed]
  80. Torres, M.; Forman, H.J. Redox signaling and the MAP kinase pathways. Biofactors 2003, 17, 287–296. [Google Scholar] [CrossRef]
  81. Adhikari, S.; Bhatia, M. H2S-induced pancreatic acinar cell apoptosis is mediated via JNK and p38 MAP kinase. J. Cell. Mol. Med. 2008, 12, 1374–1383. [Google Scholar] [CrossRef]
  82. Chan, L.-P.; Liu, C.; Chiang, F.-Y.; Wang, L.-F.; Lee, K.-W.; Chen, W.-T.; Kuo, P.-L.; Liang, C.-H. IL-8 promotes inflammatory mediators and stimulates activation of p38 MAPK/ERK-NF-κB pathway and reduction of JNK in HNSCC. Oncotarget 2017, 8, 56375. [Google Scholar] [CrossRef]
  83. Son, Y.; Kim, S.; Chung, H.T.; Pae, H.O. Reactive Oxygen Species in the Activation of MAP Kinases. In Hydrogen Peroxide and Cell Signaling, Pt C; Cadenas, E., Packer, L., Eds.; Elsevier Academic Press Inc.: San Diego, CA, USA, 2013; Volume 528, pp. 27–48. [Google Scholar]
  84. Araya, M.; Pizarro, F.; Olivares, M.; Arredondo, M.; González, M.; Méndez, M. Understanding copper homeostasis in humans and copper effects on health. Biol. Res. 2006, 39, 183–187. [Google Scholar] [CrossRef]
  85. Rae, T.D.; Schmidt, P.J.; Pufahl, R.A.; Culotta, V.C.; O’Halloran, T.V. Undetectable intracellular free copper: The requirement of a copper chaperone for superoxide dismutase. Science 1999, 284, 805–808. [Google Scholar] [CrossRef]
  86. Zheng, J.L.; Yuan, S.S.; Wu, C.W.; Lv, Z.M. Acute exposure to waterborne cadmium induced oxidative stress and immunotoxicity in the brain, ovary and liver of zebrafish (Danio rerio). Aquat. Toxicol. 2016, 180, 36–44. [Google Scholar] [CrossRef]
  87. Tümer, Z.; Moller, L.B. Menkes disease. Eur. J. Hum. Genet. 2010, 18, 511–518. [Google Scholar] [CrossRef]
  88. Liaw, K.Y.; Lee, P.H.; Wu, F.C.; Tsai, J.S.; LinShiau, S.Y. Zinc, copper, and superoxide dismutase in hepatocellular carcinoma. Am. J. Gastroenterol. 1997, 92, 2260–2263. [Google Scholar]
  89. Xiao, J.; Zhou, Y.; Luo, Y.J.; Zhong, H.; Huang, Y.L.; Zhang, Y.; Luo, Z.J.; Ling, Z.B.; Zhang, M.; Gan, X. Suppression effect of LHRH-A and hCG on Piwi expression in testis of Nile tilapia Oreochromis niloticus. Gen. Comp. Endocrinol. 2013, 189, 43–50. [Google Scholar] [CrossRef]
  90. Ahmadnezhad, M.; Oryan, S.; Sahafi, H.H.; Khara, H. Effect of Synthetic Luteinizing Hormone—Releasing Hormone (LHRH-A2) Plus Pimozide and Chlorpromazine on Ovarian Development and Levels of Gonad Steroid Hormones in Female Kutum Rutilus frisii kutum. Turk. J. Fish. Quat. Sci. 2013, 13, 95–100. [Google Scholar] [CrossRef]
  91. Matsuyama, M.; Takeuchi, H.; Kashiwagi, M.; Hirose, K.; Kagawa, H. Induced gonadal development and spawning of immature red sea bream Pagrus major with LHRH-a administration in different ways during winter season. Fish. Sci. 1995, 61, 472–477. [Google Scholar] [CrossRef]
  92. Legler, D.F.; Thelen, M. New insights in chemokine signaling. FResearch 2018, 7. [Google Scholar] [CrossRef] [PubMed]
  93. Laplante, M.; Sabatini, D.M. mTOR Signaling in Growth Control and Disease. Cell 2012, 149, 274–293. [Google Scholar] [CrossRef] [PubMed]
  94. Li, J.Z.; Liu, Z.Q.; Kang, T.; Li, M.H.; Wang, D.S.; Cheng, C.H.K. Igf3: A novel player in fish reproduction. Biol. Reprod. 2021, 104, 1194–1204. [Google Scholar] [CrossRef]
  95. Elakkanai, P.; Francis, T.; Ahilan, B.; Jawahar, P.; Padmavathy, P.; Jayakumar, N.; Subburaj, A. Role of GnRH, HCG and Kisspeptin on reproduction of fishes. Indian J. Sci. Technol. 2015, 8, 65166. [Google Scholar] [CrossRef]
  96. Strehl, C.; Ehlers, L.; Gaber, T.; Buttgere, F. Glucocorticoids-All-Rounders Tackling the Versatile Players of the Immune System. Front. Immunol. 2019, 10, 20. [Google Scholar] [CrossRef]
  97. Busada, J.T.; Cidlowski, J.A. Mechanisms of Glucocorticoid Action During Development. In Nuclear Receptors in Development and Disease; Forrest, D., Tsai, S., Eds.; Elsevier Academic Press Inc.: San Diego, CA, USA, 2017; Volume 125, pp. 147–170. [Google Scholar]
  98. Whirledge, S.; Cidlowski, J.A. Glucocorticoids and Reproduction: Traffic Control on the Road to Reproduction. Trends Endocrinol. Metab. 2017, 28, 399–415. [Google Scholar] [CrossRef] [PubMed]
  99. Hashida, S.; Kawai-Yamada, M. Inter-Organelle NAD Metabolism Underpinning Light Responsive NADP Dynamics in Plants. Front. Plant Sci. 2019, 10, 7. [Google Scholar] [CrossRef] [PubMed]
  100. Pollard, C.L.; Gibb, Z.; Clulow, J.; Ruiz, A.; Sheridan, A.; Bahrami, M.; Swegen, A.; Grupen, C.G. Supplemental Nicotinic Acid Elevates NAD+Precursors in the Follicular Fluid of Mares. Animals 2022, 12, 12. [Google Scholar] [CrossRef] [PubMed]
  101. Leroy, J.; Vanholder, T.; Mateusen, B.; Christophe, A.; Opsomer, G.; de Kruif, A.; Genicot, G.; Van Soom, A. Non-esterified fatty acids in follicular fluid of dairy cows and their effect on developmental capacity of bovine oocytes in vitro. Reproduction 2005, 130, 485–495. [Google Scholar] [CrossRef] [PubMed]
  102. Bowater, R.; Doherty, A.J. Making ends meet: Repairing breaks in bacterial DNA by non-homologous end-joining. PLoS Genet. 2006, 2, 93–99. [Google Scholar] [CrossRef] [PubMed]
Figure 1. Bioaccumulation of Cu and Cd in ovaries of Nile tilapia. (A): initial Cu2+ content (n = 6); (B): initial Cd2+ content (n = 6); (C): total metal ion content (n = 6); (D): Cu2+ and Cd2+ content in each group (n = 6). The error bar represents standard deviation, (SD). * indicates p < 0.05, ** indicates p < 0.01, *** indicates p < 0.001.
Fishes 09 00067 g001
Figure 2. Effects on growth and ovarian development of tilapia. (A): initial body weight (n = 10); (B): initial G.S.I (n = 10); (C): body weight of each group (n = 10); (D): each group G.S.I. (n = 10). The error bar represents SD; *** indicates p < 0.001, **** indicates p < 0.0001.
Fishes 09 00067 g002
Figure 3. Influence of ovarian tissue structure on tilapia. (A): blank control group (before injection); (B): treatment group; (C): blank control group (72h after injection); (D): negative control group; (E): low-LHRH-α group; (F): mid-LHRH-α group; (G): hig-LHRH-α group; (H): low-HCG group; (I): mid-HCG group; (J): hig-HCG group; (K): diameter of oocytes in each group (n = 2). The error bar represents SD; **** indicates p < 0.0001.
Fishes 09 00067 g003
Figure 4. Effects of hormone levels on tilapia. (A): VTG content in each group (n = 6); (B): GnRH content in each group (n = 6); (C): GTH content in each group (n = 6); (D): E2 content in each group (n = 6). The error bar represents SD. * indicates p < 0.05, ** indicates p < 0.01, **** indicates p < 0.0001).
Fishes 09 00067 g004
Figure 5. The histogram of GO enrichment and classification. (A): blank control group vs. treatment group; (B): negative control group vs. hig-LHRH-α group; (C): negative control group vs. hig-HCG group; (D): hig-LHRH-α group vs. hig-HCG group.
Fishes 09 00067 g005
Figure 6. The bubble diagram of GO enrichment. (A): blank control group vs. treatment group; (B): negative control group vs. hig-LHRH-α group; (C): negative control group vs. hig-HCG group; (D): hig-LHRH-α group vs. hig-HCG group. Note: The vertical axis denotes pathway, and the abaxial axis denotes gene ratio.
Fishes 09 00067 g006
Figure 7. The bubble diagram of KEGG enrichment. (A): blank control group vs. treatment group; (B): negative control group vs. hig-LHRH-α group; (C): negative control group vs. hig-HCG group; (D): hig-LHRH-α group vs. hig-HCG group. Note: The vertical axis denotes pathway, and the abaxial axis denotes gene ratio.
Fishes 09 00067 g007
Figure 8. DEGs validated by qRT-PCR. (A): the relative expression level of JNK (n = 6); (B): the relative expression level of RAB5 (n = 6); (C): the relative expression level of RAB7A (n = 6); (D): the relative expression level of PREX1 (n = 6); (E): the relative expression level of PI3K (n = 6); (F): the relative expression level of NR3C1 (n = 6); (G): the relative expression level of NADK (n = 6); (H): the relative expression level of DGAT (n = 6); (I): the relative expression level of XRCC4 (n = 6). The error bar represents SD; * indicates p < 0.05, **** indicates p < 0.0001.
Fishes 09 00067 g008
Table 1. Experimental treatment procedure.
GroupFirst Experimental PhaseSecond Experimental Phase
Culture WaterNumber of OrganismsIntraperitoneal InjectionNumber of Organisms
Blank control groupAerated pure water96 (in 2 tanks; 48 per tank)Nothing48
Treatment groupNegative control groupWater containing 300 μg/L Cu2+ and 100 μg/L Cd2+384 (in 8 tanks; 48 per tank)PBS (200 μL)48
Low-LHRH-α group5 μg/g LHRH-α (in 200 μL PBS)48
Mid-LHRH-α group10 μg/g LHRH-α (in 200 μL PBS)48
Hig-LHRH-α group20 μg/g LHRH-α (in 200 μL PBS)48
Low-HCG group0.5 IU/g HCG (in 200 μL PBS)48
Mid-HCG group1.0 IU/g HCG (in 200 μL PBS)48
Hig-HCG group1.5 IU/g HCG (in 200 μL PBS)48
Table 2. Primer sequences were for quantitative real-time polymerase chain reaction.
NameGenBank Accession NumberSequence (5′–3′)
JNKNC_031984.2F-GCACAGCCAAGTGGAGGTAT
R-TGAGTGCTGCAAGGGCATTA
RAB5NC_031985.2F-CCCTACCGCAAAGTGGAGTT
R-GAGCCCTAAACTGGGCTTGA
RAB7ANC_031970.2F-TTTTGAAACCAGCGCCAAGG
R-AGAGTCTGTGTGCCGCTCTA
PREX1NC_031984.2F-TGCAATCAAGTCACGTGTAAAA
R-TACTCGCTGTCCCCTGATGA
PI3KNC_031982.2F-ACTTGTAGCCTTTCCCCGTG
R-GCACTCGGGGGAGAATCAAA
NR3C1NC_031966.2F-TGTGCGGAAATCTACGGAGT
R-GCTGGATTGATTTGGACGGC
NADKNC_031984.2F-GTGCTGCATGCTGATAAGGC
R-TTGGCAAGCACGCAAATACC
DGATNC_031985.2F-GATGCCTTTTCTATGGCCTGC
R-GCTTGTTTCGCAGACTGGTG
XRCC4NC_031977.2F-CAGCCCTGGTAACCACTCAG
R-ACTCATGCGAATTGTTGCCG
BETA-ACTINNC_031969.2F-ACTAGCGGAAGTTCACGAGC
R-GCAAAGCTGCTCAAAACCGA
Table 3. The summary of sequencing data in the current study.
CompareAllUpDown
Blank control group
vs.
Treatment group
1792977815
Negative control group
vs.
Hig-LHRH-α group
993663
Negative control group
vs.
Hig-HCG group
1213190
Hig-LHRH-α group
vs.
Hig-HCG group
752847
Disclaimer/Publisher’s Note: The statements, opinions and data contained in all publications are solely those of the individual author(s) and contributor(s) and not of MDPI and/or the editor(s). MDPI and/or the editor(s) disclaim responsibility for any injury to people or property resulting from any ideas, methods, instructions or products referred to in the content.

