
Effect of Toxicity of Chromium (VI) Stressors Alone and Combined to High Temperature on the Histopathological, Antioxidation, Immunity, and Energy Metabolism in Fish Phoxinus lagowskii


Abstract
1. Introduction
2. Materials and Methods
2.1. Fish
2.2. Experiment Design
2.3. Blood Collection and Tissue Sampling
2.4. Serum Cortisol Concentrations
2.5. Histological Observation
2.6. Qualitative and Semi-Quantitative Tissue Analyses
2.7. Biochemical Parameters Determination
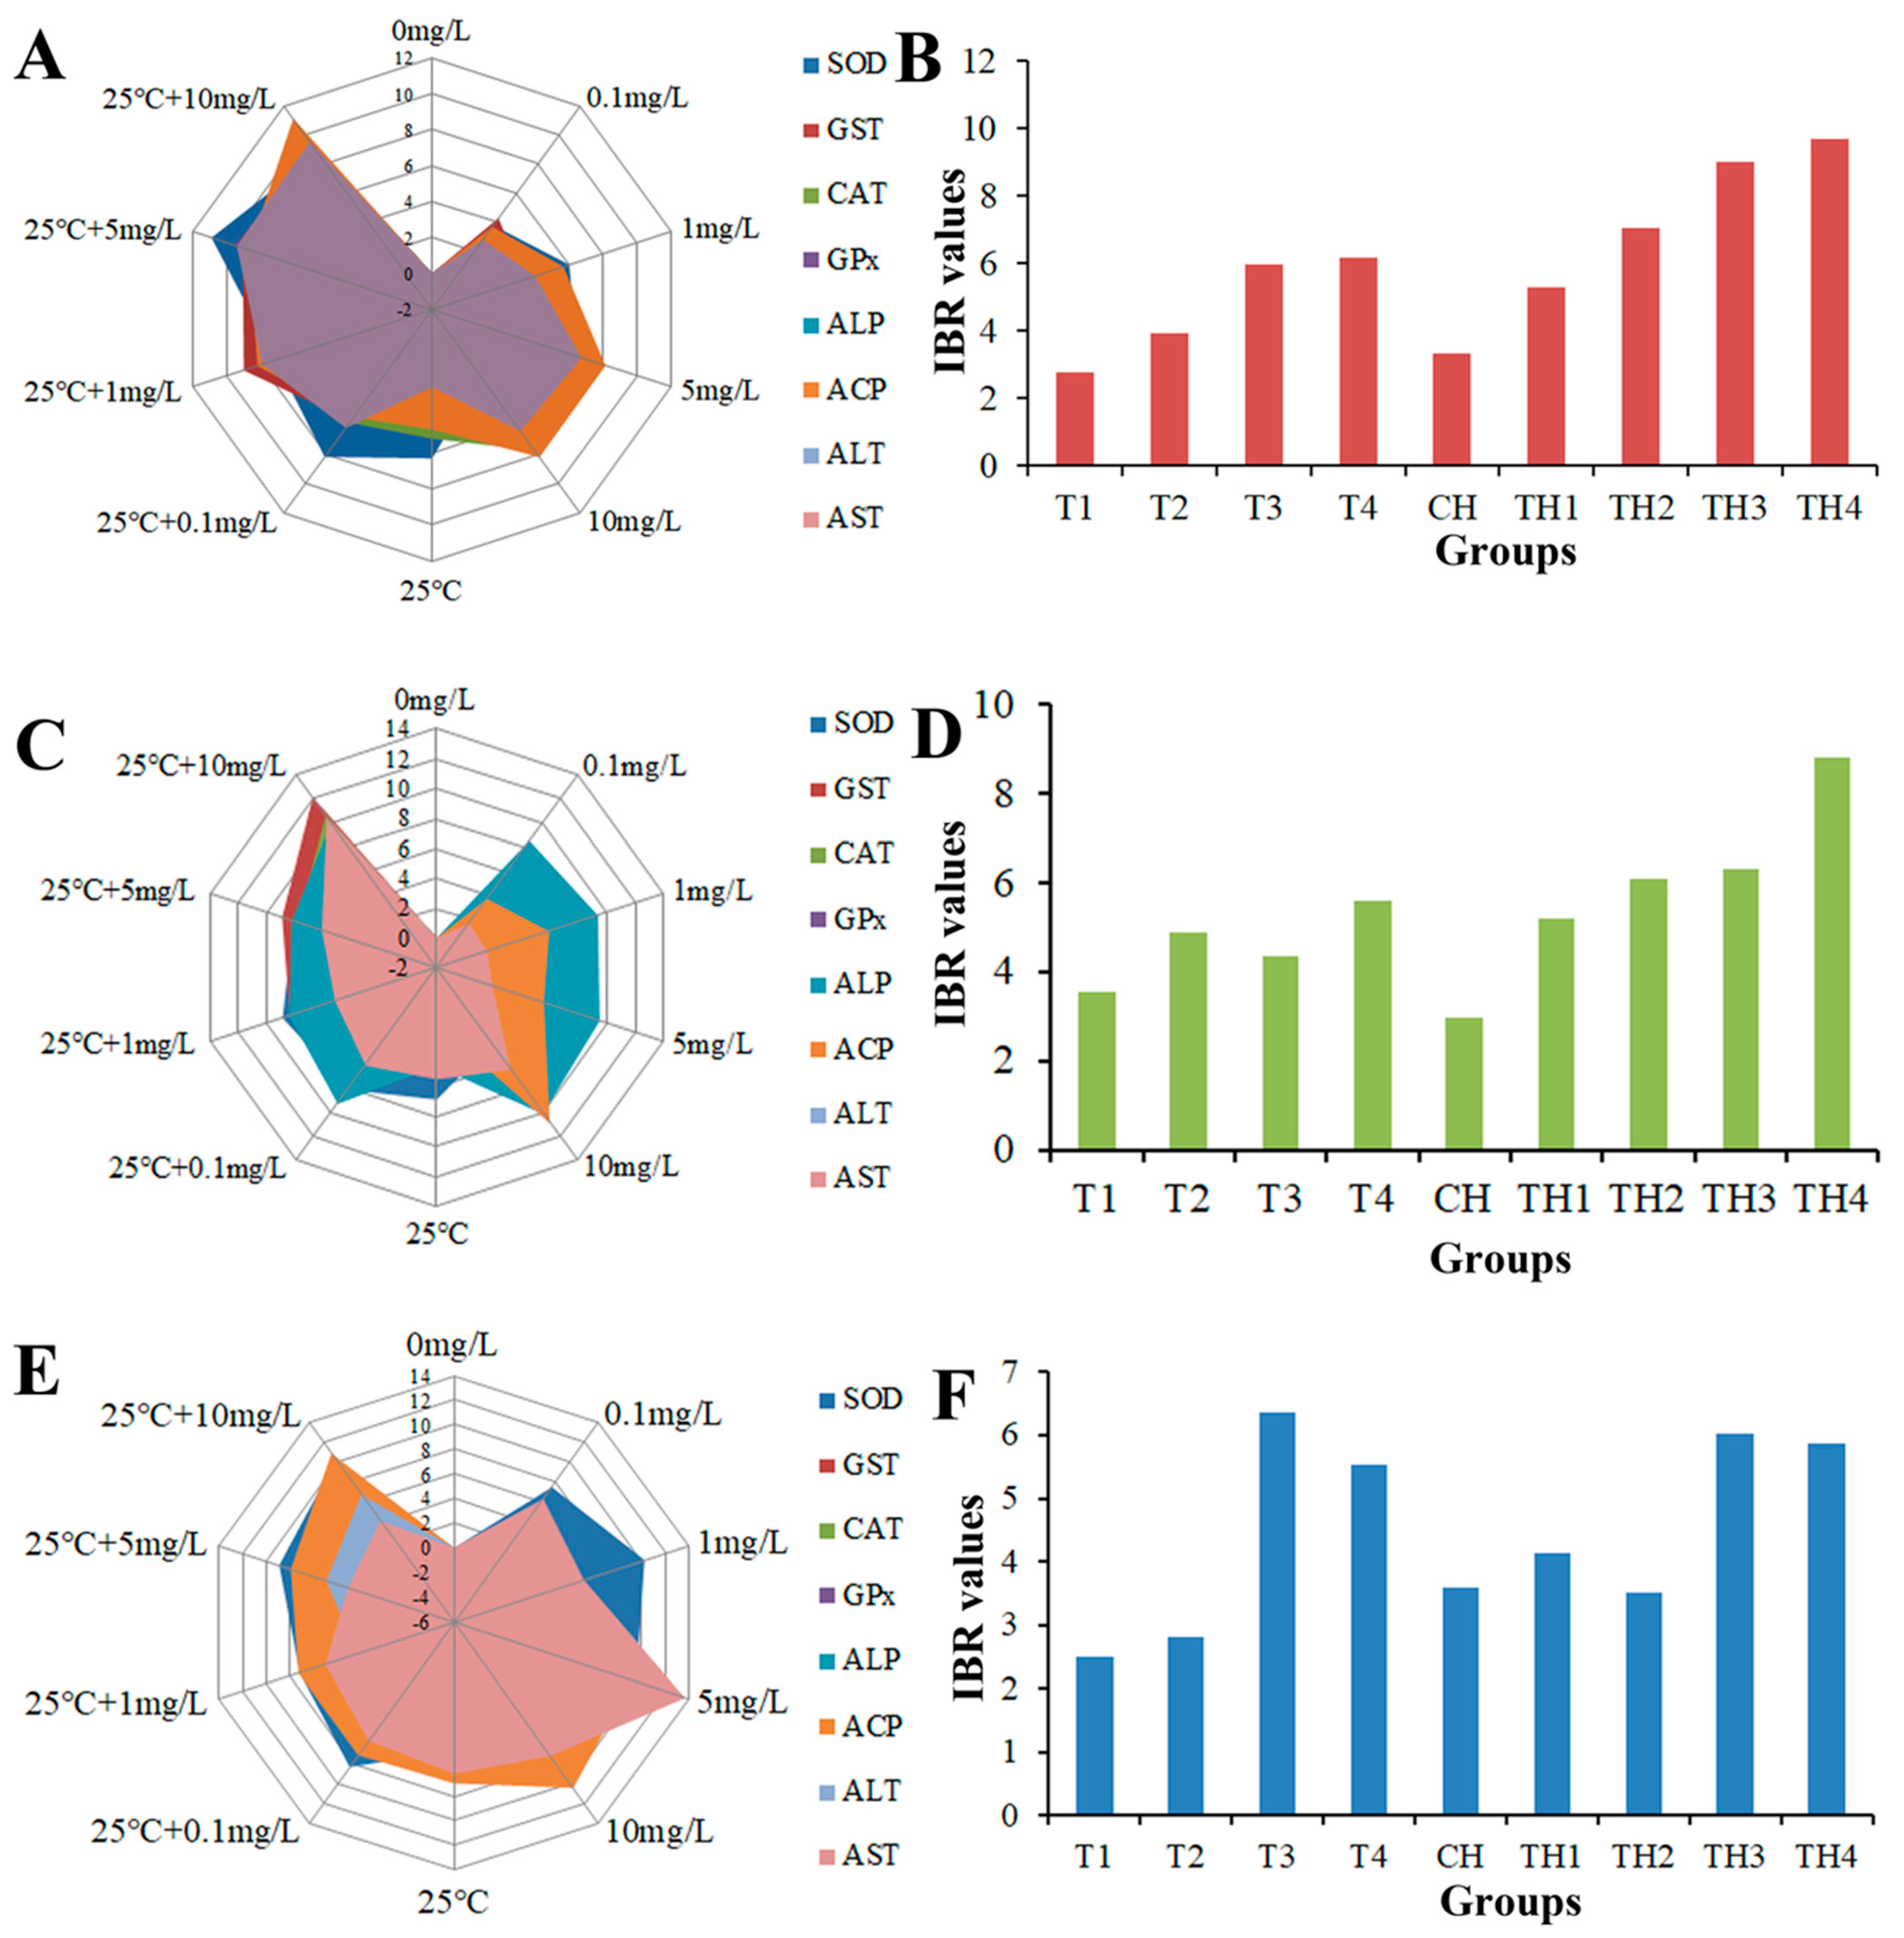
2.8. Integrated Biomarker Response (IBR)
2.9. Data Analysis
3. Results
3.1. Toxicity Tests
3.2. Histopathology of Liver, Gills, and Kidneys
3.2.1. Liver
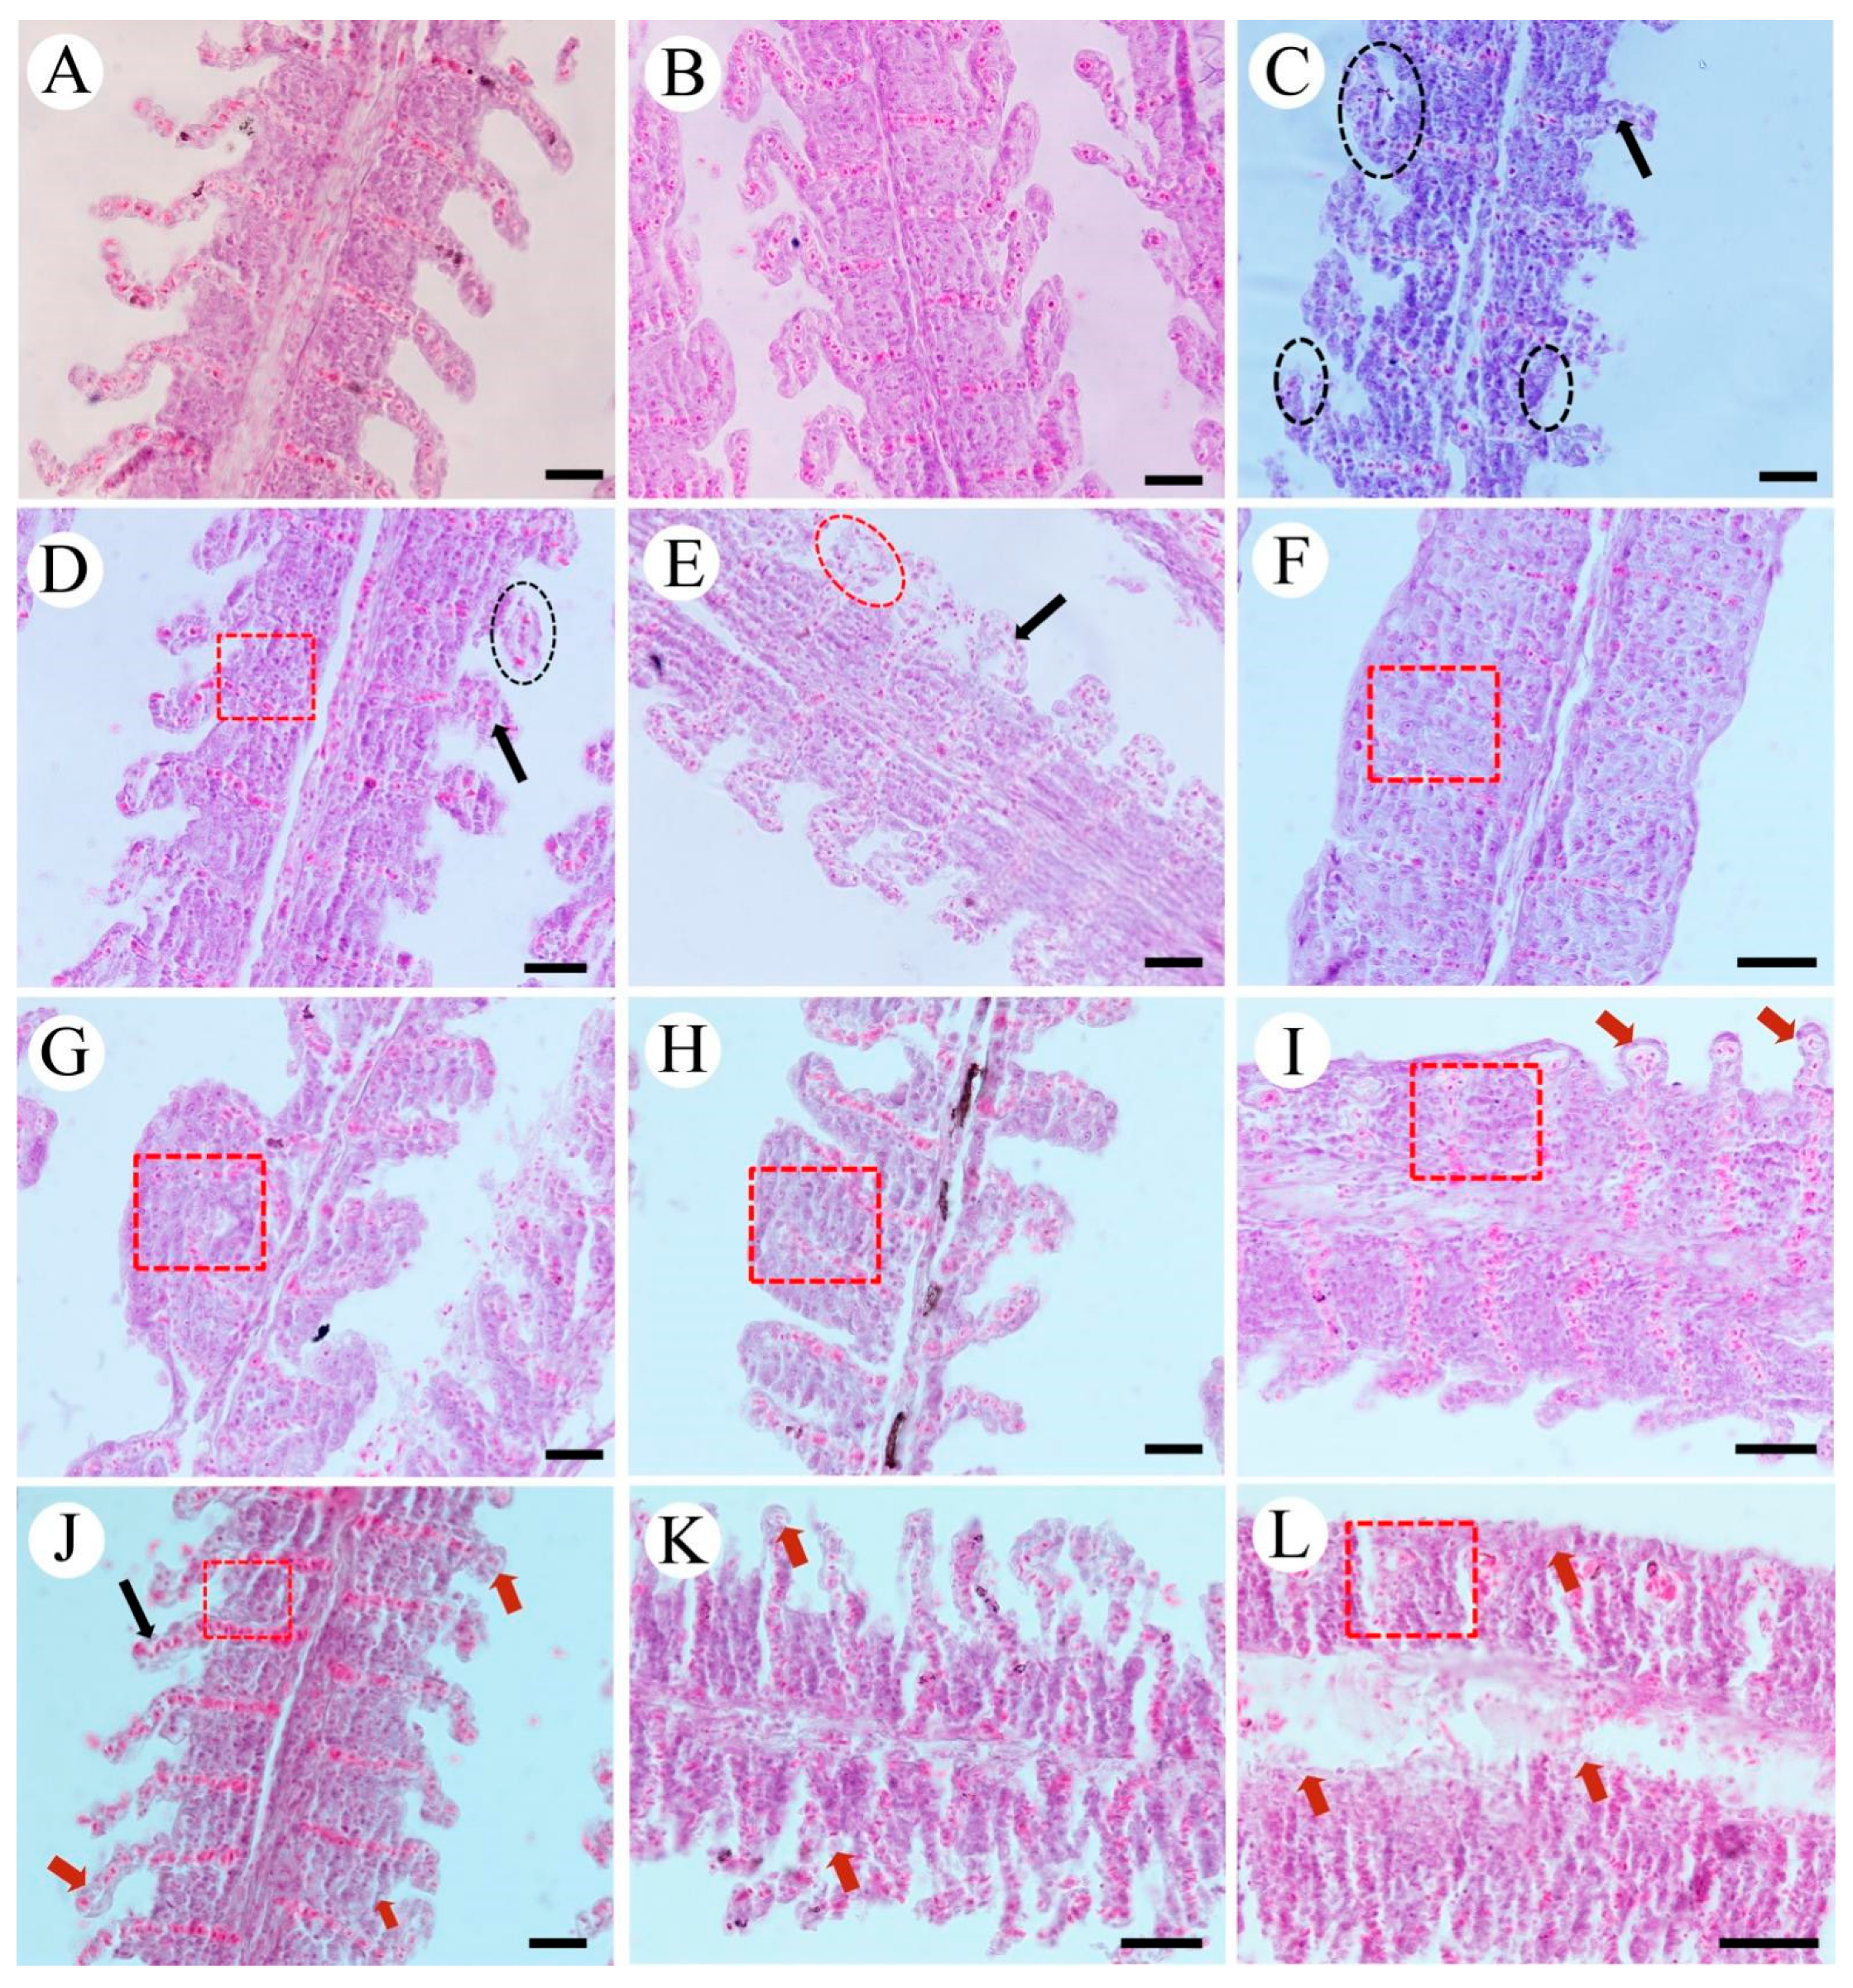
3.2.2. Gills
3.2.3. Kidneys
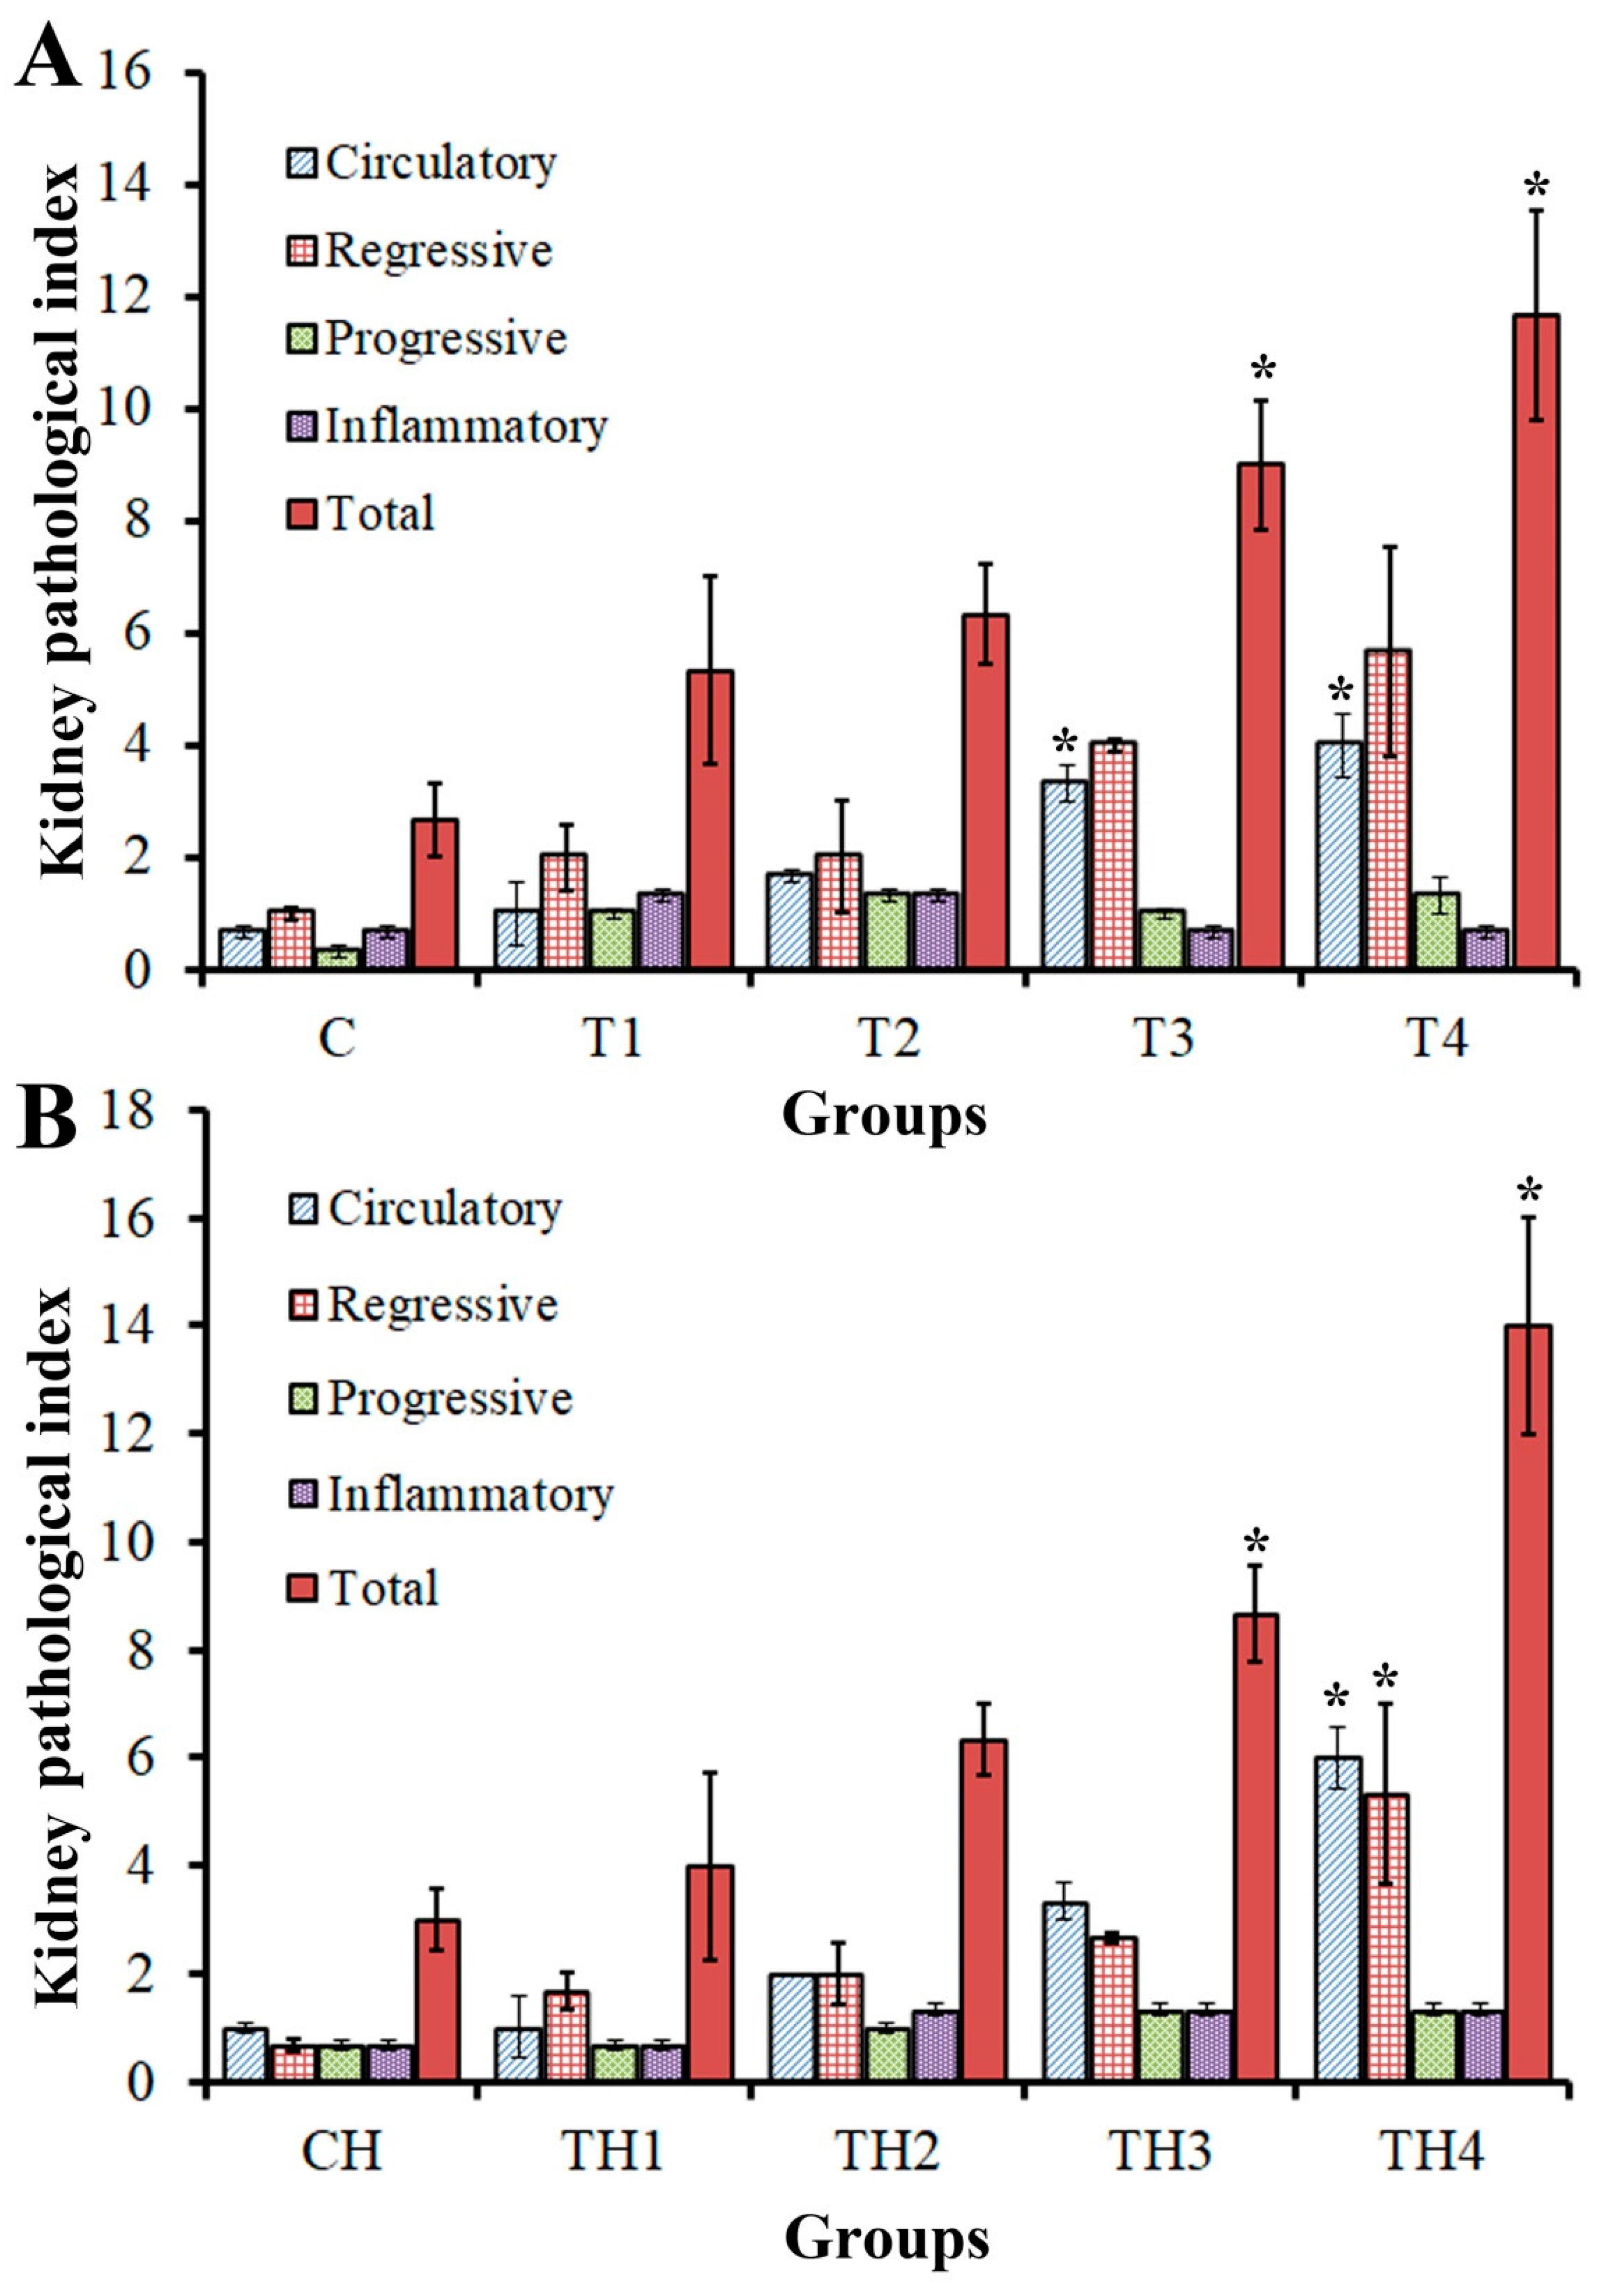
3.2.4. Semi-Quantitative Evaluation of Tissues
3.3. Hematological Indices
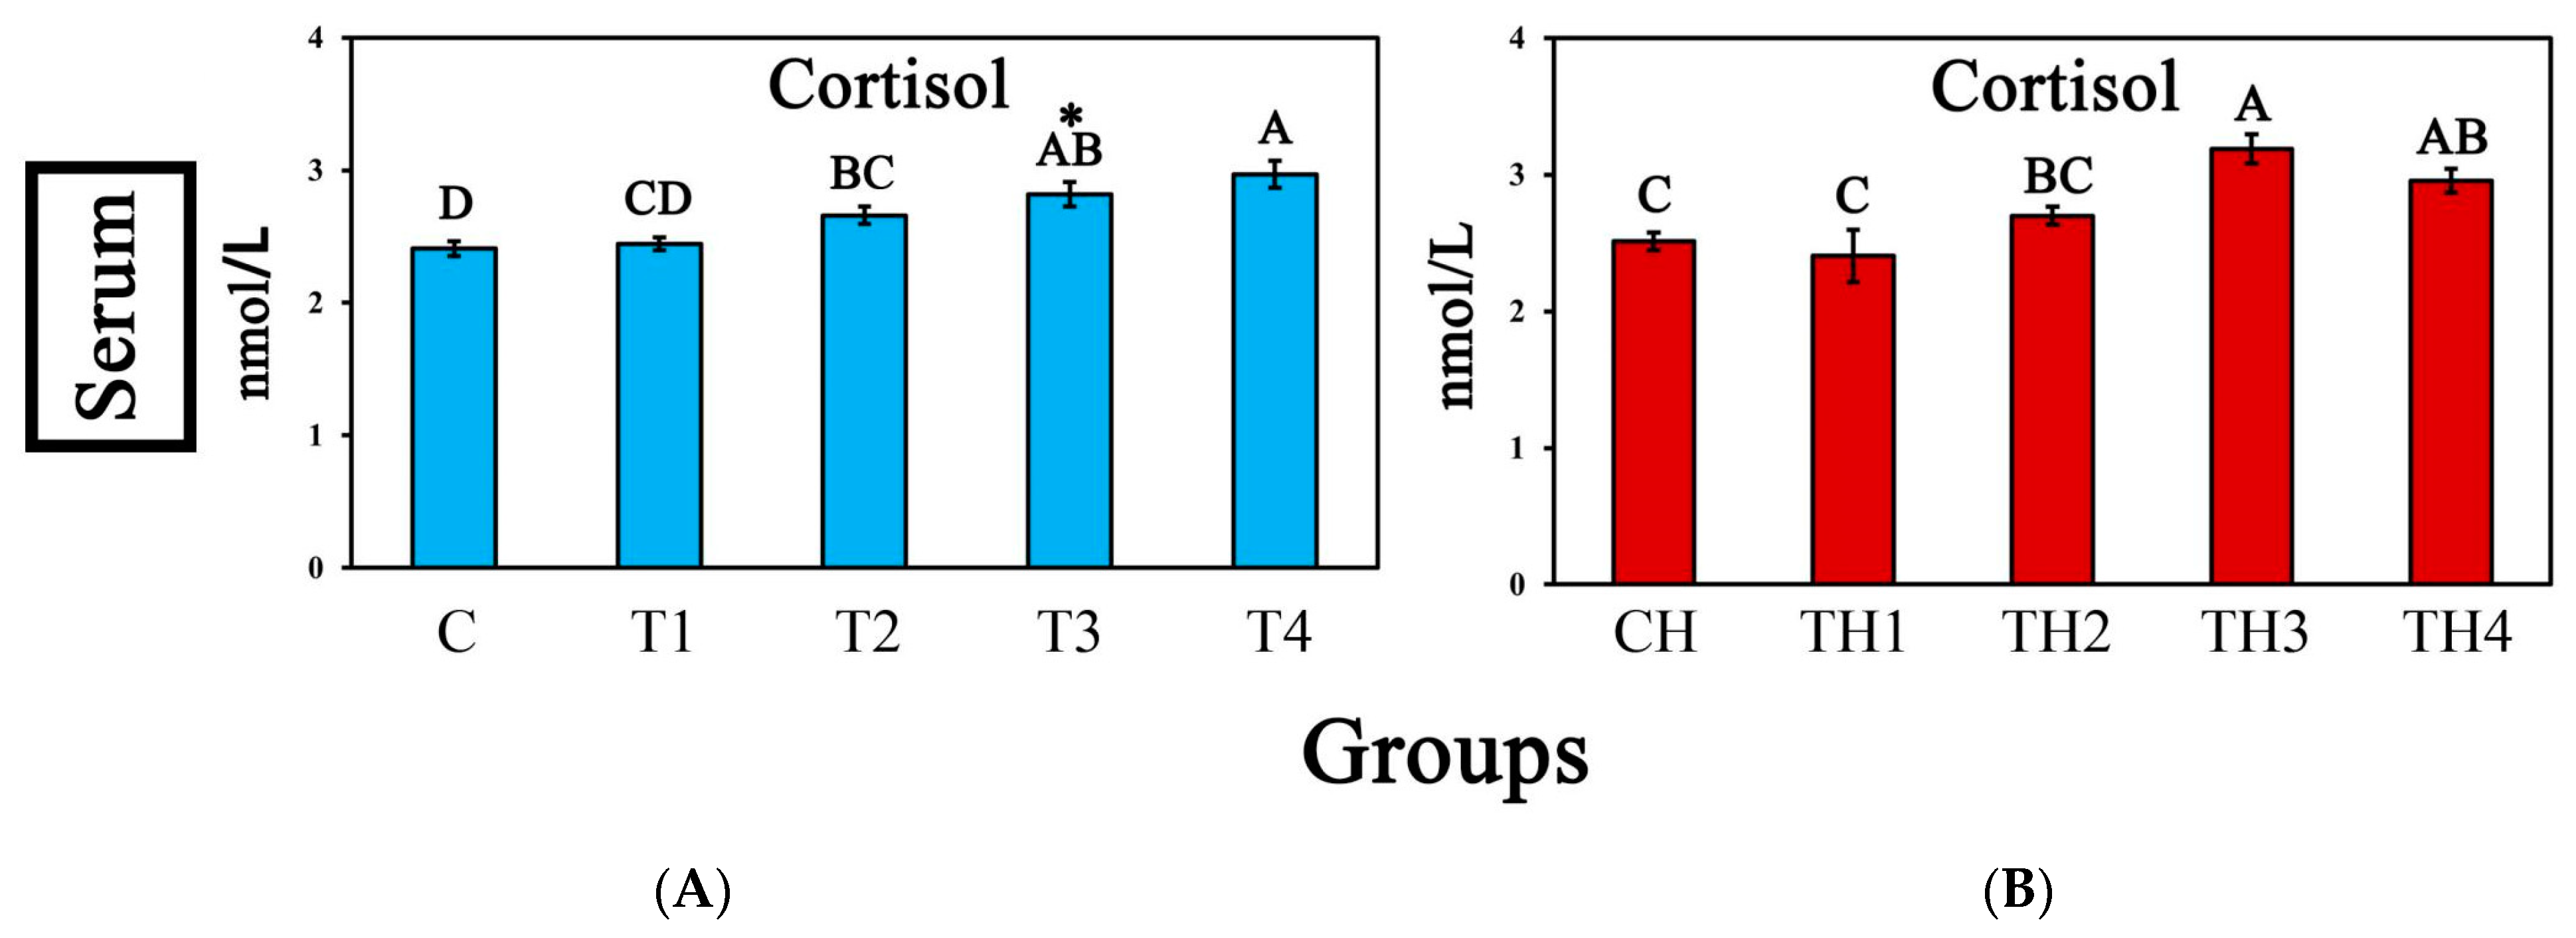
3.4. Serum Cortisol
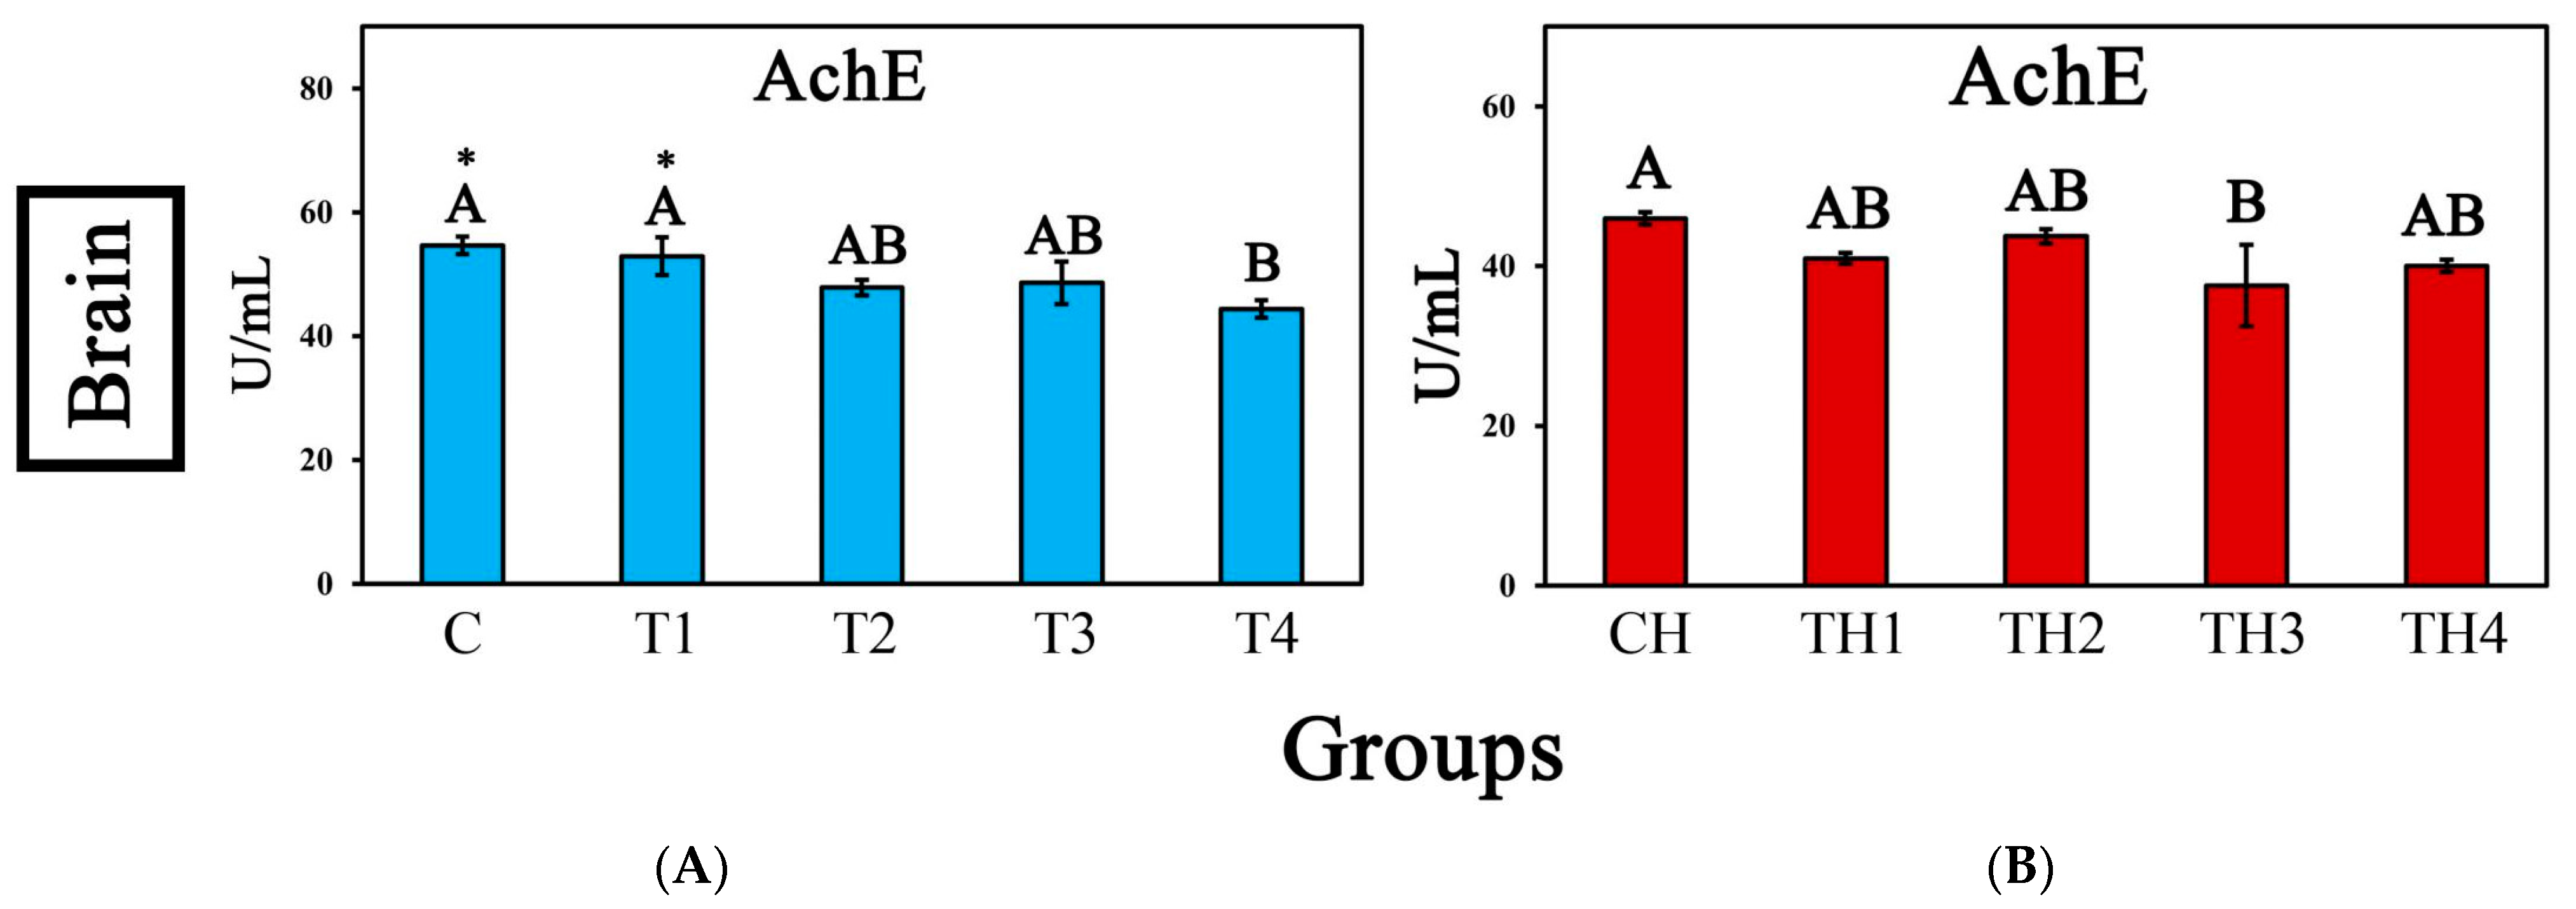
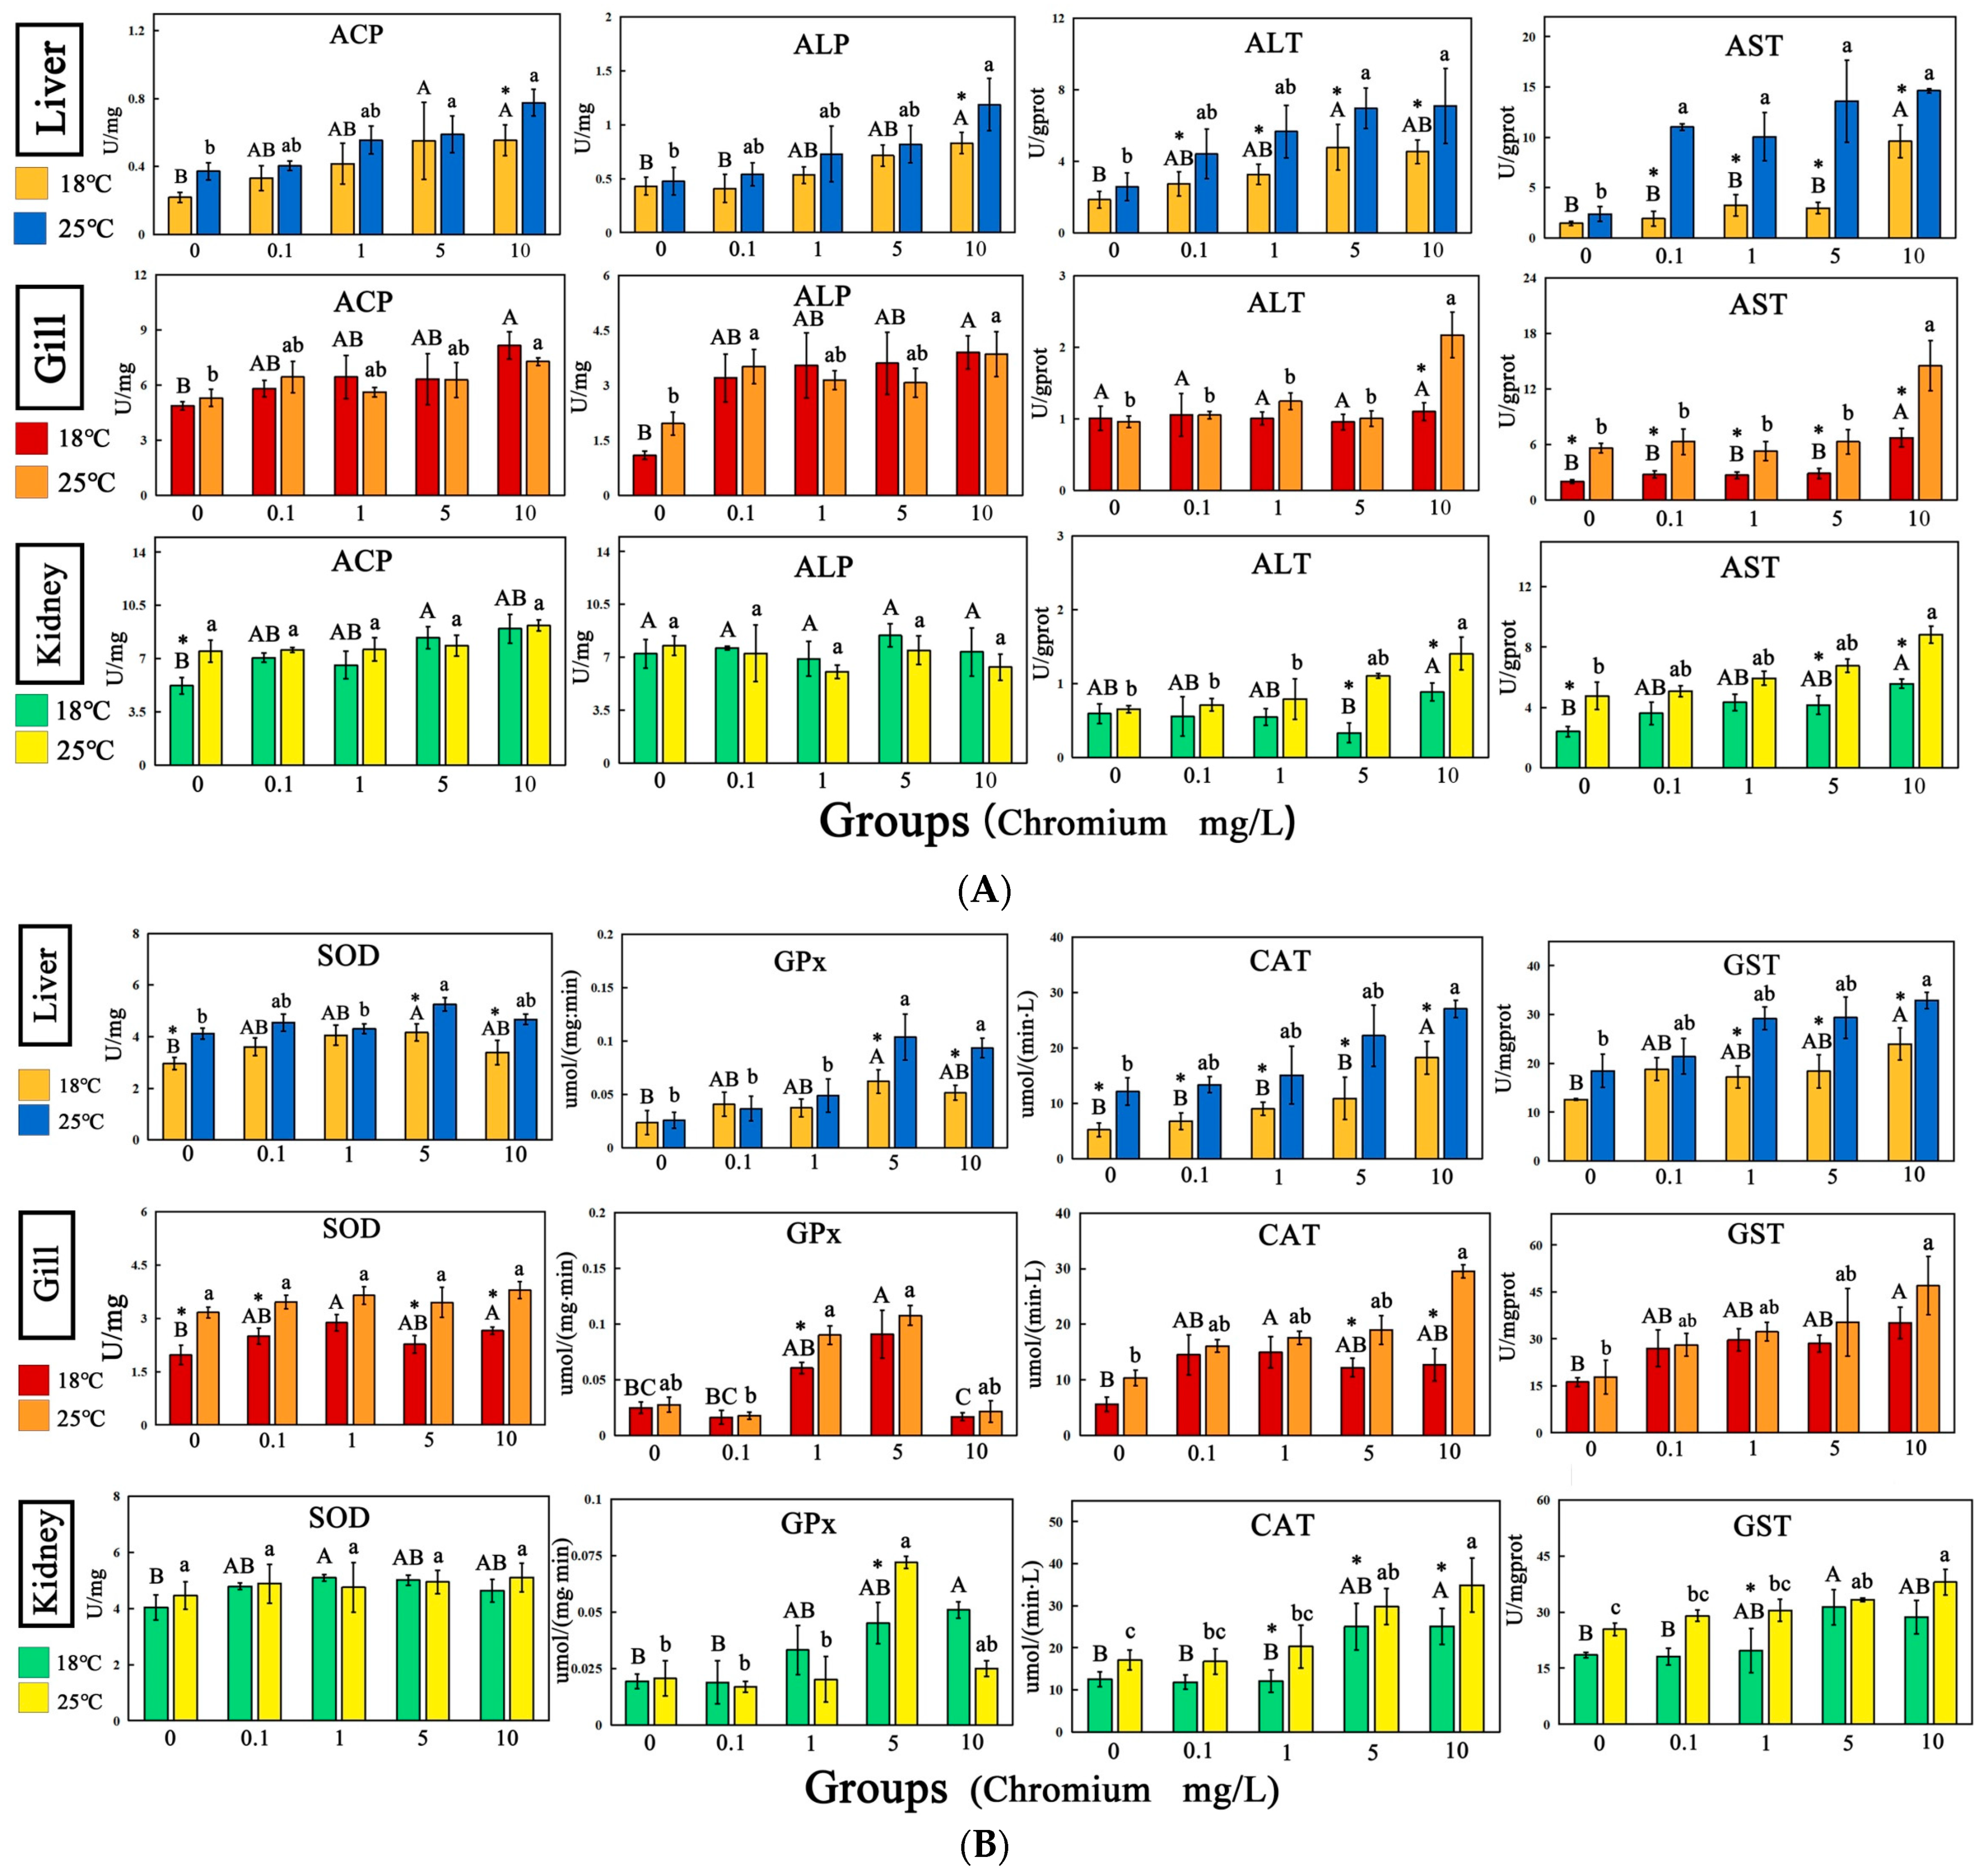
3.5. Enzyme Activity
4. Discussion
5. Conclusions
Supplementary Materials
Author Contributions
Funding
Institutional Review Board Statement
Informed Consent Statement
Data Availability Statement
Conflicts of Interest
References
- Schulz, R.; Bundschuh, M.; Gergs, R.; Bruhl, C.A.; Diehl, D.; Entling, M.H.; Fahse, L.; Fror, O.; Jungkunst, H.F.; Lorke, A.; et al. Review on environmental alterations propagating from aquatic to terrestrial ecosystems. Sci. Total Environ. 2015, 538, 246–261. [Google Scholar] [CrossRef] [PubMed]
- Lunardelli, B.; Cabral, M.T.; Vieira, C.E.D.; Oliveira, L.F.; Risso, W.E.; Meletti, P.C.; Martinez, C.B.R. Chromium accumulation and biomarker responses in the Neotropical fish Prochilodus lineatus caged in a river under the influence of tannery activities. Ecotoxicol. Environ. Saf. 2018, 153, 188–194. [Google Scholar] [CrossRef] [PubMed]
- Paschoalini, A.L.; Bazzoli, N. Heavy metals affecting Neotropical freshwater fish: A review of the last 10 years of research. Aquat. Toxicol. 2021, 237, 105906. [Google Scholar] [CrossRef] [PubMed]
- Yang, Q.; Li, Z.; Lu, X.; Duan, Q.; Huang, L.; Bi, J. A review of soil heavy metal pollution from industrial and agricultural regions in China: Pollution and risk assessment. Sci. Total Environ. 2018, 642, 690–700. [Google Scholar] [CrossRef] [PubMed]
- Jeong, H.; Lee, Y.H.; Sayed, A.E.H.; Jeong, C.B.; Zhou, B.; Lee, J.S.; Byeon, E. Short- and long-term single and combined effects of microplastics and chromium on the freshwater water flea Daphnia magna. Aquat. Toxicol. 2022, 253, 106348. [Google Scholar] [CrossRef]
- Pechova, A.; Pavlata, L. Chromium as an essential nutrient: A review. Vet. Med. 2007, 52, 1–18. [Google Scholar] [CrossRef]
- Bakshi, A.; Panigrahi, A.K. Chromium Contamination in Soil and Its Bioremediation: An Overview. In Advances in Bioremediation and Phytoremediation for Sustainable Soil Management: Principles, Monitoring and Remediation; Malik, J.A., Ed.; Springer International Publishing: Cham, Switzerland, 2022; pp. 229–248. [Google Scholar]
- Kumar, S.; Nigam, A.; Priya, S.; Bajpai, P.; Budhwar, R. Lipoic acid prevents Cr6+ induced cell transformation and the associated genomic dysregulation. Environ. Toxicol. Pharmacol. 2013, 36, 182–193. [Google Scholar] [CrossRef] [PubMed]
- Awasthi, Y.; Ratn, A.; Prasad, R.; Kumar, M.; Trivedi, S.P. An in vivo analysis of Cr6+ induced biochemical, genotoxicological and transcriptional profiling of genes related to oxidative stress, DNA damage and apoptosis in liver of fish, Channa punctatus (Bloch, 1793). Aquat. Toxicol. 2018, 200, 158–167. [Google Scholar] [CrossRef]
- Chaudhary, A.; Javaid, K.g.; Bughio, E. Toxic effects of chromium chloride on hematology and histopathology of major carp (Labeo rohita). Egypt. J. Aquat. Res. 2023, 49, 291–296. [Google Scholar] [CrossRef]
- Mishra, A.K.; Mohanty, B. Chronic exposure to sublethal hexavalent chromium affects organ histopathology and serum cortisol profile of a teleost, Channa punctatus (Bloch). Sci. Total Environ. 2009, 407, 5031–5038. [Google Scholar] [CrossRef]
- Wang, X.; Zang, S. Distribution characteristics and ecological risk assessment of toxic heavy metals and metalloid in surface water of lakes in Daqing Heilongjiang Province, China. Ecotoxicology 2014, 23, 609–617. [Google Scholar] [CrossRef] [PubMed]
- Du, P.; Zhang, L.; Ma, Y.; Li, X.; Wang, Z.; Mao, K.; Wang, N.; Li, Y.; He, J.; Zhang, X.; et al. Occurrence and Fate of Heavy Metals in Municipal Wastewater in Heilongjiang Province, China: A Monthly Reconnaissance from 2015 to 2017. Water 2020, 12, 728. [Google Scholar] [CrossRef]
- He, J.; Si, T.; Beibei, W.; Feng, C.; Su, H.; Wang, Y.; Qin, N. Ecological risk and water quality standard evaluation of 10 typical heavy metals in eight river basins (Chinese with English abstract). J. Environ. Sci. China 2019, 39, 13. [Google Scholar]
- Kumar, N.; Bhushan, S.; Patole, P.B.; Gite, A. Multi-biomarker approach to assess chromium, pH and temperature toxicity in fish. Comp. Biochem. Physiol. Part. C Toxicol. Pharmacol. 2022, 254, 109264. [Google Scholar] [CrossRef] [PubMed]
- Shahjahan, M.; Taslima, K.; Rahman, M.S.; Al-Emran, M.; Alam, S.I.; Faggio, C. Effects of heavy metals on fish physiology—A review. Chemosphere 2022, 300, 134519. [Google Scholar] [CrossRef] [PubMed]
- Lu, Y.; Wu, Z.; Song, Z.; Xiao, P.; Liu, Y.; Zhang, P.; You, F. Insight into the heat resistance of fish via blood: Effects of heat stress on metabolism, oxidative stress and antioxidant response of olive flounder Paralichthys olivaceus and turbot Scophthalmus maximus. Fish Shellfish Immunol. 2016, 58, 125–135. [Google Scholar] [CrossRef] [PubMed]
- Heugens, E.H.W.; Jager, T.; Creyghton, R.; Kraak, M.H.S.; Hendriks, A.J.; Van Straalen, N.M.; Admiraal, W. Temperature-Dependent Effects of Cadmium on Daphnia magna: Accumulation versus Sensitivity. Environ. Sci. Technol. 2003, 37, 2145–2151. [Google Scholar] [CrossRef] [PubMed]
- Li, A.J.; Zhou, G.-J.; Lai, R.W.S.; Leung, P.T.Y.; Wu, C.C.; Zeng, E.Y.; Lui, G.C.S.; Leung, K.M.Y. Extreme cold or warm events can potentially exacerbate chemical toxicity to the marine medaka fish Oryzias melastigma. Aquat. Toxicol. 2022, 249, 106226. [Google Scholar] [CrossRef] [PubMed]
- Wang, Z.; Lui, G.C.S.; Burton, G.A.; Leung, K.M.Y. Thermal extremes can intensify chemical toxicity to freshwater organisms and hence exacerbate their impact to the biological community. Chemosphere 2019, 224, 256–264. [Google Scholar] [CrossRef]
- Javed, M.; Usmani, N. An Overview of the Adverse Effects of Heavy Metal Contamination on Fish Health. Proc. Natl. Acad. Sci. India Sect. B Biol. Sci. 2019, 89, 389–403. [Google Scholar] [CrossRef]
- Rabbane, M.G.; Kabir, M.A.; Habibullah-Al-Mamun, M.; Mustafa, M.G. Toxic Effects of Arsenic in Commercially Important Fish Rohu Carp, Labeo rohita of Bangladesh. Fishes 2022, 7, 217. [Google Scholar] [CrossRef]
- Kumari, B.; Kumar, V.; Sinha, A.K.; Ahsan, J.; Ghosh, A.K.; Wang, H.; DeBoeck, G. Toxicology of arsenic in fish and aquatic systems. Environ. Chem. Lett. 2017, 15, 43–64. [Google Scholar] [CrossRef]
- Ahmed, M.K.; Habibullah-Al-Mamun, M.; Parvin, E.; Akter, M.S.; Khan, M.S. Arsenic induced toxicity and histopathological changes in gill and liver tissue of freshwater fish, tilapia (Oreochromis mossambicus). Exp. Toxicol. Pathol. 2013, 65, 903–909. [Google Scholar] [CrossRef] [PubMed]
- Javed, M.; Usmani, N. Stress response of biomolecules (carbohydrate, protein and lipid profiles) in fish Channa punctatus inhabiting river polluted by Thermal Power Plant effluent. Saudi J. Biol. Sci. 2015, 22, 237–242. [Google Scholar] [CrossRef] [PubMed]
- Javed, M.; Usmani, N. Assessment of heavy metal (Cu, Ni, Fe, Co, Mn, Cr, Zn) pollution in effluent dominated rivulet water and their effect on glycogen metabolism and histology of Mastacembelus armatus. SpringerPlus 2013, 2, 390. [Google Scholar] [CrossRef] [PubMed]
- Zhang, Y.; Luo, J.; Zhu, T.; Yang, Z.; Jin, M.; Jiao, L.; Zhou, Q. Excessive dietary Cr6+ had no adverse effect on mud crab (Scylla paramamosain) but provoke consumers health risk. Aquac. Rep. 2022, 27, 101397. [Google Scholar] [CrossRef]
- Yu, T.; Wang, Q.-j.; Chen, X.-m.; Chen, Y.-k.; Ghonimy, A.; Zhang, D.-m.; Wang, G.-q. Effect of dietary L-carnitine supplementation on growth performance and lipid metabolism in Rhynchocypris lagowski Dybowski fed oxidized fish oil. Aquac. Res. 2020, 51, 3698–3710. [Google Scholar] [CrossRef]
- Wang, J.; Yang, Y.; Wang, Z.; Xu, K.; Xiao, X.; Mu, W. Comparison of effects in sustained and diel-cycling hypoxia on hypoxia tolerance, histology, physiology and expression of clock genes in high latitude fish Phoxinus lagowskii. Comp. Biochem. Physiol. Part. A Mol. Integr. Physiol. 2021, 260, 111020. [Google Scholar] [CrossRef] [PubMed]
- Wang, C.; Tang, M.; Chen, Y.; Liu, D.; Xie, S.; Zou, J.; Tang, H.; Li, Q.; Zhou, A. Expression of genes related to antioxidation, immunity, and heat stress in Gambusia affinis exposed to the heavy metals Cu and Zn. Ecotoxicol. Environ. Saf. 2022, 247, 114269. [Google Scholar] [CrossRef]
- Rubalcaba, J.G.; Verberk, W.C.E.P.; Hendriks, A.J.; Saris, B.; Woods, H.A. Oxygen limitation may affect the temperature and size dependence of metabolism in aquatic ectotherms. Proc. Natl. Acad. Sci. USA 2020, 117, 31963–31968. [Google Scholar] [CrossRef]
- Azmat, H.; Javed, M.; Abdullah, S.; Javid, A.; Hussain, S. Growth responces of major carps reared under chronic stress of chromium. J. Anim. Plant Sci. 2018, 28, 604–609. [Google Scholar]
- Finney, D.J. Probit Analysis; Cambridge University Press: London, UK, 1971. [Google Scholar]
- Yao, T.; Zhang, T.; Zhao, Q.; Wang, S.; Chen, Y.; Ning, Z.; Sun, M.; Zhou, H.; Mu, W. Effects of dietary supplementation with astragalus (Astragalus membranaceus) root or leaf meal on the hematology, serum biochemical parameters, histomorphology, oxidative status, and resistance of Phoxinus lagowskii against bacterial infection. Aquaculture. 2023, 565, 739135. [Google Scholar] [CrossRef]
- Li, X.; Shen, Y.; Bao, Y.; Wu, Z.; Yang, B.; Jiao, L.; Zhang, C.; Tocher, D.R.; Zhou, Q.; Jin, M. Physiological responses and adaptive strategies to acute low-salinity environmental stress of the euryhaline marine fish black seabream (Acanthopagrus schlegelii). Aquaculture 2022, 554, 738117. [Google Scholar] [CrossRef]
- Mumford, S.; Heidel, J.; Smith, C.; Morrison, J.; MacConnell, B.; Blazer, V. Fish Histology and Histopathology, 4th ed.; U.S. Fish and Wildfife Service. National Conservation Training Center: Shepherdstown, WV, USA, 2007; p. 357.
- Takashima, F.; Hibiya, T. An Atlas of Fish Histology: Normal and Pathological Features, 2nd ed.; Kodensha Ltd.: Tokyo, Japan, 1995. [Google Scholar]
- Bernet, D.; Schmidt-Posthaus, H.; Meier, W.; Burkhardt-Holm, P.; Wahli, T. Histopathology in fish: Proposal for a protocol to assess aquatic pollution. J. Fish Dis. 1999, 22, 25–34. [Google Scholar] [CrossRef]
- Correia, A.T.; Rodrigues, S.; Ferreira-Martins, D.; Nunes, A.C.; Ribeiro, M.I.; Antunes, S.C. Multi-biomarker approach to assess the acute effects of cerium dioxide nanoparticles in gills, liver and kidney of Oncorhynchus mykiss. Comp. Biochem. Physiol. Part C Toxicol. Pharmacol. 2020, 238, 108842. [Google Scholar] [CrossRef] [PubMed]
- Santos, D.; Félix, L.; Luzio, A.; Parra, S.; Bellas, J.; Monteiro, S.M. Single and combined acute and subchronic toxic effects of microplastics and copper in zebrafish (Danio rerio) early life stages. Chemosphere 2021, 277, 130262. [Google Scholar] [CrossRef] [PubMed]
- Weijie, M.; Chongnv, W.; Xuming, P.; Weixin, J.; Yuhang, W.; Benhui, S. TiO2 nanoparticles and multi-walled carbon nanotubes monitoring and bioremediation potential using ciliates Pseudocohnilembus persalinus. Ecotoxicol. Environ. Saf. 2020, 187, 109825. [Google Scholar] [CrossRef] [PubMed]
- Barišić, J.; Dragun, Z.; Ramani, S.; Filipović Marijić, V.; Krasnići, N.; Čož-Rakovac, R.; Kostov, V.; Rebok, K.; Jordanova, M. Evaluation of histopathological alterations in the gills of Vardar chub (Squalius vardarensis Karaman) as an indicator of river pollution. Ecotoxicol. Environ. Saf. 2015, 118, 158–166. [Google Scholar] [CrossRef] [PubMed]
- Rodrigues, S.; Antunes, S.C.; Nunes, B.; Correia, A.T. Histological alterations in gills and liver of rainbow trout (Oncorhynchus mykiss) after exposure to the antibiotic oxytetracycline. Environ. Toxicol. Pharmacol. 2017, 53, 164–176. [Google Scholar] [CrossRef]
- Brosnan, M.E.; Brosnan, J.T. The role of dietary creatine. Amino Acids 2016, 48, 1785–1791. [Google Scholar] [CrossRef]
- Nunes, B.; Gaio, A.R.; Carvalho, F.; Guilhermino, L. Behaviour and biomarkers of oxidative stress in Gambusia holbrooki after acute exposure to widely used pharmaceuticals and a detergent. Ecotoxicol. Environ. Saf. 2008, 71, 341–354. [Google Scholar] [CrossRef] [PubMed]
- Nunes, B.; Miranda, A.F.; Ozório, R.O.A.; Gonçalves, F.; Gonçalves, J.F.M.; Correia, A.T. Modulation of neuronal activity and hepatic metabolism by ploidy and l-carnitine supplement in rainbow trout (Oncorhynchus mykiss). Aquac. Nutr. 2014, 20, 242–252. [Google Scholar] [CrossRef]
- Nero, V.; Farwell, A.; Lister, A.; Van Der Kraak, G.; Lee, L.E.J.; Van Meer, T.; MacKinnon, M.D.; Dixon, D.G. Gill and liver histopathological changes in yellow perch (Perca flavescens) and goldfish (Carassius auratus) exposed to oil sands process-affected water. Ecotoxicol. Environ. Saf. 2006, 63, 365–377. [Google Scholar] [CrossRef] [PubMed]
- Marshall, W.S.; Grosell, M. Ion Transport, Osmoregulation and Acid-Base Balance; CRC Press: Boca Raton, FL, USA, 2006. [Google Scholar]
- Canales, M.; Ortiz-Delgado, J.; Sarasquete, C. Histopathological changes induced by lindane (γ-HCH) in various organs of fishes. Sci. Mar. 2002, 67, 53–61. [Google Scholar]
- Awasthi, Y.; Ratn, A.; Prasad, R.; Kumar, M.; Trivedi, A.; Shukla, J.P.; Trivedi, S.P. A protective study of curcumin associated with Cr6+ induced oxidative stress, genetic damage, transcription of genes related to apoptosis and histopathology of fish, Channa punctatus (Bloch, 1793). Environ. Toxicol. Pharmacol. 2019, 71, 103209. [Google Scholar] [CrossRef] [PubMed]
- Suchana, S.A.; Ahmed, M.S.; Islam, S.M.M.; Rahman, M.L.; Rohani, M.F.; Ferdusi, T.; Ahmmad, A.K.S.; Fatema, M.K.; Badruzzaman, M.; Shahjahan, M. Chromium Exposure Causes Structural Aberrations of Erythrocytes, Gills, Liver, Kidney, and Genetic Damage in Striped Catfish Pangasianodon hypophthalmus. Biol. Trace Elem. Res. 2021, 199, 3869–3885. [Google Scholar] [CrossRef]
- Zeitoun, M. Impact of water pollution with heavy metals on fish health: Overview and updates. Glob. Vet. 2014, 12, 219–231. [Google Scholar]
- Khan, M.A.Q.; Ahmed, S.A.; Catalin, B.; Khodadoust, A.; Ajayi, O.; Vaughn, M. Effect of temperature on heavy metal toxicity to juvenile crayfish, Orconectes immunis (Hagen). Environ. Toxicol. 2006, 21, 513–520. [Google Scholar] [CrossRef] [PubMed]
- Mohamed, A.A.-R.; El-Houseiny, W.; El-Murr, A.E.; Ebraheim, L.L.M.; Ahmed, A.I.; El-Hakim, Y.M.A. Effect of hexavalent chromium exposure on the liver and kidney tissues related to the expression of CYP450 and GST genes of Oreochromis niloticus fish: Role of curcumin supplemented diet. Ecotoxicol. Environ. Saf. 2020, 188, 109890. [Google Scholar] [CrossRef]
- Kamila, S.; Shaw, P.; Islam, S.; Chattopadhyay, A. Ecotoxicology of hexavalent chromium in fish: An updated review. Sci. Total Environ. 2023, 890, 164395. [Google Scholar] [CrossRef]
- Bakshi, A.; Panigrahi, A.K. A comprehensive review on chromium induced alterations in fresh water fishes. Toxicol. Rep. 2018, 5, 440–447. [Google Scholar] [CrossRef] [PubMed]
- Islam, M.J.; Kunzmann, A.; Thiele, R.; Slater, M.J. Effects of extreme ambient temperature in European seabass, Dicentrarchus labrax acclimated at different salinities: Growth performance, metabolic and molecular stress responses. Sci. Total Environ. 2020, 735, 139371. [Google Scholar] [CrossRef] [PubMed]
- Islam, M.J.; Slater, M.J.; Bögner, M.; Zeytin, S.; Kunzmann, A. Extreme ambient temperature effects in European seabass, Dicentrarchus labrax: Growth performance and hemato-biochemical parameters. Aquaculture 2020, 522, 735093. [Google Scholar] [CrossRef]
- Islam, M.J.; Slater, M.J.; Kunzmann, A. What metabolic, osmotic and molecular stress responses tell us about extreme ambient heatwave impacts in fish at low salinities: The case of European seabass, Dicentrarchus labrax. Sci. Total Environ. 2020, 749, 141458. [Google Scholar] [CrossRef] [PubMed]
- Nussey, G.; van Vuren, J.H.J.; du Preez, H.H. Effect of copper on the differential white blood cell counts of the Mozambique tilapia (Oreochromis mossambicus). Comp. Biochem. Physiol. Part C Pharmacol. Toxicol. Endocrinol. 1995, 111, 381–388. [Google Scholar] [CrossRef]
- Gill, T.S.; Pant, J.C. Hematological and pathological effects of chromium toxicosis in the freshwater fish, Barbus conchonius Ham. Water Air Soil Pollut. 1987, 35, 241–250. [Google Scholar] [CrossRef]
- Ullah, S.; Li, Z.; Hassan, S.; Ahmad, S.; Guo, X.; Wanghe, K.; Nabi, G. Heavy metals bioaccumulation and subsequent multiple biomarkers based appraisal of toxicity in the critically endangered Tor putitora. Ecotoxicol. Environ. Saf. 2021, 228, 113032. [Google Scholar] [CrossRef] [PubMed]
- Ullah, S.; Li, Z.; Ul Arifeen, M.Z.; Khan, S.U.; Fahad, S. Multiple biomarkers based appraisal of deltamethrin induced toxicity in silver carp (Hypophthalmichthys molitrix). Chemosphere 2019, 214, 519–533. [Google Scholar] [CrossRef] [PubMed]
- Krumschnabel, G.; Nawaz, M. Acute toxicity of hexavalent chromium in isolated teleost hepatocytes. Aquat. Toxicol. 2004, 70, 159–167. [Google Scholar] [CrossRef]
- Lushchak, V.I. Contaminant-induced oxidative stress in fish: A mechanistic approach. Fish Physiol. Biochem. 2016, 42, 711–747. [Google Scholar] [CrossRef]
- Öner, M.; Atli, G.; Canli, M. Changes in serum biochemical parameters of freshwater fish Oreochromis niloticus following prolonged metal (Ag, Cd, Cr, Cu, Zn) exposures. Environ. Toxicol. Chem. 2008, 27, 360–366. [Google Scholar] [CrossRef]
- Zhou, M.; Deng, Y.; Liu, M.; Liao, L.; Dai, X.; Guo, C.; Zhao, X.; He, L.; Peng, C.; Li, Y. The pharmacological activity of berberine, a review for liver protection. Eur. J. Pharmacol. 2021, 890, 173655. [Google Scholar] [CrossRef] [PubMed]
- Ronda, A.C.; Oliva, A.L.; Arias, A.H.; Orazi, M.M.; Marcovecchio, J.E. Biomarker Responses to Polycyclic Aromatic Hydrocarbons in the Native Fish Ramnogaster arcuata, South America. Int. J. Environ. Res. 2019, 13, 77–89. [Google Scholar] [CrossRef]
- Recabarren-Villalón, T.; Ronda, A.C.; Arias, A.H. Polycyclic aromatic hydrocarbons levels and potential biomarkers in a native South American marine fish. Reg. Stud. Mar. Sci. 2019, 29, 100695. [Google Scholar] [CrossRef]
- Rodwell, D. Teratology Study in Rats with Busan85; SLS Study No 3138.17; Springborn Life Sciences, Inc.: Wareham, MA, USA, 1988; pp. 1–19. [Google Scholar]
- Chen, J.; Liu, N.; Zhang, H.; Zhao, Y.; Cao, X. The effects of Aeromonas hydrophila infection on oxidative stress, nonspecific immunity, autophagy, and apoptosis in the common carp. Dev. Comp. Immunol. 2020, 105, 103587. [Google Scholar] [CrossRef] [PubMed]
- Liang, D.; Yang, Q.; Tan, B.; Dong, X.; Chi, S.; Liu, H.; Zhang, S. Dietary vitamin A deficiency reduces growth performance, immune function of intestine, and alters tight junction proteins of intestine for juvenile hybrid grouper (Epinephelus fuscoguttatus ♀ × Epinephelus lanceolatus ♂). Fish Shellfish Immunol. 2020, 107, 346–356. [Google Scholar] [CrossRef]
- World Health Organization. Guidelines for Drinking-Water Quality, 4th ed.; World Health Organization Press: Geneva, Switzerland, 2011. [Google Scholar]
- Kamsonlian, S.; Shukla, B. Optimization of process parameters using response surface methodology (RSM): Removal of Cr (VI) from aqueous solution by wood apple shell activated carbon (WASAC). Res. J. Chem. Sci. 2013, 3, 31–37. [Google Scholar]
- Ramish; Irshad, M.; Nawaz, R.; Nasim, I.; Irfan, A.; Hussain, A.; Al-Mutairi, A.; Rizwan, M.; Al-Hussain, S.; Zaki, M.; et al. Bioaccumulation of carcinogenic metals in river fish: A quantitative investigation of public health risk. Ecol. Indic. 2024, 162, 112057. [Google Scholar] [CrossRef]
- Guo, K.; Zhao, Z.; Luo, L.; Wang, S.; Zhang, R.; Xu, W.; Qiao, G. Immune and intestinal microbiota responses to aerial exposure stress in Chinese mitten crab (Eriocheir sinensis). Aquaculture 2021, 541, 736833. [Google Scholar] [CrossRef]
- Lionetto, M.G.; Caricato, R.; Calisi, A.; Giordano, M.E.; Schettino, T. Acetylcholinesterase as a Biomarker in Environmental and Occupational Medicine: New Insights and Future Perspectives. BioMed Res. Int. 2013, 2013, 321213. [Google Scholar] [CrossRef]
- Sibiya, A.; Gopi, N.; Jeyavani, J.; Mahboob, S.; Al-Ghanim, K.A.; Sultana, S.; Mustafa, A.; Govindarajan, M.; Vaseeharan, B. Comparative toxicity of silver nanoparticles and silver nitrate in freshwater fish Oreochromis mossambicus: A multi-biomarker approach. Comp. Biochem. Physiol. Part C Toxicol. Pharmacol. 2022, 259, 109391. [Google Scholar] [CrossRef]
- Gobi, N.; Vaseeharan, B.; Rekha, R.; Vijayakumar, S.; Faggio, C. Bioaccumulation, cytotoxicity and oxidative stress of the acute exposure selenium in Oreochromis mossambicus. Ecotoxicol. Environ. Saf. 2018, 162, 147–159. [Google Scholar] [CrossRef] [PubMed]
- Kim, W.-K.; Lee, S.-K.; Park, J.-W.; Choi, K.; Cargo, J.; Schlenk, D.; Jung, J. Integration of multi-level biomarker responses to cadmium and benzo[k]fluoranthene in the pale chub (Zacco platypus). Ecotoxicol. Environ. Saf. 2014, 110, 121–128. [Google Scholar] [CrossRef] [PubMed]
- Paul, T.; Kumar, S.; Shukla, S.P.; Pal, P.; Kumar, K.; Poojary, N.; Biswal, A.; Mishra, A. A multi-biomarker approach using integrated biomarker response to assess the effect of pH on triclosan toxicity in Pangasianodon hypophthalmus (Sauvage, 1878). Environ. Pollut. 2020, 260, 114001. [Google Scholar] [CrossRef] [PubMed]


| Variables | Groups | |||||||||
|---|---|---|---|---|---|---|---|---|---|---|
| C | T1 | T2 | T3 | T4 | CH | TH1 | TH2 | TH3 | TH4 | |
| WBC | 6.83 ± 0.87 b* | 19.63 ± 2.23 a | 19.56 ± 2.22 a | 18.46 ± 1.33 a* | 19.3 ± 4.07 a* | 13.82 ± 2.95 b | 23.07 ± 0.5 b | 22.22 ± 3.89 b | 21.3 ± 3.96 b | 32.91 ± 2.94 a |
| RBC | 1.89 ± 0.4 a | 1.41 ± 0.1 a | 1.61 ± 0.21 a | 1.27 ± 0.06 a | 1.29 ± 0.11 a | 1.18 ± 0.29 a | 1.14 ± 0.17 a | 1.02 ± 0.12 a | 1.15 ± 0.18 a | 1.32 ± 0.22 a |
| HGB | 72.86 ± 5.34 a | 61.6 ± 9.41 ab | 62 ± 7.6 ab | 48.29 ± 2.33 b | 57.75 ± 7.2 ab | 58.83 ± 3.49 a | 56.5 ± 1.85 a | 42.6 ± 4.34 b | 50.8 ± 4.15 ab | 47.8 ± 3.62 ab |
| MCHC | 237.13 ± 4.89 a | 246.5 ± 7.47 a | 239 ± 2.07 a | 235.44 ± 1.5 a | 235.89 ± 3.39 a | 241.67 ± 4.04 a | 246.8 ± 15.27 a | 243.14 ± 4.18 a | 246.86 ± 6.96 a | 239.57 ± 6.12 a |
| MCH | 39.81 ± 0.67 a | 38.53 ± 2.17 a | 39.3 ± 0.49 a | 37.93 ± 0.73 a | 36.71 ± 0.89 a | 37.28 ± 1.41 a | 39.46 ± 2.54 a | 35.41 ± 1.28 a | 38.57 ± 0.64 a | 36.66 ± 1.53 a |
| MCV | 168.06 ± 2.75 a | 162.14 ± 6.57 b | 164.55 ± 1.63 b | 160.97 ± 2.76 b | 160.29 ± 2.21 b | 157.73 ± 5.78 b | 172.92 ± 3.39 a | 149.17 ± 5.12 b | 156.71 ± 3.82 b | 152.71 ± 3.19 b |
| HCT | 20.34 ± 2.55 b | 21.58 ± 0.56 ab | 23.4 ± 0.84 ab | 24.62 ± 2.65 ab* | 27.26 ± 2.16 a* | 20.99 ± 1.91 b | 20.88 ± 0.89 b | 20.57 ± 1.37 b | 29.59 ± 1.68 ab | 32.76 ± 2.05 a |
Disclaimer/Publisher’s Note: The statements, opinions and data contained in all publications are solely those of the individual author(s) and contributor(s) and not of MDPI and/or the editor(s). MDPI and/or the editor(s) disclaim responsibility for any injury to people or property resulting from any ideas, methods, instructions or products referred to in the content. |
© 2024 by the authors. Licensee MDPI, Basel, Switzerland. This article is an open access article distributed under the terms and conditions of the Creative Commons Attribution (CC BY) license (https://creativecommons.org/licenses/by/4.0/).
Share and Cite
Hu, T.; Ye, C.; Ning, Z.; Liu, T.; Mu, W. Effect of Toxicity of Chromium (VI) Stressors Alone and Combined to High Temperature on the Histopathological, Antioxidation, Immunity, and Energy Metabolism in Fish Phoxinus lagowskii. Fishes 2024, 9, 168. https://doi.org/10.3390/fishes9050168
Hu T, Ye C, Ning Z, Liu T, Mu W. Effect of Toxicity of Chromium (VI) Stressors Alone and Combined to High Temperature on the Histopathological, Antioxidation, Immunity, and Energy Metabolism in Fish Phoxinus lagowskii. Fishes. 2024; 9(5):168. https://doi.org/10.3390/fishes9050168
Chicago/Turabian StyleHu, Tingting, Cunrun Ye, Zhaoyang Ning, Tianmei Liu, and Weijie Mu. 2024. "Effect of Toxicity of Chromium (VI) Stressors Alone and Combined to High Temperature on the Histopathological, Antioxidation, Immunity, and Energy Metabolism in Fish Phoxinus lagowskii" Fishes 9, no. 5: 168. https://doi.org/10.3390/fishes9050168
APA StyleHu, T., Ye, C., Ning, Z., Liu, T., & Mu, W. (2024). Effect of Toxicity of Chromium (VI) Stressors Alone and Combined to High Temperature on the Histopathological, Antioxidation, Immunity, and Energy Metabolism in Fish Phoxinus lagowskii. Fishes, 9(5), 168. https://doi.org/10.3390/fishes9050168