Article

Coexisting in the Surf Zone: Age and Feeding Habits of the Spotted Seabass (Dicentrarchus punctatus) and European Seabass (Dicentrarchus labrax) on the Gulf of Cádiz Beaches (Southwest Iberian Peninsula)

by
Carlos Rodríguez-García
1,2,*,
Ana Toro-Podadera
1,
Jesica Sarmiento-Carbajal
1,2 and
Remedios Cabrera-Castro
1,2
1
Departamento de Biología, Facultad de Ciencias del Mar y Ambientales, Campus Río San Pedro, Universidad de Cádiz, 11510 Puerto Real, Spain
2
Instituto Universitario de Investigación Marina (INMAR), Campus de Excelencia Internacional del Mar (CEIMAR), 11510 Puerto Real, Spain
*
Author to whom correspondence should be addressed.
Fishes 2024, 9(5), 173; https://doi.org/10.3390/fishes9050173
Submission received: 12 April 2024 / Revised: 30 April 2024 / Accepted: 8 May 2024 / Published: 9 May 2024
(This article belongs to the Section Biology and Ecology)

Abstract

:
Various commercial fish species utilize different coastal habitats as nurseries in their juvenile stages, with surf zones being particularly crucial due to the protection and abundant food resources they offer. Among the species that rely on these areas are the spotted seabass (Dicentrarchus punctatus) and the European seabass (Dicentrarchus labrax). This study aimed to investigate the age and feeding habits of surf zone specimens of these species and explore their environmental adaptations. The average size for D. punctatus was 16.94 ± 4.05 cm, and for D. labrax, it was 23.23 ± 6.30 cm. The length–weight relationship for D. punctatus was TW = 0.013*TL2.885 (parameter a: 95% CI: 0.012–0.014; parameter b: 95% CI: 2.854–2.917), and for D. labrax, it was TW = 0.008*TL3.095 (parameter a: 95% CI: 0.006–0.009; parameter b: 95% CI: 3.040–3.151). In both D. punctatus (79.20%) and D. labrax (75.92%), the predominant age classes were 1+ and 2+. Significant variations in age class abundance were observed in D. punctatus based on the time of day, lunar phase, and season, while D. labrax showed variations only by season. A diet analysis revealed that both species primarily consume mysids and fish, with D. punctatus showing dietary variations related to the time of day, lunar phase, and season, and D. labrax showing variations with the time of day and season.
Key Contribution: The most common size ranges for Dicentrarchus punctatus are 15–21 cm, and for D. labrax, they are 17–27 cm. The most prevalent age classes of Dicentrarchus punctatus and D. labrax in the surf zone are 1+ and 2+. Dicentrarchus punctatus exhibits significant differences in age class abundance depending on the time of day, lunar phases, and season, while D. labrax shows variability only with the season. The primary prey items for Dicentrarchus punctatus are mysids, whereas D. labrax predominantly feeds on mysids and fishes. The diet of D. punctatus varies significantly with the time of day, moon phase, season, and individual size, whereas the diet of D. labrax changes according to the time of day and lunar phases. The Levins index indicates that both Dicentrarchus punctatus and D. labrax specialize in the surf zone environment, exhibiting a significant dietary overlap between them.

1. Introduction

The spotted seabass (Dicentrarchus punctatus Bloch, 1792) and the European seabass (Dicentrarchus labrax Linnaeus, 1758) are both members of the Moronidae family, found in the Northeast Atlantic region. The European seabass’s range extends from Scandinavia down to southern Morocco, whereas the spotted seabass is distributed from Great Britain to Senegal, also encompassing the Mediterranean and Black Seas, with sightings in the Baltic Sea [1,2,3,4]. The largest sizes recorded for these species are 103 cm for the European seabass and 70 cm for the spotted seabass [5,6]. Commercially, these species are significant, with catches of 3598 tonnes for the spotted seabass and 5569 tonnes for the European seabass in 2021 [7]. Despite their value, they are sometimes considered bycatch in certain fisheries [8]. The European seabass also has substantial aquaculture relevance, especially in southern Europe, with a global production reaching 299,809 tonnes in 2021, of which 91,419 tonnes were produced in southern Europe alone [7]. Both species are coastal demersal, residing in different depth zones: the European seabass can be found down to 100 m, while the spotted seabass typically occupies waters between 2 and 15 m. They favor estuarine and occasionally riverine environments as well as rocky or sandy substrates, including surf zones [1,9,10].
Surf zones are dynamic environments characterized by significant water and sediment movement, extending from the wave break zone to the shoreline [11,12]. These areas are crucial feeding grounds for various marine species, thanks to the nutrient resuspension facilitated by the continuous water movement [13,14]. Fish residing in these zones play a critical role in transferring energy from the surf zones to adjacent marine areas [15,16]. The inherent turbidity created by wave action also makes surf zones effective refuges, offering protection for numerous organisms [17,18]. Furthermore, these habitats serve as essential nurseries for various species, supporting the recruitment processes vital for sustaining populations, particularly those of commercial significance [19].
Despite the significant commercial value of the spotted seabass and European seabass, research on these species is unevenly distributed. For the spotted seabass, substantial studies have been conducted in the Mediterranean, focusing on aspects like growth [1,20,21], feeding [22], and reproduction [23]. However, research on this species within the East Atlantic remains sparse [24]. In contrast, the European seabass has been more extensively studied, with research covering growth both in the Mediterranean [25,26] and Wales [27], dietary habits in the Mediterranean [28] and France [29], as well as growth and feeding in Portugal [30] and reproductive studies within the Mediterranean [31].
Therefore, given the importance, the scarcity of information on both species and the role of the surf zone for them, the objectives of this work were as follows: (1) to determine the age of spotted seabass and European seabass in the Gulf of Cádiz surf zone, (2) to investigate the diet of both species, as well as to detect variations between seasons, age, day and night or lunar phases, and (3) to calculate the possible overlap between both species in the habitat.

2. Materials and Methods

2.1. Sampling Methods

Five beaches along the Gulf of Cádiz, SW Iberian Peninsula, at coordinates 36°44′ N, 6°24′ W, were sampled: Santa María del Mar (SM), Torregorda (TG), Camposoto (CS), Punta del Boquerón (PB), and La Barrosa (LB) (Figure 1). This year-long study involved monthly sampling using a beach seine net 25 m in length and 2 m in height, with a mesh size of 3 cm. Sampling took place during the lowest tides of each month, both day and night, as long as weather conditions allowed (with waves less than 1 m). In each sampling, five hauls were executed, spaced 50 m apart along transects. Two people hauled the net perpendicular to the shoreline from the maximum feasible depth (±1.5 m) towards the shore. The duration of each haul ranged from 3 to 10 min, depending on sea conditions. Water temperature was recorded at each sampling event using a digital probe thermometer with an accuracy of ±0.1 °C.

2.2. Fish Sampling

All captured individuals were placed in ice water until further analysis in the lab, where the following biometric data were collected: total length (TL) and standard length (SL) with a precision of ±0.1 cm, and total weight (TW), gutted weight (GW), full stomach weight (FSW), and empty stomach weight (ESW) with a precision of ±0.01 g. Species identification was performed based on the guides from [32,33].
To age the captured specimens, the sagittal otoliths were removed from each individual, cleaned, and preserved. The growth rings were enumerated using a Leica Wild M10 stereomicroscope with bottom lighting. Two techniques were evaluated to enhance the visibility of the growth rings: firstly, the application of a glycerin and alcohol solution in 1:1 parts, and secondly, submerging the otoliths in distilled water, with the latter method yielding superior results. The counting was conducted by two independent observers, who were unaware of the specimens’ lengths and excluded inconsistent counts. The identification of both true and false growth rings was guided by the criteria established by the authors of [34].
The diet was analyzed through the stomach contents of each specimen, which were extracted and preserved in 70% alcohol until further analysis. Each stomach content was identified, and the number of items from each resource was quantified to the lowest possible taxonomic level [35], using a Leica Wild M10 magnifying glass. Each item was weighed using an Explorer Semi-Micro EX125D scale with a precision of ±0.01 mg.

2.3. Data Analysis

To derive the structure of the total length (TL) frequency distribution, histograms (size classes = 2 cm) were generated for both species. The length–weight relationship (LWR) was determined by applying the following equation obtained from [36]:
T W = a · T L b
where TW is the total weight in g and TL is the total length in cm.
The parameters of this relationship were estimated using the least squares method through linear regression analysis:
ln T W = ln a + b l n ( T L )
Parameter a reflects the fish’s body shape, whereas parameter b indicates the growth pattern of the species. If b = 3, it signifies isometric growth, meaning that both length and weight increase at the same rate. A value of b < 3 suggests a negative allometric growth, indicating a proportionally greater increase in length compared to weight. Conversely, a b > 3 value indicates positive allometric growth, where weight increases more than length [37].
The vacuity index (Vi) was used to calculate the proportion of empty stomachs:
V i = n u m b e r   o f   e m p t y   s t o m a c h s n u m b e r   o f   t o t a l     s t o m a c h s · 100
The proportion of individuals using each resource was expressed as the frequency of occurrence (%F):
% F = n u m b e r   o f   s t o m a c h s   w i t h   p r e y   i n u m b e r   o f   t o t a l     s t o m a c h s · 100
The numerical percentage (%Cn), reflecting the number of prey items found in stomachs, was calculated as the percentage of the total number of prey items of a resource present in each stomach:
% C n = T o t a l   n u m b e r   o f   p r e y   i t o t a l   n u m b e r   o f   a l l   p r e y s · 100
The gravimetric percentage (%Cw), representing the percentage of the total weight of the stomach contents from the stomachs analyzed, was calculated as follows:
% C w = W e i g h t   o f   p r e y   i   t o t a l   w e i g h t   o f   a l l   p r e y · 100
Finally, the significance of each prey item was determined using the Index of Relative Importance (IRI), following the modified formula proposed by the authors of [38]:
I R I = % F · % C n + % C w I R I % = I R I · 100 I R I
The dietary niche breadth of the species was calculated using Levins’ index (BA).
B A = B 1 / n 1 ;   B = 1 / p j 2
where pj is the proportion of individuals using resource j or the proportion of resource j in the total resources in the diet, and n is the total number of resources. The scale ranges from 0 to 1, where low values indicate a diet specializing in a few prey items and high values imply a generalist diet [39,40].
Given that both species utilize the surf zones, the overlap in their diets was examined using Schoener’s index (Ojk):
O j k = 1 0.5 · p j i p k i
where pji and pki represent the estimated proportions by weight of prey item i in the diets of species j and k, respectively. The values of the index range from 0 to 1, with the overlap being greatest when the index is close to 1.
Differences in diet by size were analyzed by categorizing specimens of both species into specific size ranges. For the spotted seabass, the categories were defined as follows: Range 1 [<10 cm TL), Range 2 [10–15 cm TL), Range 3 [15–20 cm TL), Range 4 [20–25 cm TL), and Range 5 [>25 cm TL]. For the European seabass, the size ranges were established as follows: Range 1 [<20 cm TL), Range 2 [20–25 cm TL), Range 3 [25–30 cm TL), and Range 4 [>30 cm TL]. The chi-squared test was employed to identify any significant differences in the abundance between age classes influenced by environmental factors.
To thoroughly analyze the diet of both species, establishing the minimum number of stomachs to be examined was essential. This was accomplished by comparing the cumulative number of prey taxa against the cumulative number of stomachs chosen at random. The appearance of an asymptotic curve indicated that a sufficient sample volume had been collected to accurately represent the diet of the species in question [41,42,43]. In order to reduce potential biases, the stomachs selected for analysis were randomized 500 times.
A permutational multivariate analysis of variance (PERMANOVA) was performed to assess significant differences in prey abundance in relation to season, diel cycles, moon phases, and size ranges. This analysis was based on Bray–Curtis dissimilarities [44], and p-values were determined through 9999 unrestricted random permutations [45,46,47].
Furthermore, a one-way analysis of similarities (ANOSIM) was employed to identify statistical differences in dietary composition across season, diel cycles, moon phases, and size categories. ANOSIM utilizes a Bray–Curtis distance matrix, generated from the abundance data of prey species, to compare the mean distances between groups to those within groups. This Bray–Curtis distance matrix, essential in ecological research, measures the compositional dissimilarity among various sites or samples. The scores can range from 0, indicating identical species proportions across samples, to 1, signifying no species overlap between samples. This method provides a nuanced understanding of community composition, surpassing the simple presence or absence of data, which are particularly relevant in dietary studies [44]. Upon constructing the matrix, ANOSIM produces two key metrics: a p-value, reflecting the statistical significance of the results, and an R-statistic, comparing the average ranked dissimilarities between groups with those within groups. An R-value closer to 1 suggests significant dissimilarity between groups, while an R-value near 0 indicates a homogeneous distribution of ranks, both within and among groups [48,49].
All statistical analyses were performed using R software (version 4.1.3; R Core Team, 2022), with a set significance level (α) of 0.05. The analyses utilized additional packages including “tidyverse” [50], which encompasses “dplyr” [51] and “ggplot2” [52], “lubridate” [53], “vegan” [54], “reshape2” [55], “forcats” [56], “modelr” [57], “gridExtra” [58], and “devtools” [59].

3. Results

3.1. Spotted Seabass, Dicentrarchus punctatus

3.1.1. Biometric Analysis

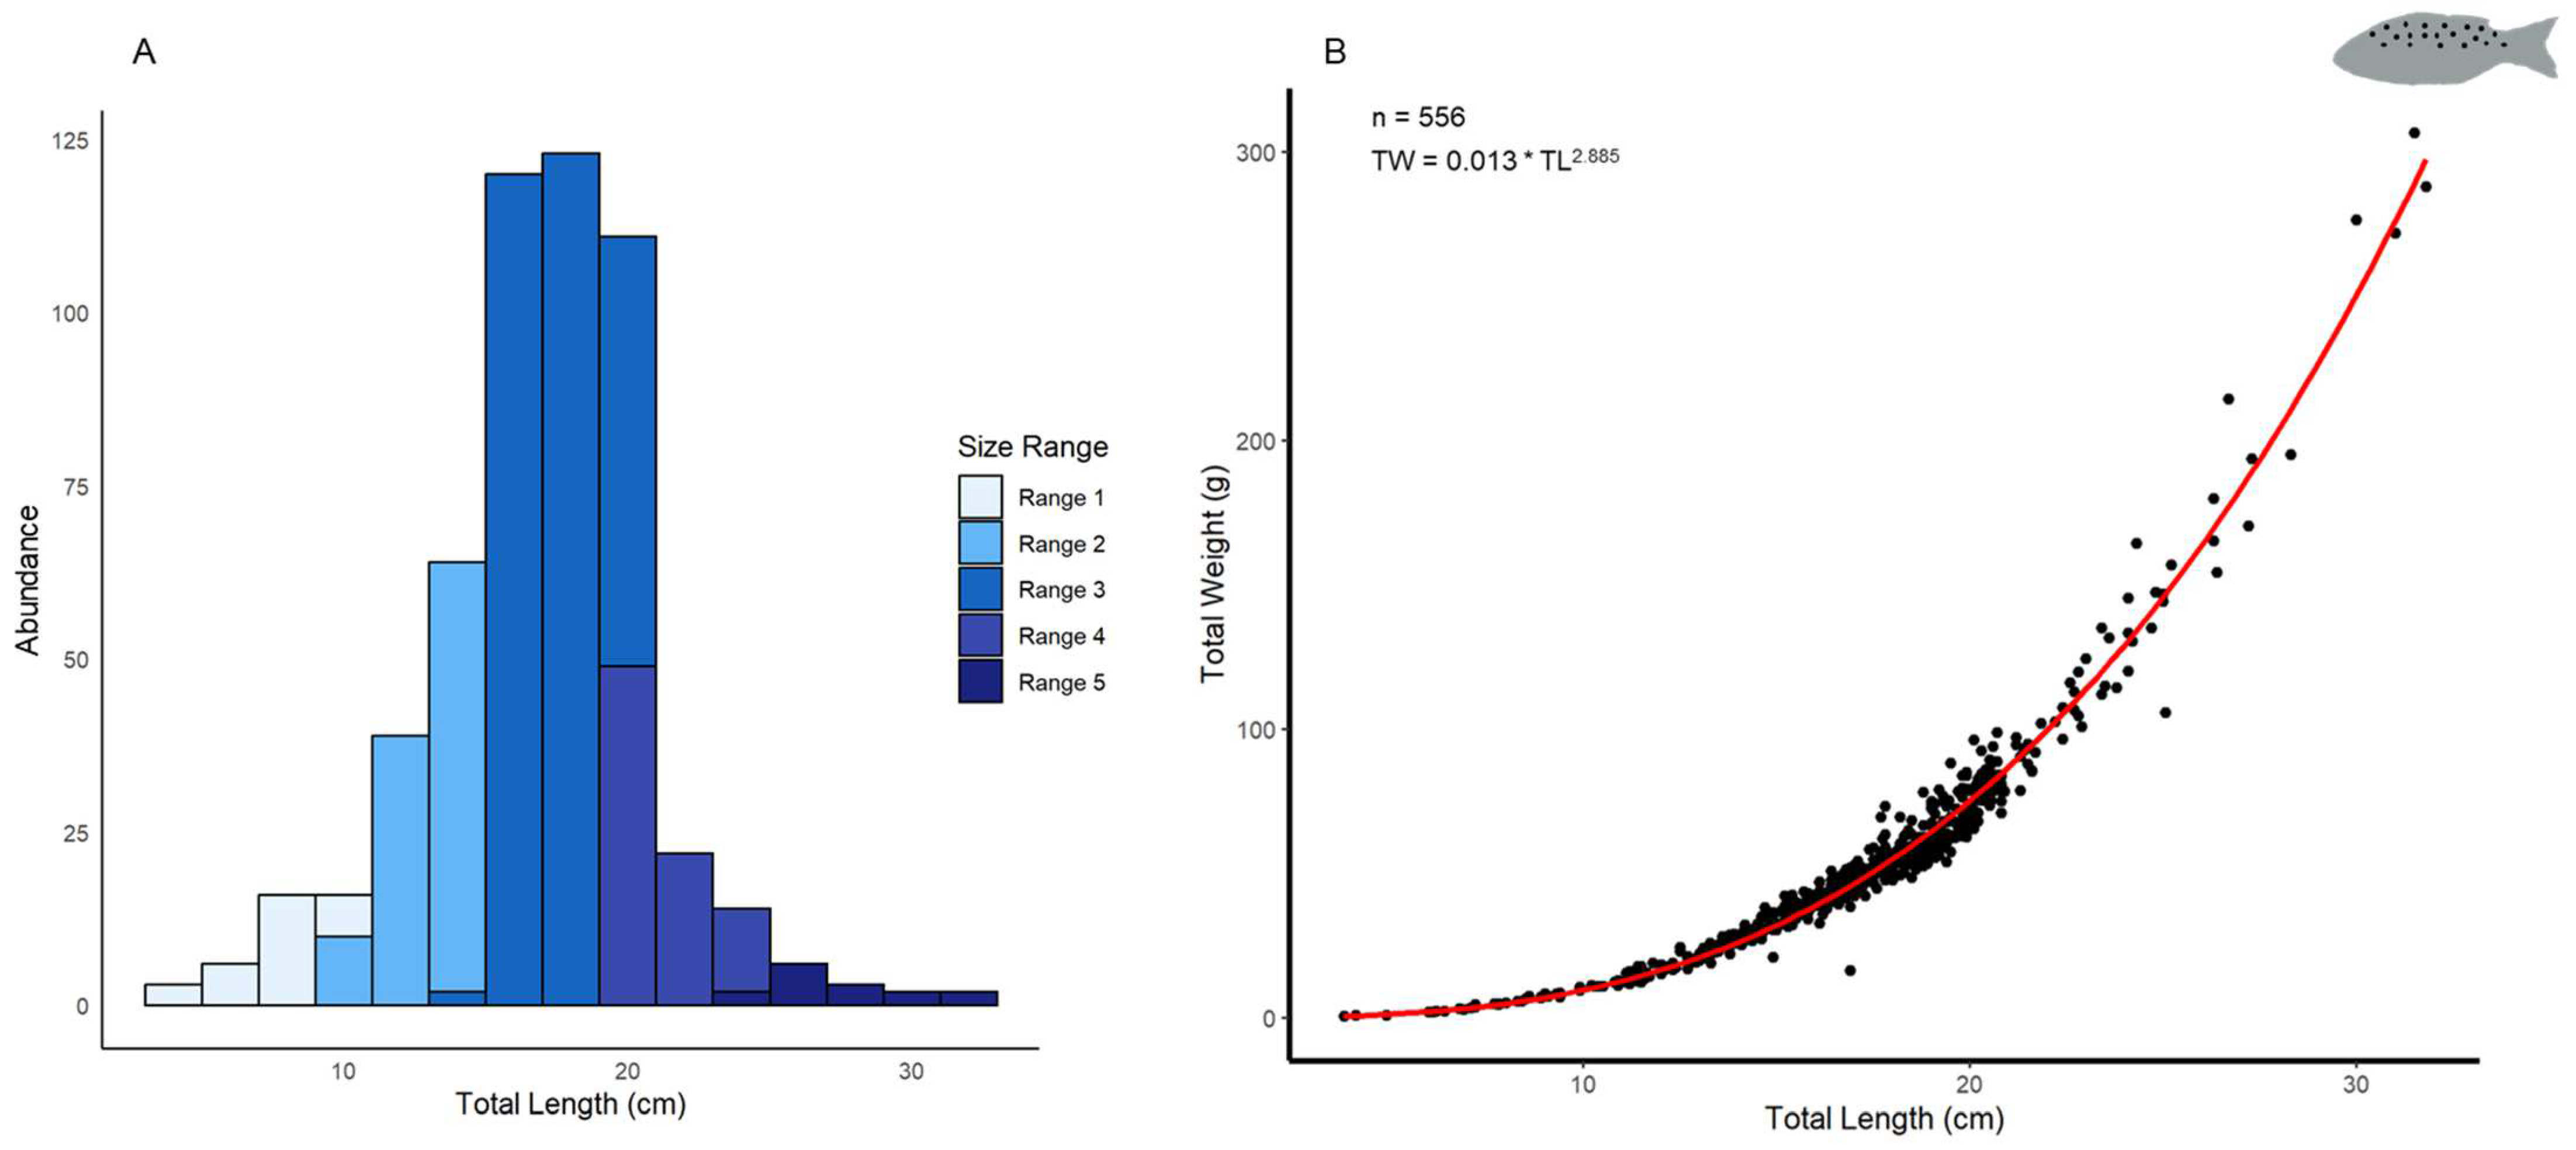
A total of 556 spotted seabass were captured, with an average total length (TL) of 16.94 ± 4.05 cm and an average total weight (TW) of 53.69 ± 37.09 g. The lengths of the specimens ranged from 3.8 cm to 31.8 cm, predominantly within the 15–21 cm interval (Figure 2A), and their weights varied from 0.71 g to 306.66 g. The parameters for the length–weight relationship (LWR) of spotted seabass were determined as follows: a = 0.013 (C.I.: 0.012–0.014) and b = 2.885 (C.I.: 2.854–2.917), with an R2 value of 0.983 (Figure 2B).

3.1.2. Age Determination

Upon extracting otoliths from each individual, a maximum of four growth marks were noted in the spotted seabass, with the 1+ and 2+ age classes being the most prevalent, constituting 33.63% and 45.57% of the overall catch, respectively (Table 1).
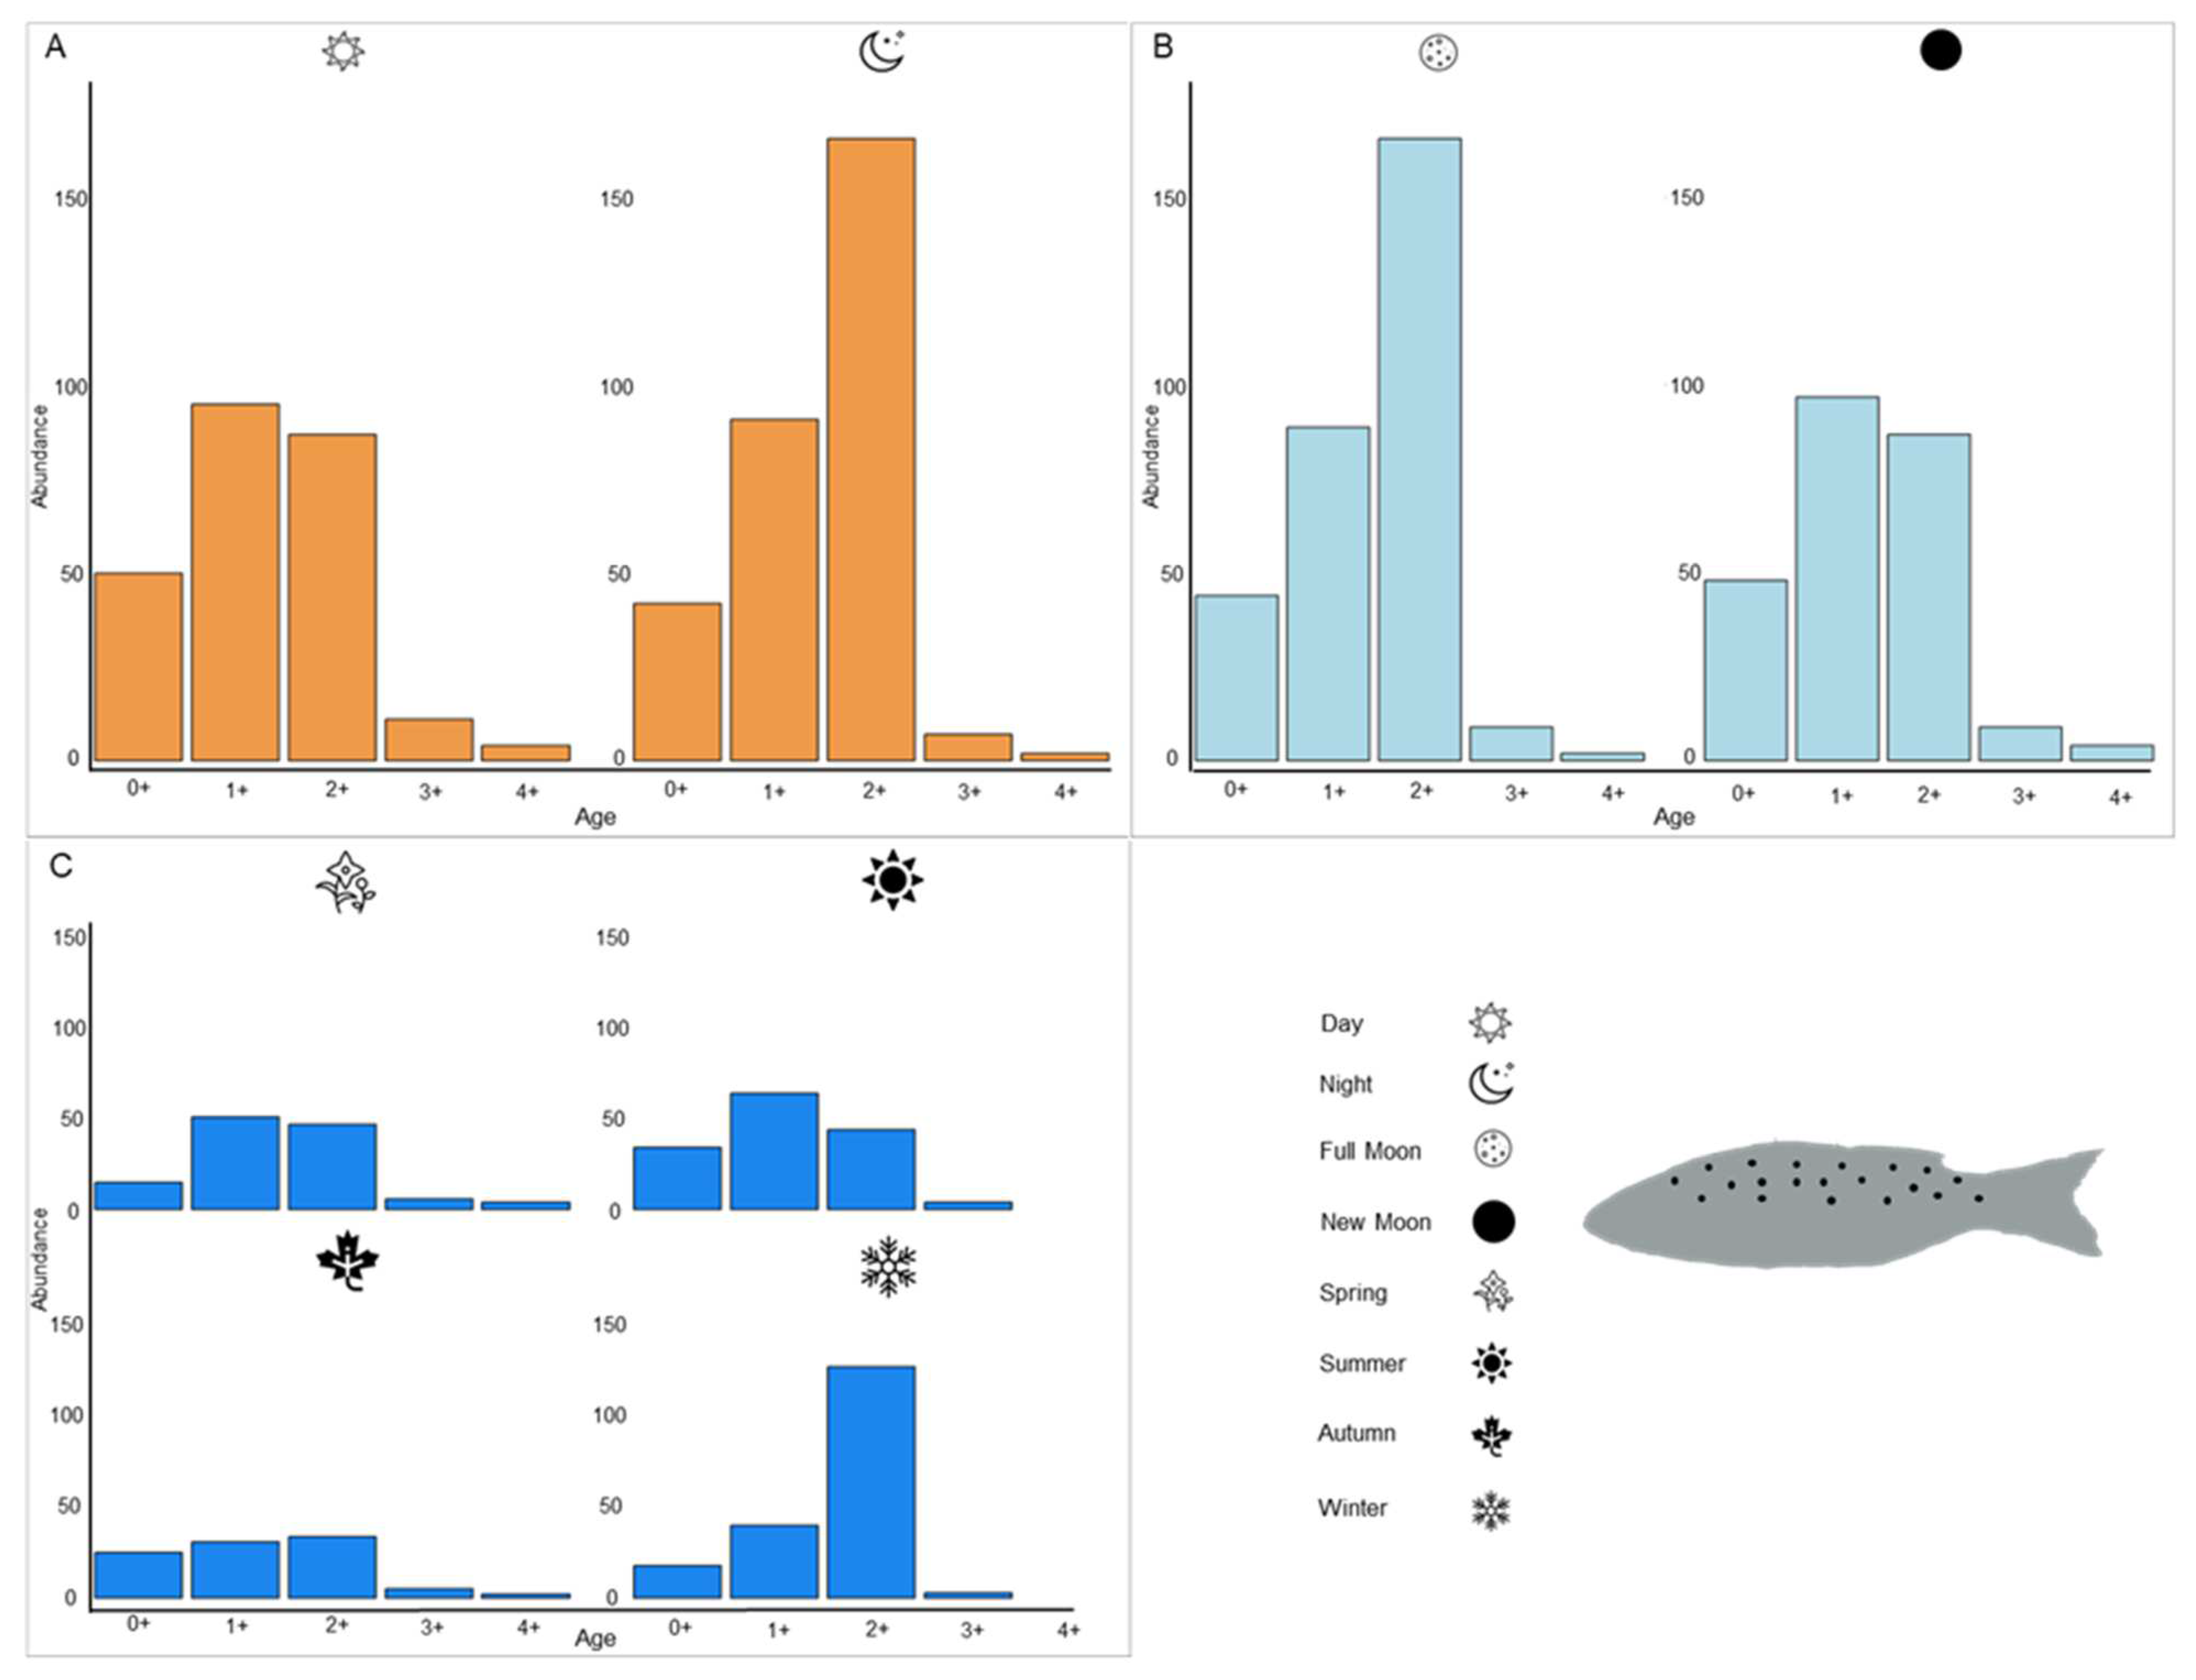
The age class distribution was then analyzed in relation to the time of day (Figure 3A), moon phase (Figure 3B), and season (Figure 3C).
In the diel analysis (Figure 3A), although all age groups were generally more abundant during daylight, the 2+ age class showed a notable increase in numbers at night. A chi-squared test indicated significant variations among age classes (χ2 test, X22 = 20.549, p-value < 0.001).
During the analysis of moon phases (Figure 3B), it was observed that, aside from the age 2+ specimens, all other age classes exhibited increased abundances during the new moon. The chi-squared test identified significant differences among the age classes (χ2 test, X22 = 18.494, p-value < 0.001).
Seasonal analysis (Figure 3C) revealed that during spring, the 1+ and 2+ age classes were predominantly observed with comparable abundances. In summer, there was a noticeable increase in the 0+ and 1+ age classes, with 1+ emerging as the dominant group. Conversely, in autumn and particularly in winter, the 2+ age class became predominant. The chi-squared test indicated significant variations across different age classes (χ2 test, X22 = 77.103, p-value < 0.001).

3.1.3. Feeding Habits

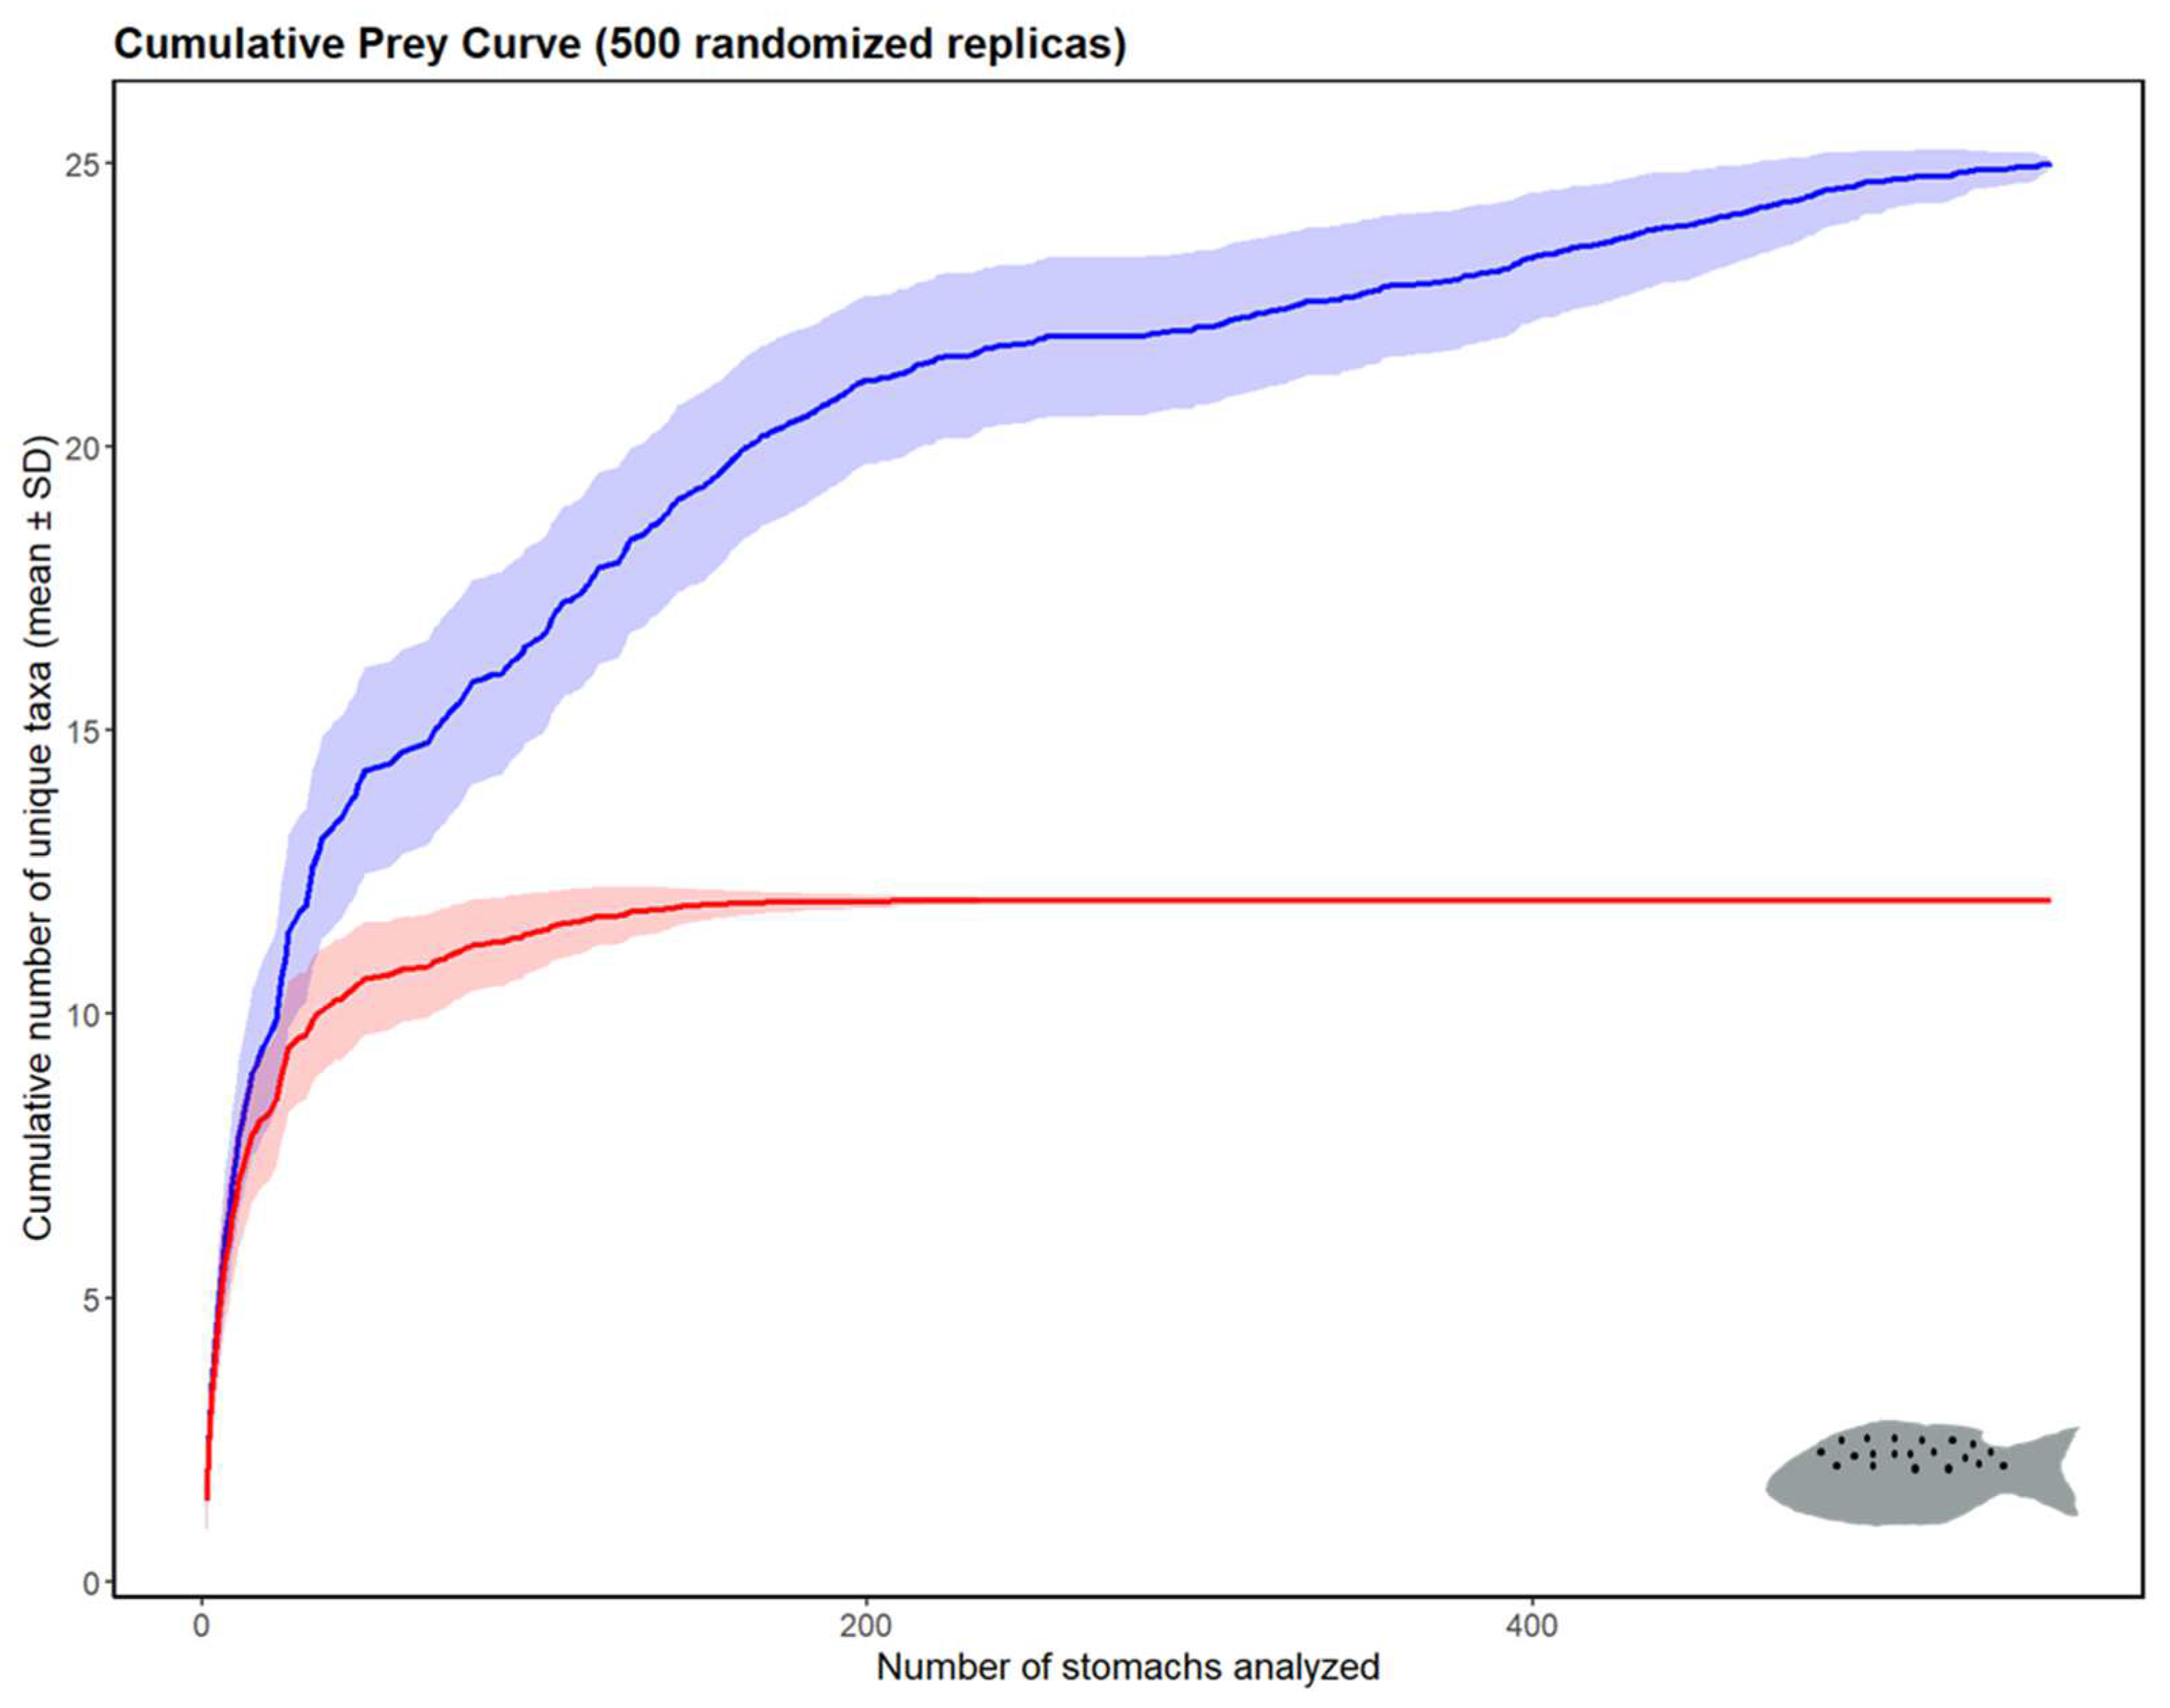
The prey accumulation curve for the spotted seabass (Figure 4, blue regression line) did not reach an asymptote, indicating that sampling did not capture the full dietary range. Consequently, a refined curve focusing only on prey items that constituted at least 1% of the Index of Relative Importance (IRI) was constructed (Figure 4, red regression line), which did asymptote at approximately 200 specimens.
The stomach content analysis revealed a vacuity index of 39.2%, with 218 stomachs found to be empty. In total, 25 distinct prey items were identified, grouped into six categories: Annelids, Crustaceans, Insects, Molluscs, Osteichthyans, and Chelicerates (Table 2). Within these, mysidaceans (Crustacea, Order Mysida) emerged as the most dominant dietary component, contributing to 66.6% of the IRI.
The PERMANOVA analysis revealed significant variations in prey abundance associated with different moon phases (PERMANOVA, pseudo-F = 8.204, p-value < 0.001), seasons (PERMANOVA, pseudo-F = 6.519, p-value < 0.001), and size ranges of the specimens (PERMANOVA, pseudo-F = 0.383, p-value < 0.05). However, no significant differences were detected when considering the interaction of these environmental variables (Table 3).
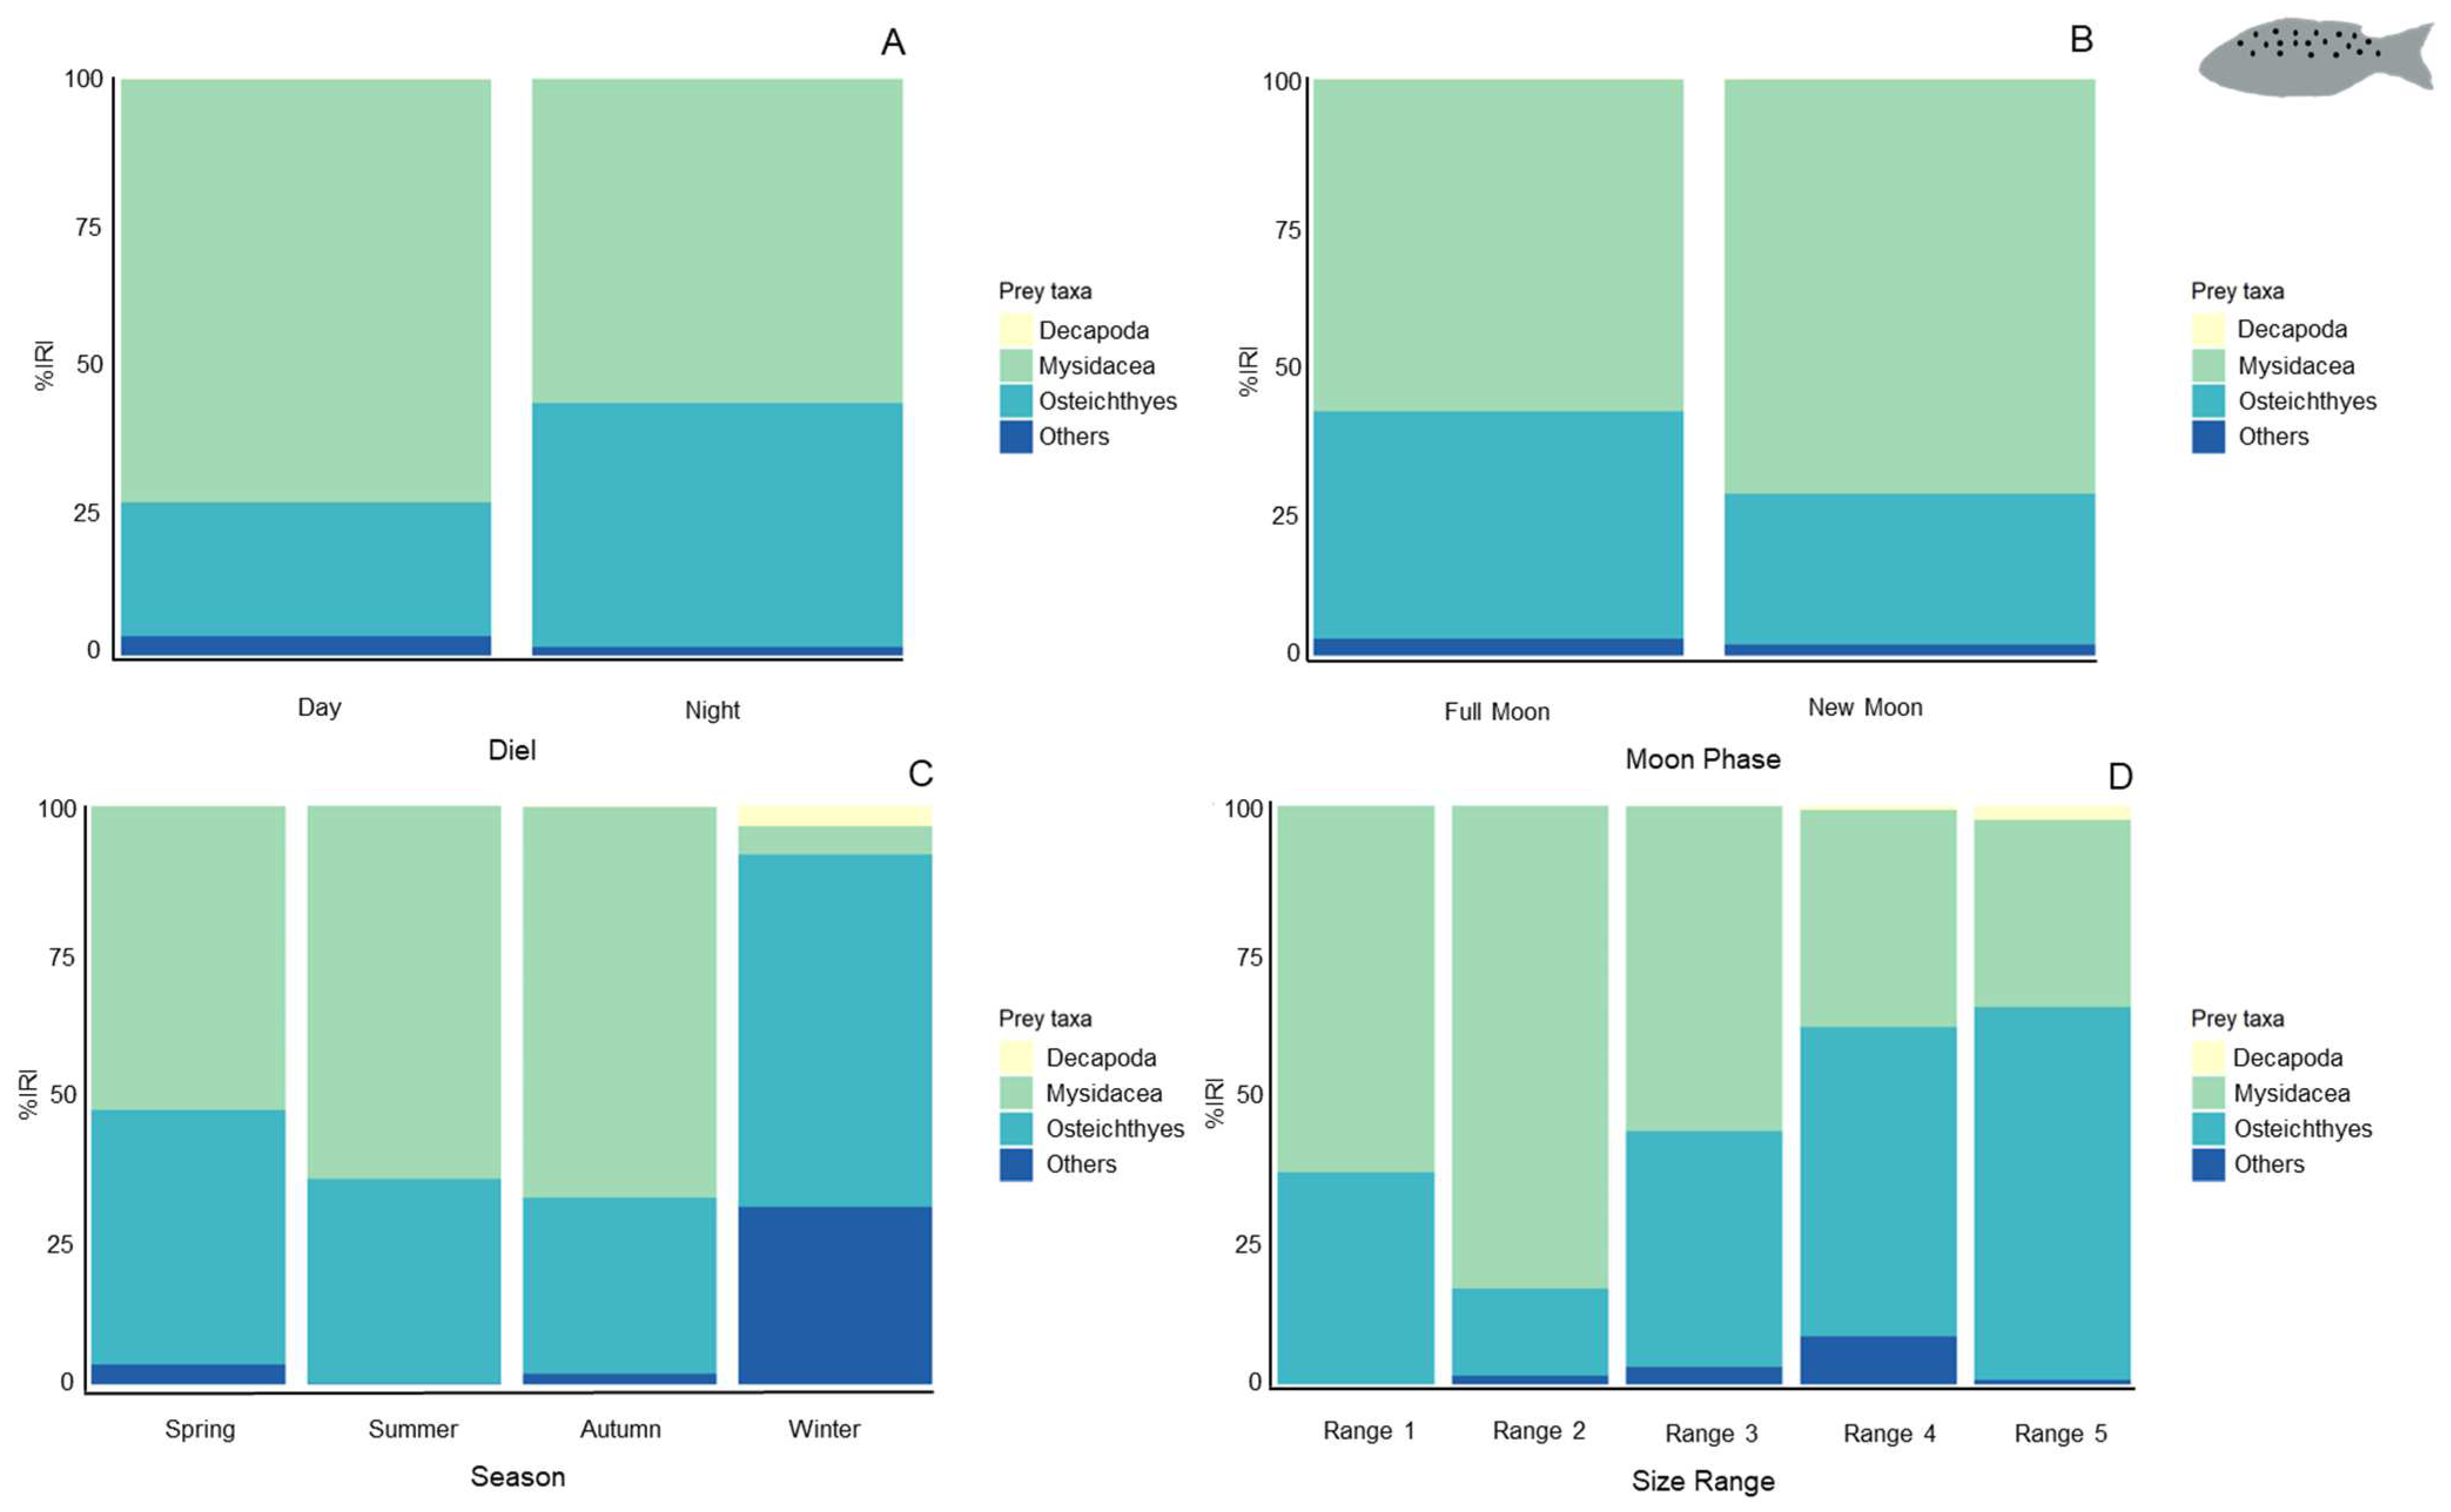
The dietary analysis based on the time of day (Figure 5A) indicated that mysidaceans remained the predominant prey for the spotted seabass across both diurnal (73.3% IRI) and nocturnal (56.2% IRI) periods. However, nocturnal feeding showed a marked increase in fish consumption (42.3% IRI). The ANOSIM test confirmed significant variations in the diet composition between day and night (ANOSIM, R = 0.008, p-value = 0.009).
Regarding moon phases (Figure 5B), during the full moon, the spotted seabass primarily consumes mysidaceans and fish (57.6% IRI and 39.4% IRI, respectively), while its diet during the new moon is predominantly mysidaceans (71.8% IRI). The ANOSIM analysis indicated that these differences in diet composition across moon phases were not statistically significant (ANOSIM, R = 0.002, p-value = 0.242).
Seasonally (Figure 5C), the diet composition of the spotted seabass remains consistent across spring, summer, and autumn, with mysidaceans (52.6% IRI, 64.7% IRI, and 67.5% IRI) and fish (43.8% IRI, 35.2% IRI, and 30.5% IRI) as the primary food sources. However, during winter, the diet diversifies and shifts towards a greater reliance on fish (60.9% IRI) and other resources (30.6% IRI). Significant seasonal dietary differences were confirmed by ANOSIM (R = 0.045, p-value = 0.001).
Size-wise (Figure 5D), mysidaceans dominate the diet in the first two size ranges (63.5% IRI and 83.3% IRI, respectively). In Range 3, while mysidaceans remain a significant component (56.3% IRI), there is an increase in fish consumption (40.6% IRI). In larger size ranges (Range 4 and Range 5), fish emerge as the primary dietary component (53.3% IRI and 64.3% IRI, respectively). The ANOSIM test revealed diet composition variance with size to be statistically significant (ANOSIM, R = 0.017, p-value = 0.047).

3.2. European Seabass, Dicentrarchus labrax

3.2.1. Biometric Analysis

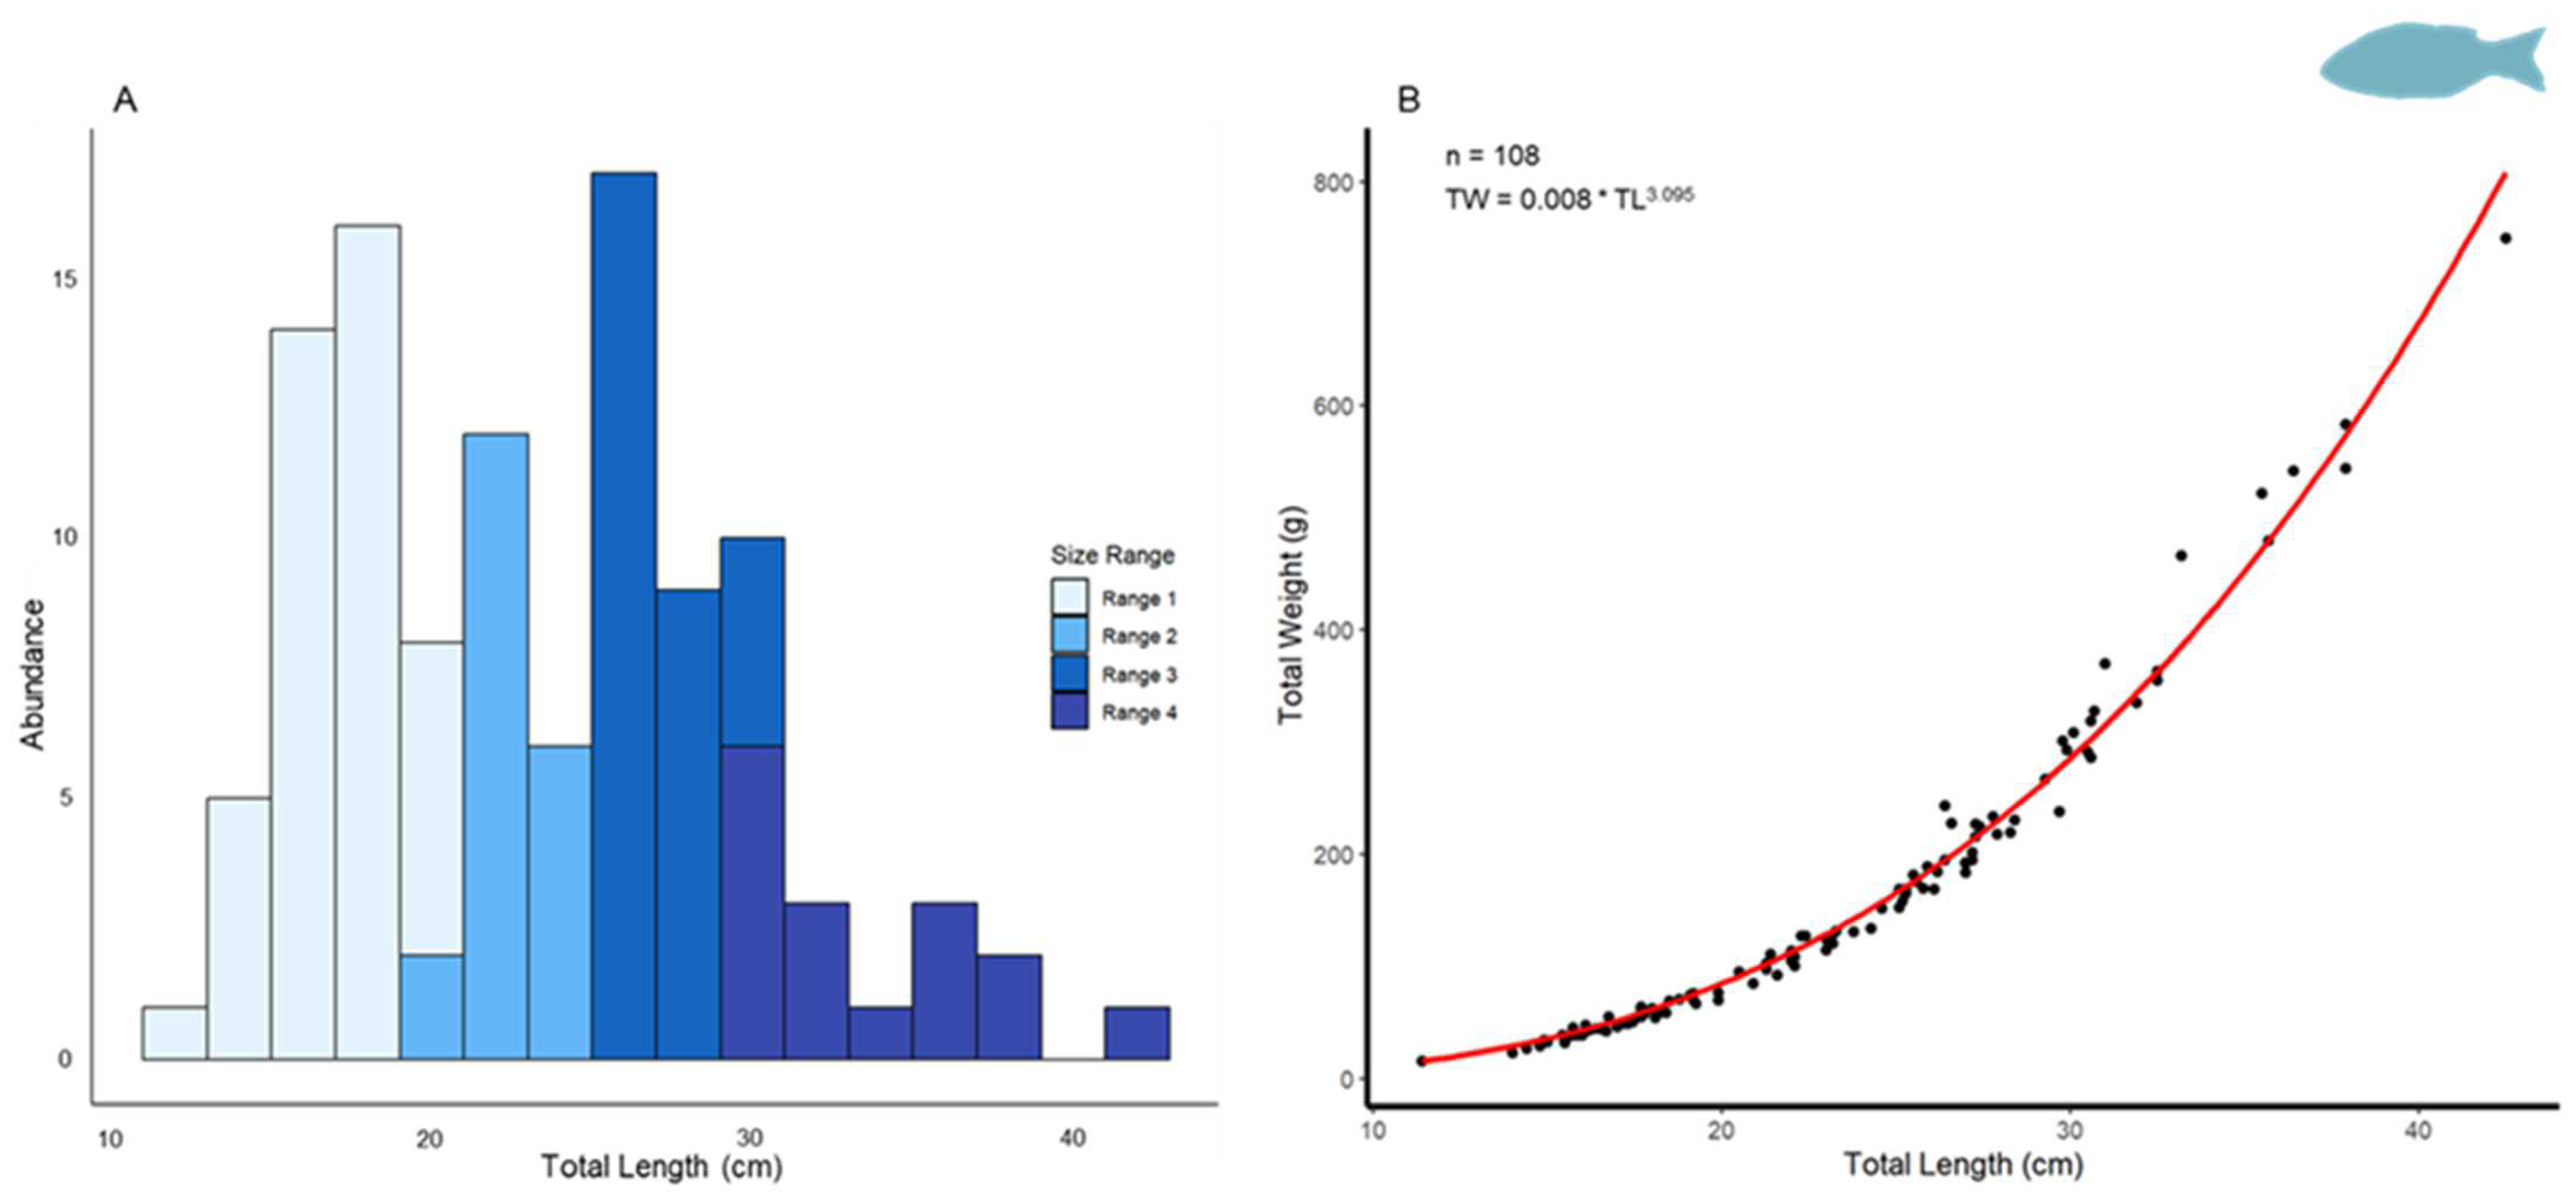
During the study, 108 European seabass specimens were collected, showing an average total length (TL) of 23.23 ± 6.30 cm and an average total weight (TW) of 161.26 ± 139.14 g. The range of lengths spanned from 11.4 to 42.5 cm, while weights varied from 15.93 g to 749.06 g, with the most frequent sizes falling within 17–19 cm and 25–27 cm categories (Figure 6A). The LWR for the European seabass yielded parameters of a = 0.008 (C.I.: 0.006–0.009) and b = 3.095 (C.I.: 3.040–3.151), with an R2 value of 0.991 (Figure 6B).

3.2.2. Age Determination

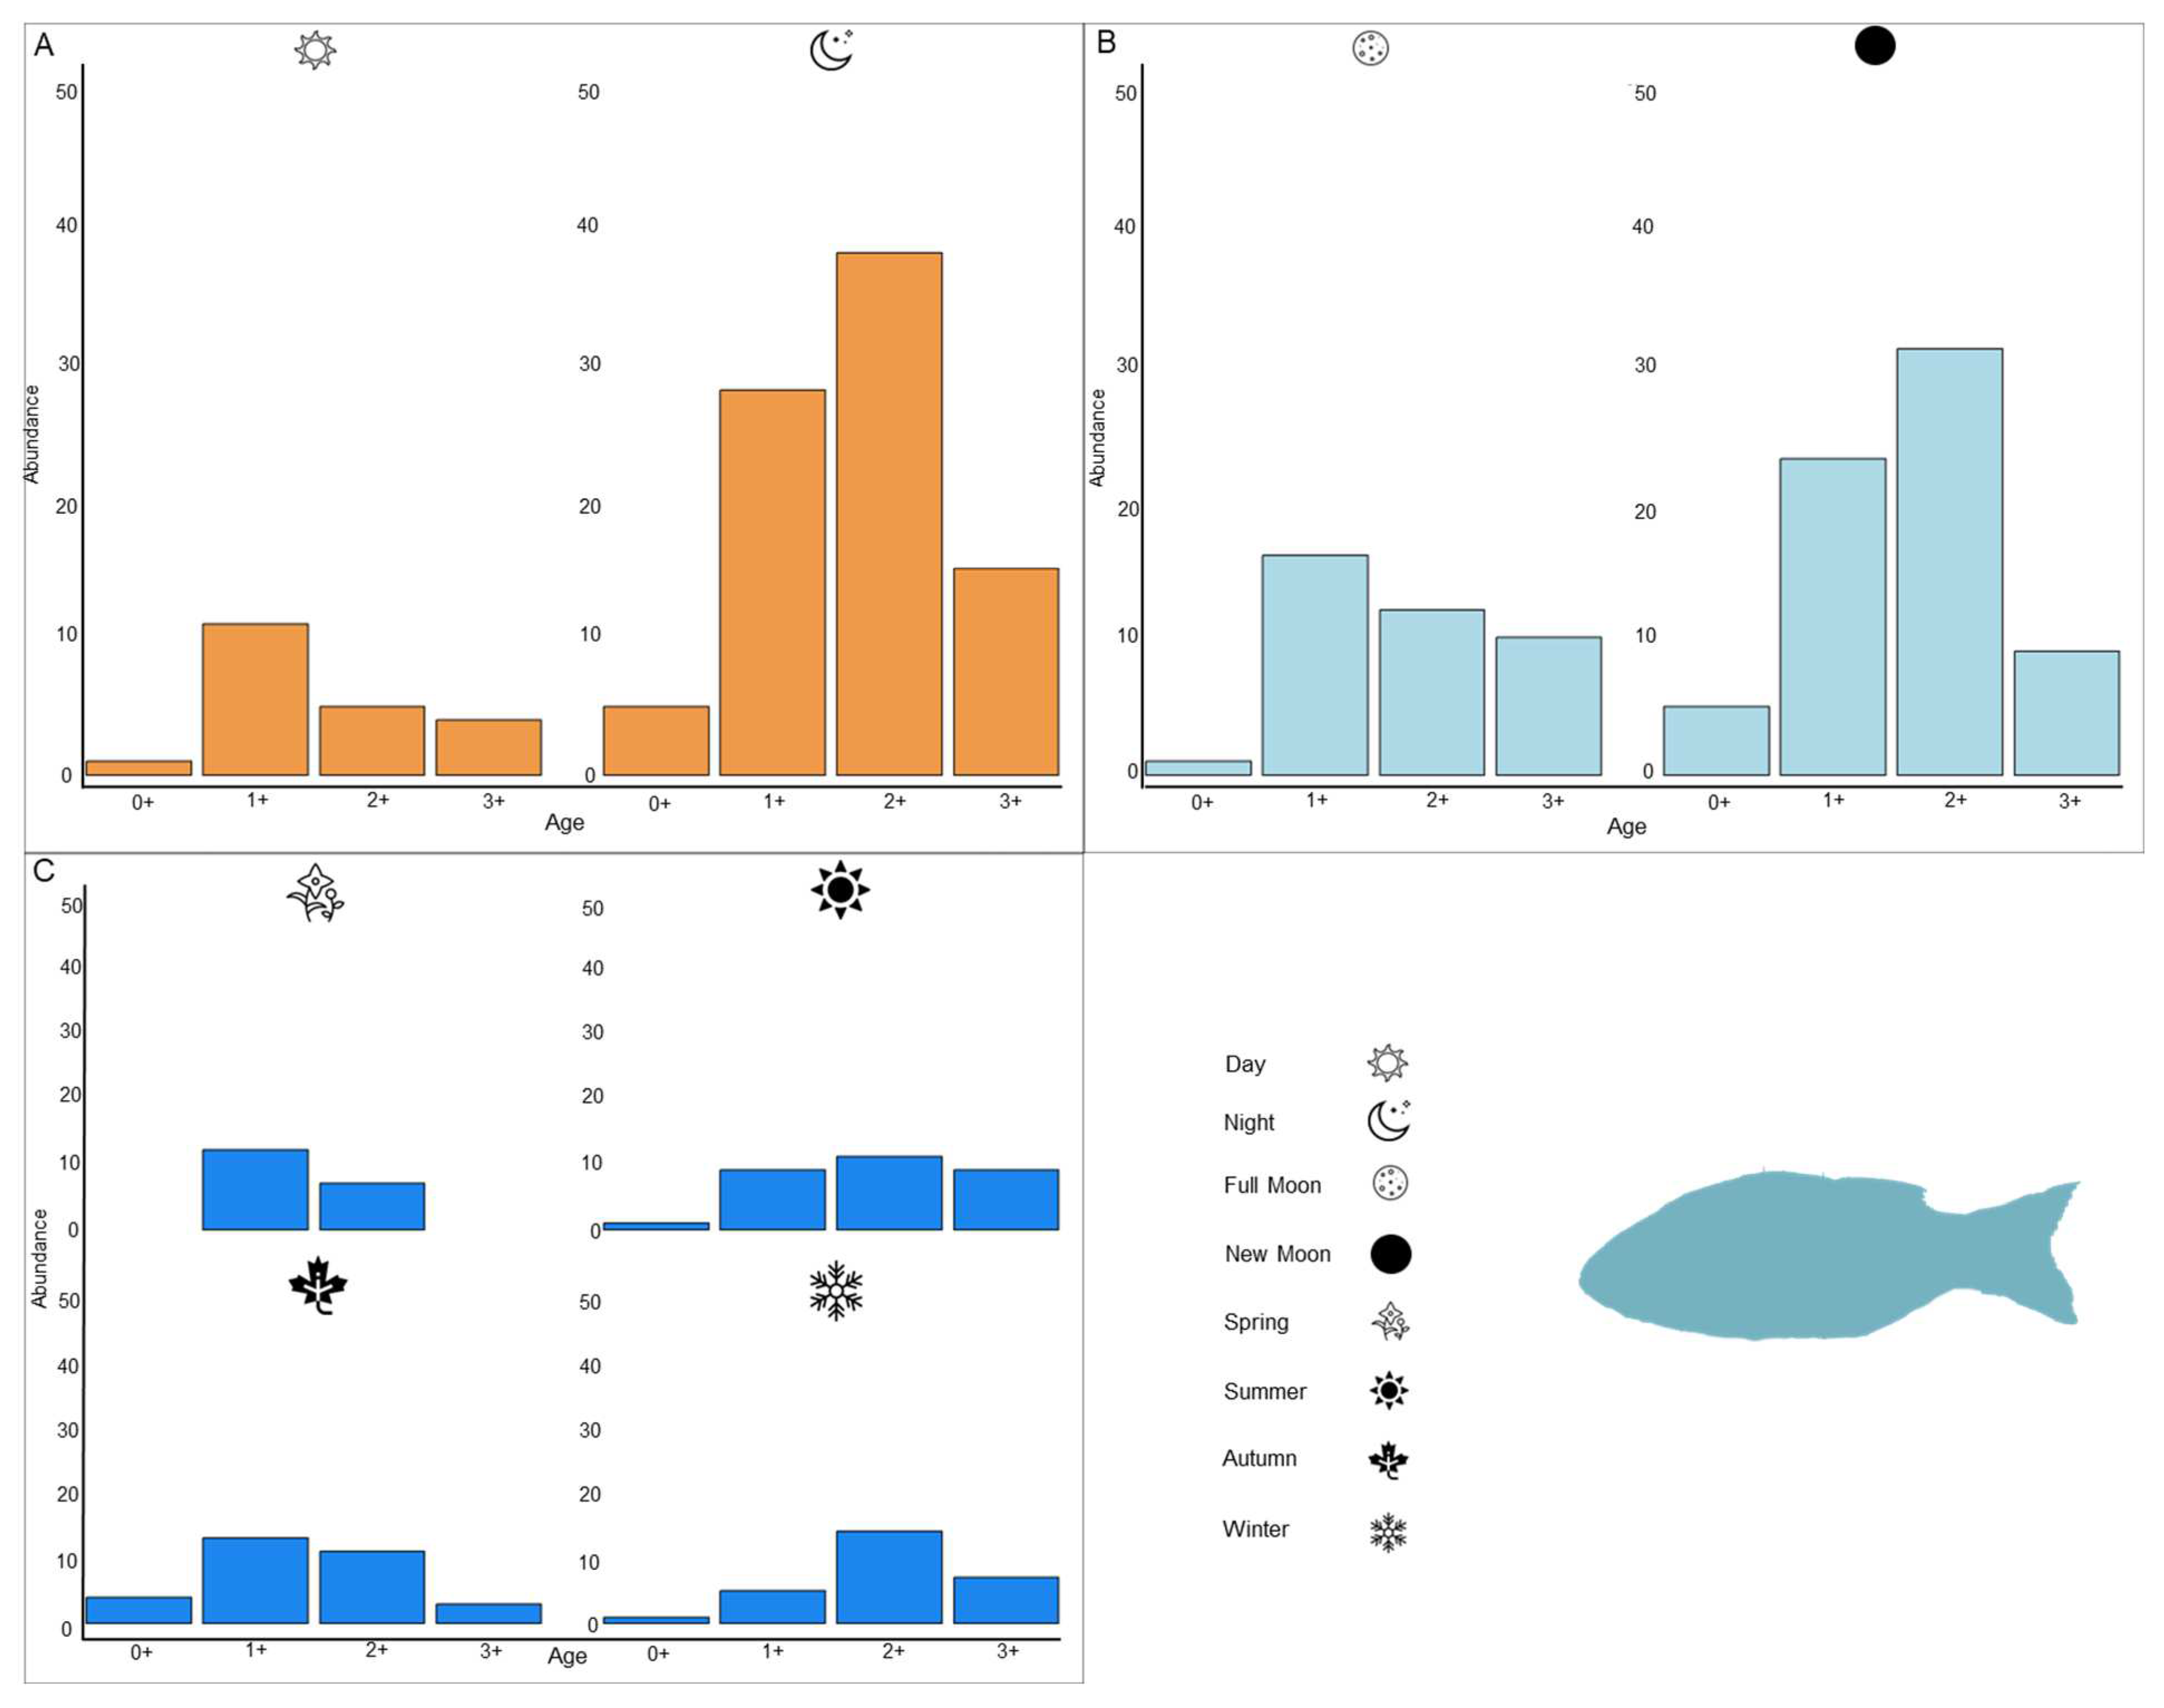
Otoliths were successfully extracted from all the European seabass specimens, revealing up to four growth marks. The predominant age classes were 1+ and 2+, constituting 36.11% and 39.81% of the overall abundance, respectively (Table 1).
Subsequent analyses of age class distribution considered various factors, including the time of day (Figure 7A), moon phase (Figure 7B), and season (Figure 7C).
It was observed that there were no significant differences in the age class distribution of the European seabass depending on the time of the day (χ2 test, X22 = 3.621, p-value = 0.305), while all age classes of the European seabass displayed higher abundances at night compared to during the day; the age classes 1+ and 2+ were notably the most abundant (Figure 7A).
During the analysis by moon phase (Figure 7B), a higher abundance of all age classes was observed during the new moon, except for the age class 3+, which was more abundant during the full moon. No significant differences in abundance related to moon phases were found (χ2 test, X22 = 4.869; p-value = 0.182).
Seasonal analysis (Figure 7C) revealed that age class 1+ was predominant in spring and autumn, whereas age class 2+ was most abundant in summer and winter. The age classes 0+ and 3+ were absent in spring but present during the other seasons, reaching their peak abundances in autumn and summer, respectively. The chi-squared test indicated significant differences between the age classes across seasons (χ2 test, X22 = 20.449, p-value = 0.015).

3.2.3. Feeding Habits

For the European seabass, the initial cumulative prey curve did not reach stability (Figure 8, blue regression line), leading to the creation of a secondary curve that considered only those prey items constituting 1% or more of the Relative Importance Index (IRI) (Figure 8, red regression line). This adjusted curve exhibited asymptotization after examining 95 specimens.
The vacuity index for the European seabass was calculated at 23.1%, with 25 empty stomachs encountered. In total, 26 distinct dietary items were identified and classified into five categories: Algae, Crustaceans, Insects, Molluscs, and Osteichthyans (Table 2). Among these, mysidaceans (Crustaceans) had the highest IRI value at 38.7%, followed by members of the Atherinidae family (22.7% IRI) and unidentified fish species (19.9% IRI) within the Osteichthyans group.
No significant differences were detected in the prevalence of prey items within the European seabass diet across the studied factors.
Daytime dietary analysis (Figure 9A) showed that the European seabass has a more diverse diet during the day compared to nighttime, predominantly consuming mysidaceans (47.7% IRI) during daylight hours. In contrast, fish constituted the main component of their diet at night (66.0% IRI). Despite the overall lack of significant variance across many factors, ANOSIM did reveal significant differences in diet composition when comparing day-versus-night feeding habits (ANOSIM, R = 0.076, p-value = 0.003).
Regarding the moon phase influence (Figure 9B), the European seabass diet composition exhibited a similar pattern to that observed with time of day. During the full moon, mysidaceans were the predominant prey (72.9% IRI), whereas fish became the primary food source during the new moon (58.6% IRI). The ANOSIM analysis confirmed significant dietary composition differences in relation to the moon phase (ANOSIM, R = 0.038, p-value = 0.021).
Seasonally (Figure 9C), fish emerged as the most consumed prey for the European seabass across all seasons. Spring revealed a broader dietary diversity for the European seabass, with the “Other” category comprising 22.5% IRI of the diet. During summer and autumn, mysidaceans were the second most consumed prey following fish, with IRIs of 43.4% and 34.3%, respectively. In winter, decapods became more prominent in the diet, with an IRI of 27.5%. Despite these seasonal variations in prey consumption, no significant differences in diet composition were observed across the seasons (ANOSIM, R = 0.007, p-value = 0.229).
In examining the diet relative to the size of the European seabass specimens (Figure 9D), mysidaceans were found to be the primary diet component in the smaller size ranges (59.3% IRI for Range 1 and 42.4% IRI for Range 2). In Range 2, fish (34.4% IRI) and decapods (20.6% IRI) also formed significant proportions of the diet. Conversely, in the larger size categories (Ranges 3 and 4), fish dominated the dietary intake (70.8% IRI for Range 3 and 70.5% IRI for Range 4), with decapods notably prevalent in Range 4 (27.8% IRI). Despite these variances across different size ranges, no significant dietary composition differences were detected (ANOSIM, R = -0.005, p-value = 0.582).

3.3. Feeding Indices

The Levins’ index showed a result of 0.118 for the spotted seabass and 0.105 for the European seabass. The Schoener diet overlap index between the two species was 0.74.

4. Discussion

The findings indicate that the spotted seabass exhibits a growth pattern leaning towards negative allometry, whereas the European seabass displays a trend towards positive allometry, based on their respective length–weight relationships (LWRs). These LWR values represent the first recorded for these species in the Gulf of Cádiz. The most common age classes identified were 1+ and 2+ for both species. Mysidaceans were identified as the primary prey for both, yet fish constituted the main component of the European seabass’s diet. Additionally, dietary shifts in response to environmental variables and the size of the specimens were observed in both species.
The sizes of the specimens captured in this study (spotted seabass: 3.8–31.8 cm TL; European seabass: 11.4–42.5 cm TL) contrast with the ranges reported in other studies for both species. For the spotted seabass, various research conducted in Egypt presents differing size ranges (e.g 13.1–36.1 cm TL by [60], 10.1–34.7 cm TL by [20], and 14.7–36.8 cm TL by [21]). Similarly, for the European seabass, differing sizes have been reported in studies from various locations, for example, 1.7–74.8 cm TL in Greece by [61], 5.1–17.3 cm TL in Portugal by [30], and 18.4–65.3 cm TL in Egypt by [26]. Variability in size ranges can be attributed to differences in specimen sources, such as commercial catches that might focus on specific size ranges due to regulatory minimum size limits, or seasonal variations where juveniles or adults are more prevalent. Additionally, differences in research methodologies and fishing gear used across studies could also contribute to account for these variations.
The LWR indicates negative allometric growth for spotted seabass (b = 2.885) and positive allometric growth for European seabass (b = 3.095). These results for spotted seabass are consistent with those obtained, for example, by the authors of [21] (b = 2.956) and [20] (b = 2.985), although they diverge from [60] (b = 3.133), all within Egypt, and [62] in Portugal (b = 3.440). Conversely, for European seabass, the results align with findings by the authors of [63] in Greece (b = 3.076) and [64] with b values of 3.158 and 3.200, and [65] in Croatia with b values of 3.065 and 3.146, but they contrast with the authors of [26] in Egypt (b = 3.0067) and [62] in Portugal (b = 3.039). These variations may be attributable to several factors. For instance, differences can arise from the distinct geographical populations of the species, which may exhibit different body characteristics, or from the time of year when the specimens are caught. The number of specimens analyzed, and the size ranges considered in each study also influence the LWR parameters. Additionally, factors such as sampling methods and the use of commercial catches could impact LWR parameters.
For both spotted seabass (79.20%) and European seabass (75.92%), the predominant age classes throughout the study were 1+ and 2+, with significant differences for both species according to season and also for spotted seabass according to time of day and moon phase. These results are consistent with other work in coastal areas for both spotted seabass [1,21] and European seabass [25,26], where the most abundant specimens were within these ages. European seabass is a species with a well-known migratory behavior, migrating its free-living embryos to shallow areas, such as estuaries and coastal lagoons, where, after growing, they travel to deeper and more open areas for reproduction [66], and spotted seabass may have a similar behavior. Therefore, the predominance of these age classes, both spotted seabass and European seabass, in the surf zone could be due to the use of this habitat by both species as an intermediate zone between the places where they spend their first year of life, shallower and protected areas, and the deeper areas where adults have their habitat.
Regarding variations with time of day, moon phase and season, as a function of time of day, although significant diurnal variations in catch rates were only observed for spotted seabass, both species were generally more abundant at night. This nocturnal prevalence could be attributed to several factors, including a strategy to avoid predation by visual and diurnal predators such as seabirds, by coming to these areas at the time of day when these species do not hunt. Alternatively, the increased nighttime abundance might be linked to foraging behavior, capitalizing on heightened prey activity, including small fish and zooplankton, during nocturnal hours [67,68,69,70]. This latter explanation aligns well with the known nocturnal feeding patterns of the European seabass and is likely applicable to the spotted seabass as well [66]. However, it is crucial to consider that the sampling methodology itself, encompassing gear type and the specific timing of sampling, might influence catch rates due to the fish’s enhanced ability to detect and evade nets during daylight [71,72].
While significant variations in abundance with moon phase were noted solely for the spotted seabass, a general trend of higher abundance during the new moon was observed for both species. Similar patterns have been reported for other surf zone inhabitants like the pompano (Trachinotus ovatus) [73], potentially attributed to the enhanced concealment from predators and prey alike afforded by the diminished light. Moreover, the increased presence of 2+-year-old spotted seabasses during the full moon might reflect an adaptive response to exploit the additional illumination for more effective foraging, despite the heightened risk of predation [74]. Nonetheless, it is essential to acknowledge that the specifics of the sampling approach, including timing and methodology, might introduce biases affecting these observed patterns.
The abundance of various age classes for both species shows distinct seasonal patterns. For the spotted seabass, the 1+ age class is most prevalent during spring and summer, whereas the 2+ age class is more abundant in autumn and winter. These trends could be linked to the species’ reproductive cycle, with the spawning season extending from November to March, and sexual maturity being reached at around 2 years of age for both sexes, albeit at different lengths [1,20,21,22,23]. Such maturity milestones could account for the observed increase in the 2+ age class during these periods, possibly followed by a migration to deeper waters, thereby making the 1+ age class more conspicuous in spring and summer. For the European seabass, the 1+ age group is predominantly found in spring and autumn, while the 2+ category is most frequent in summer and winter, aligning with its breeding season from December to March. European seabass males typically reach sexual maturity at 2 years, with females maturing at 3 years [31]. This reproductive timing may elucidate the increased presence of older fish in winter, while the elevated numbers of 1+ individuals during other seasons could be linked to post-spawning dispersal or juvenile migration from estuaries to warmer, shallower waters, especially from spring to summer [10]. These movements are often driven by water temperature, which correlates with the heightened abundance during warmer periods [30].
Regarding the diet, our results indicate that for both species, one of their main prey items are mysidaceans, although fish are also significant in the diet of the European seabass. These findings are consistent with those reported by other authors [24,29,75,76]. However, they differ from other studies such as [30,61], where the authors report that the European seabass primarily feeds on decapods, isopods, and mysidaceans, and [22] which determine that the main prey of the spotted bass were molluscs and crustaceans. These variations in diet could be attributed to geographical differences between study sites, which may lead to greater abundance of certain prey items in one location compared to another. Differences in the number and size of specimens analyzed in these studies compared to ours can also influence the results. For example, in [77], 408 European seabass ranging from 2.5 to 70 cm TL were examined, and in [22], 909 specimens of spotted seabass between 3.5 and 10.4 cm TL were studied. Additionally, the time of year when the studies are conducted can result in higher abundances of specific resources.
Significant differences were found in the dietary composition of both species depending on the time of day. The European seabass is an active nocturnal hunter [67], a behavior that the spotted seabass might also exhibit. This diurnal variation could be due to increased predatory activity at night, focusing on capturing their main prey, small fish, and mysidaceans, given their higher abundance in the surf zone during nighttime. The nocturnal increase in zooplankton in the surf zone is corroborated by various authors [78,79], and this greater availability of zooplankton would also attract other fish species to the surf zone for feeding [71,80], potentially allowing a greater intake of osteichthyes by both the European seabass and the spotted seabass.
Based on the lunar phase, there are significant differences in prey abundance for the spotted seabass and in the dietary composition for the European seabass. In both species, a greater variety of prey is observed during the full moon compared to the new moon, which could be due to the additional light provided during the full moon, allowing for more efficient hunting across a broader range of prey, similar to behaviors observed in certain flatfish species [75]. Consequently, during the new moon, they would focus on hunting the most abundant resources in the area, as larger specimens are attracted to the surf zone, likely due to their enhanced hunting success against smaller fish [81].
Among the two species, only the spotted seabass showed significant seasonal differences in its diet, both in terms of prey abundance and composition. These seasonal diet changes generally reflect shifts in the spatial and temporal distribution of prey, as well as variations in the predators’ feeding activity [82]. For both European seabass and spotted seabass [29], the increased presence of mysidaceans in their diets during summer and autumn could be attributed to the peak abundance of these prey between late spring and autumn [83]. The year-round prevalence of fish and crustaceans in the European seabass diet aligns with findings from other researchers [28,67]. The dietary shift in the spotted seabass during winter might be related to the greater abundance of fish during this season; for instance, the spawning of the European anchovy (Engraulis encrasicolus) occurs in autumn [84], providing an opportunity to feed on the fry and juveniles present in the surf zone. Additionally, the observed dietary change during winter might result from the presence of larger specimens, which could lead to a preference for different prey types, such as fish.
Based on size range, significant differences were found only for the spotted seabass in terms of prey abundance and diet composition. Nonetheless, it is generally observed that as individuals of both species grow, the size of their prey increases as well. This pattern aligns with findings from previous studies on both spotted seabass and European seabass [22,28,61,85,86,87]. The trend toward larger prey as the fish grows can be attributed to energy optimization, ensuring that the energy expended in hunting is always less than the energy gained from consuming the prey [88].
The Levins index values obtained for both species indicate that they are specialists, exhibiting significant dietary overlap. These findings contrast with those described for the European seabass by the authors of [30], who identified it as having generalist feeding behavior, though this is countered by the authors of [86,89], who noted the European seabass as an opportunistic top predator, consuming the most abundant resources available. This characteristic, also applicable to the spotted seabass, might be due to the plentiful prey within the surf zone, such as zooplankton [90,91]. On the other hand, despite the significant dietary overlap, competition for resources is unlikely to occur, because species do not compete when resources are abundant enough to achieve optimal fitness [92], as seen among various species of elasmobranchs [93,94] or small pelagic zooplanktivores [95] in the Mediterranean and in the Gulf of Cádiz [96]. However, changes in environmental factors, such as rising ocean temperatures [97], could alter these interactions, potentially leading to migrations of these and other species to different habitats [95].

5. Conclusions

In summary, the spotted seabass, D. punctatus, and the European seabass, D. labrax, use the surf zones of the beaches in the Gulf of Cadiz as feeding and refuge areas in their early years of life, with ages 1+ and 2+ being the most abundant for both species. The main prey consumed by both congeners are mysid shrimps and fish. Both are specialist species with significant dietary overlap, and both species show differences in the abundance of age classes and diet influenced by environmental factors. The results obtained throughout this work contribute to a better understanding of how both species utilize these habitats in their early years of life, which is of great importance for the management and conservation of species living in the surf zone, highlighting the value of these areas.

Author Contributions

C.R.-G.: Conceptualization, methodology, formal analysis, investigation, writing—original draft, writing—review and editing, data curation. A.T.-P.: Formal analysis, investigation, writing—original draft. J.S.-C.: Investigation, formal analysis, writing—review and editing. R.C.-C.: Investigation, writing—review and editing, data curation, supervision. All authors have read and agreed to the published version of the manuscript.

Funding

No funding was received for this study.

Institutional Review Board Statement

No animal testing was performed during this study. All necessary permits for sampling and observational field studies have been obtained by the authors from the competent authorities and are mentioned in the acknowledgements.

Data Availability Statement

Data will be made available upon reasonable request.

Acknowledgments

The authors would like to thank the Territorial Delegation of Agriculture, Fisheries and Rural Development of Cádiz for its fast disposition to provide us with the permits for the samplings on beaches. The authors wish to express their gratitude to our students Jaime, Patricia, Chari, Isa, Sara, Daniel, Cinthya, Marina, Alberto, and Lucía for their disinterested aid during the sampling and to José Belquior Gonçalves for his help in editing the images. We would also like to express our gratitude to INMAR (Instituto Universitario de Investigación Marina) for allowing us to use their laboratories to carry out all the precision measurements. We would like to thank the three anonymous reviewers for their comments to improve the article.

Conflicts of Interest

The authors declare that they have no known competing financial interests or personal relationships that could have appeared to have influenced the work reported in this paper.

References

  1. Mehanna, S. Fisheries regulations based on yield per recruit analysis for the spotted seabass Dicentrarchus punctatus (Moronidae) at Bardawil lagoon, Mediterranean coast of Sinai, Egypt. Egypt. J. Aquat. Biol. Fish. 2006, 10, 129–145. [Google Scholar] [CrossRef]
  2. Fritsch, M.; Morizur, Y.; Lambert, E.; Bonhomme, F.; Guinand, B. Assessment of sea bass (Dicentrarchus labrax, L.) stock delimitation in the Bay of Biscay and the English Channel based on mark-recapture and genetic data. Fish. Res. 2007, 83, 123–132. [Google Scholar] [CrossRef]
  3. Freyhof, J.; Kottelat, M. Dicentrarchus labrax . IUCN Red List Threat. Species 2008, 2008, e.T135606A4159287. [Google Scholar] [CrossRef]
  4. Trunov, I.A.; Kukuev, E.I.; Sukhorukova, V.S. A finding in the Pregolya River (Kaliningrad oblast) of the black-spotted bass Dicentrarchus punctatus (Moronidae). J. Ichthyol. 2006, 46, 345–346. [Google Scholar] [CrossRef]
  5. Froese, R.; Pauly, D. FishBase. World Wide Web Electronic Publication. 2005. Available online: http://www.fishbase.org (accessed on 14 February 2024).
  6. Carpenter, K.E.; Smith-Vaniz, W.F.; de Bruyne, G.; de Morais, L. Dicentrarchus punctatus . IUCN Red List Threat Species 2015, 2015, e.T198671A21913001. [Google Scholar] [CrossRef]
  7. FAO. FishStat. Global Capture Production QUANTITY (1950–2021). 2023. Available online: https://fao.org/fishery/statistics-query/en/capture/capture_quantity (accessed on 21 December 2023).
  8. Cabral, H.; Duque, J.; Costa, M.J. Discards of the beach seine fishery in the central coast of Portugal. Fish. Res. 2003, 63, 63–71. [Google Scholar] [CrossRef]
  9. Jennings, S.; Pawson, M.G. The origin and recruitment of bass, Dicentrarchus labrax, larvae to nursery areas. J. Mar. Biol. Assoc. U. K. 1992, 72, 199–212. [Google Scholar] [CrossRef]
  10. Dufour, V.; Cantou, M.; Lecomte, F. Identification of sea bass (Dicentrarchus labrax) nursery areas in the north-western Mediterranean Sea. J. Mar. Biol. Assoc. U. K. 2009, 89, 1367–1374. [Google Scholar] [CrossRef]
  11. McLachlan, A.; Brown, A.C. The Ecology of Sandy Shores, 2nd ed.; Academic Press: Amsterdam, The Netherlands, 2006; 373p. [Google Scholar]
  12. Suda, Y.; Inoue, T.; Uchida, H. Fish communities in the surf zone of a protected sandy beach at Doigahama, Yamaguchi prefecture, Japan. Estuar. Coast. Shelf Sci. 2002, 55, 81–96. [Google Scholar] [CrossRef]
  13. Nash, R.D.; Santos, R.S.; Hawkins, S.J. Diel fluctuations of a sandy beach fish assemblage at Porto Pim, Faial Island. Azores. Arquipélago. Life Mar. Sci. 1994, 12, 75–86. [Google Scholar]
  14. Taal, I.; Saks, L.; Rohtla, M.; Jürgens, K.; Svirgsden, R.; Kesler, M.; Verliin, A.; Hubel, K.; Albert, A.; Eschbaum, R. Diel changes in the fish assemblage in a coastal surf-zone area in the eastern Baltic Sea. Boreal Environ. Res. 2017, 22, 83–96. [Google Scholar]
  15. Du Preez, H.H.; McLachlan, A.; Marais, J.F.K.; Cockcroft, A.C. Bioenergetics of fishes in a high-energy surf-zone. Mar. Biol. 1990, 106, 1–12. [Google Scholar] [CrossRef]
  16. Esposito, V.; Andaloro, F.; Bianca, D.; Natalotto, A.; Romeo, T.; Scotti, G.; Castriota, L. Diet and prey selectivity of the red mullet, Mullus barbatus (Pisces: Mullidae), from the southern Tyrrhenian Sea: The role of the surf zone as a feeding ground. Mar. Biol. Res. 2014, 10, 167–178. [Google Scholar] [CrossRef]
  17. Watt-Pringle, P.; Strydom, N.A. Habitat use by larval fishes in a temperate South African surf zone. Estuar. Coast. Shelf Sci. 2003, 58, 765–774. [Google Scholar] [CrossRef]
  18. Costa, L.L.; Landmann, J.G.; Gaelzer, L.R.; Zalmon, I.R. Does human pressure affect the community structure of surf zone fish in sandy beaches? Cont. Shelf Res. 2017, 132, 1–10. [Google Scholar] [CrossRef]
  19. Biagi, F.; Gambaccini, S.; Zazzetta, M. Settlement and recruitment in fishes: The role of coastal areas. Ital. J. Zool. 1998, 65, 269–274. [Google Scholar] [CrossRef]
  20. Omar, S.A.; Ibrahim, G.D.; Ahmed, M.S.; AbdElnabi, H.E. Length-weight relationship, condition factor and growth parameters of spotted sea bass Dicentrarchus punctatus in Bardawil lagoon North Sinai Egypt. Sinai J. Appl. Sci. 2022, 11, 909–920. [Google Scholar] [CrossRef]
  21. Ahmed, A.S.; Mohammed-AbdAllah, E. Assessing fishery status and sustainable exploitation of spotted seabass (Dicentrarchus punctatus) in Bardawil Lagoon, Eastern Mediterranean, Egypt. Egypt. J. Aquat. Res. 2023, 49, 353–359. [Google Scholar] [CrossRef]
  22. Ahmed, A.I. Biology of food and feeding of juvenile Dicentrarchus punctatus (Bloch, 1792) along Port-Said coast on the Mediterranean Sea, Egypt. Egypt. J. Aquat. Res. 2009, 35, 165–176. [Google Scholar]
  23. Attia, S.; El Aiatt, A.; Hassanen, G.D.; Ahmad, M.S.; Elnabi, H.E.A. Reproductive Biology of the Spotted Sea bass, Dicentrarchus punctatus, in Bardawil Lagoon, North Sinai, Egypt. Egypt. J. Aquat. Biol. Fish. 2023, 27, 459–475. [Google Scholar] [CrossRef]
  24. Baldó, F.; Drake, P. A multivariate approach to the feeding habits of small fishes in the Guadalquivir Estuary. J. Fish Biol. 2002, 61, 21–32. [Google Scholar] [CrossRef]
  25. Mehanna, S.F.; El-Aiatt, A.A.; Ameran, M.; Salem, M. Population dynamics and fisheries regulations for the European seabass Dicentrarchus labrax (Moronidae) at Bardawil lagoon, Egypt. In Proceedings of the 3rd International Conference on Fisheries and Aquaculture, Cairo, Egypt, 29 November–1 December 2010; Volume 29. [Google Scholar]
  26. Shalloof, K.A.S.; El-Aiatt, A.; Mohammed, S.M. Biological aspects of the European sea bass (Dicentrarchus labrax L., 1758) from Bardawil lagoon, North Sinai, Egypt. Egypt. J. Zool. 2019, 72, 11–21. [Google Scholar] [CrossRef]
  27. Jennings, S.; Lancaster, J.E.; Ryland, J.S.; Shackley, S.E. The age structure and growth dynamics of young-of-the-year bass, Dicentrarchus labrax, populations. J. Mar. Biol. Assoc. U. K. 1991, 71, 799–810. [Google Scholar] [CrossRef]
  28. Abdel-Hakim, N.F.; Mehanna, S.F.; Eisa, I.A.; Hussein, M.S.; Al-Azab, D.A.; Ahmed, A.S. Length weight relationship, condition factor and stomach contents of the European sea bass, Dicentrarchus labrax at Bardawil Lagoon, North Sinai, Egypt. In Proceeding of the 3rd Global Fisheries and Aquaculture Research Conference, Cairo, Egypt, 29 November–1 December 2010; pp. 1–14. [Google Scholar]
  29. Laffaille, P.; Lefeuvre, J.C.; Schricke, M.T.; Feunteun, E. Feeding ecology of o-group sea bass, Dicentrarchus labrax, in salt marshes of Mont Saint Michel Bay (France). Estuaries 2001, 24, 116–125. [Google Scholar] [CrossRef]
  30. Cabral, H.; Costa, M.J. Abundance, feeding ecology and growth of 0-group sea bass, Dicentrarchus labrax, within the nursery areas of the Tagus estuary. J. Mar. Biol. Assoc. U. K. 2001, 81, 679–682. [Google Scholar] [CrossRef]
  31. Kara, M.H. Cycle sexuel et fécondité du Loup Dicentrarchus labrax (Poisson Moronidé) du golfe d’Annaba. Cah. De Biol. Mar. 1997, 38, 161–168. [Google Scholar]
  32. Arias, A.M.; Drake, P. Estados Juveniles de la Ictiofauna en los Caños de las Salinas de la Bahía de Cádiz; CSIC-Instituto de Ciencias Marinas de Andalucía (ICMAN): Cádiz, Spain, 1990. [Google Scholar]
  33. Lloris, D. Ictiofauna Marina: Manual de Identificación de los Peces Marinos de la Península Ibérica y Balears; 954 especies; Omega: Moscow, Russia, 2015. [Google Scholar]
  34. Waldron, M.E.; Kerstan, M. Age validation in horse mackerel (Trachurus trachurus) otoliths. ICES J. Mar. Sci. 2001, 58, 806–813. [Google Scholar] [CrossRef]
  35. Hayward, P.J.; Ryland, J.S. (Eds.) . Handbook of the Marine Fauna of North-West Europe; Oxford University Press: Oxford, UK, 1995. [Google Scholar]
  36. Ricker, W.E. Computation and Interpretation of Biological Statistics of Fish Populations; Bulletin of the Fisheries Research Board of Canada: Ottawa, Canada, 1975. [Google Scholar]
  37. Froese, R. Cube law, condition factor and weight–length relationships: History, meta-analysis and recommendations. J. Appl. Ichthyol. 2006, 22, 241–253. [Google Scholar] [CrossRef]
  38. Hyslop, E.J. Stomach contents analysis—A review of methods and their application. J. Fish Biol. 1980, 17, 411–429. [Google Scholar] [CrossRef]
  39. Gibson, R.N.; Ezzi, I.A. Feeding relationships of a demersal fish assemblage on the west coast of Scotland. J. Fish Biol. 1987, 31, 55–69. [Google Scholar] [CrossRef]
  40. Krebs, C.J. Ecological Methodology; Longman: London, UK, 1989. [Google Scholar]
  41. Ferry, L.A. Sample size and data analysis: Are we characterizing and comparing diet properly? In Proceedings of the International Congress on the Biology of Fshes, San Francisco, CA, USA, 14–18 July 1996; pp. 71–80. [Google Scholar]
  42. Scenna, L.B.; García De La Rosa, S.B.; Díaz de Astarloa, J.M. Trophic ecology of the Patagonian skate, Bathyraja macloviana, on the Argentine continental shelf. ICES J. Mar. Sci. 2006, 63, 867–874. [Google Scholar] [CrossRef]
  43. Matić-Skoko, S.; Tutman, P.; Bojanić Varezić, D.; Skaramuca, D.; Đikić, D.; Lisičić, D.; Skaramuca, B. Food preferences of the Mediterranean moray eel, Muraena helena (Pisces: Muraenidae), in the southern Adriatic Sea. Mar. Biol. Res. 2014, 10, 807–815. [Google Scholar] [CrossRef]
  44. Bray, J.R.; Curtis, J.T. An ordination of the upland forest communities of southern Wisconsin. Ecol. Monogr. 1957, 27, 326–349. [Google Scholar] [CrossRef]
  45. Anderson, M.J. A new method for non-parametric multivariate analysis of variance. Aust. Ecol. 2001, 26, 32–46. [Google Scholar] [CrossRef]
  46. Anderson, M.J. Permutation tests for univariate or multivariate analysis of variance and regression. Can. J. Fish. Aquat. Sci. 2001, 58, 626–639. [Google Scholar] [CrossRef]
  47. Anderson, M.J.; ter Braak, C.J.F. Permutation tests for multifactorial analysis of variance. J. Stat. Comput. Simul. 2003, 73, 85–113. [Google Scholar] [CrossRef]
  48. Clarke, K.R. Non-parametric multivariate analyses of changes in community structure. Aust. J. Ecol. 1993, 18, 117–143. [Google Scholar] [CrossRef]
  49. Warton, D.I.; Wright, T.W.; Wang, Y. Distance-based multivariate analyses confound location and dispersion effects. Methods Ecol. Evol. 2012, 3, 89–101. [Google Scholar] [CrossRef]
  50. Wickham, H.; Averick, M.; Bryan, J.; Chang, W.; McGowan, L.D.A.; François, R.; Grolemund, G.; Hayes, A.; Henry, L.; Hester, J.; et al. Welcome to the Tidyverse. J. Open Source Softw. 2019, 4, 1686. [Google Scholar] [CrossRef]
  51. Wickham, H. dplyr: A Grammar of Data Manipulation; R package Version 1.1.2; Posit: Boston, MA, USA, 2023. [Google Scholar]
  52. Wickham, H. Ggplot2: Elegant Graphics for Data Analysis; Springer: New York, NY, USA, 2009. [Google Scholar]
  53. Grolemund, G.; Wickham, H. Dates and times made easy with lubridate. J. Stat. Softw. 2011, 40, 1–25. [Google Scholar] [CrossRef]
  54. Oksanen, J.; Simpson, G.; Blanchet, F.; Kindt, R.; Legendre, P.; Minchin, P.; O’Hara, R.; Solymos, P.; Stevens, M.; Szoecs, E.; et al. Vegan: Community Ecology Package; R Package Version 2.6-4. 2022. Available online: https://CRAN.R560project.org/package=vegan (accessed on 10 February 2024).
  55. Wickham, H. Reshaping Data with the Reshape Package. J. Stat. Softw. 2007, 21, 1–20. [Google Scholar] [CrossRef]
  56. Wickham, H. Forcats: Tools for Working with Categorical Variables (Factors); Posit: Boston, MA, USA, 2023. [Google Scholar]
  57. Wickham, H. Modelr: Modelling Functions that Work with the Pipe. R Package Version 0.1.11. 2023. Available online: https://CRAN.R-project.org/package=modelr (accessed on 10 February 2024).
  58. Auguie, B. gridExtra: Miscellaneous Functions for “Grid” Graphics_. R Package Version 2.3. Available online: https://CRAN.R-project.org/package=gridExtra (accessed on 10 February 2024).
  59. Wickham, H.; Hester, J.; Chang, W.; Bryan, J. devtools: Tools to Make Developing R Packages Easier_. R Package Version 2.4.5. 2022. Available online: https://CRAN.R-project.org/package=devtools (accessed on 10 February 2024).
  60. Hassan, I.; El-Feky, A. Age and Growth of Spotted Sea Bass Dicentrarchus punctatus (Bloch, 1792) in the Bitter Lakes, Suez Canal, Egypt. J. Anim. Poult. Fish Prod. 2022, 11, 1–7. [Google Scholar] [CrossRef]
  61. Rogdakis, Y.; Ramfos, A.; Koukou, K.; Dimitriou, E.; Katselis, G. Feeding habits and trophic level of sea bass (Dicentrarchus labrax) in the Messolonghi-Etoliko lagoons complex (Western Greece). J. Biol. Res. 2010, 13, 13–26. [Google Scholar]
  62. Gonçalves, J.M.S.; Bentes, L.; Lino, P.G.; Ribeiro, J.; Canario, A.V.M.; Erzini, K. Weight–length relationships for selected fish species of the small-scale demersal fisheries of the south and south-west coast of Portugal. Fish. Res. 1997, 30, 253–256. [Google Scholar] [CrossRef]
  63. Stergiou, K.I.; Moutopoulos, D.K. A review of length–weight relationships of fishes from Greek Marine Waters. ICLARM Quart 2001, 24, 23–39. [Google Scholar]
  64. Koutrakis, E.T.; Tsikliras, A.C. Length–weight relationships of fishes from three northern Aegean estuarine systems (Greece). J. Appl. Ichthyol. 2003, 19, 258–260. [Google Scholar] [CrossRef]
  65. Dulčić, J.; Glamuzina, B. Length–weight relationships for selected fish species from three eastern Adriatic estuarine systems (Croatia). J. Appl. Ichthyol. 2006, 22, 254–256. [Google Scholar] [CrossRef]
  66. Pérez-Ruzafa, A.; Marcos, C. Ecology and Distribution of Dicentrarchus labrax (Linneaus, 1758); Vázquez, F.J.S., Muñoz-Cueto, J.A., Eds.; Biology of European Sea Bass; CRC Press: Boca Raton, FL, USA, 2014; pp. 3–33. [Google Scholar]
  67. Gibson, R.N.; Pihl, L.; Burrows, M.T.; Modin, J.; Wennhage, H.; Nickell, L.A. Diel movements of juvenile plaice Pleuronectes platessa in relation to predators, competitors, food availability and abiotic factors on a microtidal nursery ground. Mar. Ecol. Prog. Ser. 1998, 165, 145–159. [Google Scholar] [CrossRef]
  68. Layman, C.A. Fish assemblage structure of the shallow ocean surf zone on the eastern shore of Virginia Barrier Islands. Estuar. Coast. Shelf Sci. 2000, 51, 201–213. [Google Scholar] [CrossRef]
  69. Lewin, W.C.; Okun, N.; Mehner, T. Determinants of the distribution of juvenile fish in the littoral area of a shallow lake. Freshw. Biol. 2004, 49, 410–424. [Google Scholar] [CrossRef]
  70. Contente, R.F.; Marion, C.; Silva, J.V.; Soeth, M.; Condini, M.V.L.; Lopes Almeida, L.; Spach, S.L.; Hostim-Silva, M. Surf-zone fish assemblage structure and its diel variability in an ocean beach of Espírito Santo (central Brazilian coast). Lat. Am. J. Aquat. Res. 2023, 51, 133–144. [Google Scholar] [CrossRef]
  71. Gaelzer, L.R.; Machado, G.R.; Baptista, O.R.; Zalmon, I.R. Surf zone ichthyofauna diel variation in Arraial do Cabo, southeastern Brazil. J. Coast. Res. 2006, 39, 1114–1117. [Google Scholar]
  72. Ley, J.A.; Halliday, I.A. Diel variation in mangrove fish abundances and trophic guilds of northeastern Australian estuaries with a proposed trophodynamic model. Bull. Mar. Sci. 2007, 80, 681–720. [Google Scholar]
  73. Rodríguez-García, C.; Abad-Rodríguez, I.; López-Báez, J.; Cabrera-Castro, R. A life in the surf zone: Age and feeding habits of the pompano (Trachinotus ovatus, Linnaeus, 1758) on the beaches of the Gulf of Cádiz (south-west Iberian Peninsula). J. Fish Biol. 2024, 104, 1152–1164. [Google Scholar] [CrossRef] [PubMed]
  74. Vinagre, C.; França, S.; Cabral, H.N. Diel and semi-lunar patterns in the use of an intertidal mudflat by juveniles of Senegal sole, Solea senegalensis. Estuar. Coast. Shelf Sci. 2006, 69, 246–254. [Google Scholar] [CrossRef]
  75. Moreira, F.; Assis, C.A.; Almeida, P.R.; Costa, J.L.; Costa, M.J. Trophic relationships in the community of the upper Tagus estuary (Portugal): A preliminary approach. Estuar. Coast. Shelf Sci. 1992, 34, 617–623. [Google Scholar] [CrossRef]
  76. Pasquaud, S.; Pillet, M.; David, V.; Sautour, B.; Elie, P. Determination of fish trophic levels in an estuarine system. Estuar. Coast. Shelf Sci. 2010, 86, 237–246. [Google Scholar] [CrossRef]
  77. Cardoso, J.F.M.F.; Freitas, V.; Quilez, I.; Jouta, J.; Witte, J.I.; Van Der Veer, H.W. The European sea bass Dicentrarchus labrax in the Dutch Wadden Sea: From visitor to resident species. J. Mar. Biol. Assoc. U. K. 2015, 95, 839–850. [Google Scholar] [CrossRef]
  78. DeLancey, L.B. The summer zooplankton of the surf zone at Folly Beach, South Carolina. J. Coast. Res. 1987, 3, 211–217. [Google Scholar]
  79. Lasiak, T.A.; McLachlan, A. Opportunistic utilization of mysid shoals by surf-zone teleosts. Mar. Ecol. Prog. Ser. 1987, 37, 7. [Google Scholar] [CrossRef]
  80. Jarrin, J.R.M.; Shanks, A.L. Spatio-temporal dynamics of the surf-zone faunal assemblages at a southern Oregon sandy beach. Mar. Ecol. 2011, 32, 232–242. [Google Scholar] [CrossRef]
  81. De Los Ríos-Méndez, J.; Kanamori, G.A.; Landaeta, M.F. Lunar influences in the diet habits and selectivity of larval clingfish Gobiesox marmoratus. J. Fish Biol. 2019, 95, 833–846. [Google Scholar] [CrossRef]
  82. Wootton, R.J. Ecology of Teleost Fishes; Springer Science Business Media: Berlin, Germany, 1998; Volume 1. [Google Scholar]
  83. Beyst, B.; Buysse, D.; Dewicke, A.; Mees, J. Surf zone hyperbenthos of Belgian sandy beaches: Seasonal patterns. Estuar. Coast. Shelf Sci. 2001, 53, 877–895. [Google Scholar] [CrossRef]
  84. Millán, M. Reproductive characteristics and condition status of anchovy Engraulis encrasicolus L. from the Bay of Cadiz (SW Spain). Fish. Res. 1999, 41, 73–86. [Google Scholar] [CrossRef]
  85. Martin, M.P.; Valle, F.R. Especies de Interés Pesquero en el Litoral de Andalucía; Consejería de Agricultura y Pesca: Málaga, Spain, 2001; 442p. [Google Scholar]
  86. Sá, R.; Bexiga, C.; Veiga, P.; Vieira, L.; Erzini, K. Feeding ecology and trophic relationships of fish species in the lower Guadiana River Estuary and Castro Marim e Vila Real de Santo António Salt Marsh. Estuar. Coast. Shelf Sci. 2006, 70, 19–26. [Google Scholar] [CrossRef]
  87. Riley, W.D.; Ibbotson, A.T.; Beaumont, W.R.; Pawson, M.G.; Cook, A.C.; Davison, P.I. Predation of the juvenile stages of diadromous fish by sea bass (Dicentrarchus labrax) in the tidal reaches of an English chalk stream. Aquat. Conserv. Mar. Freshw. Ecosyst. 2011, 21, 307–312. [Google Scholar] [CrossRef]
  88. Gerking, S.D. Feeding Ecology of Fish; Academic Press: San Diego, CA, USA, 1994; 415p. [Google Scholar]
  89. Aranda, A.; Sánchez-Vázquez, F.J.; Madrid, J.A. Influence of water temperature on demand-feeding rhythms in sea bass. J. Fish Biol. 1999, 55, 1029–1039. [Google Scholar] [CrossRef]
  90. Lasiak, T.A. Juveniles, food and the surf zone habitat: Implications for teleost nursery areas. S. Afr. J. Zool. 1986, 21, 51–56. [Google Scholar] [CrossRef]
  91. Guerreiro, M.A.; Marques, S.C.; Martinho, F.; Azeiteiro, U.M.; Pardal, M.Â.; Primo, A.L. Surf zone zooplankton communities from the west coast of the Iberian Peninsula—Influence of season, substrate type and environmental factors. Reg. Stud. Mar. Sci. 2021, 48, 102050. [Google Scholar] [CrossRef]
  92. Bachiller, E.; Irigoien, X. Trophodynamics and diet overlap of small pelagic fish species in the Bay of Biscay. Mar. Ecol. Prog. Ser. 2015, 534, 179–198. [Google Scholar] [CrossRef]
  93. Macpherson, E. Régime alimentaire de Galeus melastomus Rafinesque, 1810 Etmopterus spinax (L., 1758) et Scymnorhinus licha (Bonnaterre, 1788) en Méditerranée occidentale. Vie Et Milieu/Life Environ. 1980, 30, 139–148. [Google Scholar]
  94. Valls, M.; Quetglas, A.; Ordines, F.; Moranta, J. Feeding ecology of demersal elasmobranchs from the shelf and slope off the Balearic Sea (western Mediterranean). Sci. Mar. 2011, 75, 633–639. [Google Scholar] [CrossRef]
  95. Bachiller, E.; Giménez, J.; Albo-Puigserver, M.; Pennino, M.G.; Marí-Mena, N.; Esteban, A.; Lloret-Lloret, E.; Bellido, J.M.; Coll, M. Trophic niche overlap between round sardinella (Sardinella aurita) and sympatric pelagic fish species in the Western Mediterranean. Ecol. Evol. 2021, 11, 16126–16142. [Google Scholar] [CrossRef]
  96. Rodríguez-García, C.; Gonçalves Neto, J.B.; García-Romero, C.; Domínguez-Bustos, Á.R.; Cabrera-Castro, R. Feeding habits of two shark species: Velvet belly, Etmopterus spinax (Linnaeus, 1758) and blackmouth catshark, Galeus melastomus (Rafinesque, 1810), present in fishing discards in the Gulf of Cádiz. Environ. Biol. Fishes 2024, 107, 159–172. [Google Scholar] [CrossRef]
  97. Pennino, M.G.; Coll, M.; Albo-Puigserver, M.; Fernández-Corredor, E.; Steenbeek, J.; Giráldez, A.; González, M.; Esteban, A.; Bellido, J.M. Current and future influence of environmental factors on small pelagic fish distributions in the Northwestern Mediterranean Sea. Front. Mar. Sci. 2020, 7, 622. [Google Scholar] [CrossRef]
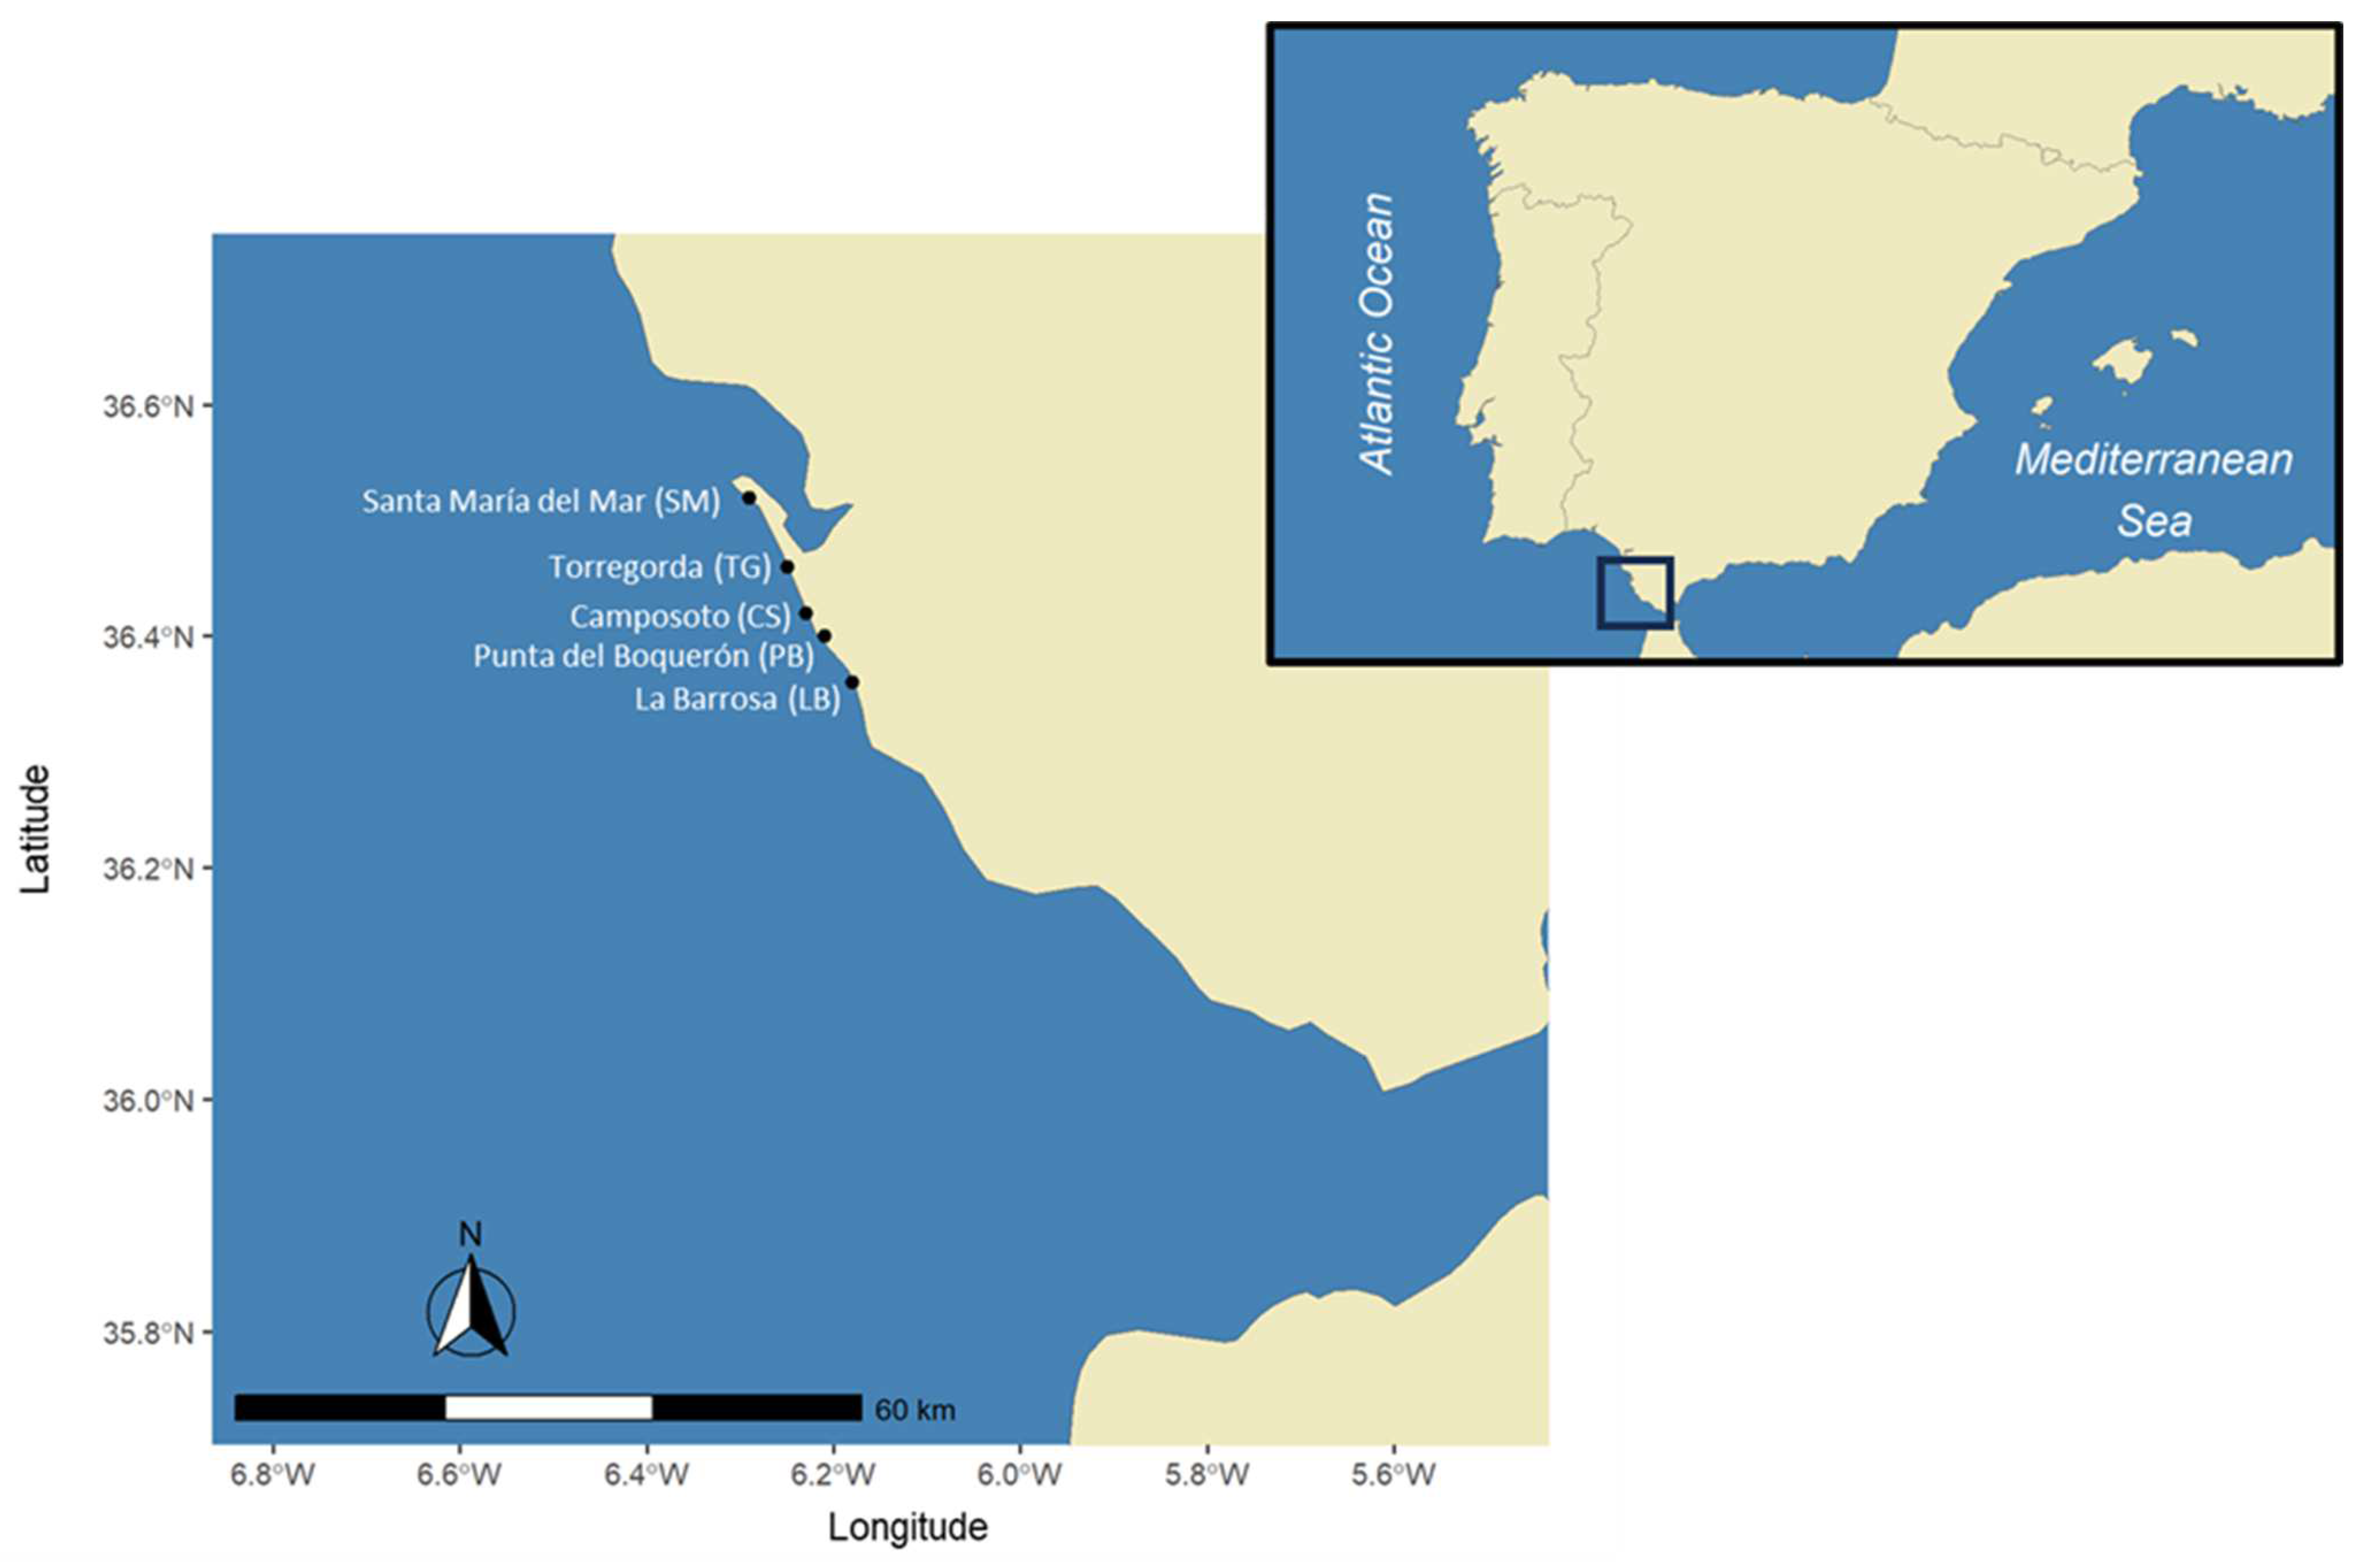
Figure 1. Localization of the study area (Gulf of Cádiz, SW Iberian Peninsula) with the sampled beaches marked with black dots.
Fishes 09 00173 g001
Figure 2. (A) Abundance of the length classes for spotted seabass (Dicentrarchus punctatus) found in the surf zones of the Gulf of Cádiz. (B) Length–weight relationship (LWR) of spotted seabass (D. punctatus) in the surf zones of the Gulf of Cádiz.
Fishes 09 00173 g002
Figure 3. Abundance of the different age classes of spotted seabass (Dicentrarchus punctatus) found in the surf zone according to: (A) time of day, (B) moon phase, and (C) season.
Fishes 09 00173 g003
Figure 4. Cumulative prey curves for the total number of stomachs analyzed of spotted seabass (Dicentrarchus punctatus) in the surf zone of the Gulf of Cádiz. The blue line represents the cumulative prey curve using all the different taxa found in the stomachs, and the red line represents the cumulative prey curve using only prey with a Relative Importance Index (IRI) of at least 1%.
Fishes 09 00173 g004
Figure 5. Importance, as a function of (A) time of day, (B) moon phase, (C) season, and (D) size range, of the main prey groups of spotted seabass (Dicentrarchus punctatus) expressed as the Index of Relative Importance (IRI) in %.
Fishes 09 00173 g005
Figure 6. (A) Abundance of the length classes for European seabass (Dicentrarchus labrax) found in the surf zones of the Gulf of Cádiz. (B) Length–weight relationship (LWR) of European seabass (D. labrax) in the surf zones of the Gulf of Cádiz.
Fishes 09 00173 g006
Figure 7. Abundance of the different age classes of European seabass (Dicentrarchus labrax) found in the surf zone according to: (A) time of day, (B) moon phase, and (C) season.
Fishes 09 00173 g007
Figure 8. Cumulative prey curves for the total number of stomachs analyzed of European seabass (Dicentrarchus labrax) in the surf zone of the Gulf of Cádiz. The blue line represents the cumulative prey curve using all the different taxa found in the stomachs, and the red line represents the cumulative prey curve using only prey with a Relative Importance Index (IRI) of at least 1%.
Fishes 09 00173 g008
Figure 9. The importance levels, as a function of (A) time of day, (B) moon phase, (C) season, and (D) size range, of the main prey groups of European seabass (Dicentrarchus labrax) expressed as the Index of Relative Importance (IRI) in %.
Fishes 09 00173 g009
Table 1. Summary statistics of the lengths and ages of spotted seabass (Dicentrarchus punctatus) and European seabass (D. labrax) in the surf zones of the Gulf of Cádiz. n: sample size; %: percentage of age class to total; TL: total length.
Agen%Mean TL (cm)Standard DeviationTL Range (cm)Mean Size Increment (cm)
D. punctatusD. labraxD. punctatusD. labraxD. punctatusD. labraxD. punctatusD. labraxD. punctatusD. labraxD. punctatusD. labrax
0+91716.466.4811.1214.942.941.784.1–16.911.4–16.4--
1+1863933.6336.1115.8219.602.174.129.9–22.714.4–29.34.704.66
2+2524345.5739.8119.0524.731.894.9713.8–25.015.5–37.93.235.13
3+18163.2514.8124.4628.972.454.0420.5–28.322.0–37.95.414.24
4+631.082.7828.8737.903.483.9824.1–31.835.5–42.54.418.93
Table 2. Spotted seabass (Dicentrarchus punctatus) and European seabass (Dicentrarchus labrax) diet composition expressed as a frequency of occurrence (%F), numerical percentage (%Cn), gravimetric percentage (%Cw), and Relative Importance Index (%IRI). Unid. = Not identified.
Dicentrarchus punctatusDicentrarchus labrax
Taxa%F%Cn%Cw%IRI%F%Cn%Cw%IRI
ANNELIDA
Polychaeta
Polychaeta unid.0.700.010.01<0.01
CHELICERATA
Pycnogonida
Pycnogonida unid.0.700.040.00<0.01
CRUSTACEA
Amphipoda
Amphipoda unid.31.471.730.290.549.646.980.082.66
Cumacea
Cumacea unid.2.104.390.020.081.201.750.0010.08
Decapoda
Brachyura
Carcinus maenas0.700.010.03<0.013.610.622.590.45
Liocarcinus holsatus 1.200.121.150.06
Majidae unid. 1.200.120.020.01
Pachygrapsus marmortatus 10.841.378.124.03
Portumnus latipes 3.611.004.940.84
Portunidae unid. 1.200.120.620.04
Brachyura unid.2.100.040.02<0.0113.251.875.343.74
Caridea
Alpheus sp.2.100.040.13<0.01
Crangon crangon7.690.251.140.09
Palaemon elegans 6.021.002.290.78
Palaemon sp.0.700.020.17<0.01
Caridea unid.5.590.130.220.023.611.120.180.18
Gebiidea
Upogebia sp.0.700.010.13<0.01
Decapoda unid.4.200.130.200.012.410.370.470.08
Isopoda
Isopoda unid.44.062.980.951.488.431.870.220.69
Mysidacea
Mysidacea unid.93.7174.228.6566.5716.8757.980.4838.57
Other Crustacea5.590.100.010.011.200.120.0010.01
INSECTA
Formicidae4.201.800.0030.06
Other Insecta1.400.020.00001<0.011.204.740.000040.22
MOLLUSCA
Bivalvia
Bivalvia unid. 1.200.250.230.02
Cephalopoda
Cephalopoda unid.1.400.020.24<0.01
Gastropoda
Patellidae 1.200.751.080.09
OSTEICHTYES
Atherinidae
Atherinidae unid. 13.252.2441.3222.58
Bleniidae
Lipophrys trigloides 1.200.254.730.23
Bleniidae unid. 1.200.121.980.10
Clupeiformes
Engraulis encrasicolus10.490.9811.461.12
Sardina pilchardus14.693.9325.543.712.414.491.580.57
Clupeiformes unid.51.056.6123.1713.034.823.622.471.15
Gobiidae
Gobiidae unid.0.700.010.37<0.016.021.2511.462.99
Pomatomidae
Pomatomus saltatrix1.400.050.24<0.01
Sparidae
Sparidae unid.2.100.051.220.02
Unidentified Fish55.242.4325.5213.2434.945.868.6419.82
ALGAE
Algae unid. 1.200.120.010.01
Table 3. PERMANOVA test results comparing the effects of moon phase, season, time of day, and size ranges on the abundance of prey items consumed by the spotted seabass (Dicentrarchus punctatus). * p < 0.05; *** p < 0.001; not significant. In bold, variables with significant p-values.
SourcedfSum of SquaresMean SquaresPseudo-Fp-ValuePermutations
Moon Phase11.5521.5528.204***9999
Season33.7011.2346.519***
Time of the day10.1120.1120.591-
Size Range41.5330.3832.026*
Moon Phase × Season31.0090.3361.777-
Moon Phase × Time of the day10.4320.4322.282-
Moon Phase × Size range41.2130.3031.603-
Season × Time of the day31.1390.3802.007-
Season × Size range101.4500.1450.767-
Time of the day × Size range40.5770.1440.762-
Residual30257.143
Total33669.962
Disclaimer/Publisher’s Note: The statements, opinions and data contained in all publications are solely those of the individual author(s) and contributor(s) and not of MDPI and/or the editor(s). MDPI and/or the editor(s) disclaim responsibility for any injury to people or property resulting from any ideas, methods, instructions or products referred to in the content.