Article

Exploring Seasonal Variations in Fish Communities: A Study of the Yellow River Estuary and Its Adjacent Waters Using eDNA and Trawl Surveys

1
Key Laboratory of Mariculture (Ministry of Education), Ocean University of China, Qingdao 266003, China
2
Observation and Research Station of Bohai Strait Eco-Corridor, First Institute of Oceanography, Ministry of Natural Resources, Qingdao 266061, China
3
Shandong Provincial Key Laboratory of Restoration for Marine Ecology, Shandong Marine Resource and Environment Research Institute, Yantai 264006, China
4
Observation and Research Station of Laizhou Bay Marine Ecosystem, Ministry of Natural Resources, Yantai 264006, China
5
Shandong Forestry Protection and Development Service Center, Jinan 250000, China
*
Authors to whom correspondence should be addressed.
Fishes 2024, 9(6), 192; https://doi.org/10.3390/fishes9060192
Submission received: 18 April 2024 / Revised: 16 May 2024 / Accepted: 21 May 2024 / Published: 23 May 2024
(This article belongs to the Special Issue Assessment and Management of Fishery Resources)

Abstract

:
The Yellow River Estuary and its adjacent waters serve as crucial spawning, foraging, and nursery areas for marine organisms, possessing abundant biological resources. Monitoring fish communities provides a baseline for implementing the sustainable utilization of marine resources. In this study, data were collected from 15 spring surface and bottom sites and 17 summer surface sites using eDNA and trawl surveys. The results showed that 37, 40, and 35 fish species were detected using eDNA in the spring (surface and bottom) and summer (surface), respectively, with 38 fish species caught during summer trawling. The dominant species mainly belonged to Engraulidae of Clupeiformes in the spring and Gobiidae of Perciformes in the summer, characterized by smaller-sized, short-lived, and pelagic fish species. The summer surface communities exhibited higher diversity than the spring surface and bottom communities. NMDS analysis revealed a degree of seasonal differences in fish communities and that there may be a lack of vertical stratification in the spring communities. The pH and DO were identified as the key environmental factors affecting the fish community. Additionally, the combination of eDNA and trawl surveys was regarded as a superior survey method. Our study provides valuable information for understanding seasonal fish communities in the Yellow River Estuary and its adjacent waters, contributing to fishery resource management and conservation in the region.
Key Contribution: In this paper, eDNA technology and trawl surveys were used to explore the fish community structure and diversity in the Yellow River Estuary and its adjacent waters in the spring and summer. These findings offer valuable data for the management and sustainable use of fishery resources in this region.

1. Introduction

The typically sheltered waters and high productivity in estuaries provide abundant food sources and habitats for aquatic organisms [1]. Fish are the main consumers in aquatic ecosystems and serve as key indicators of ecosystem health [2]. However, under the increasing pressures of overfishing, land-based pollution, and land development, the capacity of estuaries to sustain functionality and productivity is diminishing rapidly, posing a serious threat to fish communities [3,4]. Thus, monitoring the spatial and temporal variability of fish communities is crucial for understanding their ecological structure and protection [1,5].
Due to the input of terrestrial nutrients, high primary productivity is frequently observed in estuaries and their adjacent coastal areas [6]. The Yellow River Estuary has become an important place for numerous marine organisms to feed, reproduce, and grow [7]. In recent years, with the influence of overfishing, flow interruption [8], and oil development, the fishery resources in the Yellow River Estuary and its adjacent waters have declined continuously. The abundance of large, high-trophic-level fish species has declined, with dominant species consistently transitioning towards smaller sizes [9]. Despite the implementation of relevant policies and protective measures, our comprehension of the present distribution and characteristics of fishery resources in the Yellow River Estuary and its adjacent waters remains insufficient. The monitoring of fish communities is an essential means of researching the structure and biodiversity of fish populations, contributing to the sustainable utilization and protection of fishery resources [2,10].
Conventional methods for monitoring marine biodiversity are mostly carried out by trawling [10,11]. However, fish trawling is time-consuming, labor-intensive, costly, and even destructive, posing challenges to fish community conservation efforts [2,12]. Therefore, robust methods are urgently needed to explore fish communities. The emergence of environmental DNA (eDNA) technology has transformed the way we survey biodiversity, providing a powerful tool for investigating fishery resources [13,14]. eDNA metabarcoding is a high-sensitivity, time-efficient, and noninvasive method of biological monitoring that allows for the extraction of DNA from the environment (such as sediment, water, soil, or air) to infer community composition [15,16]. The applications of eDNA are extensive, with the earliest use of this technology being to monitor sediment microorganisms [17]. The use of eDNA monitoring for aquatic organisms was initially introduced in 2008 for the detection of the American bullfrog (Rana catesbeiana) in freshwater [18]. Subsequently, eDNA has been widely used for monitoring various fish species, including those that are endangered or invasive [19,20]. Currently, the application of eDNA metabarcoding technology for research in China is predominantly focused on river or lake ecosystems, with relatively less emphasis on conducting investigations into fish diversity in coastal waters [21]. Shu et al. (2020) utilized eDNA metabarcoding technology to explore the fish diversity in Erhai Lake. The results revealed that eDNA metabarcoding can effectively detect the spatial distribution of fish species in Erhai Lake [22]. Qian et al. (2023) utilized eDNA technology to investigate the fish community structure and diversity in the Yangtze River basin. The findings revealed that the distribution pattern of the fish community was consistent with the results obtained from conventional methods [2].
In this study, eDNA technology and trawl surveys were used to study the structure and diversity of fish communities in the Yellow River Estuary and its adjacent waters in the spring and summer. In addition, we revealed the key environmental factors that influence the distribution of fish in the summer and compared the potential of eDNA and trawl surveys in assessing fish composition. The results will provide a reference for the management and sustainable utilization of fishery resources in the Yellow River Estuary and its adjacent waters.

2. Materials and Methods

2.1. Sample Sites

During the spring (10 May to 15 May 2022) and summer (11 August to 16 August 2023), we conducted the collection of fish and water samples. The survey area covered the Yellow River Estuary and its adjacent waters (37.33°–38.44° N, 118.76°–120.50° E), with 19 and 17 sites surveyed in the spring and summer, respectively (Figure 1). In the spring, a total of 30 eDNA samples were obtained, comprising 15 surface samples and 15 bottom samples, with 11 sites for simultaneously collecting surface and bottom samples. The sampling depth for the surface samples was below 3 m relative to sea level, whereas for the bottom samples, it was 3 m above the seabed. During the summer survey, eDNA sampling and trawl surveys were conducted simultaneously. The net mouth width was 8 m, with a 20 mm mesh size at the cod end. The trawling time at each site was 1 h, with an average trawling speed of 2 knots. In addition, during the summer survey, water quality parameters were measured at 8 sites using a water quality parameter meter (YSI). Detailed sampling information is provided in Table 1.

2.2. Sample Collection and DNA Extraction

Before sampling, we sterilized all instruments with ultrapure water and 10% sodium hypochlorite to minimize cross-contamination and rinsed the sampling equipment with water from the sampling sites. At each site, a 1 L sample of surface water was collected and stored in an opaque sterile plastic bottle. Then, the 1 L water samples were filtered through a 0.45 μm cellulose acetate filter (47 mm diameter). Each day, ddH2O (1 L) was filtered on-site as a negative control, yielding 12 negative controls. After sampling at each site, all instruments were resterilized in preparation for the next site. The filter membrane containing eDNA was wrapped with sterile tin foil and stored at −20 °C. We extracted total eDNA using the DNeasy Blood and Tissue Kit (Qiagen, Shanghai, China) following the manufacturer’s protocol and stored the eDNA solution at −20 °C until PCR amplification.

2.3. Library Construction and Sequencing

For PCR amplification, we utilized the universal primers MiFish-U/E, designed to target marine teleost fish (MiFish-U/E-F: GTCGGTAAAACTCGTGCCAGC, MiFish-U/E-R: CATAGTGGGGTATCTAATCCCAGTTTG) [23]. Three PCR replicates were performed for each sample, and ddH2O was used as a negative control. Each PCR reaction volume was 20 μL, containing Q5 High-Fidelity DNA Polymerase (0.2 μL), 5 × reaction buffer (4 μL), 5 × GC buffer (4 μL), dNTP mixture (1.6 μL), forward primers (0.8 μL), reverse primers (0.8 μL), DNA template (3 μL), and ddH2O. If a negative control or blank control group sample was detected with a band, then the sample could not be used for subsequent experiments. The following PCR reaction was used: 94 °C for 3 min and then 10 cycles of 94 °C for 30 s, 45 °C for 30 s, and 72 °C for 50 s. This was followed by 35 cycles of 94 °C for 30 s, 54 °C for 30 s, and 72 °C for 50 s, followed by a 10 min extension at 72 °C and cooling at 4 °C. Then, fragment selection and purification of the library were performed using 2% agarose gel electrophoresis. The library quality was assessed on an Agilent Bioanalyzer 2100 system. Finally, libraries were sequenced using the 2 × 250 paired-end protocol on an Illumina NovaSeq platform.

2.4. Bioinformatics Analysis

After sequencing, we obtained raw data stored in the FASTQ format, and the sequence clustering statistics were mainly conducted using Qiime2-2021.4 [24]. Subsequently, we used the demux plugin to demultiplex the raw sequence data. The DADA2 R package has a full amplicon workflow, which we used to merge, filter, and dereplicate sequences [25]. The high-quality sequences obtained were clustered into OTUs at a 97% similarity threshold. Considering the effects of false positives, possibly arising from exogenous contamination, and PCR and sequencing errors, we used the filter-features plugin to filter OTUs with a total count less than 10 and updated the corresponding OTU table [26]. Taxonomic information was assigned to the OTU table using Blastn against the Mitofish database (http://mitofish.aori.u-tokyo.ac.jp/) (accessed on 15 May 2024), using parameters (identity > 97%, length ≥ 160 bp, E-value < 10−5) to match fish species information. Through manual screening, the specific composition and sequence abundance of fish communities in each sample at each taxonomic level were obtained.
Dominant species were calculated using the dominance index (Y) and the relative importance index (IRI) in Microsoft Excel software v.2021 [27,28].
Y = T i T × n i N
In the formula, Ti represents the number of sample sites in which the ith fish species occurs, T represents the total number of sampling sites, ni represents the sequence abundance of the ith fish species, and N represents the total sequence abundance. In cases where Y exceeds 0.02, the species is classified as a dominant species.
I R I = N + W × F × 10,000
This formula is defined as follows: N represents the percentage of individuals of a given fish species in the overall catch; W represents the weight percentage of a given fish species in the entire catch; and F represents the percentage of occurrences of a given fish species out of the number of sampling sites. Fish species with an IRI value ≥ 1000 were identified as dominant species, and those with an IRI value of 100–1000 were identified as important species.
All samples were resampled using vegan (2.6-4) [29] and were extracted with a minimum number of 12,087 reads (Supplementary Material Figure S1). Alpha diversity was calculated using the R package vegan (2.6-4) [29] by means of the following indices: Shannon’s entropy index, Simpson’s diversity index, the Chao1 index, and Pielou’s evenness index. To represent the community similarity between samples, non-metric multidimensional scaling (NMDS) analysis was conducted using the R package vegan (2.6-4) [29]. In addition, redundancy analysis (RDA) was applied to analyze the relationship between six environmental factors (DO, pH, salinity, depth, temperature, SPC) and the dominant species in the summer. Before the analysis, the fish data were transformed by “Hellinger”, while environmental factors were transformed by log10(X). The SPC (VIF > 20) was then removed by collinearity diagnostics. Linear regression analysis was conducted using the lm function in the R package.

3. Results

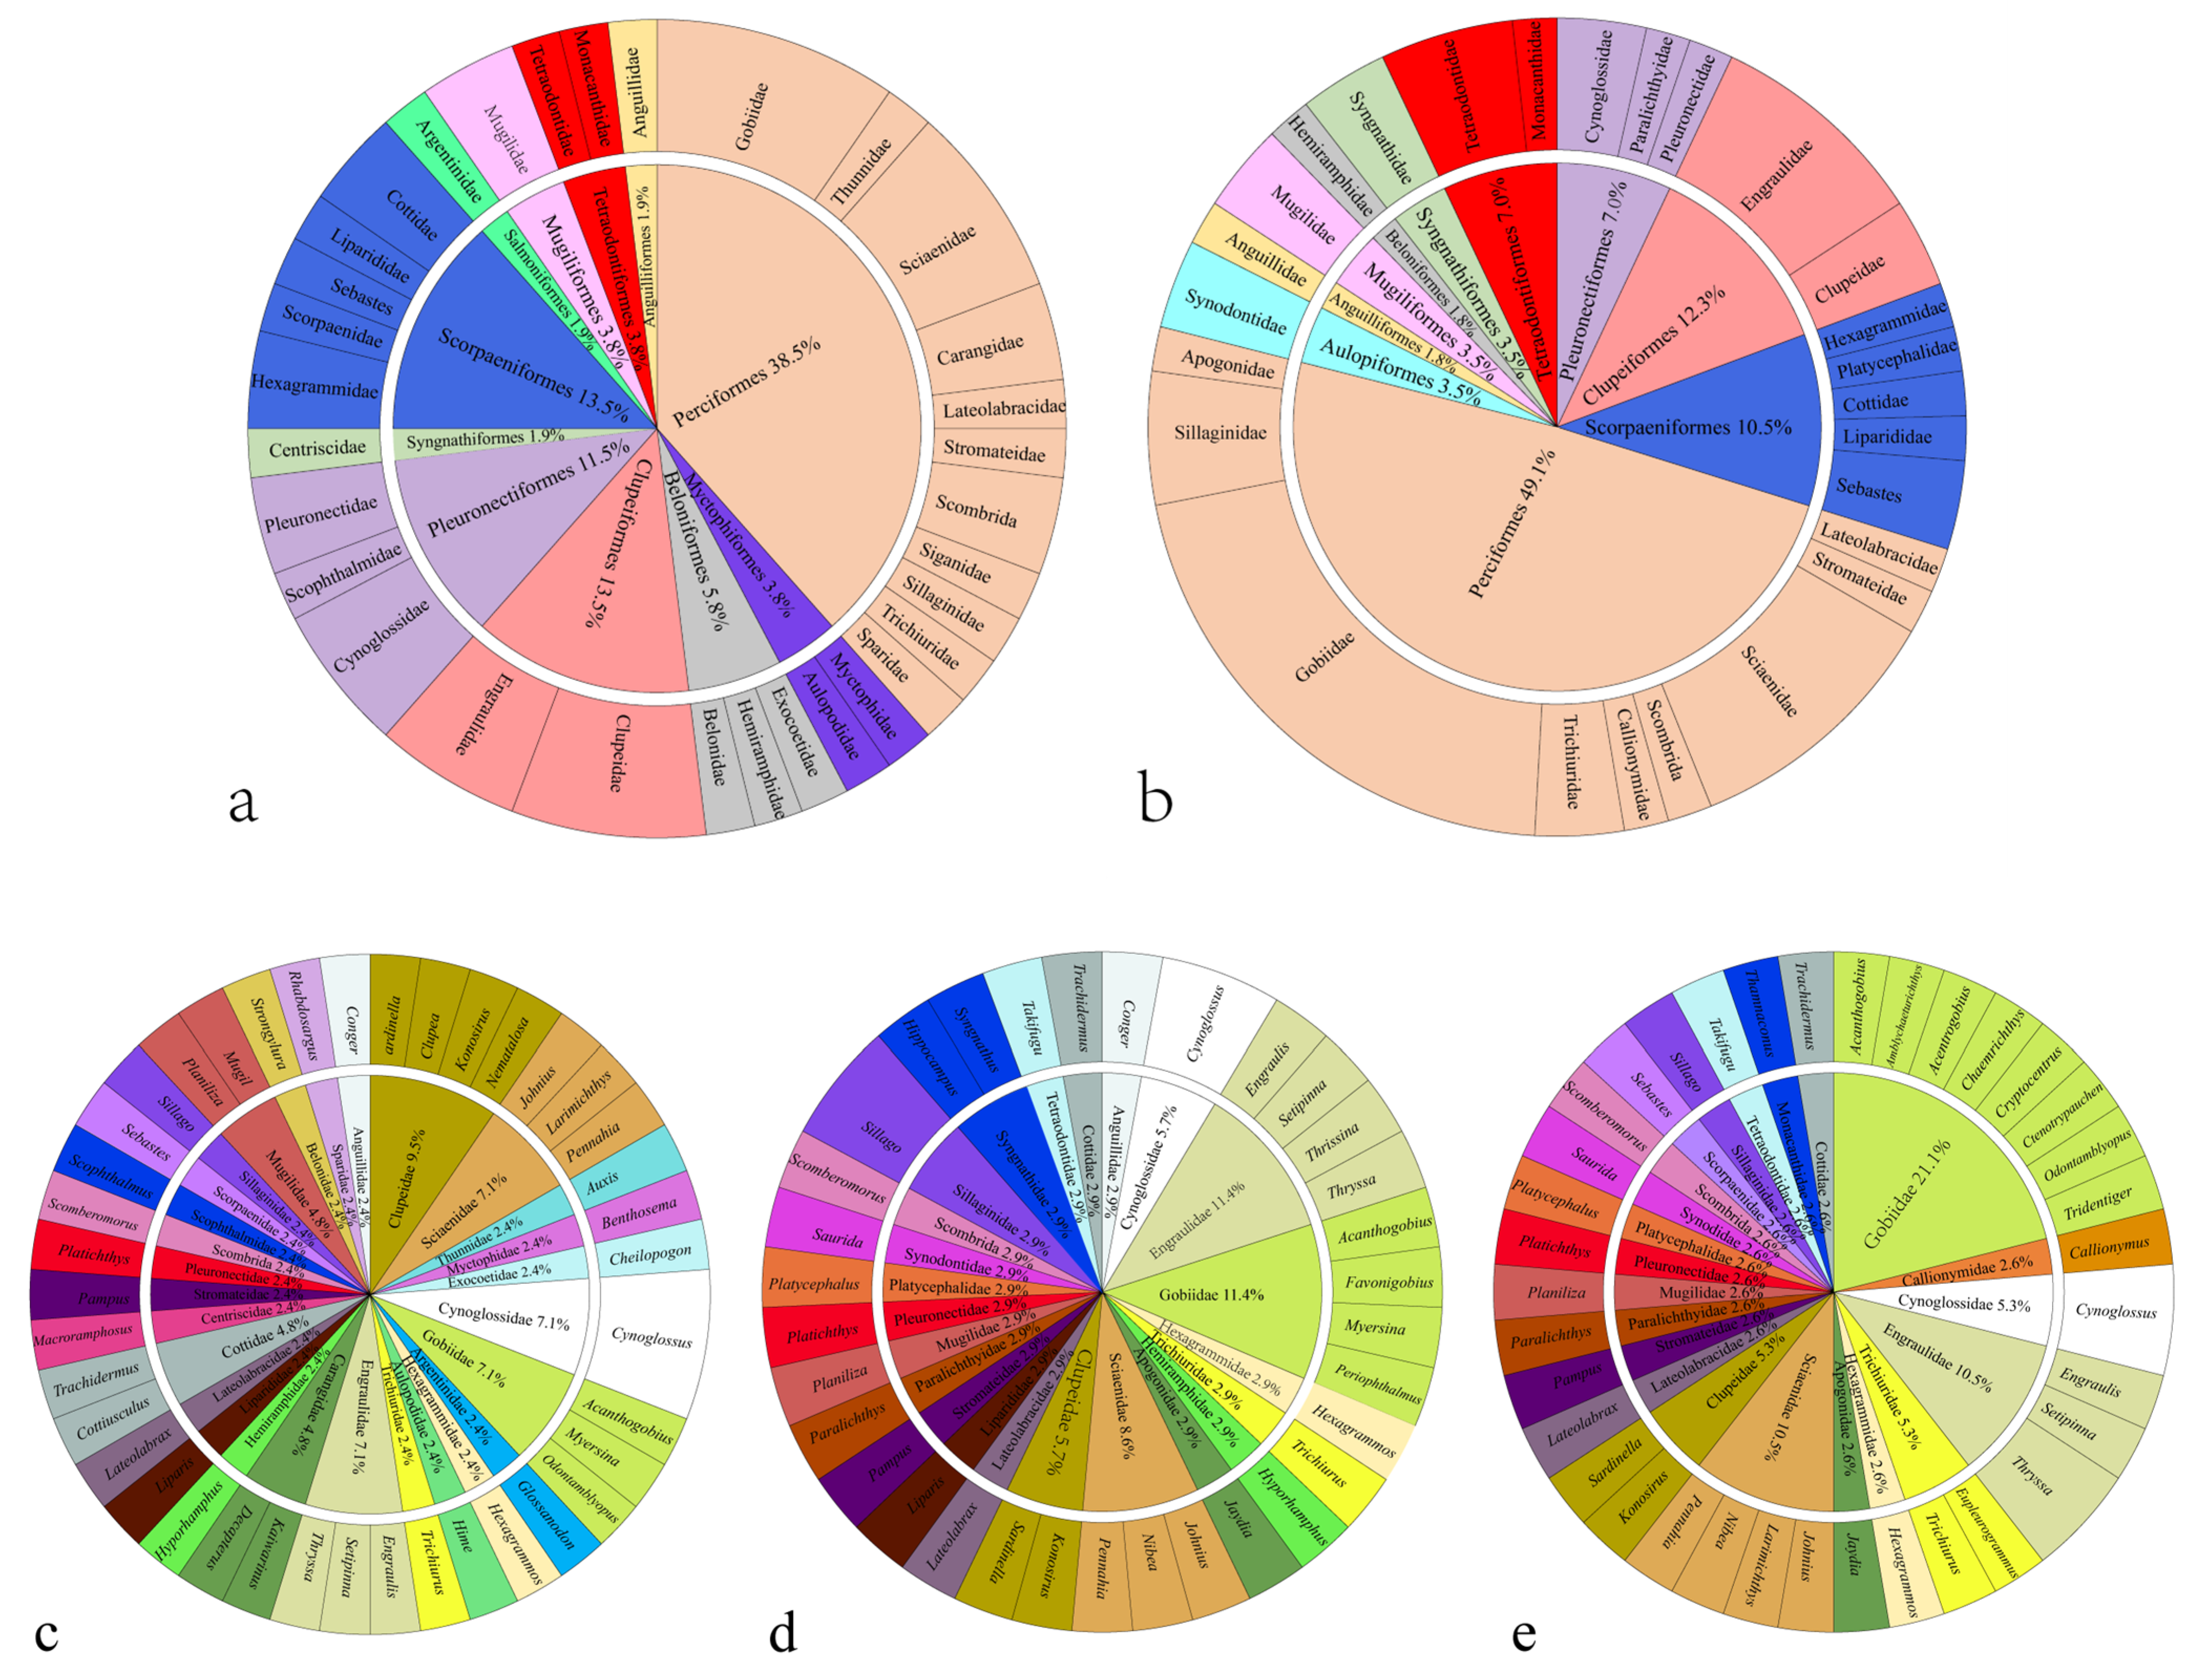
3.1. Survey Results and Taxonomic Composition

The negative controls confirmed that there was no cross-contamination during the eDNA extraction process. The taxonomic information for fish species was obtained from Fishbase [30]. A total of 83 fish taxa were identified, among which 70 fish taxa were identified at the species level and 13 fish taxa were identified at the genus level or higher (Supplementary Material Table S1). The species identified in the spring survey encompassed 11 orders and 32 families, whereas in the summer survey results, the species were classified into 10 orders and 26 families (Figure 2). The greatest number of species in both seasons was observed in the Perciformes order, followed by Clupeiformes, Scorpaeniformes, and Pleuronectiformes. In the spring surveys, the main species compositions consisted of Clupeidae, Gobiidae, Cynoglossidae, Engraulidae, and Sciaenidae, accounting for 37.9%. During the summer eDNA survey, Engraulidae, Gobiidae, and Sciaenidae exhibited higher abundances, accounting for 11.4%, 11.4%, and 8.6%, respectively. In the summer trawl survey, Gobiidae had the highest proportion at 21.1%, followed by Engraulidae and Sciaenidae.
The eDNA survey documented 41 species in the spring and 35 species in the summer. In both the spring and summer, the species identified through eDNA amounted to 21, with an additional 5 genera and higher taxa. A total of 38 fish species were detected at 17 survey sites by the trawl surveys (Supplementary Material Table S1). The number of species identified by both the eDNA and trawl surveys was 22 (Supplementary Material Table S1). Furthermore, in the spring surveys, both the endangered species Trachidermus fasciatus and the invasive species Scophthalmus maximus were found, whereas only the endangered species Trachidermus fasciatus was detected in the summer surveys. As shown in Table 2, a total of 7 and 13 dominant species were found in the eDNA surveys conducted in the spring and summer, respectively. In the summer trawl survey, 4 dominant species were observed, but 10 important species were observed, including Acanthogobius ommaturus, Jaydia lineata, Johnius belangerii, Konosirus punctatus, Pennahia argentata, Platycephalus indicus, Saurida elongate, Setipinna tenuifilis, Sillago japonica, and Thryssa mystax.

3.2. Diversity of Fish Communities

In the analysis of alpha diversity, Shannon’s entropy index, Simpson’s diversity index, and Pielou’s evenness index of the surface community in the summer were higher than those of both the surface and bottom communities in the spring. The surface and bottom communities in the spring were practically similar in terms of Shannon’s entropy index, Simpson’s diversity index, and Pielou’s evenness index. The highest Chao1 index was observed in the bottom community in the spring, followed by the surface community in the spring, and the surface community in the summer had the lowest Chao1 index (Figure 3). The NMDS analysis showed that the separation between the “AS” and “AB” groups was smaller, suggesting that the difference in fish community composition between the spring surface and bottom communities was smaller. In addition, the spring sampling points were more concentrated, while the summer sampling points were more dispersed (Figure 4).

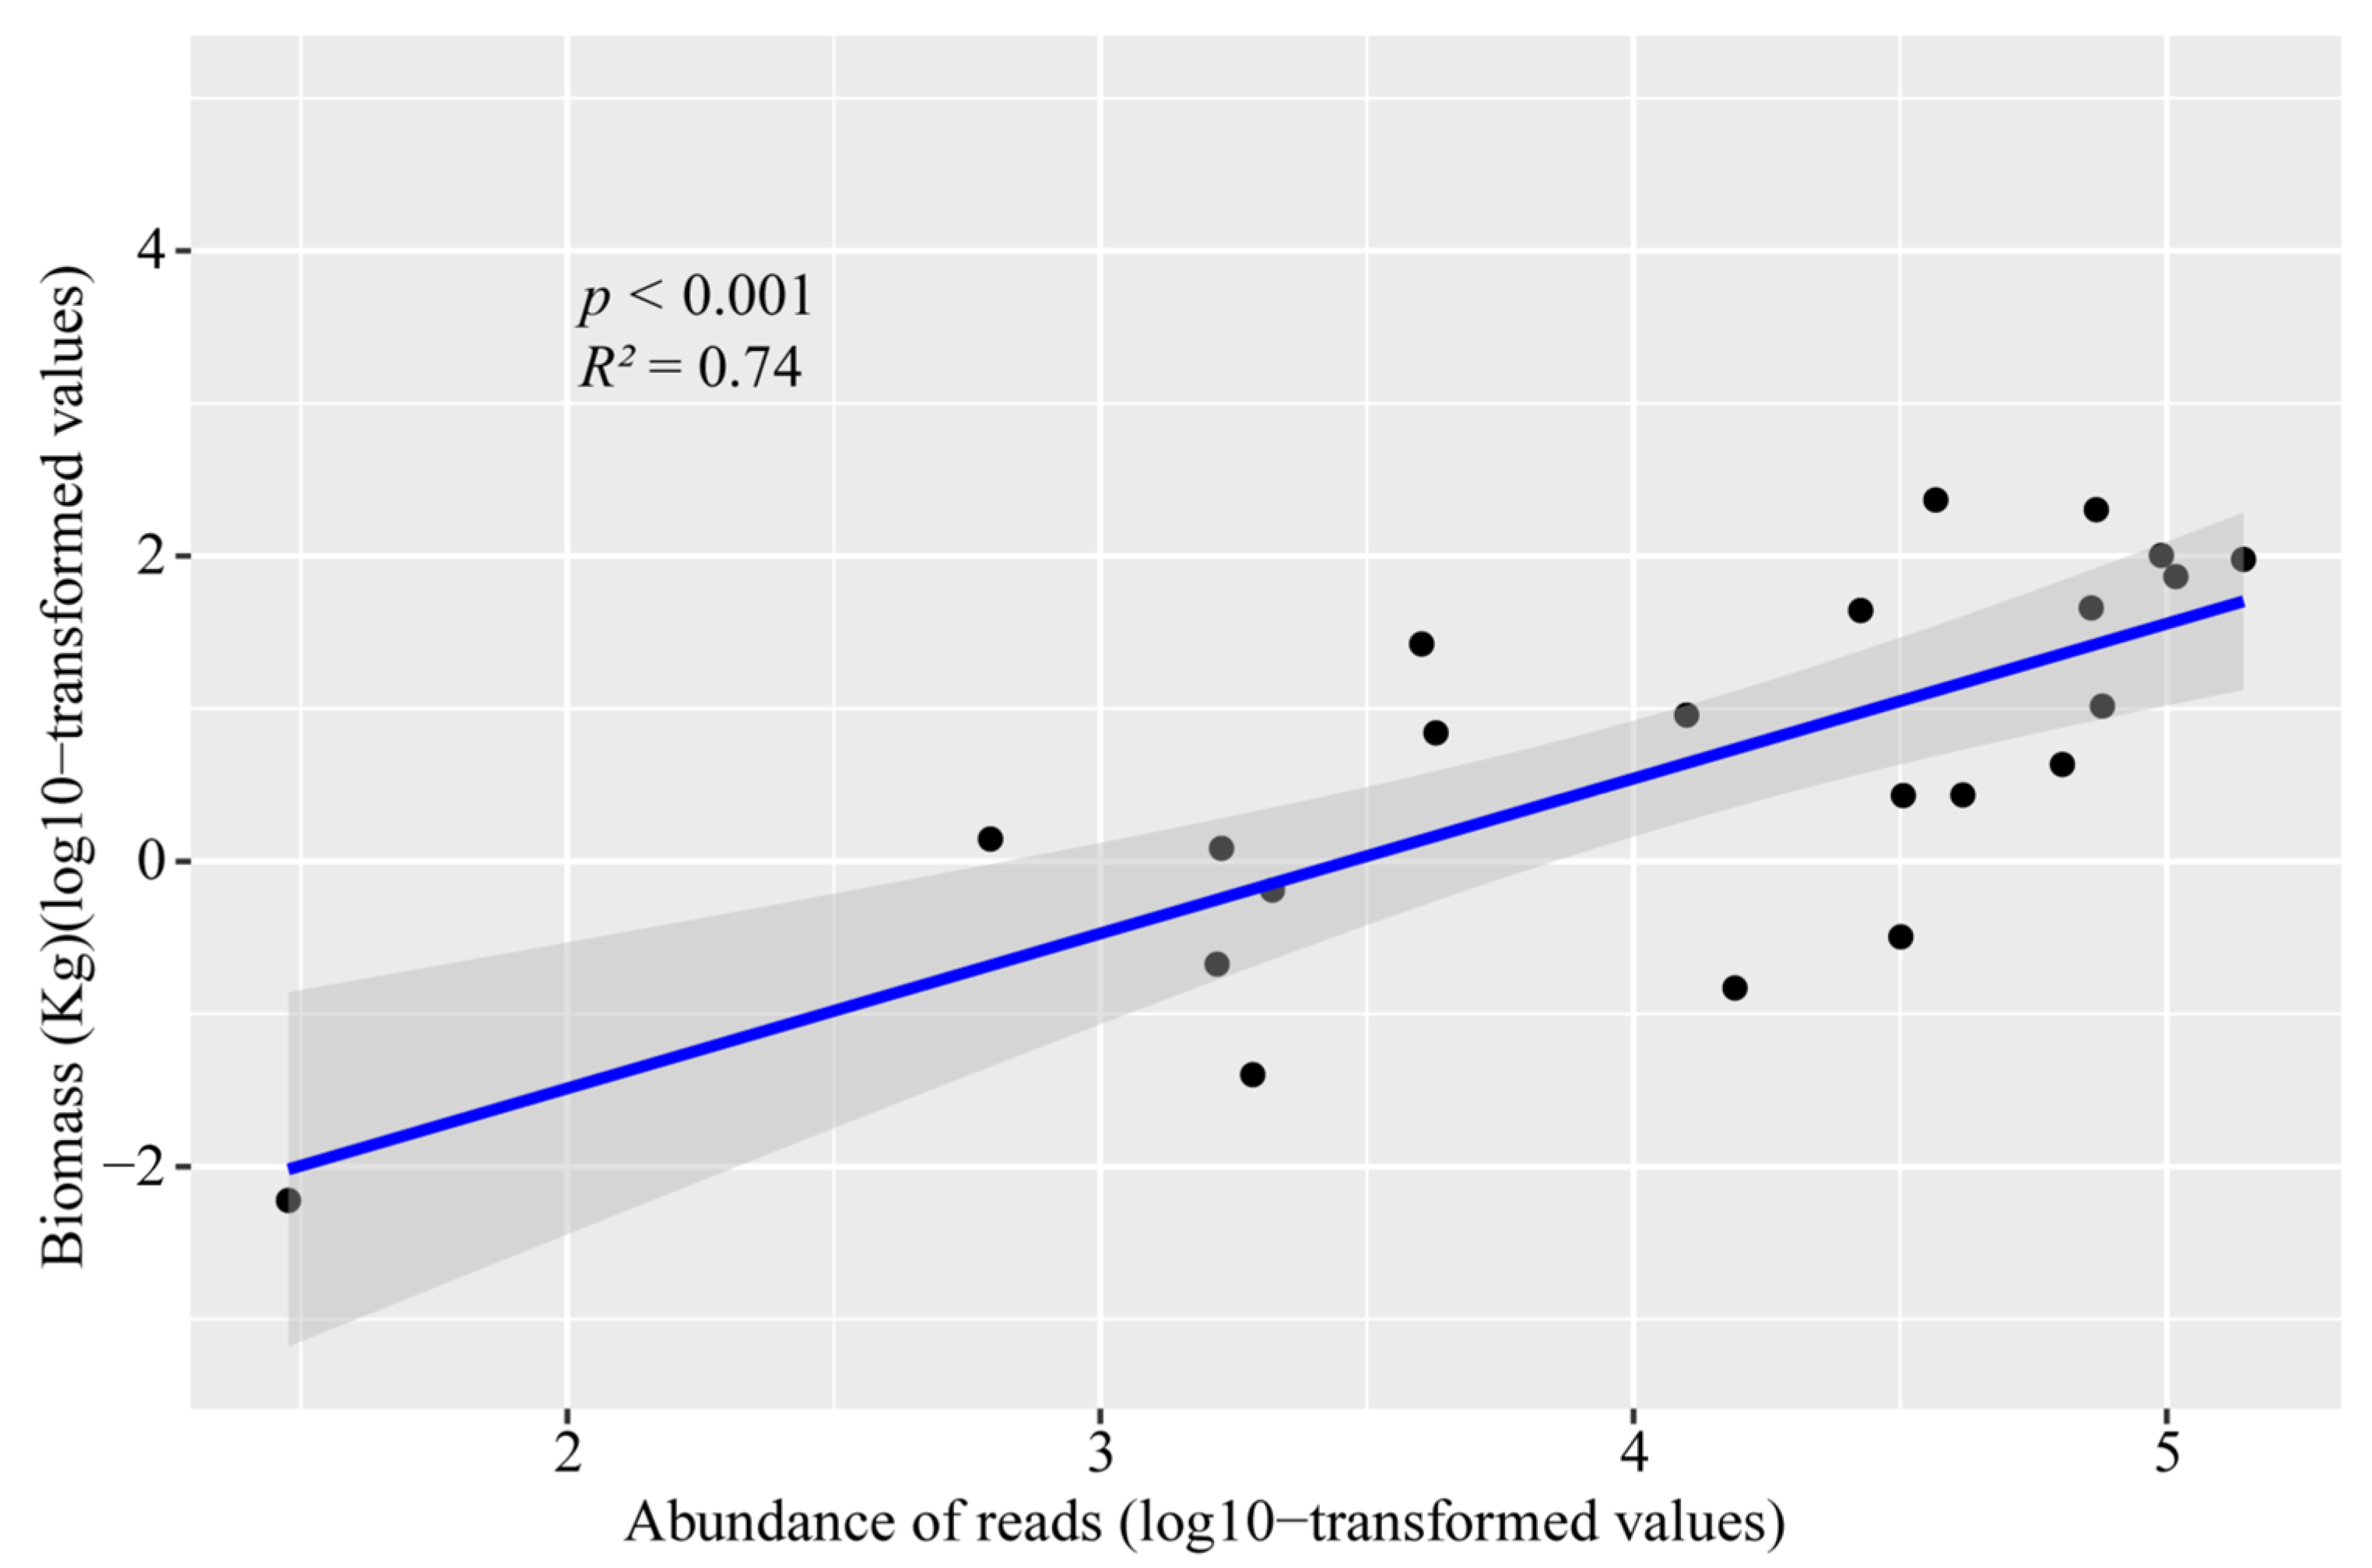
3.3. Relationship between Fish Community and Environmental Factors

In this study, the RDA ranking model was significant (F = 2.39, p = 0.006), reliably demonstrating the relationship among environmental factors and the 13 dominant species detected during the summer (Figure 5). The first ordination axis (RDA1) was significant (p = 0.018, 999 permutations), and the model explained 49.84% (adjusted R2) of the variation in the dominant species composition. As shown in the RDA plot, the first axis was strongly correlated with DO. The second axis was strongly correlated with pH and Temp, and pH (R2 = 0.9558, p = 0.002) was the key environmental factor affecting the fish community (Supplementary Material Table S2). From Figure 5, DO was positively correlated with Pampus argenteus, Johnius grypotus, Cynoglossus joyneri, Engraulis japonicus, Thryssa kammalensis, Acanthogobius ommaturus, Konosirus punctatus, and Sardinella zunasi. Additionally, pH and Temp were positively correlated with Sardinella zunasi and Konosirus punctatus. Depth and salinity were positively correlated with Pennahia argentata, Jaydia lineata, Saurida microlepis, and Silliago japonica.

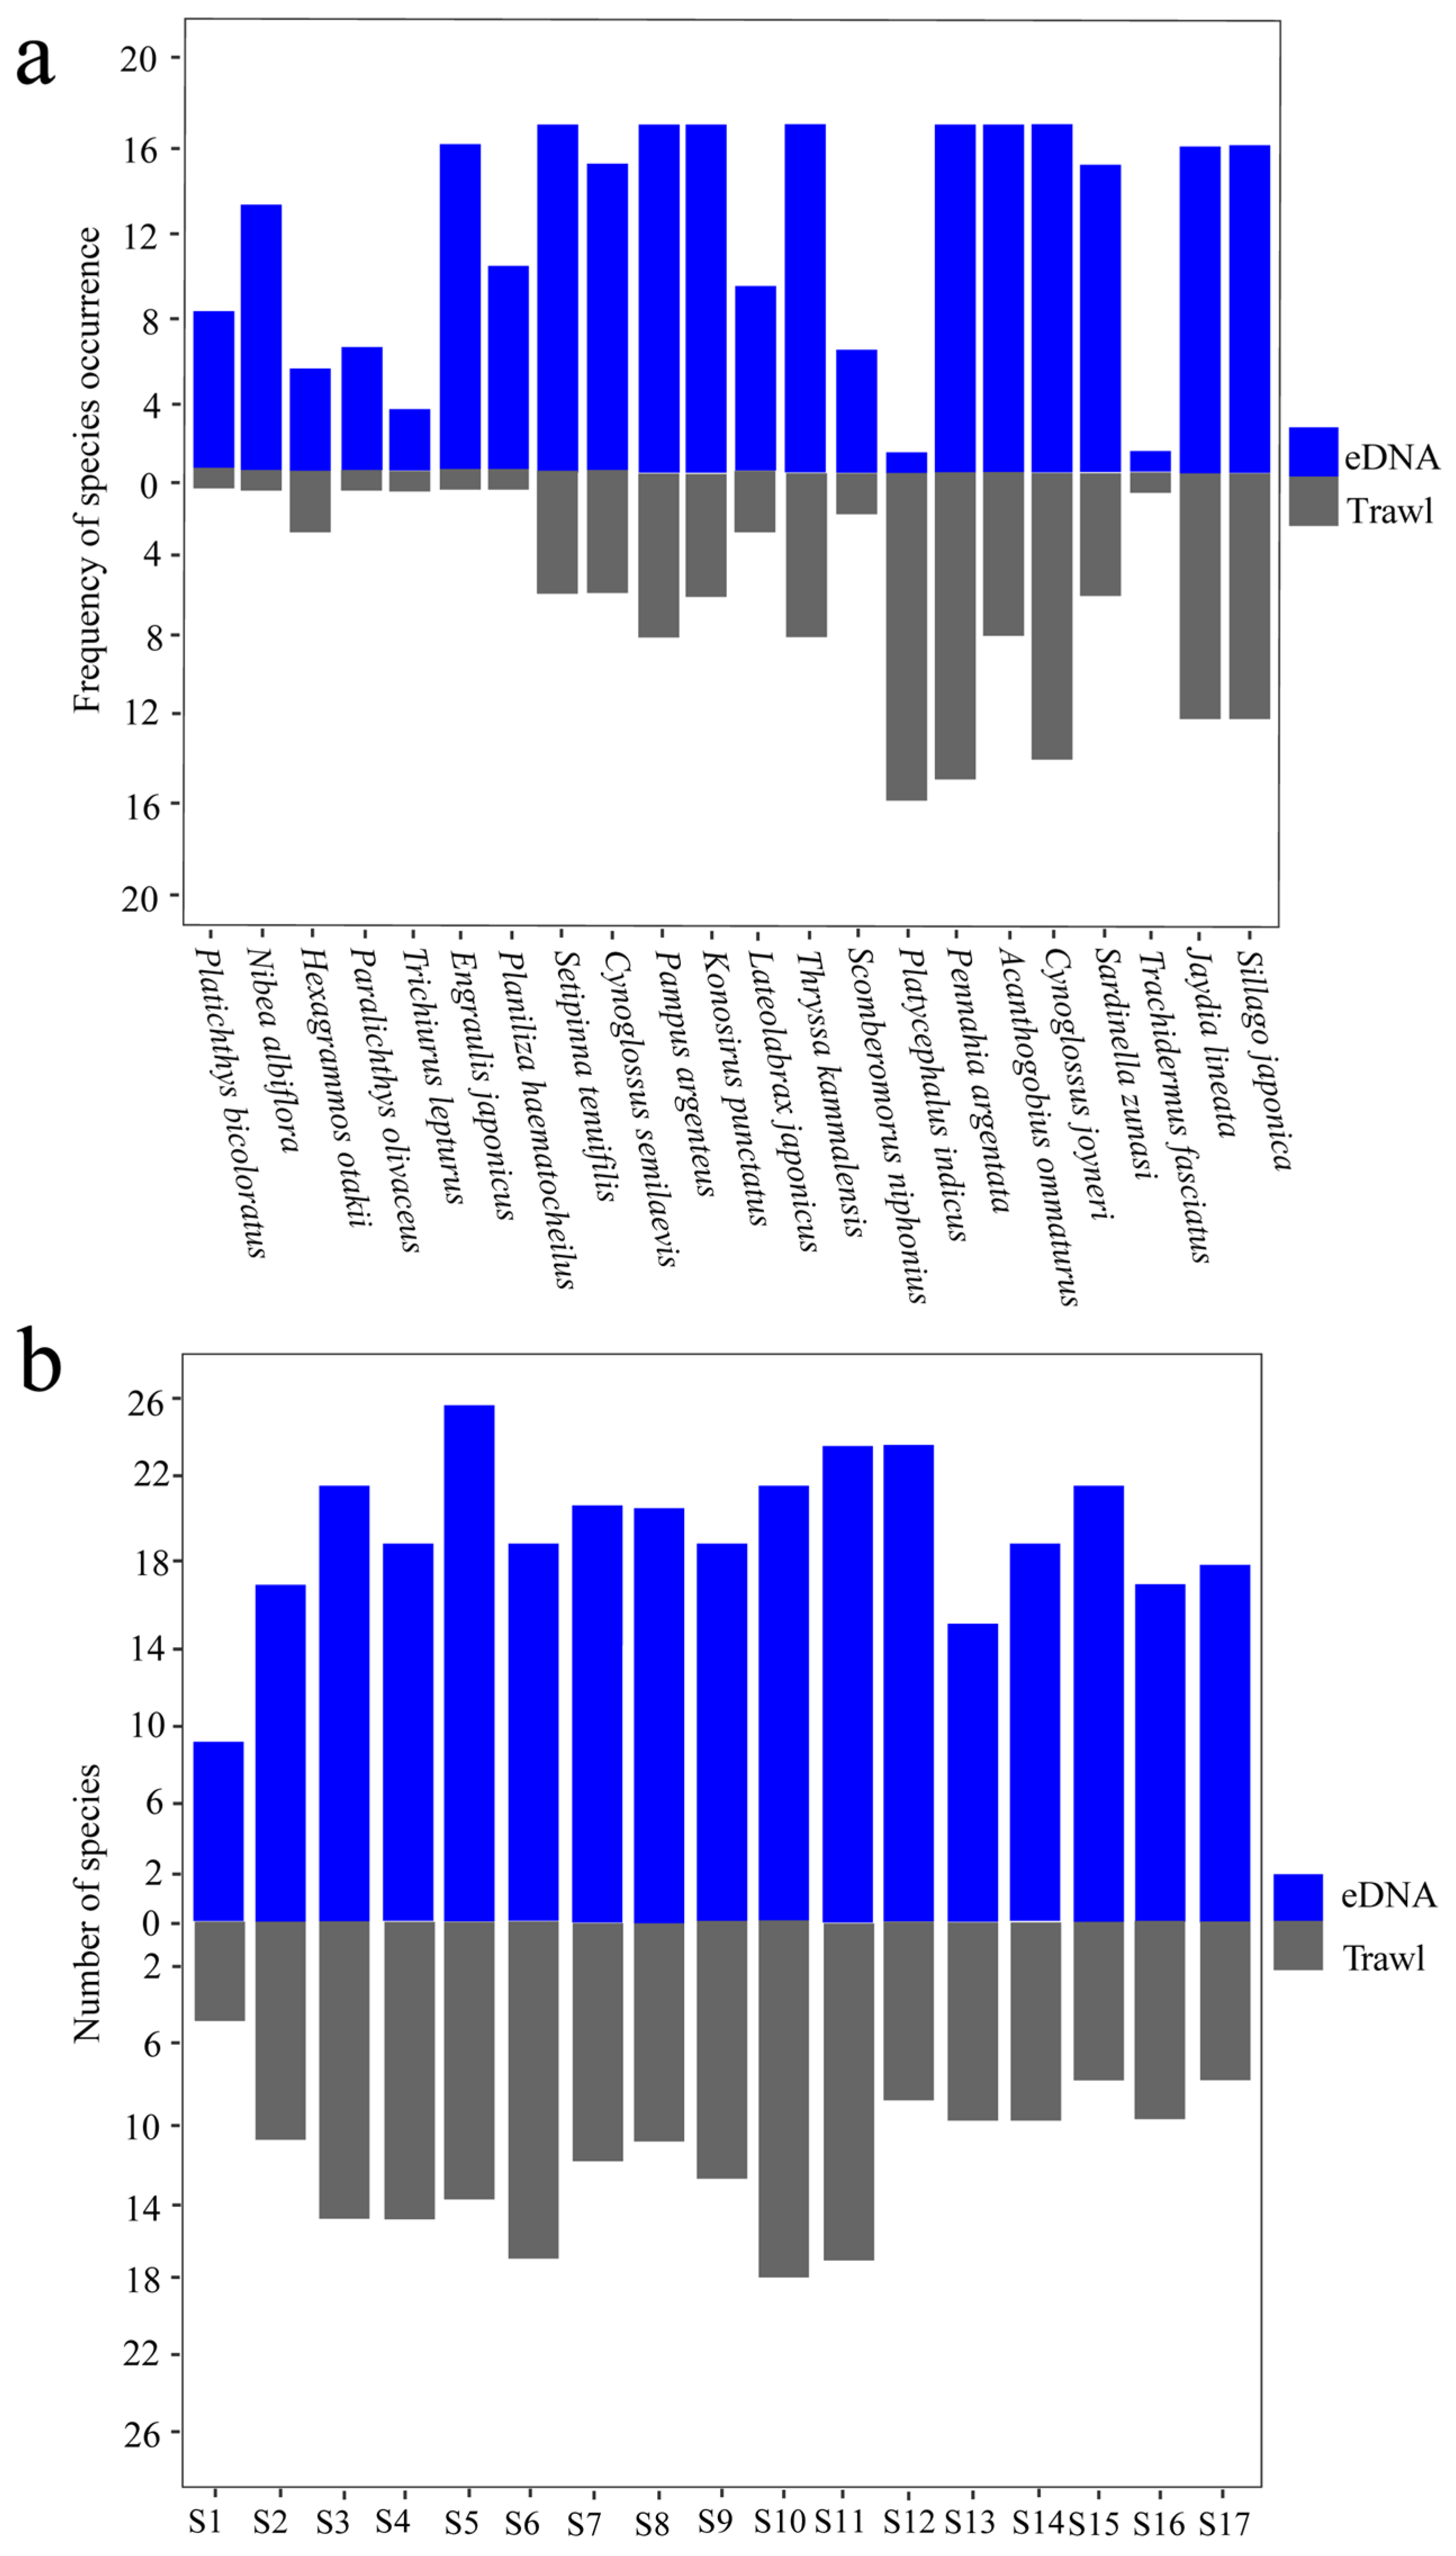
3.4. Comparison with Fish Trawling

A total of 38 species were captured in the trawl surveys, and 41 taxa were detected by eDNA. A total of 22 species were identified both from the eDNA and trawl surveys (Supplementary Material Table S1). There existed a strong consistency in the distribution of most species obtained through eDNA monitoring and trawl surveys (Figure 6a). In eDNA detection, the species Sillago japonica, Jaydia lineata, Sardinella zunasi, Cynoglossus joyneri, Acanthogobius ommaturus, Pennahia argentata, Thryssa kammalensis, Konosirus punctatus, Pampus argenteus, Cynoglossus semilaevis, Setipinna tenuifilis, and Engraulis japonicus showed relatively high frequencies of occurrence. In the trawl surveys, the species Sillago japonica, Jaydia lineata, Cynoglossus joyneri, Acanthogobius ommaturus, Pennahia argentata, Platycephalus indicus, and Pampus argenteus showed relatively high frequencies of occurrence. At the same sampling site, a higher number of species were detected through eDNA detection (Figure 6b). To evaluate the relationship between the biomass of fish caught and the abundance of reads obtained through eDNA, a linear regression analysis was conducted (Supplementary Material Table S3). The results showed a significant positive relationship between species biomass and read abundance (Figure 7).

4. Discussion

The estuary of the Yellow River and its adjacent waters provide important habitats for marine organisms. As the main component of marine biological resources, fishery resources are threatened by overfishing and habitat degradation, thus making it necessary to conduct investigations for the Yellow River Estuary and its adjacent waters’ fishery resources.

4.1. Fish Diversity in Yellow River Estuary

In our study, 41 species were detected in the spring eDNA survey, whereas a total of 51 species were detected in the summer eDNA survey, alongside the trawl surveys. Sun et al. (2023) conducted a survey on fishery resources in the Yellow River Estuary and its adjacent waters during the spring and summer, and a total of 54 fish species were recorded (Table 3) [31]. Our results accounted for 76% and 94% of this record, respectively. Statistical data indicate that our study effectively captured fish diversity information within the research area.
During the spring and summer surveys, the dominant species mainly consisted of small, economically important species, with Clupeiformes and Perciformes being the most dominant groups, respectively. In the 1960s, the dominant species in the Yellow River Estuary and its adjacent waters were demersal fish such as Larimichthys polyactis and Trichiurus lepturus (Table 3). However, by the early 1990s, pelagic fish species such as Engraulis japonicas, Thryssa kammalensis, and Konosirus punctatus became the dominant species. Zheng et al. (2012) conducted three trawl surveys during the summer at the Yellow River Estuary, revealing that Perciformes had the highest abundance. The dominant species were Chaemrichthys stigmatias, Konosirus punctatus, Engraulis japonicus, and Sardinella zunasi [32]. During the seven trawl surveys conducted by Wang et al. (2018) between 2013 and 2014, a total of 51 fish species were captured. Although Perciformes remained the most abundant, there was a reduction in the number of species compared to the 1980s [33]. As shown in Table 3, there has been a turnover in dominant species. In short, the trend of fishery resources in the Yellow River Estuary and its adjacent waters has transitioned from long-lived, larger-sized demersal fish species to smaller-sized, short-lived pelagic fish species [34]. This succession may be associated with the decline in ecosystem stability resulting from overfishing and environmental degradation [35]. In our research, eDNA identified the presence of the endangered species Trachidermus fasciatus and the invasive species Scophthalmus maximus during the spring. Additionally, Trachidermus fasciatus was also detected in the summer survey. This suggests that eDNA was sensitive in detecting rare and valuable species [36].
Consistent with previous research, the surface and bottom communities had a lower diversity in spring, whereas a higher diversity was observed in summer [37]. Biological diversity is closely related to the environment, especially in the estuary ecosystem [38]. In our study, temperate, subtropical, and tropical species accounted for 36%, 33%, and 31%, respectively, within the entire study area. In Laizhou Bay, the number of species preferring warm water was highest in all the seasons [37]. Thus, from the spring to the summer, as the water temperature rises, the diversity of fish species gradually increases. Moreover, the climatic conditions and temperatures in the Yellow River Estuary and its surrounding waters are more favorable for biological growth in the summer than in other seasons, with a greater abundance of natural bait organisms [37]. Additionally, some researchers suggested that the differences in diversity indices among the different seasons were attributed to the seasonal spawning, feeding, and overwintering migrations of fish species [39,40]. In the NMDS analyses, the points of the spring surface and bottom sites and the majority of the summer surface sites clustered together. Furthermore, the minimal differences between the spring surface and bottom communities suggest that there may be no vertical stratification structure within the fish communities. Seasonal stratification in the Bohai Sea generally begins in April and ends in September. During this period, the nearshore area is characterized by relatively warm mixed water [41].
Table 3. Data from fishery resource surveys conducted in different years. (Only the top 4 dominant species are listed. “-” represents the absence of dominant species statistical information).
YearNumber of InvestigationsSpecies NumberDominant SpeciesMethod
1959 [34]453Trichiurus lepturus Larimichthys polyactis
Cynoglossus semilaevis
Platycephalus indicus
Trawl
1983 [34]445Setipinna tenuifilis
Engraulis japonicus
Nibea albiflora
Larimichthys polyactis
Trawl
1993 [42]435Engraulis japonicus
Thryssa kammalensis
Setipinna tenuifilis
Konosirus punctatus
Trawl
1999 [34]430Thryssa kammalensis
Engraulis japonicus
Setipinna tenuifilis
Konosirus punctatus
Trawl
2012 [32]339Chaemrichthys stigmatias
Konosirus punctatus
Sardinella zunasi
Engraulis japonicus
Trawl
2014 [33]751-Trawl
2019 [43]346Chaemrichthys stigmatias
Cynoglossus joyneri
Trawl
2020 [31]354Cynoglossus joyneri
Chaemrichthys stigmatias
Thryssa kammalensis
Callionymus beniteguri
Trawl
2022–2023255Sardinella zunasi
Hexagrammos otakii
Engraulis japonicus
Sebastes spp.
eDNA
2023138Chaemrichthys stigmatias
Pampus argenteus
Cynoglossus joyneri
Thryssa kammalensis
Trawl

4.2. Relationships between Fish Community and Environmental Factors

The species community structure in estuarine systems is mainly influenced by environmental factors [44]. The spatial distribution patterns of fish communities are closely linked to various environmental factors and are also influenced by their habitat preferences [45,46]. In our study, all environmental factors, with the exception of water depth, were important drivers in the distribution of fish species. This may be attributed to the relatively shallow depth of the Bohai Sea, with an average depth of only 18 m. Additionally, pH had a significant effect on the fish species distribution (R2 = 0.9558, p = 0.002), which reflected the importance of water quality and the preferences of different species [2,47]. Further, the influence of DO on the normal growth of fish species is broader. Previous research found that pH and DO are the primary environmental factors influencing fish distribution [48,49]. Our results have confirmed this. Water temperature and salinity are considered fundamental factors affecting the spatiotemporal distribution of fish, and their significant changes can gradually alter the structure of fish communities [50,51].

4.3. Comparison of eDNA with Trawl Survey

We conducted a survey of the summer fishery resources in the Yellow River Estuary and its adjacent waters using a combination of eDNA and trawl surveys. The eDNA survey obtained 41 taxa, with only 35 taxa identified at the species level, whereas the trawl survey identified 38 species. Compared to the trawl survey, eDNA was sensitive to detecting a larger number of taxa. However, the number of species identified in this study by eDNA was relatively low. The six taxa that have not been identified to the species level were Sebastes, Takifugu, Planiliza, Sciaenidae, Gobiidae, and Perciformes. This may be attributed to the limited sequence variability within the amplicons [23,52]. Moreover, due to the lack of a high-quality reference database of local biodiversity, a large number of misidentified species sequence entries in public databases may lead to erroneous taxonomic assignment in the eDNA samples [53,54]. Thus, this may result in the assignment of these OTUs to higher taxonomic groups when merged.
In our study, we compared the performance of two methods in the same species and at the same site. The results showed that eDNA can efficiently provide information about the diversity and distribution of fish in large marine areas [10]. The significant positive relationship between biomass and read abundance indicated the potential for eDNA to be used in estimating biomass [55]. However, this conclusion was not always valid. Different species may release eDNA in different states due to their physiological status, activity levels, and metabolic processes [56]. In addition, comparing the results from the two seasons, we found that the number (41) of species detected exclusively by eDNA was lower than the number (51) detected by eDNA and trawl surveys. The utilization of eDNA as a complementary tool to conventional approaches can reveal a broader taxonomic diversity and provide a more comprehensive perspective on species composition in aquatic ecosystems [37,38].

5. Conclusions

In this study, we investigated fishery resources in the Yellow River Estuary and its adjacent waters through a combination of eDNA and trawl surveys. The eDNA and trawl surveys identified 55 and 38 fish species, respectively, with the dominant species mainly consisting of smaller-sized, pelagic fish species. The diversity index of the summer was higher than that of the spring, with pH and DO identified as important influential environmental factors shaping the distribution of fish communities. The NMDS analysis revealed that there may be a lack of vertical stratification within the fish communities in our study area during the spring. Moreover, based on the results of the eDNA-assisted trawl surveys, we believe that using eDNA as a complementary tool to conventional survey techniques can provide a more comprehensive perspective for fishery resource assessment. This study provides important data and insights for understanding fish diversity and community structure in the Yellow River Estuary and its adjacent waters.

Supplementary Materials

The following supporting information can be downloaded at: https://www.mdpi.com/article/10.3390/fishes9060192/s1, Figure S1: Rarefaction of samples; Table S1: Detection results of the eDNA and trawl surveys (“+” indicates existence); Table S2: Envif test of environmental factors in summer. Table S3: Summer trawling fish data.

Author Contributions

Conceptualization, L.Z. and X.Z.; methodology, F.L., L.Z. and X.Z.; software, X.W.; validation, F.L., F.S., H.S. and X.Z.; formal analysis, X.Z., F.L. and F.S.; investigation, X.W., X.Z., F.S. and H.S.; resources, F.L., F.S. and H.S.; data curation, N.S. and L.Z.; writing—original draft preparation, X.W.; writing—review and editing, N.S., L.Z. and X.Z.; visualization, X.W.; supervision, N.S. and L.Z.; project administration, L.Z.; funding acquisition, L.Z. All authors have read and agreed to the published version of the manuscript.

Funding

This research was funded by the opening foundation of the Observation and Research Station of Bohai Strait Eco-Corridor, MNR (No. BH202203), and the Science and Technology Innovation Program of the Laoshan Laboratory (No. LSKJ202203803).

Institutional Review Board Statement

Not applicable.

Informed Consent Statement

Not applicable.

Data Availability Statement

The raw data supporting the conclusions of this article will be made available by the authors on request.

Acknowledgments

We sincerely appreciate the editor and all reviewers for their meticulous reading and comprehensive evaluation of our manuscript.

Conflicts of Interest

The authors declare no conflicts of interest.

References

  1. Yeoh, D.E.; Valesini, F.J.; Hallett, C.S.; Abdo, D.A.; Williams, J. Diel shifts in the structure and function of nearshore estuarine fish communities. J. Fish Biol. 2017, 90, 1214–1243. [Google Scholar] [CrossRef]
  2. Qian, M.; Wang, Z.; Zhou, Q.; Wang, J.; Shao, Y.; Qiao, Q.; Fan, J.; Yan, Z. Environmental DNA unveiling the fish community structure and diversity features in the Yangtze River basin. Environ. Res. 2023, 239, 117198. [Google Scholar] [CrossRef] [PubMed]
  3. Van Niekerk, L.; Taljaard, S.; Lamberth, S.J.; Adams, J.B.; Weerts, S.P.; MacKay, C.F. Disaggregation and assessment of estuarine pressures at the country-level to better inform management and resource protection–the South African experience. Afr. J. Aquat. Sci. 2022, 47, 127–148. [Google Scholar] [CrossRef]
  4. Worm, B.; Barbier, E.B.; Beaumont, N.; Duffy, J.E.; Folke, C.; Halpern, B.S.; Jackson, J.B.C.; Lotze, H.K.; Micheli, F.; Palumbi, S.R.; et al. Impacts of Biodiversity Loss on Ocean Ecosystem Services. Science 2006, 314, 787–790. [Google Scholar] [CrossRef] [PubMed]
  5. Cinner, J.E.; Zamborain-Mason, J.; Gurney, G.G.; Graham, N.A.J.; MacNeil, M.A.; Hoey, A.S.; Mora, C.; Villéger, S.; Maire, E.; McClanahan, T.R.; et al. Meeting fisheries, ecosystem function, and biodiversity goals in a human-dominated world. Science 2020, 368, 307–311. [Google Scholar] [CrossRef] [PubMed]
  6. Seitzinger, S.P.; Mayorga, E.; Bouwman, A.F.; Kroeze, C.; Beusen, A.H.W.; Billen, G.; Van Drecht, G.; Dumont, E.; Fekete, B.M.; Garnier, J.; et al. Global river nutrient export: A scenario analysis of past and future trends. Glob. Biogeochem. Cycles 2010, 24, 2621–2628. [Google Scholar] [CrossRef]
  7. Lyu, D.; Qian, T.; Li, F.; Sun, S.; Wang, W.; Shan, X. Monitoring and assessing the species diversity and abundance of marine teleost around the Yellow River estuary in June using environmental DNA. Front. Mar. Sci. 2023, 10, 1123831. [Google Scholar] [CrossRef]
  8. Wang, H.; Yang, Z.; Saito, Y.; Liu, J.P.; Sun, X.; Wang, Y. Stepwise decreases of the Huanghe (Yellow River) sediment load (1950-2005): Impacts of climate change and human activities. Gobal Planet. Chang. 2007, 57, 331–354. [Google Scholar] [CrossRef]
  9. Jin, X.; Shan, X.; Li, X.; Wang, J.; Cui, Y.; Zuo, T. Long-term changes in the fishery ecosystem structure of Laizhou Bay, China. Sci. China Earth Sci. 2013, 56, 366–374. [Google Scholar] [CrossRef]
  10. Fraija-Fernández, N.; Bouquieaux, M.C.; Rey, A.; Mendibil, I.; Cotano, U.; Irigoien, X.; Rodríguez-Ezpeleta, N. Marine water environmental DNA metabarcoding provides a comprehensive fish diversity assessment and reveals spatial patterns in a large oceanic area. Ecol. Evol. 2020, 10, 7560–7584. [Google Scholar] [CrossRef]
  11. Sakuma, K.M.; Field, J.C.; Mantua, N.J.; Ralston, S.; Marinovic, B.B.; Carrion, C.N. Anomalous epipelagic micronekton assemblage patterns in the neritic waters of the California Current in spring 2015 during a period of extreme ocean conditions. CalCOFI Rep. 2016, 57, 163–183. [Google Scholar]
  12. Thomsen, P.F.; Willerslev, E. Environmental DNA—An emerging tool in conservation for monitoring past and present biodiversity. Biol. Conserv. 2015, 183, 4–18. [Google Scholar] [CrossRef]
  13. Doi, H.; Fukaya, K.; Oka, S.I.; Sato, K.; Kondoh, M.; Miya, M. Evaluation of detection probabilities at the water-filtering and initial PCR steps in environmental DNA metabarcoding using a multispecies site occupancy model. Sci. Rep. 2019, 9, 3581. [Google Scholar] [CrossRef] [PubMed]
  14. Doi, H.; Inui, R.; Akamatsu, Y.; Kanno, K.; Yamanaka, H.; Takahara, T.; Minamoto, T. Environmental DNA analysis for estimating the abundance and biomass of stream fish. Freshw. Biol. 2017, 62, 30–39. [Google Scholar] [CrossRef]
  15. Wang, S.; Yan, Z.; Hänfling, B.; Zheng, X.; Wang, P.; Fan, J.; Li, J. Methodology of fish eDNA and its applications in ecology and environment. Sci. Total Environ. 2021, 755, 142622. [Google Scholar] [CrossRef] [PubMed]
  16. Zhang, S.; Zhao, J.; Yao, M. A comprehensive and comparative evaluation of primers for metabarcoding eDNA from fish. Methods Ecol. Evol. 2020, 11, 1609–1625. [Google Scholar] [CrossRef]
  17. Ogram, A.; Sayler, G.S.; Barkay, T. The extraction and purification of microbial dna from sediments. J. Microbiol. Methods 1987, 7, 57–66. [Google Scholar] [CrossRef]
  18. Ficetola, G.F.; Miaud, C.; Pompanon, F.; Taberlet, P. Species detection using environmental DNA from water samples. Biol. Lett. 2008, 4, 423–425. [Google Scholar] [CrossRef] [PubMed]
  19. Sigsgaard, E.E.; Carl, H.; Moller, P.R.; Thomsen, P.F. Monitoring the near-extinct European weather loach in Denmark based on environmental DNA from water samples. Biol. Conserv. 2014, 183, 46–52. [Google Scholar] [CrossRef]
  20. Tréguier, A.; Paillisson, J.M.; Dejean, T.; Valentini, A.; Schlaepfer, M.A.; Roussel, J.M. Environmental DNA surveillance for invertebrate species: Advantages and technical limitations to detect invasive crayfish Procambarus clarkii in freshwater ponds. J. Appl. Ecol. 2014, 51, 871–879. [Google Scholar] [CrossRef]
  21. Zhang, H.; Wang, X.; Chen, Z.; Zhong, L.; Gao, T. Minary study on spatial distribution pattern of fish in Zhoushan and its adjacent waters based on environmental DNA metabarcoding. J. Fish. China 2022, 1–13. Available online: https://kns.cnki.net/kcms/detail//31.1283.S.20221226.1142.003.html (accessed on 15 May 2024). (In Chinese).
  22. Shu, L.; Lin, J.; Xu, Y.; Cao, T.; Feng, J.; Peng, Z. Investigating the fish diversity in Erhai lake based on environmental DNA metabarcoding. Acta Hydrobiol. Sin. 2020, 44, 1080–1086. [Google Scholar] [CrossRef]
  23. Miya, M.; Sato, Y.; Fukunaga, T.; Sado, T.; Poulsen, J.Y.; Sato, K.; Poulsen, J.Y.; Sato, K.; Minamoto, T.; Yamamoto, S.; et al. MiFish, a set of universal PCR primers for metabarcoding environmental DNA from fishes: Detection of more than 230 subtropical marine species. R. Soc. Open Sci. 2015, 2, 150088. [Google Scholar] [CrossRef] [PubMed]
  24. Bolyen, E.; Rideout, J.R.; Dillon, M.R.; Bokulich, N.A.; Abnet, C.C.; Al-Ghalith, G.A.; Alexander, H.; Alm, E.J.; Arumugam, M.; Asnicar, F.; et al. Reproducible, interactive, scalable and extensible microbiome data science using QIIME 2. Nat. Biotechnol. 2019, 37, 852–857. [Google Scholar] [CrossRef] [PubMed]
  25. Callahan, B.J.; McMurdie, P.J.; Rosen, M.J.; Han, A.W.; Johnson, A.J.A.; Holmes, S.P. DADA2: High-resolution sample inference from Illumina amplicon data. Nat. Methods 2016, 13, 581–583. [Google Scholar] [CrossRef] [PubMed]
  26. Berger, C.S.; Hernandez, C.; Laporte, M.; Cté, G.; Bernatchez, L. Fine: Cale environmental heterogeneity shapes fluvial fish communities as revealed by eDNA metabarcoding. Environ. DNA 2020, 2, 647–666. [Google Scholar] [CrossRef]
  27. Shen, A.; Ishizaka, J.; Yang, M.; Ouyang, L.; Yin, Y.; Ma, Z. Changes in community structure and photosynthetic activities of total phytoplankton species during the growth, maintenance, and dissipation phases of a Prorocentrum donghaiense bloom. Harmful Algae 2019, 82, 35–43. [Google Scholar] [CrossRef]
  28. Martin, G.R.; Twigg, L.E.; Robinson, D.J. Comparison of the diet of feral cats from rural and pastoral Western Australia. Wildl. Res. 1996, 23, 475–484. [Google Scholar] [CrossRef]
  29. Oksanen, J.; Simpson, G.L.; Blanchet, F.G.; Kindt, R.; Legendre, P.; Minchin, P.R.; O’Hara, R.B.; Solymos, P.; Stevens, M.H.H.; Szoecs, E.; et al. vegan: Community Ecology Package, R package version 2.6-4; 2022. Available online: https://CRAN.R-project.org/package=vegan (accessed on 15 May 2024).
  30. Froese, R.; Pauly, D. FishBase. World Wide Web Electronic Publication. Available online: http://www.fishbase.org (accessed on 10 May 2024).
  31. Sun, Y.; Wang, L.; Wang, Z.; Zhang, Y.; Zhao, G.; Kong, Q.; Xu, X.; Qiu, S. Changes of community structure of swimming organisms in the Yellow River Estuary and adjacent waters and its relationship with environmental factors. J. Yantai Univ. Nat. Sci. Eng. Ed. 2023, 36, 186–195. (In Chinese) [Google Scholar] [CrossRef]
  32. Zheng, L.; Lv, Z.; Li, F.; Zhang, L.; Yu, W. Fish community structure in the Yellow River estuary: Effect of water and sediment discharge regulations. J. Fish. Sci. China 2014, 21, 602–610. (In Chinese) [Google Scholar] [CrossRef]
  33. Wang, J.; Zhang, C.; Xue, Y.; Ren, Y.; Xu, B. Taxonomic diversity of fish community in the Yellow River Estuary. Acta Oceanol. Sin. 2018, 40, 86–95. (In Chinese) [Google Scholar] [CrossRef]
  34. Jin, X.; Deng, J. Variations in community structure of fishery resources and biodiversity in the Laizhou Bay, Shandong, Chinese. Biodiversity 2000, 8, 65–72. (In Chinese) [Google Scholar] [CrossRef]
  35. Ryder, R.A.; Kerr, S.R.; Taylor, W.W.; Larkin, P.A. Community consequence of fish stock diversity. Can. J. Fish. Aquat. Sci. 1981, 38, 1856–1866. [Google Scholar] [CrossRef]
  36. Lyman, J.A.; Sanchez, D.E.; Hershauer, S.N.; Sobek, C.J.; Chambers, C.L.; Zahratka, J.; Walker, F.M. Mammalian eDNA on herbaceous vegetation? Validating a qPCR assay for detection of an endangered rodent. Environ. DNA 2022, 4, 1187–1197. [Google Scholar] [CrossRef]
  37. Dai, S.; Bai, M.; Jia, H.; Xian, W.; Zhang, H. An assessment of seasonal differences in fish populations in Laizhou Bay using environmental DNA and conventional resource survey techniques. Fishes 2022, 7, 250. [Google Scholar] [CrossRef]
  38. Abidin, D.H.Z.; Nor, S.A.M.; Lavoué, S.; Rahim, M.A.; Akib, N.A.M. Assessing a megadiverse but poorly known community of fishes in a tropical mangrove estuary through environmental DNA (eDNA) metabarcoding. Sci. Rep. 2022, 12, 16346. [Google Scholar] [CrossRef] [PubMed]
  39. Jin, X.; Tang, Q. Changes in fish species diversity and dominant species composition in the Yellow Sea. Fish. Res. 1996, 26, 337–352. [Google Scholar] [CrossRef]
  40. Jaureguizar, A.J.; Solari, A.; Cortés, F.; Milessi, A.C.; Militelli, M.I.; Camiolo, M.D.; García, M. Fish diversity in the Río de la Plata and adjacent waters: An overview of environmental influences on its spatial and temporal structure. J. Fish Biol. 2016, 89, 569–600. [Google Scholar] [CrossRef]
  41. Zhou, F.; Huang, D.; Su, J. Numerical simulation of the dual-core structure of the Bohai Sea cold bottom water in summer. Chin. Sci. Bull. 2009, 54, 1591–1599. [Google Scholar] [CrossRef]
  42. Jin, X. The dynamics of major fishery resources in the Bohai Sea. J. Fish. Sci. China 2000, 7, 22–26. (In Chinese) [Google Scholar] [CrossRef]
  43. Gao, H.; Wang, L.; Qiu, S.; Gao, K. Current Status of Fishery Resources in the Yellow River Estuary and Its Adjacent Sea Area. J. Yantai Univ. Nat. Sci. Eng. Ed. 2022, 35, 191–200. (In Chinese) [Google Scholar] [CrossRef]
  44. Kamrani, E.; Sharifinia, M.; Hashemi, S.H. Analyses of fish community structure changes in three subtropical estuaries from the Iranian coastal waters. Mar. Biol. 2016, 46, 561–577. [Google Scholar] [CrossRef]
  45. Beukhof, E.; Dencker, T.S.; Pecuchet, L.; Lindegren, M. Spatio-temporal variation in marine fish traits reveals community-wide responses to environmental change. Mar. Ecol. Prog. Ser. 2019, 610, 205–222. [Google Scholar] [CrossRef]
  46. Luo, Z.; Yang, C.; Wang, L.; Liu, Y.; Shan, B.; Liu, M.; Sun, D. Relationships between Fish Community Structure and Environmental Factors in the Nearshore Waters of Hainan Island, South China. Diversity 2023, 15, 901. [Google Scholar] [CrossRef]
  47. Wu, L.; Osugi, T.; Inagawa, T.; Okitsu, J.; Sakamoto, S.; Minamoto, T. Monitoring of multiple fish species by quantitative environmental DNA metabarcoding surveys over two summer seasons. Mol. Ecol. Resour. 2023, 24, e13875. [Google Scholar] [CrossRef]
  48. Carlisle, A.B.; Kochevar, R.E.; Arostegui, M.C.; Ganong, J.E.; Castleton, M.; Schratwieser, J.; Block, B.A. Influence of temperature and oxygen on the distribution of blue marlin (Makaira nigricans) in the Central Pacific. Fish. Oceanogr. 2017, 26, 34–48. [Google Scholar] [CrossRef]
  49. Liu, H.; Niu, J.; Liu, C.; Zhang, T.; Mina, M.; Chen, H.; Cai, L. Fish community structure and its relationship with environmental factors of main stream of Emin River, Xinjiang. Sheng Tai Xue Za Zhi 2017, 36, 3558–3563. (In Chinese) [Google Scholar] [CrossRef]
  50. Baptista, J.; Martinho, F.; Martins, R.; Carneiro, M.; Azevedo, M.; Vieira, A.R.; Gomes, P.; Pardal, M.A. Water temperature gradient shapes the structure and composition of nearshore marine fish communities in southern Europe. J. Sea Res. 2019, 154, 101807. [Google Scholar] [CrossRef]
  51. Guo, C.; Konar, B.H.; Gorman, K.B.; Walker, C.M. Environmental factors important to high-latitude nearshore estuarine fish community structure. Deep Sea Res. Part II Top. Stud. Oceanogr. 2022, 201, 105109. [Google Scholar] [CrossRef]
  52. Díaz, J.; Vanina, V.; Felipe, D.P.; Florencia, B.; Alexis, G.; Silvia, E.A. First DNA barcode reference library for the identification of South American freshwater fish from the lower Paraná River. PLoS ONE 2016, 11, e0157419. [Google Scholar] [CrossRef] [PubMed]
  53. Callahan, B.J.; McMurdie, P.J.; Holmes, S.P. Exact sequence variants should replace operational taxonomic units in marker-gene data analysis. ISME J. 2017, 11, 2639–2643. [Google Scholar] [CrossRef]
  54. Pentinsaari, M.; Ratnasingham, S.; Miller, S.E.; Hebert, P.D.N. BOLD and GenBank revisited—Do identification errors arise in the lab or in the sequence libraries? PLoS ONE 2020, 15, e0231814. [Google Scholar] [CrossRef]
  55. Itakura, H.; Wakiya, R.; Yamamoto, S.; Kaifu, K.; Sato, T.; Minamoto, T. Environmental DNA analysis reveals the spatial distribution, abundance, and biomass of Japanese eels at the river-basin scale. Aquat. Conserv. Mar. Freshw. Ecosyst. 2019, 29, 361–373. [Google Scholar] [CrossRef]
  56. Shu, L.; Ludwig, A.; Peng, Z. Environmental dna metabarcoding primers for freshwater fish detection and quantification: In silico and in tanks. Ecol. Evol. 2021, 11, 8281–8294. [Google Scholar] [CrossRef]
Figure 1. Sampling sites from the Yellow River Estuary and its adjacent waters. (a): eDNA sampling sites in May 2022 (spring). (b): eDNA and trawl survey sampling sites in August 2023 (summer).
Fishes 09 00192 g001
Figure 2. The proportion of fish species at the order, family and genus levels in the Yellow River Estuary and its adjacent waters. (a,b), respectively, represent the proportion between orders and families in spring and summer. (c) (eDNA) represents the proportion between families and genera in spring. (d) (eDNA) and (e) (trawl), respectively, represent the proportion between families and genera in summer.
Fishes 09 00192 g002
Figure 3. Seasonal difference based on the alpha index. “ns” represents p > 0.05; “*” represents p < 0.05; “**” represents p < 0.01. The p value was obtained through the t-test. The abbreviation “AS” represents spring surface samples, “AB” represents spring bottom samples, and “S” represents summer surface samples.
Fishes 09 00192 g003
Figure 4. NMDS based on the Bray–Curtis similarity ordination (stress = 0.169). Each point represents a sample. The abbreviation “AS” represents spring surface samples, “AB” represents spring bottom samples, and “S” represents summer surface samples. Ellipses represent a 95% confidence interval.
Fishes 09 00192 g004
Figure 5. The RDA plot revealed the relationship between five environmental factors and dominant species detected by eDNA in summer.
Fishes 09 00192 g005
Figure 6. (a) The occurrence frequency of the same species at different sampling sites obtained through eDNA detection and trawl surveys during the summer. (b) The number of fish species collected at the same sites during the summer by eDNA and trawl surveys.
Fishes 09 00192 g006
Figure 7. The linear regression of species biomass (Kg) and read abundance obtained from trawl surveys and eDNA detection. Shading indicates a 95% confidence interval.
Fishes 09 00192 g007
Table 1. Sampling information (“+” indicates the samples or environment factors obtained).
SeasonSurvey
Site
Surface
eDNA
Bottom
eDNA
SeasonSurvey SiteSurface
eDNA
Trawl
Survey
Environmental Factors
SpringA1+ SummerS1++
SpringA2++SummerS2++
SpringA3++SummerS3+++
SpringA4++SummerS4+++
SpringA5++SummerS5+++
SpringA6+ SummerS6+++
SpringA7++SummerS7++
SpringA8++SummerS8++
SpringA9++SummerS9+++
SpringA10++SummerS10+++
SpringA11++SummerS11+++
SpringA12+ SummerS12+++
SpringA13+ SummerS13++
SpringA14++SummerS14++
SpringA15++SummerS15++
SpringA16 +SummerS16++
SpringA17 +SummerS17++
SpringA18 +
SpringA19 +
Table 2. Dominant species of each season.
Dominant SpeciesSpring/eDNA
(Surface)
Spring/eDNA
(Bottom)
Summer/eDNA
(Surface)
Summer/Trawl
(Bottom)
Acanthogobius ommaturus+++
Chaemrichthys stigmatias +
Cynoglossus joyneri ++
Engraulis japonicus+++
Hexagrammos otakii++
Jaydia lineata +
Johnius grypotus +
Konosirus punctatus+++
Pampus argenteus ++
Pennahia argentata +
Sardinella zunasi+++
Saurida microlepis +
Sebastes spp.++
Setipinna tenuifilis ++
Sillago japonica +
Thryssa kammalensis++++
Disclaimer/Publisher’s Note: The statements, opinions and data contained in all publications are solely those of the individual author(s) and contributor(s) and not of MDPI and/or the editor(s). MDPI and/or the editor(s) disclaim responsibility for any injury to people or property resulting from any ideas, methods, instructions or products referred to in the content.

