Article

Identification and Characterization of microRNAs in Morphological Color Change of Polychromatic Midas Cichlids (Amphilophus citrinellus)

1
Key Laboratory of Tropical and Subtropical Fishery Resources Application and Cultivation, Ministry of Agriculture and Rural Affairs, Pearl River Fisheries Research Institute, Chinese Academy of Fishery Sciences, Guangzhou 510380, China
2
College of Fisheries and Life Science, Shanghai Ocean University, Shanghai 201306, China
*
Author to whom correspondence should be addressed.
Fishes 2024, 9(6), 194; https://doi.org/10.3390/fishes9060194
Submission received: 22 April 2024 / Revised: 15 May 2024 / Accepted: 22 May 2024 / Published: 24 May 2024
(This article belongs to the Special Issue Genetics and Breeding in Aquaculture)

Abstract

:
As a representative genetic and economic trait, pigmentation has a strong impact on speciation and adaptation. However, information and reports on microRNAs (miRNAs) associated with pigmentation remain limited. The Midas cichlid fish, with three typical distinct stages of body color pattern, “black-gray-gold”, is an ideal model system for investigating pigmentation traits. In this study, miRNA libraries from scale tissues with the attached epidermis of Midas cichlids at three distinct stages of color transformation, black (B), transition (T), and gold (G), were sequenced using Illumina sequencing technology. In total, 53 (B vs. G), 88 (B vs. T), and 57 (T vs. G) miRNAs were differentially expressed between the respective groups. Target genes of the identified miRNAs were predicted, and the results showed that multiple target genes were related to pigmentation and pigment–cell differentiation. The miRNA–mRNA regulatory network suggests that miR-183-x and miR-133-x were predicted to be involved in regulating morphological color changes in Midas cichlids. The results advance our understanding of potential functions of miRNAs in skin pigment differentiation and early skin color fading of fishes.
Key Contribution: The Midas cichlid, which exhibits three distinct stages of body color pattern—black, gray, and gold—is an ideal model system for investigating pigmentation traits. This research found that the microRNAs miR-183-x and miR-133-x may be involved in regulating morphological color changes in Midas cichlids, potentially playing a role in skin pigment–cell differentiation and early skin color fading.

Graphical Abstract

1. Introduction

Body color is a unique and important heritable economic trait of fish which plays an important role in mate selection, predation, camouflage, and behavioral processes, as well as in development [1,2]. In many fishes, a typical “body color fading” phenomenon occurs from the larval to the juvenile stage. After the larva fish hatches out of the membrane, melanocytes began to differentiate and form, and the number of melanovytes gradually increases [3]. The skin color of the fish is initially black, and then other pigment cells gradually differentiate and form, and the skin fades to different degrees, showing various colors or stripes in juveniles and adults [3,4]. In aquaculture production, the black of the blood hybrid parrot fish (Vieja synspilum ♀ × Amphilophus citrinellus ♂) is completely faded in juveniles and adults, whereas koi carp (Cyprinus carpio var. koi) and Astronotus ocellatus are partially faded, and their striped body color is usually improved with use of pigmented feed to increase their commercial value. The complete degree of black body coloration fading in the early stages of fish development is the key to the effect of later color enhancement. However, it is common for the degree of fish body color not to meet the requirements of production in aquaculture [5]. At present, there are few studies on the biological characteristics of early body black coloration fading in fishes, so it is necessary to understand its molecular regulation in order to provide a theoretical basis for seeking an effective method to artificially improve fish body coloration.
The formation of fish body coloration is a complex biological process which is affected by many factors, such as heredity, nutrition, physiology, and environment [4,6]. It is not only related to pigment synthesis, but also depends on the type, number, and distribution of pigment cells and the interaction between pigment cells [7]. It has been reported that there are seven different kinds of pigment cells in fish, and different fishes have different types of pigment cells [8,9]. The differentiation, formation, and body color development of fish chromatophores are controlled by complex and well-balanced programs of gene activation and silencing [10,11]. Transcriptome analysis has been performed on non-model fishes with different skin colors, and numerous pigmentation-related genes have been identified and their functions studied, laying a foundation for the investigation of morphological in heredity in fishes [12,13,14].
MicroRNAs (miRNAs) are a class of endogenous single-stranded non-coding small RNAs 19–24 nt in length that negatively regulate gene expression at the post-transcriptional level by binding to target mRNAs in completely or incompletely complementary ways, thereby affecting numerous biological functions including body color formation [15]. MiRNAs play an important role in cell growth, tissue differentiation, and signal transduction, with temporal and tissue specificity [16,17,18]. The sequence evolution at miRNA binding sites could lead to rapid phenotypic evolution [19,20]. A series of miRNAs involved in regulating the formation of skin, body color, and hair color have been identified in koi carp (Cyprinus carpio L.), rainbow trout (Oncorhynchus mykiss), giant salamander (Andrias davidianus), Chinese soft-shelled turtle (Pelodiscus sinensis), and other animals [21,22,23,24]. Many genes and transcriptional regulators controlling skin and pigment cell formation in animals are regulated by miRNAs [25]. In a previous study, it was found that miR-508-3p can affect melanin production in alpacas by regulating the microphthalmia-associated transcription factor (mitf) [26]. Additionally, miR-206 plays a regulatory role in the skin color pigmentation by targeting the melanocortin 1 receptor (mc1r) in koi carp [27]. Overexpression of miR-137 can change skin color from black to brown in mice [28]. Overexpressing miR-148a-3p in alpaca melanocytes causes the expression of mitf pigmentation-associated protein tyrosinase (try) to be reduced, thereby affecting a decrease in the overall melanin content of the analyzed cells [29]. This evidence suggests that miRNAs could be involved in the formation of skin color patterns. However, few miRNAs associated with early black body color fading in fish have been reported.
The Midas cichlid (Amphilophus citrinellus) is a popular ornamental fish and the male parent of the hybrid blood parrot fish. The Midas cichlids have four types of pigment cells, including melanocytes, xanthophores, erythrophores, and iridocytes [30]. Body coloration is key ecological trait driving species formation [31]. At the early stage of development, the Midas cichlids show a typical body-color fading phenomenon (Figure 1) [3]. After fading, the whole body is uniform bright yellow without markings. It is an ideal biological model for studying the mechanism of early body-color determination in fish [32]. The gold/dark polymorphism is a Mendelian trait with the gold morph being the dominant form [11]. Kratochwil et al. reported that the 8.2 kb insertion within an intron of goldentouch determines the dark/gold polymorphism. However, the goldentouch expression does not differently change during ontogeny of gold Midas cichlids [33]. The molecular mechanism of morphological color change needs further study. Henning et al. [32] performed Illumina RNA-SEQ sequencing on the skin tissues of three typical body-color transition periods in Midas cichlids [33] and screened and identified several key genes related to pigment synthesis, such as dopachrome tautomerase (dct), solute carrier family24, member5 (slc24a5), tyrosinase (tyr), and tyrosinase-related protein 1 (tyrp1). However, whether there is a potential miRNA regulatory role on these genes related to body color remains unclear.
To explore the mechanism of miRNAs regulating body-color-related genes at the post-transcriptional level during the body-color fading stage of Midas cichlids, we used high-throughput sequencing analysis to identify miRNAs in fish of three typical phenotypes representing distinct stages of color transformation, which include of the black (B) stage (unfaded black period), transitional (T) stage (transition period into fading), and gold (G) stage (faded, completely golden period) (Figure 1). To understand the function of miRNAs in regulating body-color formation in fish, several differentially expressed miRNAs were verified using quantitative real-time PCR (qRT-PCR), and potential target genes of the miRNAs were predicted and analyzed using Gene Ontology (GO) enrichment and Kyoto Encyclopedia of Genes and Genomes (KEGG) pathway analysis.

2. Materials and Methods

2.1. Fish Farming and Sample Collection

Referring to the reports by Guoqiang Wu [34] and Henning [32], the body-color fading process of Midas cichlids is divided into three stages: B stage (black fish showing no signs of gold or yellow coloring), T stage (fish showing gray coloration with clear patterns of both gold and black throughout the body), and G stage (complete, or almost-complete gold coloring throughout the body) (Figure 1). A total of 100 black Midas cichlids (average body length 56.1 ± 0.5 mm) were collected from the Ornamental Fish Culture Base of the Pearl River Fisheries Research Institute, Chinese Academy of Fishery Sciences (Guangzhou, China) at 40 days after the larval fish hatched out of the membrane. All the fish were reared in a 200-L glass tank, and the water temperature was maintained at 26 ± 2 °C. Three fish were randomly selected on days 50, 65, and 85, corresponding to each of the three coloration periods. The fish were immersed in 100 mg/L MS-222 (Sigma-Aldrich, St. Louis, MO, USA) for anesthesia. Scale samples were quickly taken, placed in liquid nitrogen, and stored at −80 °C for long-term storage. All fish were cultured, and experiments were conducted in accordance with the Regulation for the Administration of Affairs Concerning Experimental Animals for the Science and Technology Bureau of China throughout the study.

2.2. Total RNA Extraction, Construction, and Sequencing of a Small RNA Library

Approximately 10–12 scales on both sides of the dorsal fin of each fish were collected and stored in RNA later solution (OMEGA, Tarzana, CA, USA) at 4 °C. Total RNA from the three groups of samples was extracted using TRizol reagent (Invitrogen, Carlsbad, CA, USA) according to the manufacturer’s instructions. RNA integrity was confirmed with agarose gel electrophoresis, and the concentration was detected with an OD260 reading using an Agilent 2100 Bioanalyzer (Agilent Technologies, Santa Clara, CA, USA). The RNA samples were size-fractionated with 15% polyacrylamide gel electrophoresis, and the 18–30 nt fraction was enriched. Then, 3′ RNA and 5′ RNA adapters were ligated to the purified RNA pools (TruSeq® Small RNA Sample Preparation Kit, Illumina, San Diego, CA, USA) using T4 ligase (New England Biolabs, Ipswich, MA, USA), and small RNAs connected to both splices were reverse transcribed using PCR. PCR products of about 140 bp length were retained and purified to generate the sequencing libraries, and each library was sequenced using the Illumina HiSeqTM 2500 Genome Analyzer by Guangzhou Kidio Biotechnology Co., Ltd. (Guangzhou, China).

2.3. Basic Analysis of Sequencing Data

All sequencing reads obtained from the Illumina HiSeqTM 2500 were quality-controlled using FastQC software (http://www.bioinformatics.babraham.ac.uk/projects/fastqc/, accessed on 6 April 2022) to obtain clean labels by removing invalid sequences, including low-quality reads, 3′ adapter null reads, 5′ adapter contaminant reads, and reads shorter than 18 nt. All of the clean tags were mapped to small RNAs in the GeneBank (http://www.ncbi.nlm.nih.gov/genbank, accessed on 13 July 2022) and Rfam (http://rfam.sanger.ac.uk, accessed on 5 August 2022) databases, and the rRNA, scRNA, snoRNA, snRNA, and tRNA sequences in the sample were removed. Subsequently, all of the reads were aligned with a reference genome for Amphilophus citrinellus (https://www.ncbi.nlm.nih.gov/assembly/GCA_000751415.1, accessed on 26 September 2022) to remove repeat sequences and fragments from mRNA degradation identified by mapping to exons or introns. The remnant reads were mapped to the miRBase database (http://www.mirbase.org/, accessed on 29 September 2022) to identify conserved miRNAs. All of the unannotated tags were compared to the reference genome to identify the novel miRNA candidates according to their genomic positions and hairpin structures using the software Mireap-V0.2 with default parameters (http://sourceforge.net/projects/mireap, accessed on 12 October 2022). Conserved miRNAs with letters x and y indicated that miRNAs are processed from the 5′ arm and 3′ arm of the miRNA precursor, respectively.

2.4. Differential Expression Analysis of miRNAs

To investigate the differentially expressed miRNAs in the samples from the three periods, the expression level of identified miRNAs was calculated, and the formula was as follows:
T P M = T × 10 6 N
where TPM is transcripts per million, T is the read number of miRNA, and N is the total number of miRNA reads.
Then, the analyses of differentially miRNA expression were carried out using edgeR packages, with p < 0.05, |log2 ratio multiples| ≥ 2 as the standard of miRNA differential expression [21].

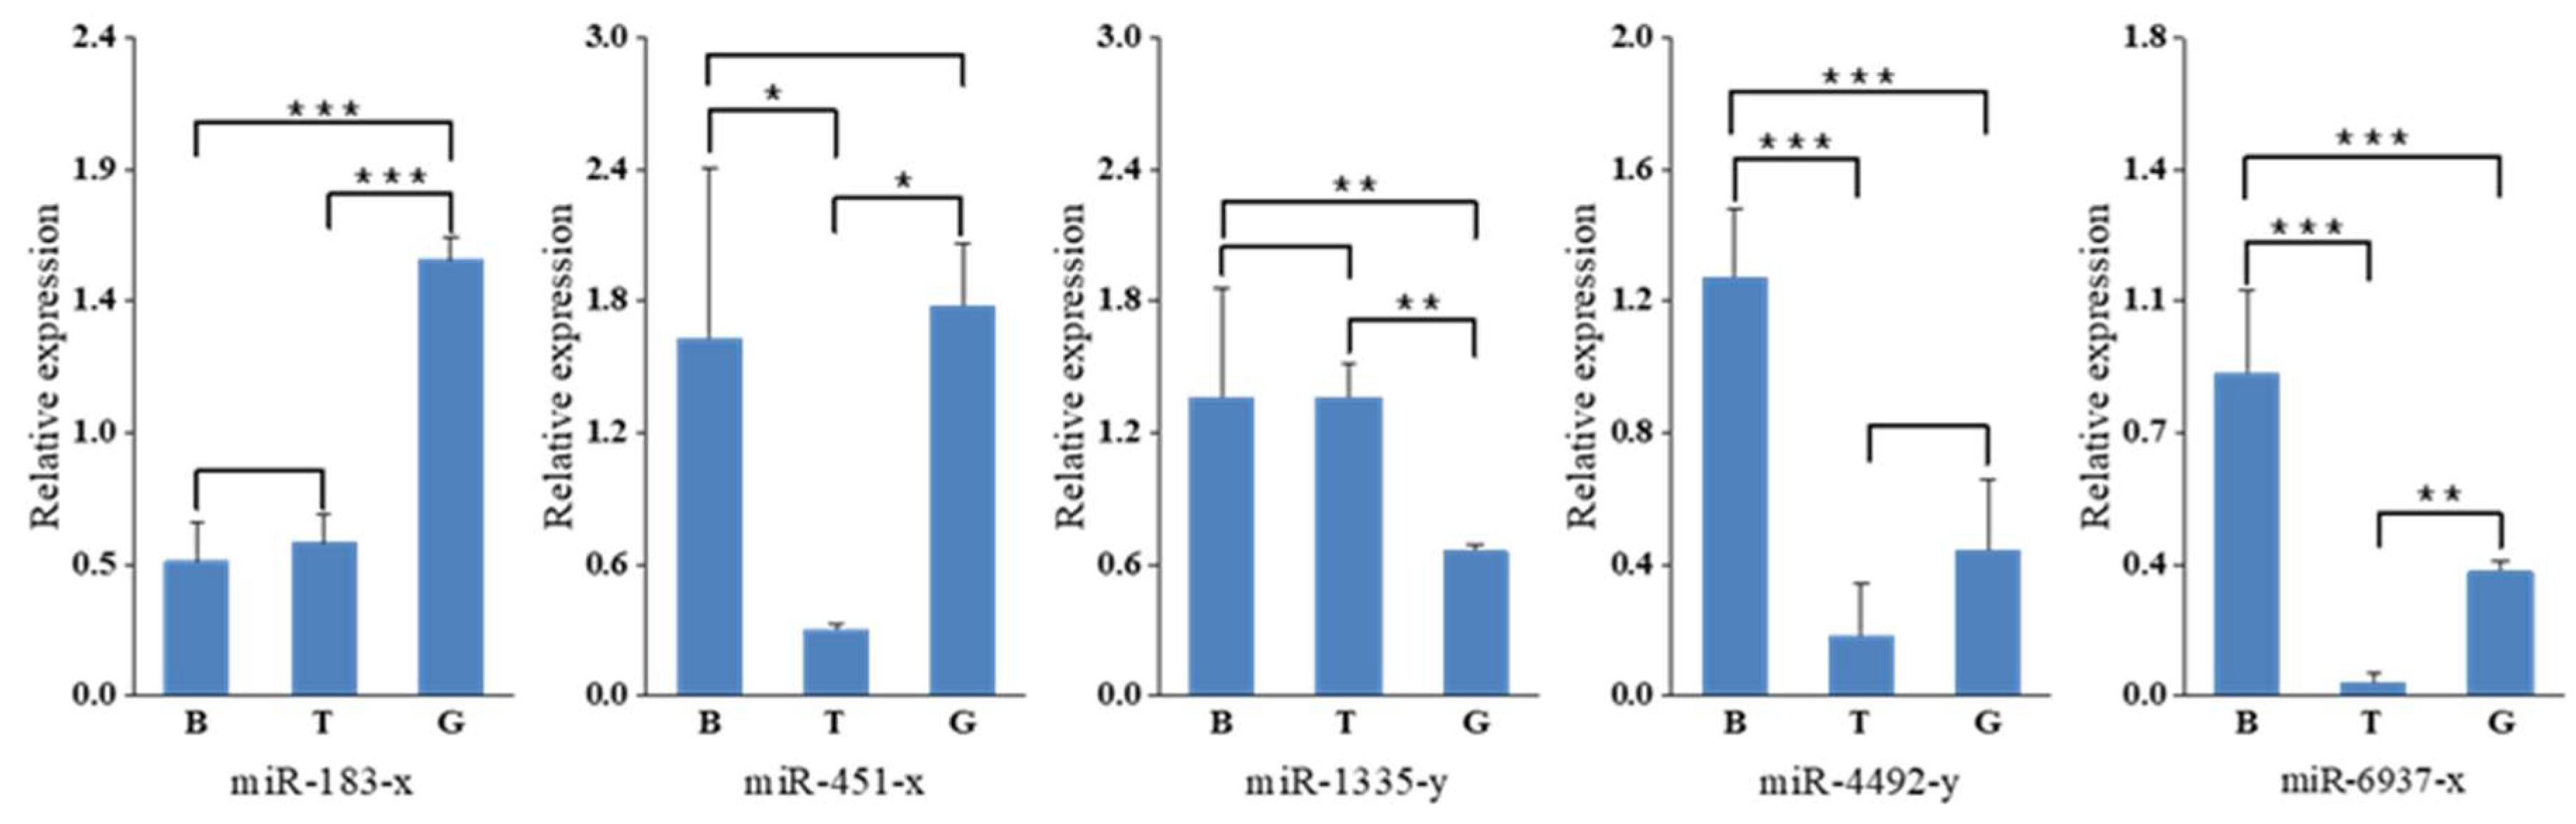
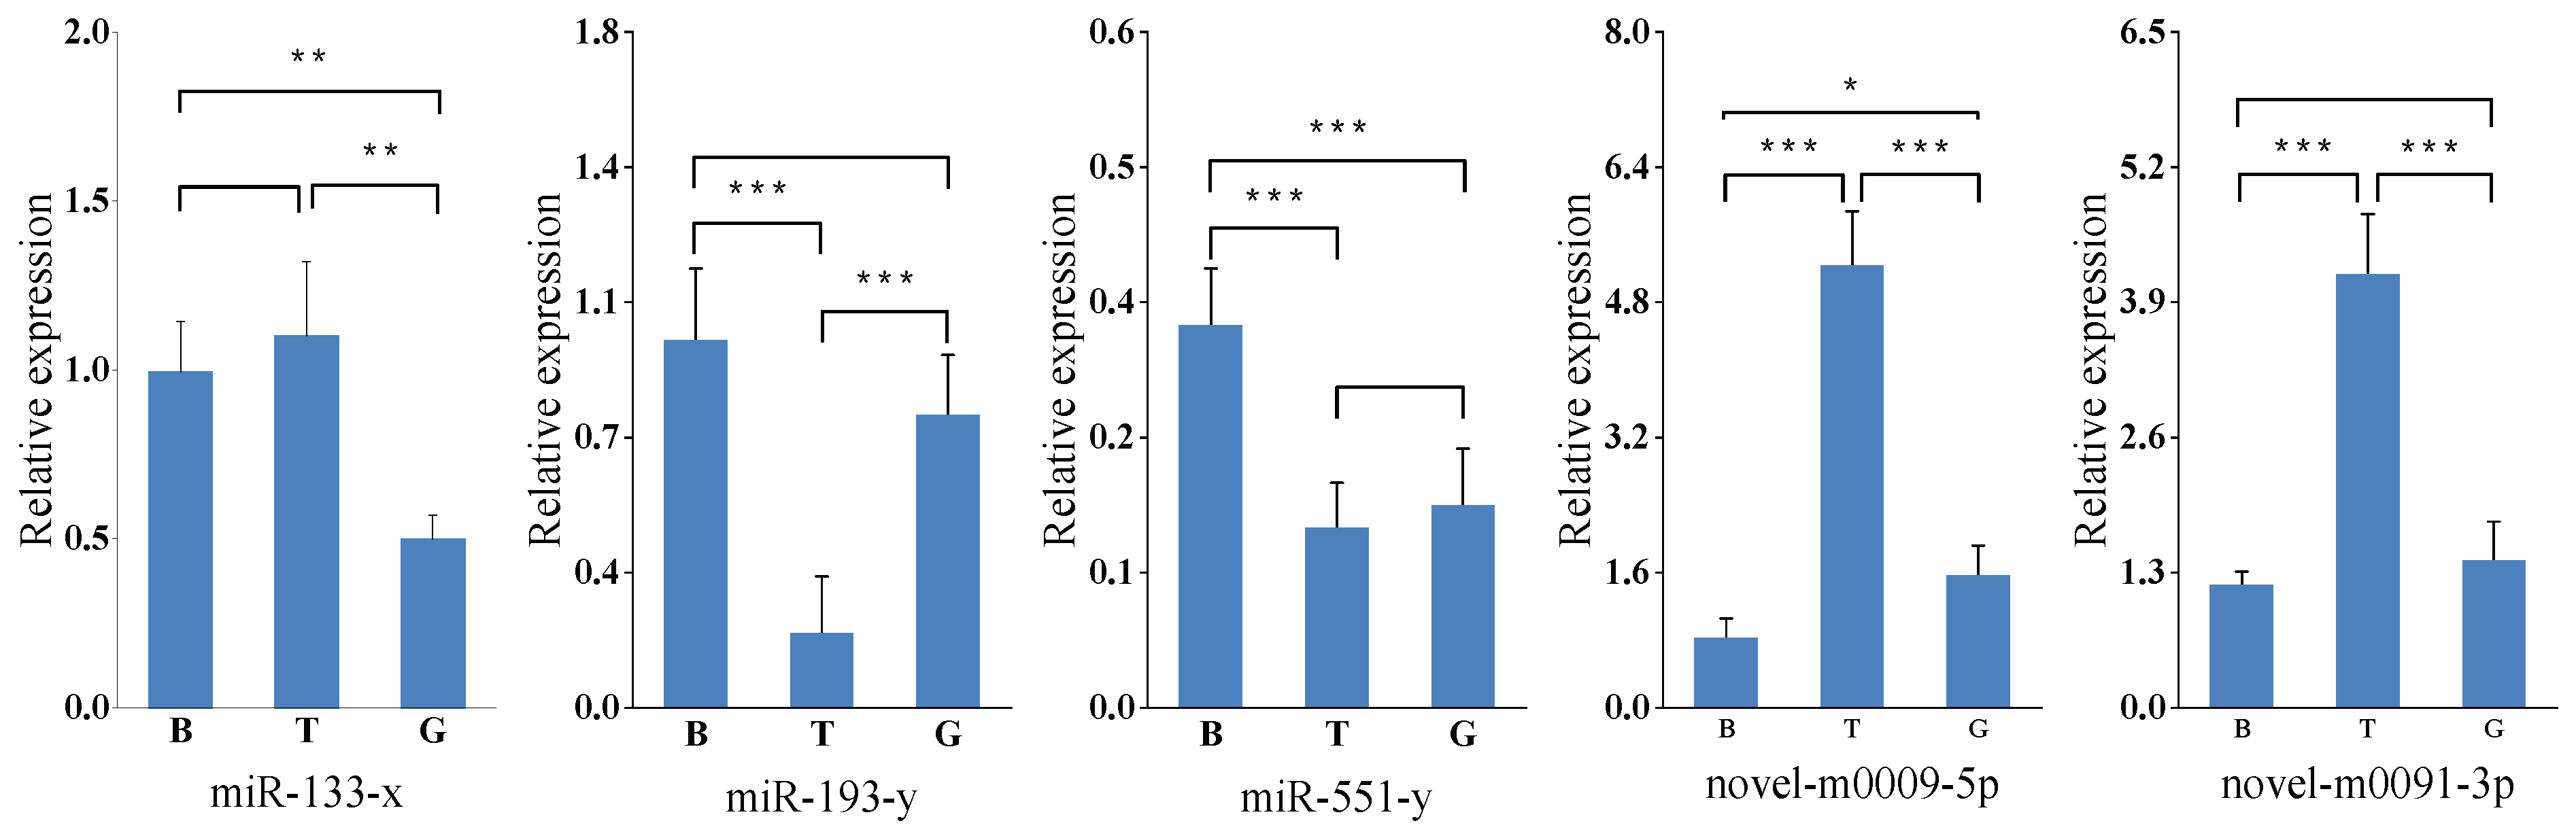
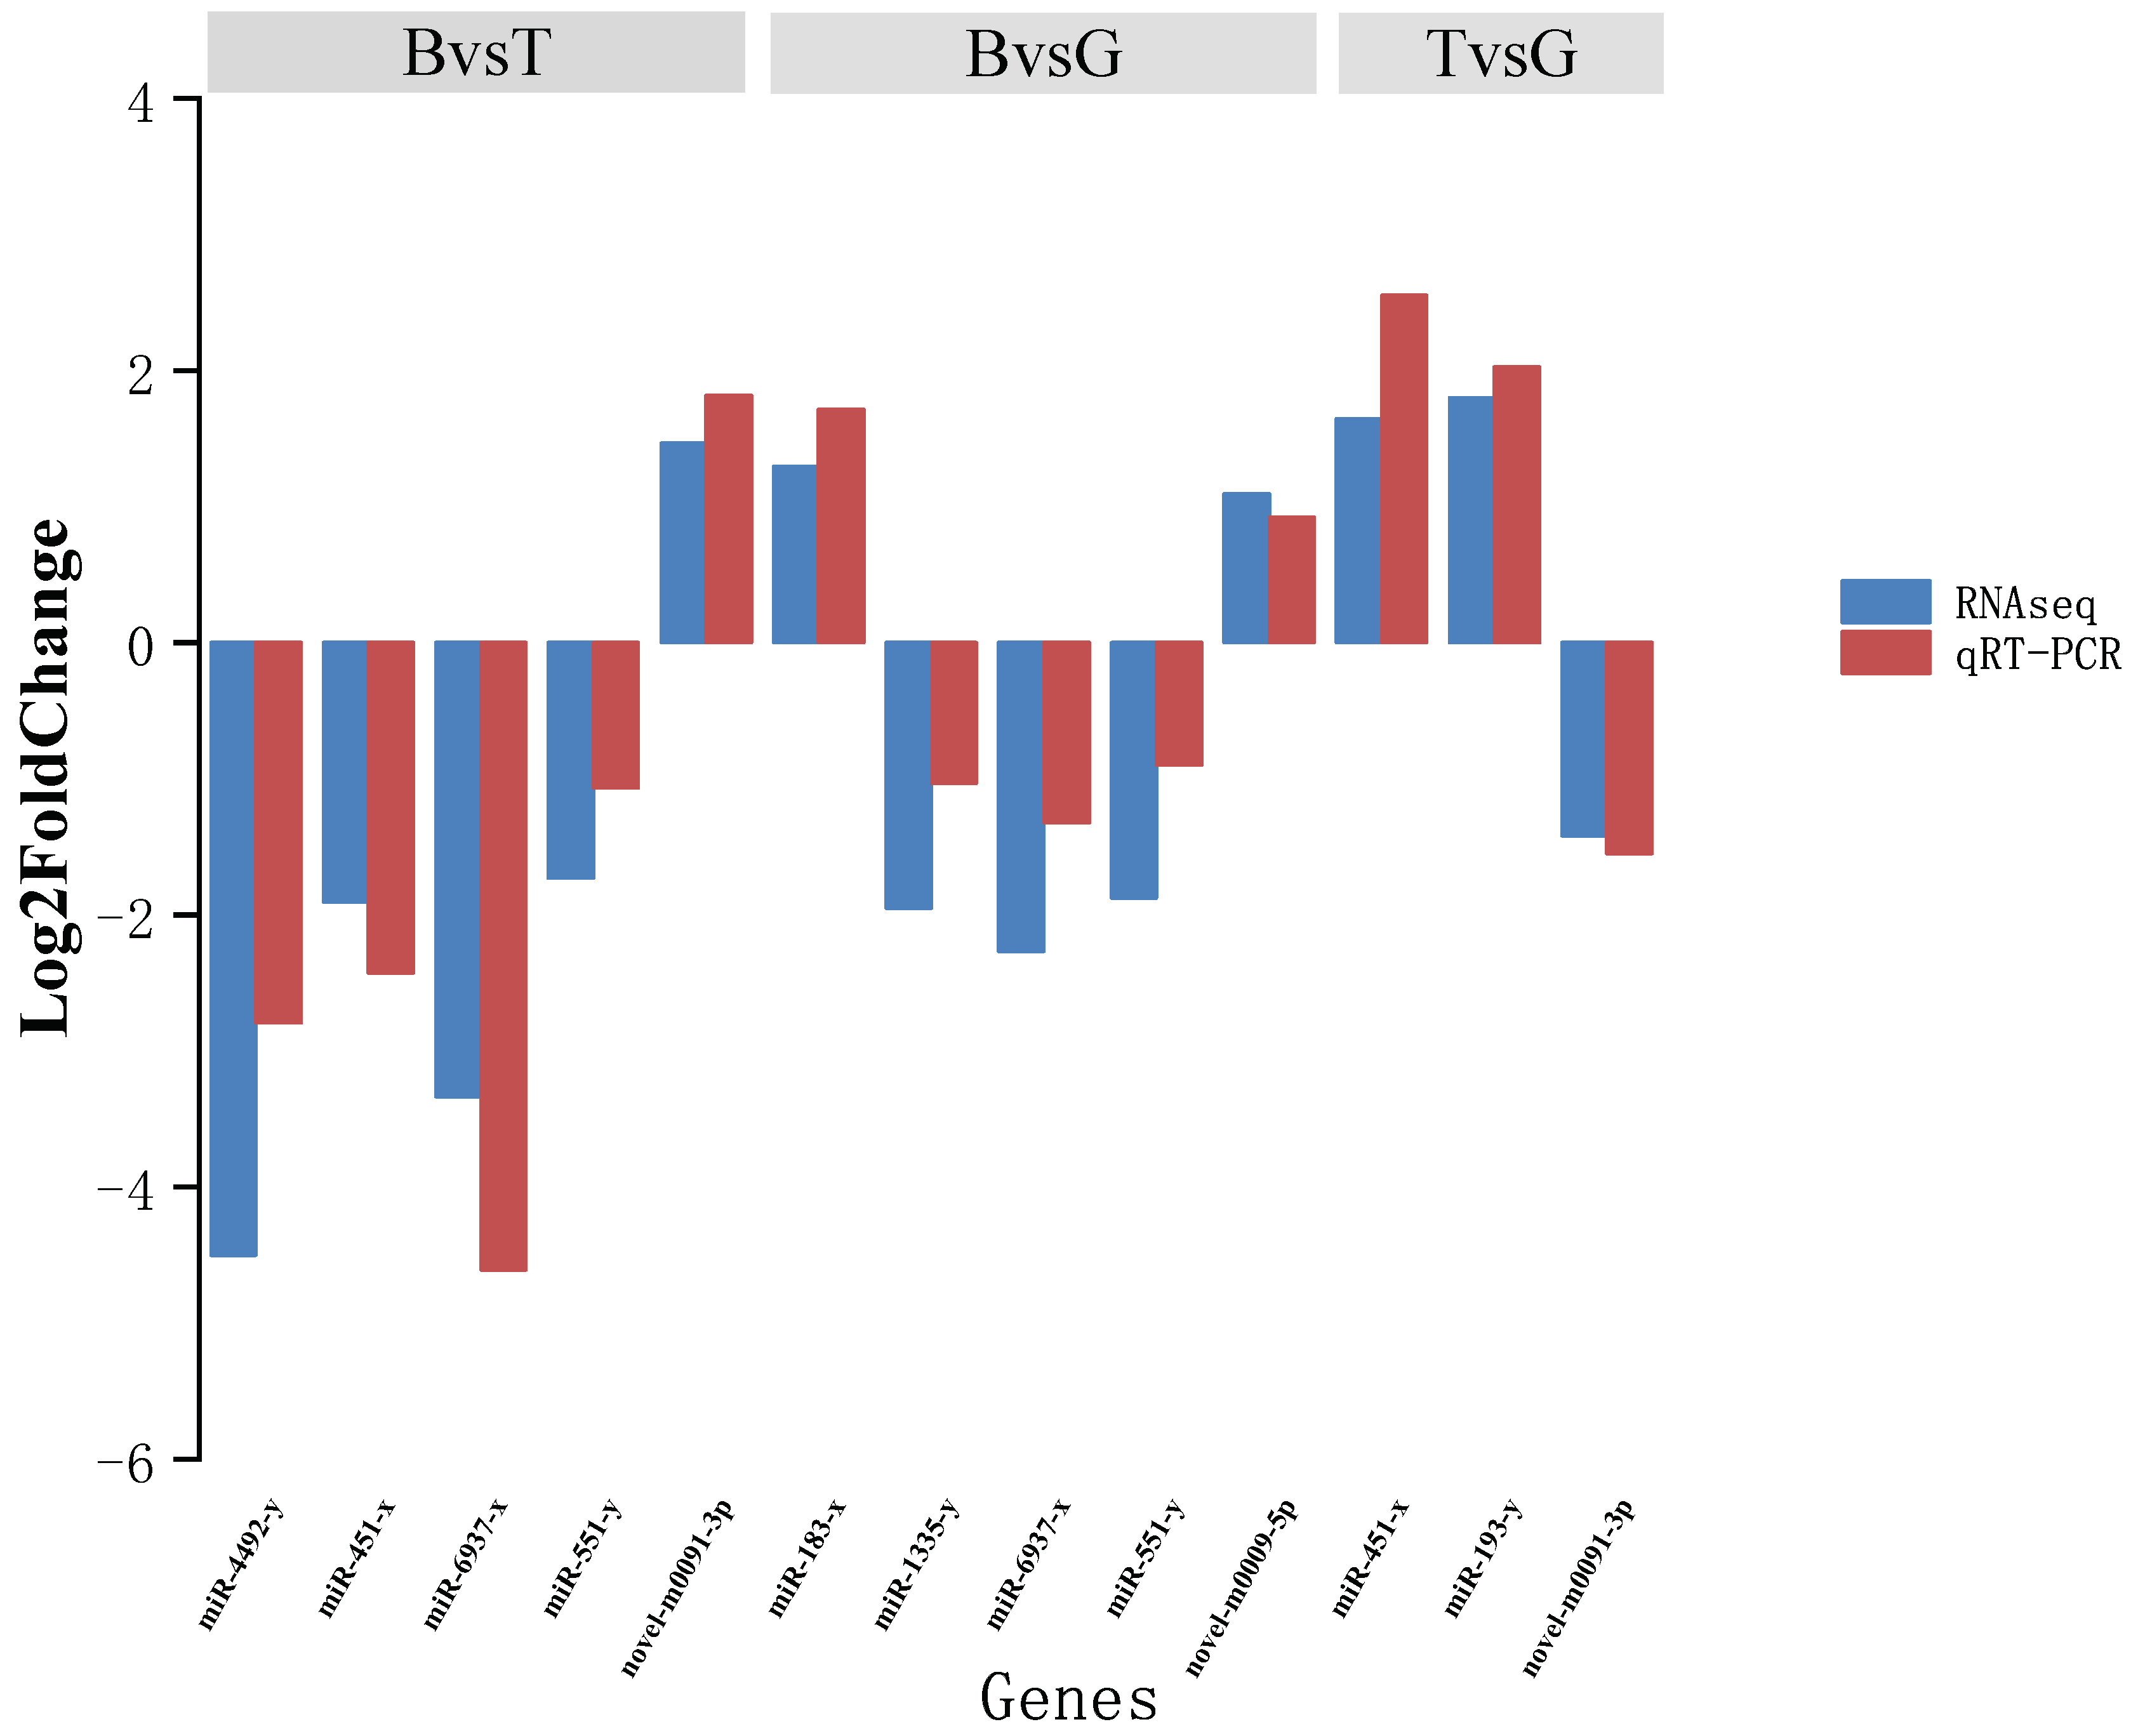
2.5. Validation of miRNA Expression by Stem-Loop qRT-PCR

Ten miRNAs, including eight known miRNAs and two novel miRNAs, with differential expression, were selected to verify the accuracy of deep sequencing using stem-loop RT-qPCR. DNase-treated RNA (1 μg) was reverse transcribed into cDNA by the tail addition method, and U6 snRNA was used as an internal reference. Universal reverse primer, along with forward primers in the stem-loop, were used because they provide more specificity and sensitivity than linear primers [35]. Primer sequences are shown in Table 1. qRT-PCR was performed by using a QuantStudio6 Flex Real-Time PCR Detection System (Applied Biosystems, Foster City, CA, USA).
Total RNA was extracted from nine Midas cichlids scale samples (3 B, 3 T, and 3 G). DNase-treated RNA (1 μg) was reverse-transcribed into cDNA with the tail addition method using the FastQuantity RT Kit (KR106 TIANGE). Real-time qPCR was performed by using the QuantStudio6 Flex Real-Time PCR Detection System. A 20 μL PCR reaction that included 10 μL qPCR master mix, 0.6 μL miRNA primers (Table 1), 0.6 μL universal primer, 6 μL cDNA, and 2.8 μL ddH2O was added in triplicate into 96-well plates. Amplification was performed with an initial denaturation at 95 °C for 15s, followed by 40 cycles of at 95 °C for 15 s and 65 °C for 30 s, and a final 70 cycles at 60 °C for 30 s. Melting curve analyses were performed following amplifications. All reactions were performed in triplicate for each sample. The relative expression of miRNAs was measured using the threshold Ct method and calculated using 2−△△Ct and U6 snRNA normalized mRNA expression. All primers for stem-loop qRT-PCR are listed in Table 1.

2.6. Target Gene Prediction and Functional Enrichment Analysis

Target gene prediction of miRNAs in the present study was performed by using the RNAhybrid [22], Miranda (v3.3a) [36], and TargetScan (Version: 7.0) [37] methods. The intersection of target gene prediction results obtained using the three methods was taken as the result of miRNA target gene prediction, followed by GO function analysis and KEGG Pathway analysis for these target genes.

3. Results

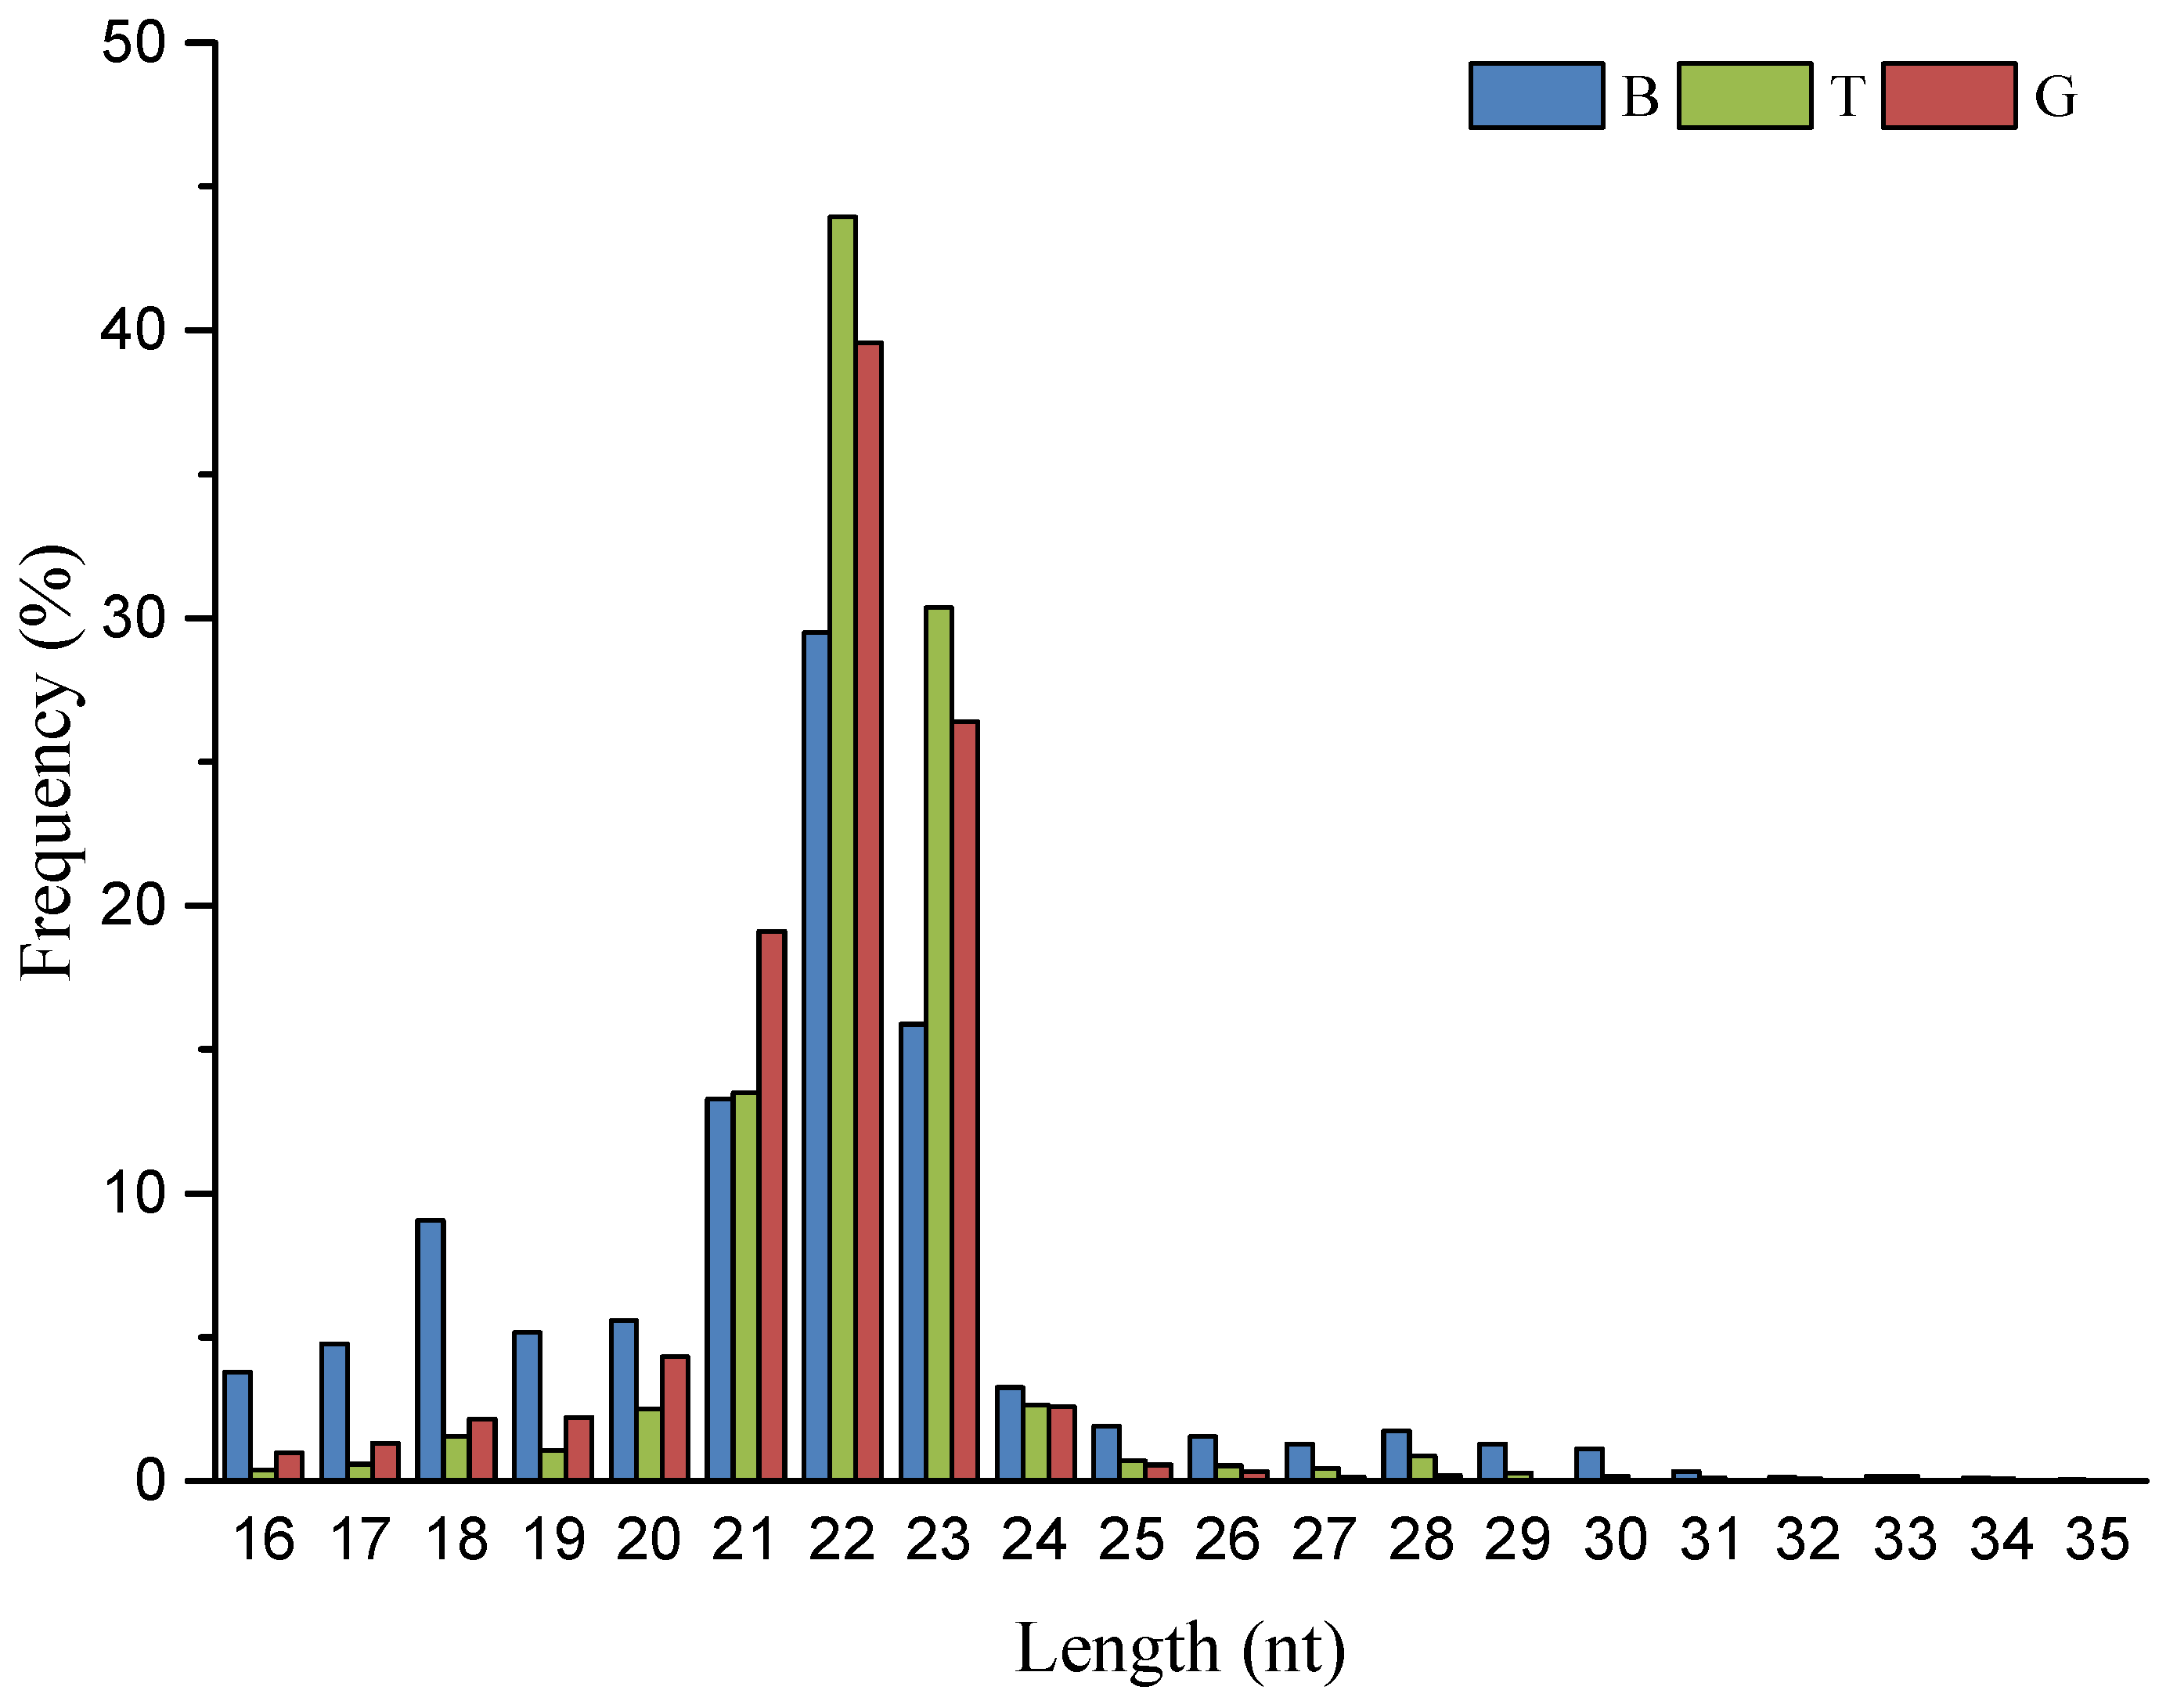
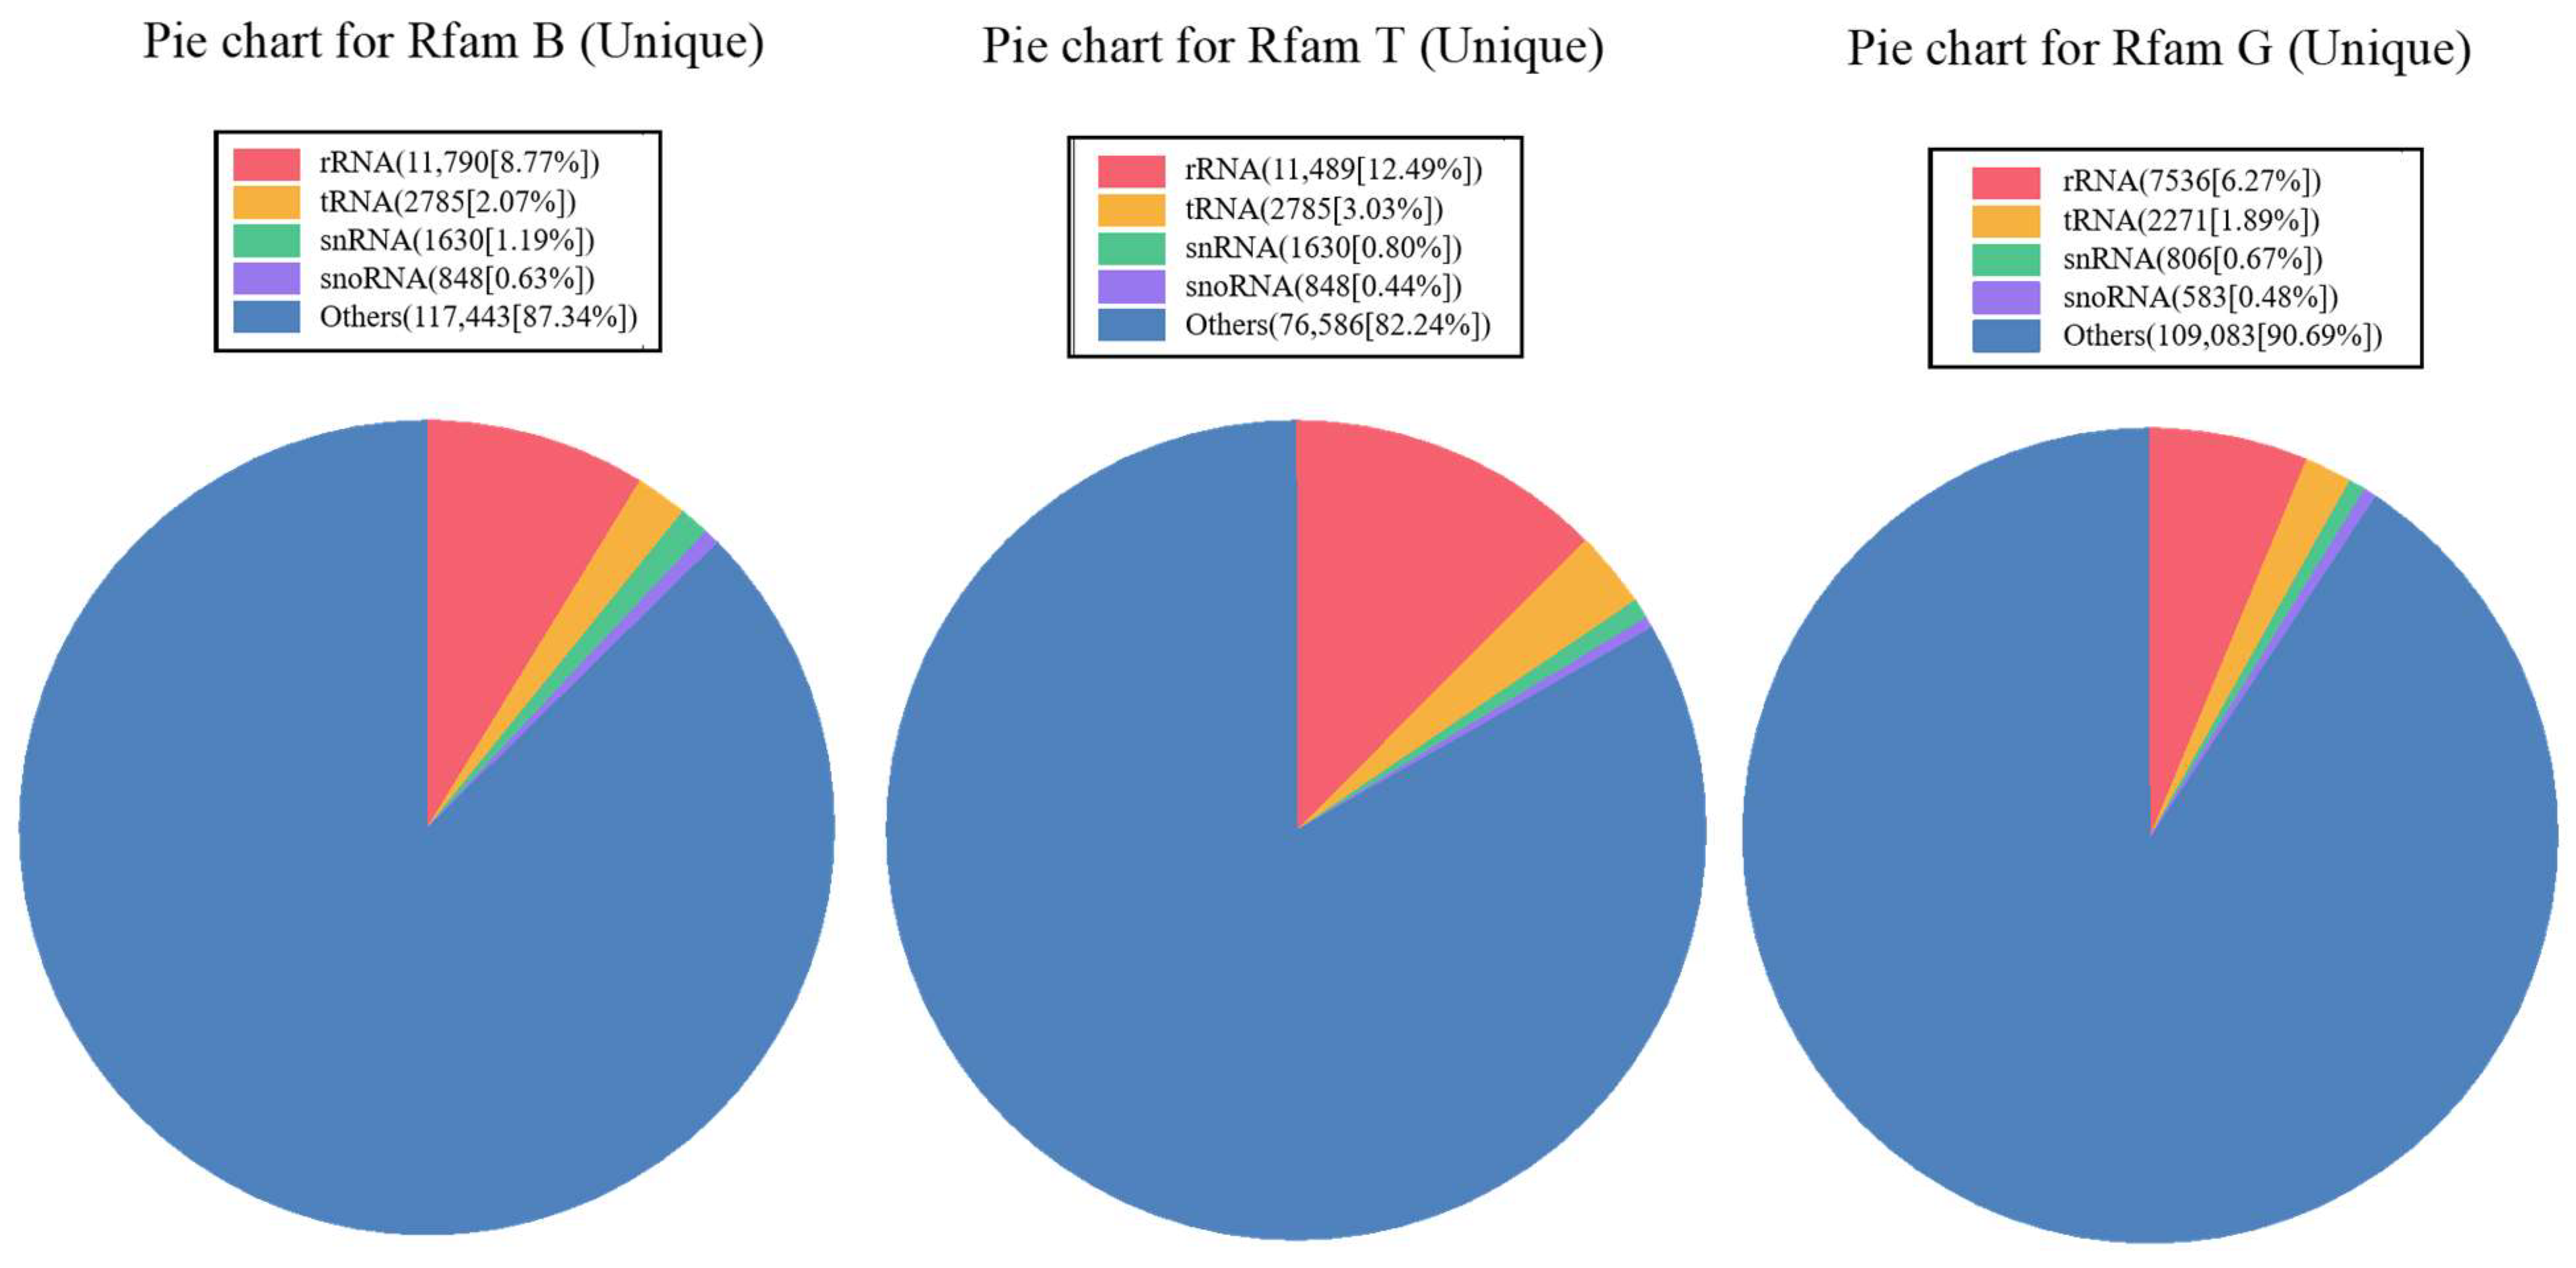
3.1. Small RNA Sequence Analysis

Nine small RNA libraries from A. citrinellus skin in distinct stages of color transformation were sequenced by using the Illumina HiSeqTM 2500. A total of 15,764,028, 16,435,309, and 19,766,435 raw reads were obtained from the B, T, and G stages, respectively. After filtering out the low-quality reads and removing adaptor sequences, 10,910,911 (70.68%), 15,463,079 (95.88%), and 17,184,005 (88.28%) clean reads were retrieved from the B, T, and G, respectively. The length distribution of sRNA read in Figure 2 shows the mode read length of 22 nucleotides. After aligning with small RNA sequence in the Rfam database, rRNA, tRNA, snRNA, and snoRNA were annotated and further analyzed in the subsequent step (Figure 3).
Potential rRNA, scRNA, snoRNA, snRNA, and tRNA in the samples were found and removed as much as possible by comparison with the Rfam database (Figure 3). The remaining sequences were compared with the miRBase database. Finally, 345, 281, and 362 known miRNAs were identified in the B, T, and G phases, respectively. Overall, 245 miRNAs were expressed in all three phases, while 55, 10, and 76 miRNAs were expressed specifically in the B, T, and G phases, respectively. These results suggest that some miRNAs expressed only at specific developmental stages play an important role in the regulation of post-transcriptional expression levels. The unannotated sequence revealed 279, 441, and 402 novel miRNAs using secondary structure prediction during the B, T, and G stages, respectively. Table 2 lists the 10 miRNAs with the highest expression levels in the three different periods.

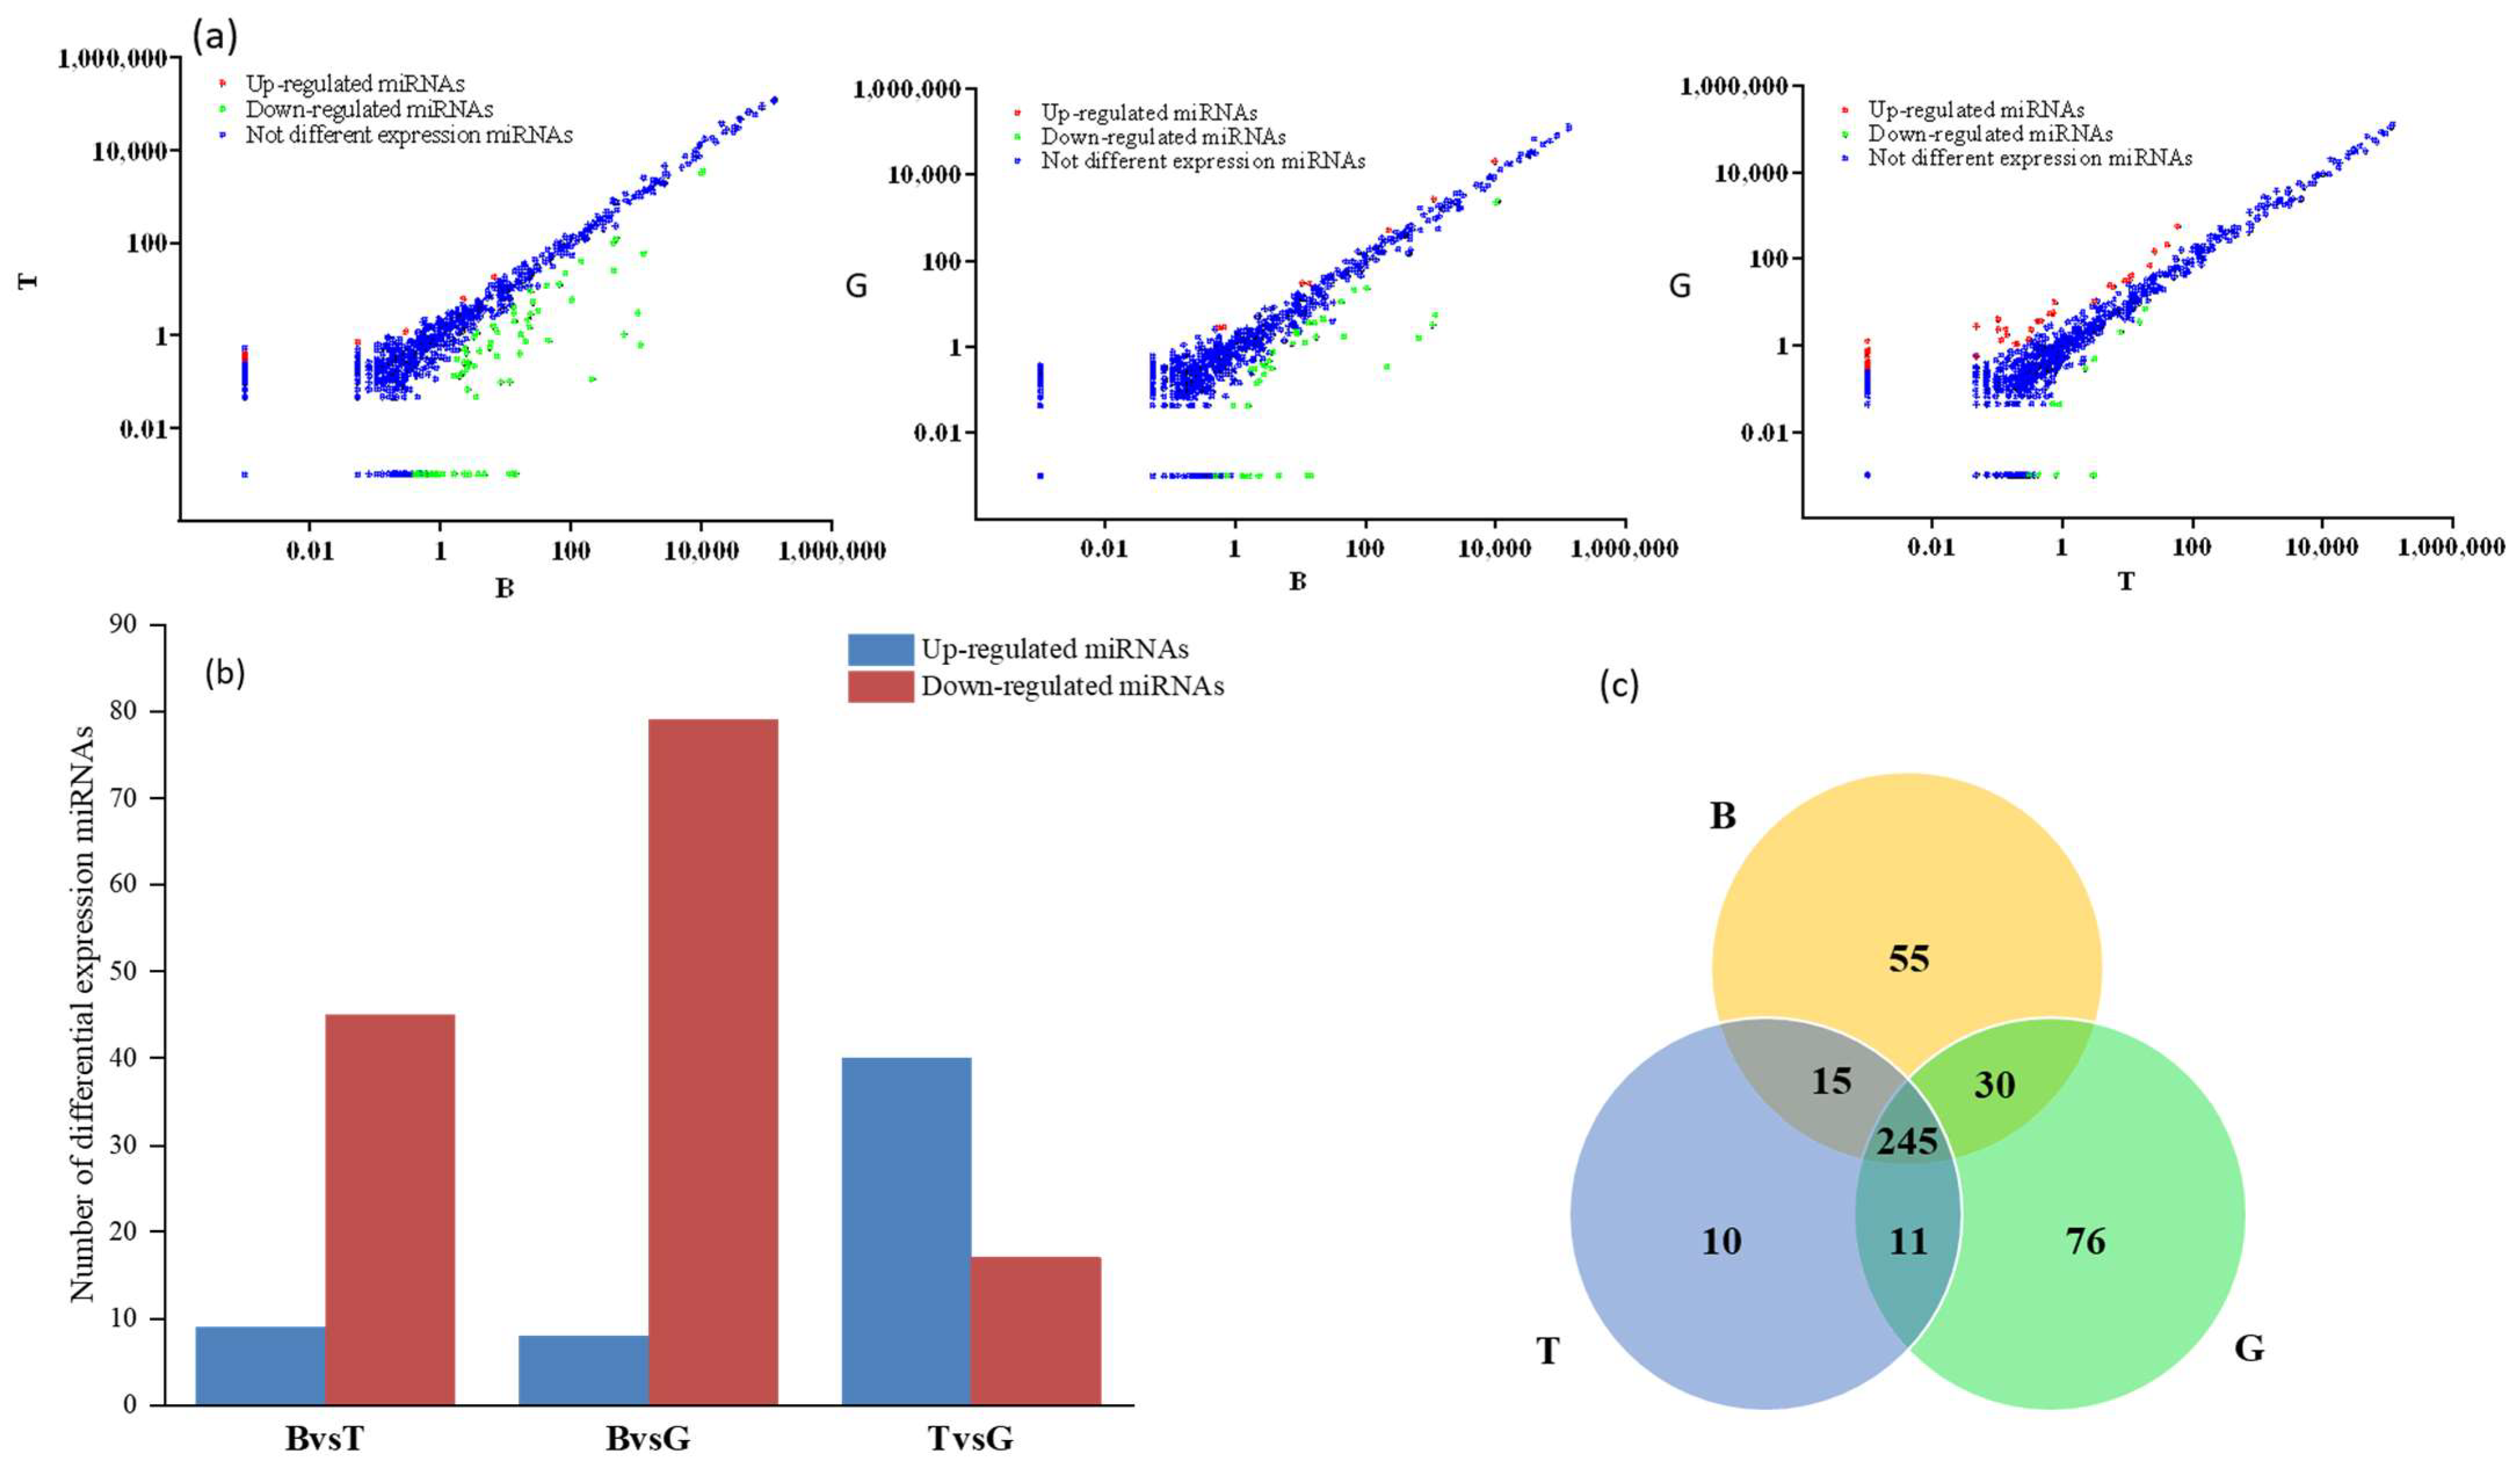
3.2. Analysis of miRNA Expression Trends and Differences

Compared with group B, 53 miRNAs were significantly differentially expressed in group G, including 8 miRNAs up-regulated and 45 miRNAs down-regulated, while 88 miRNAs were significantly differentially expressed in group T, including 9 miRNAs up-regulated and 79 miRNAs down-regulated (Figure 4). Among them, miR-133-y and miR-133-x in groups T and G were significantly down-regulated compared with group B (>13-fold change), and the expression of novel-m0045-5p was significantly down-regulated, while the expression of novel-m0091-3p and miR-1582-y was significantly up-regulated only in group T (Table 2).
Analysis of differential expression of miRNAs is an important means to study the spatial and temporal expression patterns of miRNAs related to their physiological significance. We randomly selected eight differentially expressed miRNAs that were already known (miR-4492-y, miR-183-x, miR-451-x, miR-1335-y, miR-6937-x, miR-133-x, miR-193-y, and miR-551-y) and two novel miRNAs with differential expression (novel-m0009-5P and novel-m0091-3p) for further study. Their expression patterns were verified using qRT-PCR, and the results showed that the qRT-PCR expression profile was consistent with those from RNA-sequencing (RNA-seq) analysis (Figure 5 and Figure 6), indicating that the RNA-seq analysis results were accurate and reliable.

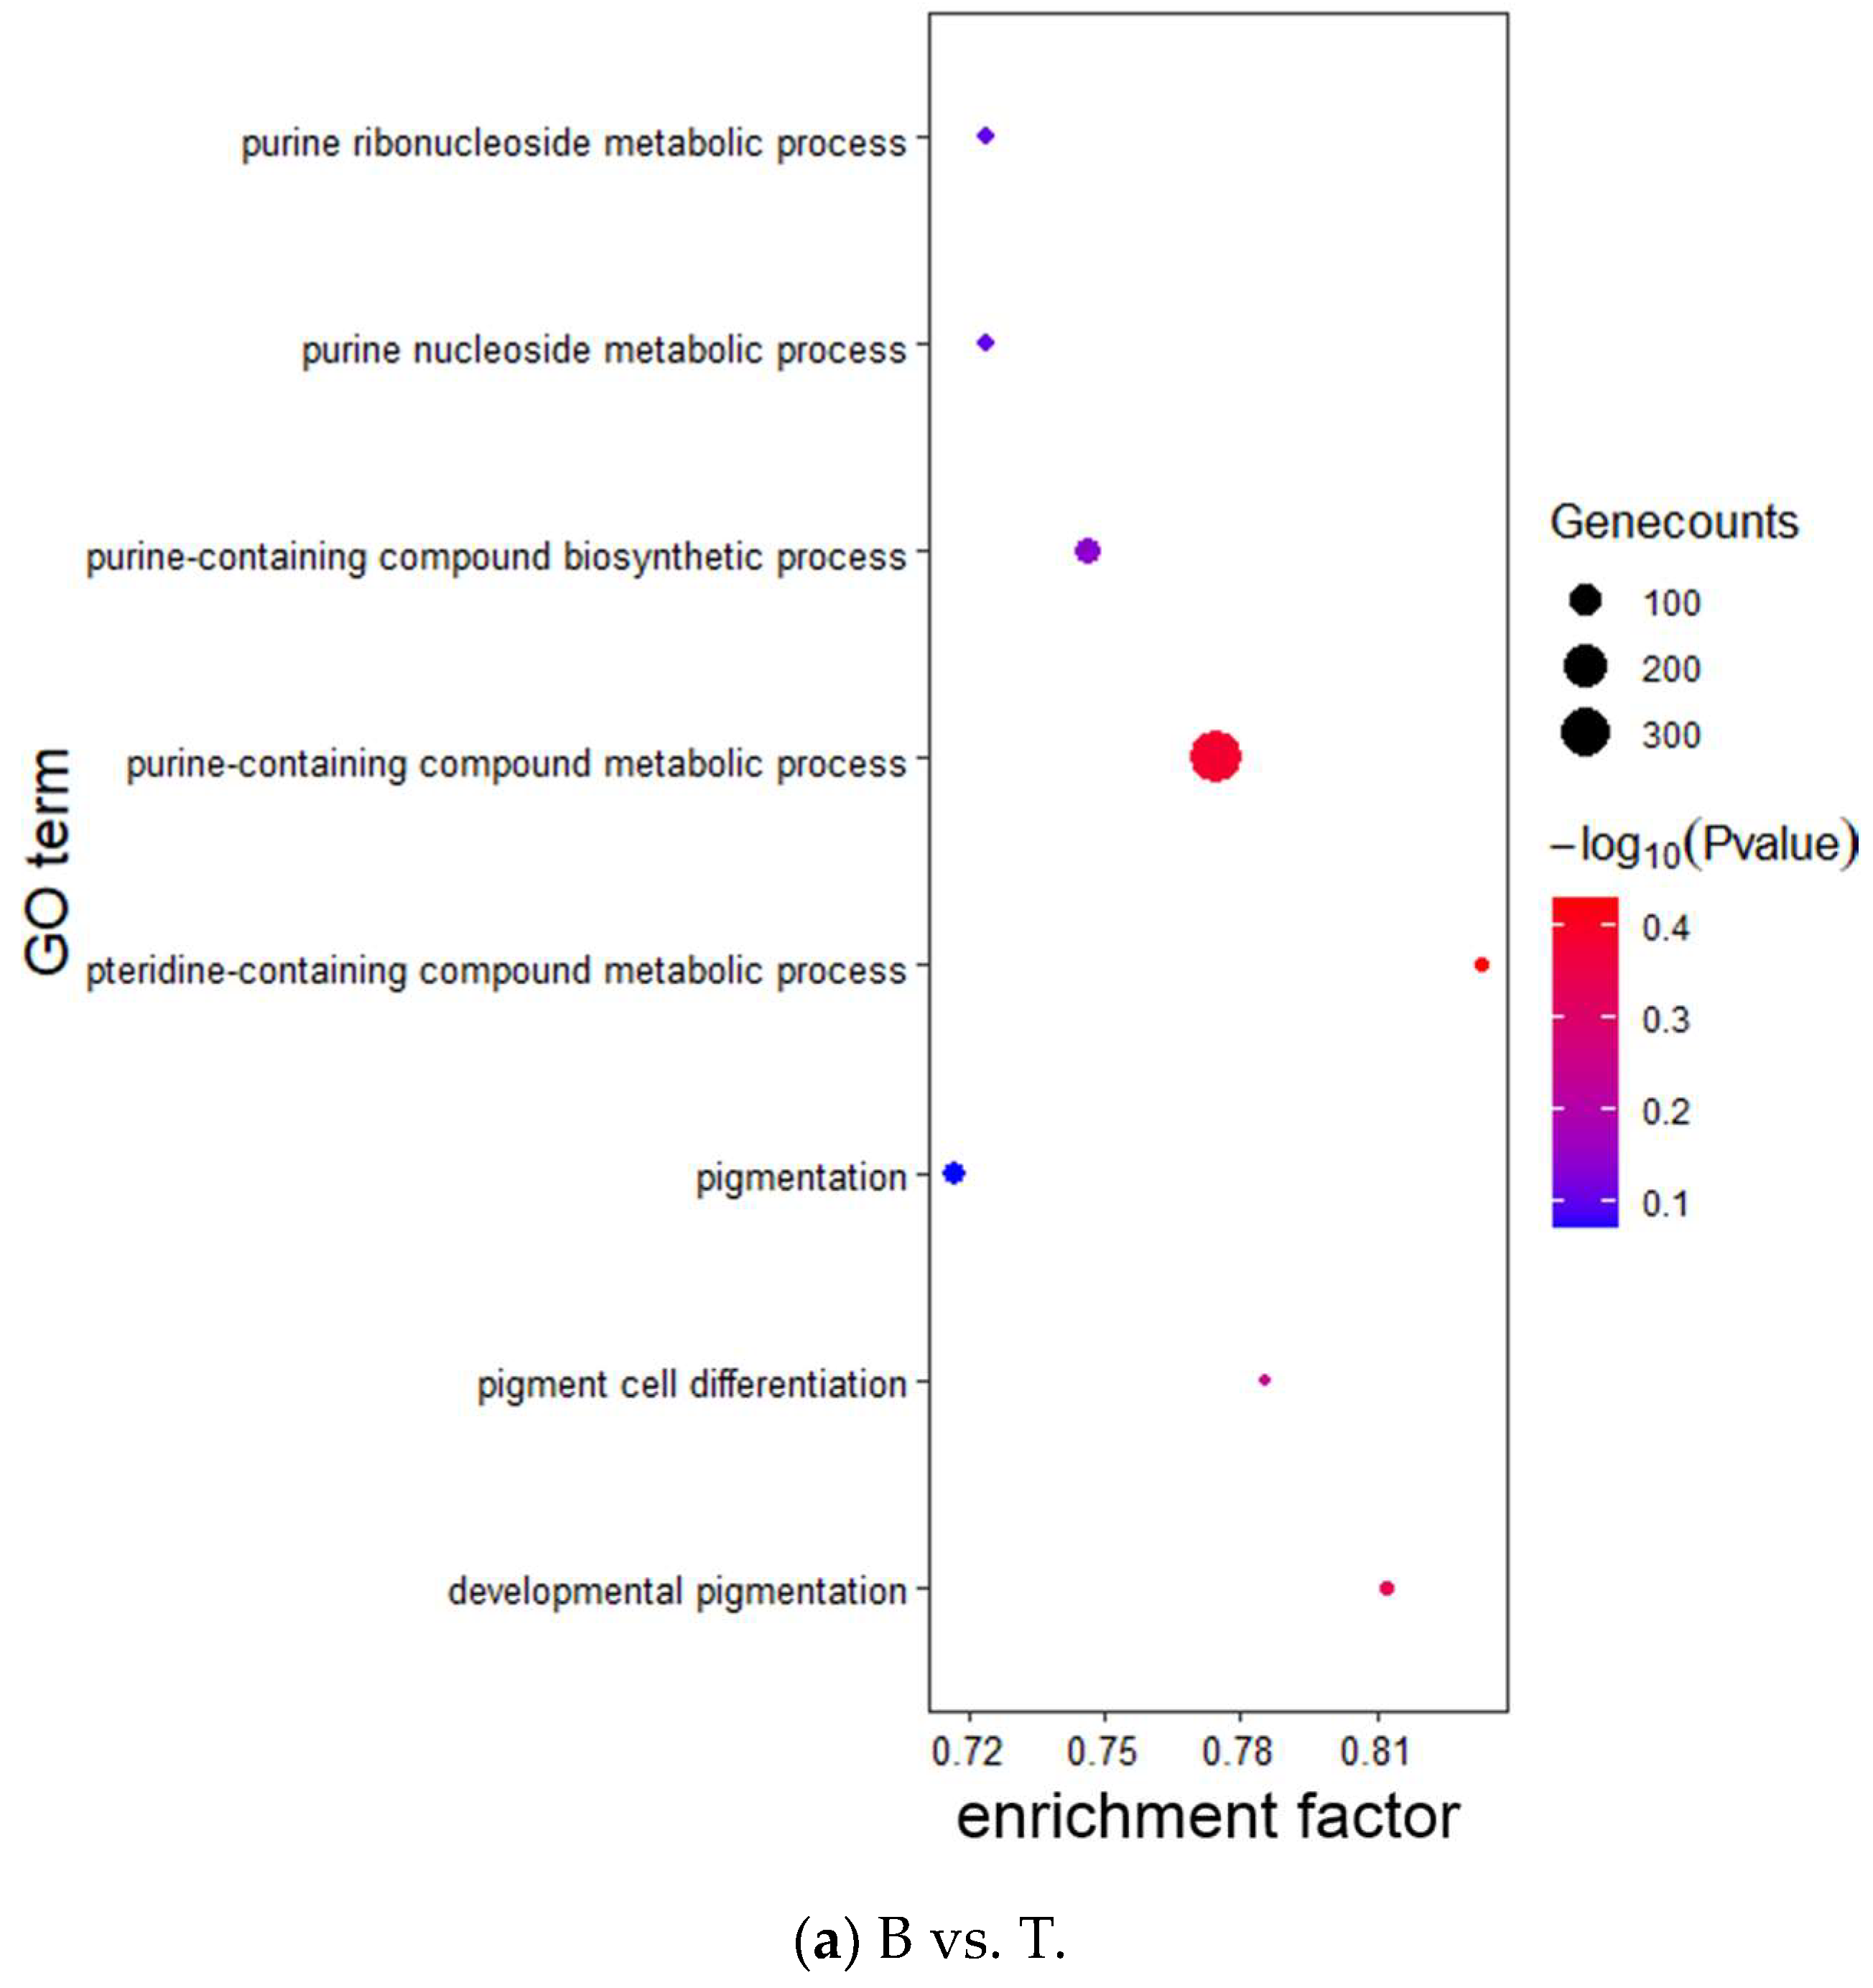
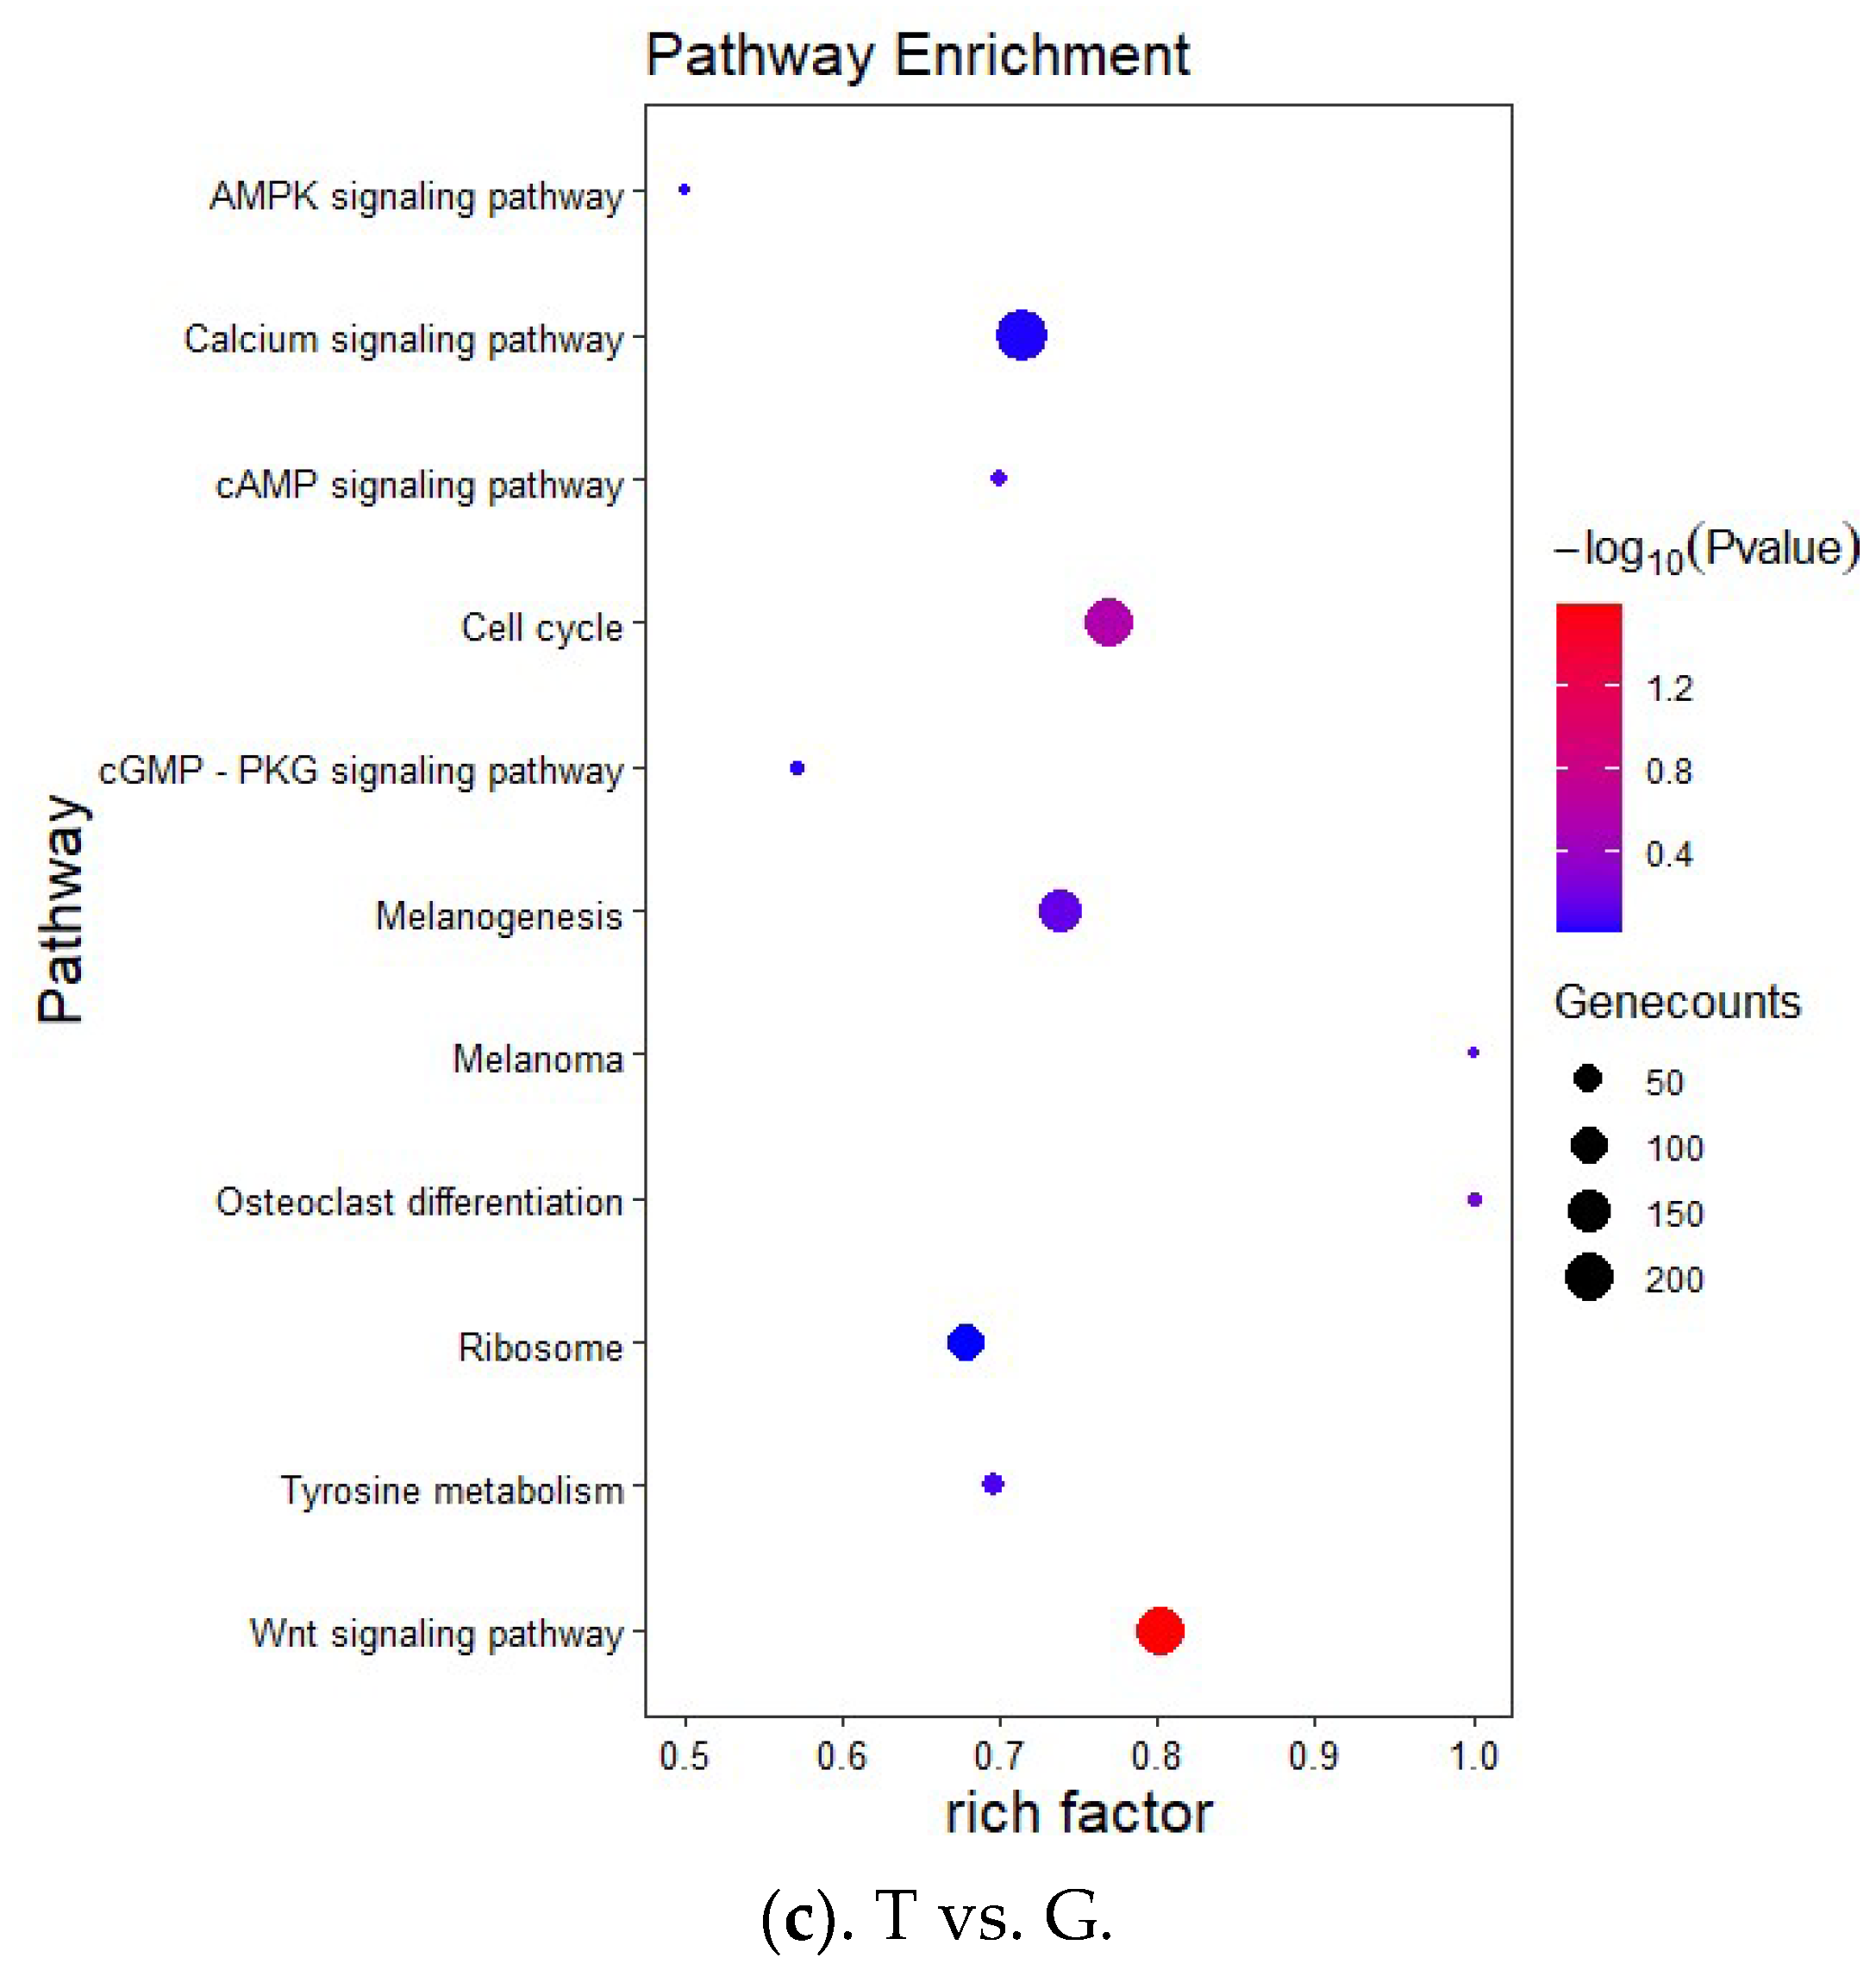
3.3. Target Prediction and Enrichment Analysis for miRNAs

RNAhybrid, miRanda, and Targetscan algorithms were used to predict target genes for the 1195 miRNAs identified, and 66,685 potential target genes were found (Figure 7). To predict the metabolic pathways of target genes of differentially expressed miRNAs in body-color fading of Midas cichlids, the predicted target genes were further annotated using GO enrichment and KEGG pathway analysis. GO enrichment analysis showed that 36,797 (B vs. G), 42,528 (B vs. T), and 38,133 (T vs. G) target genes were grouped into 20, 18, and 11 subclasses of biological processes, cellular components, and molecular functions, respectively (Figure 8).
KEGG pathway analysis showed annotations for 264, 279, and 278 pathways in B vs. G, B vs. T, and T vs. G groups, respectively, among which the melanin production pathway, mTOR signaling pathway, and Wnt (wingless-type MMTV integration site family) signaling pathway were related to body-color formation (Figure 9).

4. Discussion

Studies on the expression and potential functions of miRNA in evolutionarily diverse aquatic species are limited. The Midas cichlid is a popular ornamental fish with a typical body color fading phenomenon at the early stage of development [19]. It is an ideal biological model for studying the mechanism of early body color determination in fishes [32]. We explored the miRNA transcriptome in Midas cichlids scales using deep sequencing technology, and provided a foundation for functional studies on the relationship between miRNA expression and fish skin pigment development.
Using this sequencing approach, we obtained a large number of clean reads. The model sized 22 nt was in line with classical size of Dicer-cleaved products in vertebrates, which was consistent with the majority and is similar to other teleosts, such as hybrid snakehead (Channa maculate× C. argus ♂) [38], common carp (C. carpio) [39], and largemouth bass (Micropterus salmoides) [40].
The 10 miRNAs with the highest expression levels in the three different periods were listed in Table 1. Among these, MiR-199-x, miR-181, and miR-26a, which are related to immunity and disease regulation, showed high expression levels in all three periods without significant difference (p > 0.05). The miR-199a-5p can directly regulate the expression of Indian hedgehog (IHH) and reduce chondrocyte hypertrophy and matrix degradation via the IHH signal pathway in primary human chondrocytes [41], and is also involved in the regulation of melanoma cell metastasis-related genes [42]. The miR-181a/b inhibits expression of genes involved in synaptic transmission, neurite outgrowth, and mitochondrial respiration [43]. The miR-26a is regulated in various malignant tumors and may be involved in the genesis and development of tumors [44]. In addition, the high expression of miR-200, miR-199, and miR-25 in the three periods were all associated with body-color regulation in previous reports. Yi et al. [45] reported that the miR-200 family is expressed in the epidermis of mice, while the miR-199 family is greatly expressed in hair follicles, demonstrating the tissue expression specificity of miRNAs during skin development. MiR-25, ad a key regulatory miRNA of mitf, participates in the body-color differentiation of white and brown alpaca and plays a key role in melanocyte development, survival, and differentiation [46]. Due to the evolutionary conservation of miRNA, we infer that miR-200, miR-199, and miR-25 are also involved in regulating skin pigmentation during body-color fading in Midas cichlid.
Target gene prediction analysis revealed that the target genes corresponding to miR-183-x were SRY box 10 (sox10) and mitf, while the target genes corresponding to miR-133-x included mitf, kit, and paired-box 3 (pax3). Furthermore, sox10 was found to be a common target gene of miR-183-x, miR-4492-y, and miR-193-y (Figure 7), whereas mitf was a common target gene of miR-133-x and miR-183-x (Figure 7), thus reflecting the complexity of the regulatory network between miRNAs and their target genes. The miR-1 has been reported to co-regulates the target gene histone deacetylase 4 (HDAC4) with miR-133a, which is involved in muscle development regulation [47]. MiR-183 plays a regulatory role in many human cancers, including colorectal, melanoma, prostate, and breast cancer, as well as osteoporosis [48,49,50,51,52]. However, in this study, many target genes corresponding to miR-183-x and miR-133, such as mitf, tyr, tyrp1, agouti-signaling protein (asip), melanocortin 1 receptor (mc1r), transcription factor sox10, and pax3 are all directly or indirectly involved in the regulation of melanin synthesis [53,54,55,56,57]. Henning et al. [32] conducted a transcriptome analysis of Midas cichlids in three distinct stages of color transformation and identified the differentially expressed genes related to melanosome composition and differentiation, such as tyr, tyrp1, and slc24a5. These genes were down-regulated in the melanin synthesis pathway during body-color transformation. Previous studies have shown that the mitf, mc1r, and tyr showed significant expression during the morphological color change of Amphilophus citrinellus [3,5,56]. We suggest that miR-133-x and miR-183-x may be involved in the regulation of dark pigment cells during ontogeny. Previous studies have reported that miR-196a and miR-206 play a regulatory role in koi skin pigmentation by targeting the mitf and mc1r genes, respectively [27,58]. Yan et al. [59] found that miR-429 targets foxd3 silencing in the common carp, thereby affecting the expression of mitf and its downstream genes including tyr, tyrp1, and tyrp2 to regulate skin pigmentation. However, no similar targeting relationship was found in Midas cichlids compared to koi carp, suggesting potential species differences in the miRNAs regulating body color.
It has been reported that the gene goldentouch harboring the transposon insertion determines the gold polymorphism and the 8.2 kb insertion located within an intron of goldentouch determines the dark/gold polymorphism; however, goldentouch expression does not differently change during the ontogeny of gold Midas cichlids [33]. Therefore, it is necessary to investigate the relationship between miRNAs and the gene goldentouch. To screen for the target miRNAs, all identified miRNAs were mapped to the goldentouch 3′ UTR (we selected 2 kb sequence after the goldentouch coding sequence from genome as its 3′ UTR). A total of ten most like miRNAs were predicted; however, these miRNAs were not shown to be significantly differently expressed during ontogeny, which is consistent with goldentouch gene expression (Figure 5). We suggest that differently expressed miRNAs are mainly involved in melanin synthesis regulation during the ontogeny of gold Midas cichlids by regulating pigmentation-related target genes.
Although the target-gene function of B vs. G, B vs. T, and T vs. G groups have some divergence in the GO-enriched functional classification, the cellular processes subcategory has the largest number of genes in biological processes among the three groups. In cell components, the number of genes in cell and cell parts projected the largest number of genes, while in molecular functions, the largest number of genes was the subclass binding. In addition, there were eight Go terms related to body-color formation, including pigmentation, pigment cell differentiation, and developmental pigmentation process (Figure 8). KEGG pathway analysis can help to understand the interaction between target genes in specific biological functions and suggest the systematic behavior of organisms through genome or transcriptomic contents [60]. In KEGG enrichment analysis, the three groups of target genes were enriched in pathways related to body-color retention, such as the melanin production pathway, Wnt signaling pathway, etc. pax3 and sox10 in the Wnt signaling pathway regulate tyr by regulating the expression of mitf, thus affecting pigment formation [54]. In human melanocytes, pax3 and sox10 jointly induce melanocyte differentiation and melanin production [61]. These studies suggest that some differentially expressed miRNAs may be involved in skin pigmentation dynamic during the body color fading process of Midas cichlids by regulating pigmentation-related pathways through target genes.

5. Conclusions

In the present study, the miRNA libraries of Midas cichlid scales at three distinct stages of body-color transformation (black, transition, and gold periods, represented as B, T, and G) were constructed using high-throughput sequencing analysis. Overall, 345, 281, and 362 known miRNAs and 279, 441, and 402 novel miRNAs were obtained from the B, T, and G phase groups, respectively. In addition, differentially expressed miRNAs in the three groups (B vs. G, B vs. T, and T vs. G) were analyzed, and 10 miRNAs were verified using qRT-PCR, validating the reliability of sequencing results. The differential expression of miRNAs in different periods also preliminarily presented the time-specific expression pattern of miRNAs. Subsequently, prediction of target genes of differentially expressed miRNAs and enrichment analysis of GO and KEGG pathways further clarified that miRNAs may be involved in skin pigmentation regulation during morphological color change by regulating expression of target genes. For example, miR-133-x is likely to regulate several key genes related to body color, such as mitf, kit, and pax3, and miR-183-x may regulate mitf and sox10, which needs further verification. Overall, the result provide important information resources for the miRNA transcriptome of three distinct color stages of the Midas cichlids scale, which can help in further studies on the miRNA regulation mechanism of morphological color change.

Author Contributions

G.W.: investigation, visualization, writing—original draft; H.S.: supervision, conceptualization, methodology, writing—review and editing; Y.L.: writing—review and editing; X.M.: supervision; C.L.: supervision, X.W.; resources, Y.Y.; data curation. All authors have read and agreed to the published version of the manuscript.

Funding

This research was supported by the National Freshwater Genetic Resource Center (no. FGRC18537), the Guangzhou Science and Technology Planning Project (202002030047), the Basic and Applied Basic Research Foundation of Guangdong Province (2020A1515010304), and the National Natural Science Foundation of China (802037).

Institutional Review Board Statement

All fish experiments in the present study were approved by the Pearl River Fisheries Research Institute and the Chinese Academy of Fishery Sciences under contract, and the experimental process complied with protocols of international guidelines for the ethical use of animals in research (Approval Code: LAEC-PRFRI-2023-05-04; Approval Date: 22 May 2023).

Informed Consent Statement

Not applicable.

Data Availability Statement

All data generated or analyzed during this study are included in this published article. The datasets generated for this study can be found in the CNCB-NGDS Genome Sequence Archive (GSA) database under GSA accession number CRA006100 (https://bigd.big.ac.cn/gsa/browse/CRA006100, accessed on 11 November 2022). The reference genome for this study is the Amphilophus citrinellus genome (https://www.ncbi.nlm.nih.gov/assembly/GCA_000751415.1, accessed on 11 February 2023).

Conflicts of Interest

The authors declare that they have no known competing financial interests or personal relationships that could have influenced the work reported in this paper.

References

  1. Zhang, G.; Tang, L.; Huang, J.; Wang, Y.; Wang, H.; Fan, Y.; Yuan, X.; Liu, W.; Peng, L.; Liu, J.; et al. Formation of asymmetric body color in the caudal fin of common carp (Cyprinus carpio). Aquaculture 2023, 577, 739970. [Google Scholar] [CrossRef]
  2. Marcoli, R.; Jones, D.B.; Massault, C.; Marc, A.F.; Moran, M.; Harrison, P.J.; Cate, H.S.; Lopata, A.L.; Jerry, D.R. The skin structure in multiple color variants of barramundi (Lates calcarifer): A histological, immunohistochemical and ultrastructural overview. Aquaculture 2023, 576, 739859. [Google Scholar] [CrossRef]
  3. Chen, X.; Wu, G.; Song, H.; Wang, X.; Mou, X.; Liu, Y.; Liu, C.; Hu, Y. Expression analysis of mitf gene relating to body color variation in Amphilophus citrinellus. Prog. Fish. Sci. 2021, 42, 107–118. [Google Scholar]
  4. Ahi, E.P.; Lecaudey, L.A.; Ziegelbecker, A.; Steiner, O.; Glabonjat, R.; Goessler, W.; Hois, V.; Wagner, C.; Lass, A.; Sefc, K.M. Comparative transcriptomics reveals candidate carotenoid color genes in an East African cichlid fish. BMC Genom. 2020, 21, 54. [Google Scholar] [CrossRef]
  5. Jiang, Y.; Song, H.; Liu, Y.; Wei, M.; Wang, X.; Hu, Y.; Luo, J. Cloning and expression analysis of the developing sequence and tissue expression of TYR gene in Amphilophus citrinellus. J. Agric. Biotechnol. 2016, 24, 697–707. [Google Scholar]
  6. Andrade, P.; Pinho, C.; Pérez I De Lanuza, G.; Afonso, S.; Brejcha, J.; Rubin, C.; Wallerman, O.; Pereira, P.; Sabatino, S.J.; Bellati, A.; et al. Regulatory changes in pterin and carotenoid genes underlie balanced color polymorphisms in the wall lizard. Proc. Natl. Acad. Sci. USA 2019, 116, 5633–5642. [Google Scholar] [CrossRef] [PubMed]
  7. Inaba, M.; Yamanaka, H.; Kondo, S. Pigment pattern formation by contact-dependent depolarization. Science 2012, 335, 677. [Google Scholar] [CrossRef] [PubMed]
  8. Volkening, A.; Sandstede, B. Iridophores as a source of robustness in zebrafish stripes and variability in Danio patterns. NAT Commun. 2018, 9, 3231. [Google Scholar] [CrossRef]
  9. Huang, Y.; Luo, Y.; Liu, J.; Gui, S.; Wang, M.; Liu, W.; Peng, L.; Xiao, Y. A light-colored region of caudal fin: A niche of melanocyte progenitors in crucian carp (Cyprinus carpio L.). Cell Biol. Int. 2017, 41, 42–50. [Google Scholar] [CrossRef]
  10. Cal, L.; Suarez-Bregua, P.; Cerdá-Reverter, J.M.; Braasch, I.; Rotllant, J. Fish pigmentation and the melanocortin system. Comp. Biochem. Physiol. Part A Mol. Integr. Physiol. 2017, 211, 26–33. [Google Scholar] [CrossRef]
  11. Kautt, A.F.; Kratochwil, C.F.; Nater, A.; Machado-Schiaffino, G.; Olave, M.; Henning, F.; Torres-Dowdall, J.; Härer, A.; Hulsey, C.D.; Franchini, P.; et al. Contrasting signatures of genomic divergence during sympatric speciation. Nature 2020, 588, 106–111. [Google Scholar] [CrossRef] [PubMed]
  12. Huang, Z.; Ma, B.; Guo, X.; Wang, H.; Ma, A.; Sun, Z.; Wang, Q. Comparative transcriptome analysis of the molecular mechanism underlying the golden red colour in mutant Taiwanese loach. Aquaculture 2021, 543, 736979. [Google Scholar] [CrossRef]
  13. Chen, Y.; Gong, Q.; Lai, J.; Song, M.; Liu, Y.; Wu, Y.; Ai, J.; Long, Z. Transcriptome analysis identifies candidate genes associated with skin color variation in Triplophysa siluroides. Comp. Biochem. Physiol. Part D Genom. Proteom. 2020, 35, 100682. [Google Scholar] [CrossRef] [PubMed]
  14. Tang, S.; Janpoom, S.; Prasertlux, S.; Rongmung, P.; Ratdee, O.; Zhang, W.; Khamnamtong, B.; Klinbunga, S. Transcriptome comparison for identification of pigmentation-related genes in different color varieties of Siamese fighting fish Betta splendens. Comp. Biochem. Physiol. Part. D Genom. Proteom. 2022, 43, 101014. [Google Scholar] [CrossRef]
  15. Rani, V.; Sengar, R.S. Biogenesis and mechanisms of microRNA-mediated gene regulation. Biotechnol. Bioeng. 2022, 3, 119. [Google Scholar] [CrossRef] [PubMed]
  16. Gong, W.; Huang, Y.; Xie, J.; Wang, G.; Yu, D.; Sun, X. Genome-wide identification and characterization of conserved and novel microRNAs in grass carp (Ctenopharyngodon idella) by deep sequencing. Comput. Biol. Chem. 2017, 68, 92–100. [Google Scholar] [CrossRef] [PubMed]
  17. He, L.; Zhang, A.; Chu, P.; Li, Y.; Huang, R.; Liao, L.; Zhu, Z.; Wang, Y. Deep Illumina sequencing reveals conserved and novel microRNAs in grass carp in response to grass carp reovirus infection. BMC Genom. 2017, 18, 195. [Google Scholar] [CrossRef] [PubMed]
  18. Gong, W.; Huang, Y.; Xie, J.; Wang, G.; Yu, D.; Sun, X.; Zhang, K.; Li, Z.; Ermeng, Y.; Tian, J.; et al. Identification and expression analysis of miRNA in hybrid snakehead by deep sequencing approach and their targets prediction. Genomics 2019, 111, 1315–1324. [Google Scholar] [CrossRef] [PubMed]
  19. Franchini, P.; Xiong, P.; Fruciano, C.; Meyer, A. The role of microRNAs in the repeated parallel diversification of lineages of Midas cichlid fish from Nicaragua. Genome Biol. Evol. 2016, 8, 1543–1555. [Google Scholar] [CrossRef]
  20. Franchini, P.; Xiong, P.; Fruciano, C.; Schneider, R.F.; Woltering, J.M.; Hulsey, C.D.; Meyer, A. MicroRNA gene regulation in extremely young and parallel adaptive radiations of crater lake cichlid fish. Mol. Biol. Evol. 2019, 36, 2498–2511. [Google Scholar] [CrossRef]
  21. Wu, S.; Huang, J.; Li, Y.; Zhao, L. Involvement of miR-495 in the skin pigmentation of rainbow trout (Oncorhynchus mykiss) through the regulation of mc1r. Int. J. Biol. Macromol. 2024, 254, 127638. [Google Scholar] [CrossRef] [PubMed]
  22. Wang, L.; Song, F.; Yin, H.; Zhu, W.; Fu, J.; Dong, Z.; Xu, P. Comparative microRNAs expression profiles analysis during embryonic development of common carp, Cyprinus carpio. Comp. Biochem. Physiol. Part D Genom. Proteom. 2021, 37, 100754. [Google Scholar] [CrossRef] [PubMed]
  23. Wang, P.; Zeng, D.; Xiong, G.; Zhou, X.; Wang, X. Integrated analysis of mRNA-seq and microRNA-seq depicts the potential roles of miRNA-mRNA networks in pigmentation of Chinese soft-shelled turtle (Pelodiscus sinensis). Aquac. Rep. 2021, 20, 100686. [Google Scholar] [CrossRef]
  24. Guo, Y.; Wu, W.; Yang, X. Coordinated microRNA/mRNA Expression Profiles Reveal Unique Skin Color Regulatory Mechanisms in Chinese Giant Salamander (Andrias davidianus). Animals 2023, 13, 1181. [Google Scholar] [CrossRef] [PubMed]
  25. Botchkareva, N.V. MicroRNA/mRNA regulatory networks in the control of skin development and regeneration. Cell Cycle 2012, 11, 468–474. [Google Scholar] [CrossRef]
  26. Zhang, J.; Liu, Y.; Zhu, Z.; Yang, S.; Ji, K.; Hu, S.; Liu, X.; Yao, J.; Fan, R.; Dong, C. Role of microRNA508-3p in melanogenesis by targeting microphthalmia transcription factor in melanocytes of alpaca. Animal 2017, 11, 236–243. [Google Scholar] [CrossRef] [PubMed]
  27. Dong, Z.; Luo, M.; Wang, L.; Yin, H.; Zhu, W.; Fu, J. MicroRNA-206 Regulation of Skin Pigmentation in Koi Carp (Cyprinus carpio L.). Front. Genet. 2020, 11, 47. [Google Scholar] [CrossRef]
  28. Jiang, S.; Yu, X.; Dong, C. MiR-137 affects melanin synthesis in mouse melanocyte by repressing the expression of c-Kit and Tyrp2 in SCF/c-Kit signaling pathway. J. Agric. Chem. Soc. Jpn. 2016, 80, 2115–2121. [Google Scholar]
  29. Zhu, Z.; Cai, Y.; Li, Y.; Li, H.; Zhang, L.; Xu, D.; Yu, X.; Li, P.; Lv, L. miR-148a-3p inhibits alpaca melanocyte pigmentation by targeting MITF. Small Rumin. Res. 2019, 177, 44–49. [Google Scholar] [CrossRef]
  30. Wei, M.; Song, H.; Qi, B.; Liu, C.; Luo, J.; Hu, Y. Pigment cells development and body color variation of postembryonic development in Amphilophus citrinellus (Günther 1864). J. Shanghai Ocean. Univ. 2015, 24, 28–35. [Google Scholar]
  31. Forsman, A.; Polic, D.; Sunde, J.; Betzholtz, P.E.; Franzén, M. Variable colour patterns indicate multidimensional, intraspecific trait variation and ecological generalization in moths. Ecography 2020, 43, 823–833. [Google Scholar] [CrossRef]
  32. Henning, F.; Jones, J.C.; Franchini, P.; Meyer, A. Transcriptomics of morphological color change in polychromatic Midas cichlids. BMC Genom. 2013, 14, 171. [Google Scholar] [CrossRef] [PubMed]
  33. Kratochwil, C.F.; Kautt, A.F.; Nater, A.; Härer, A.; Liang, Y.; Henning, F.; Meyer, A. An intronic transposon insertion associates with a trans-species color polymorphism in Midas cichlid fishes. Nat. Commun. 2022, 13, 296. [Google Scholar] [CrossRef] [PubMed]
  34. Wu, G.; Mu, X.; Song, H.; Liu, Y.; Yang, Y.; Liu, C. Characterization and functional analysis of pax3 in body color transition of polychromatic Midas cichlids (Amphilophus citrinellus). Comp. Biochem. Physiol. Part B: Biochem. Mol. Biol. 2023, 263, 110779. [Google Scholar] [CrossRef] [PubMed]
  35. Luo, J.; Liu, G.; Chen, Z.; Ren, Q.; Yin, H.; Luo, J.; Wang, H. Identification and characterization of microRNAs by deep-sequencing in Hyalomma anatolicum anatolicum (Acari: Ixodidae) ticks. Gene 2015, 564, 125–133. [Google Scholar] [CrossRef] [PubMed]
  36. Betel, D.; Koppal, A.; Agius, P.; Sander, C.; Leslie, C. Comprehensive modeling of microRNA targets predicts functional non-conserved and non-canonical sites. Genome Biol. 2010, 11, R90. [Google Scholar] [CrossRef] [PubMed]
  37. Agarwal, V.; Bell, G.W.; Nam, J.; Bartel, D.P. Predicting effective microRNA target sites in mammalian mRNAs. eLife 2015, 4, e05005. [Google Scholar] [CrossRef] [PubMed]
  38. Mao, L.; Zhu, Y.; Yan, J.; Zhang, L.; Zhu, S.; An, L.; Meng, Q.; Zhang, Z.; Wang, X. Full-length transcriptome sequencing analysis reveals differential skin color regulation in snakeheads fish Channa argus. Aquac. Fish. 2023. [Google Scholar] [CrossRef]
  39. Tian, X.; Peng, N.; Ma, X.; Wu, L.; Shi, X.; Liu, H.; Song, H.; Wu, Q.; Meng, X.; Li, X. microRNA-430b targets scavenger receptor class B member 1 (scarb1) and inhibits coloration and carotenoid synthesis in koi carp (Cyprinus carpio L.). Aquaculture 2022, 546, 737334. [Google Scholar] [CrossRef]
  40. Gong, W.; Huang, Y.; Xie, J.; Wang, G.; Yu, D.; Zhang, K.; Li, Z.; Yu, E.; Tian, J.; Zhu, Y. Identification and comparative analysis of the miRNA expression profiles from four tissues of Micropterus salmoides using deep sequencing. Genomics 2018, 110, 414–422. [Google Scholar] [CrossRef]
  41. Zhang, R. miR-199a-5p Reduces Chondrocyte Hypertrophy and Attenuates Osteoarthritis Progression via the Indian Hedgehog Signal Pathway. J. Clin. Med. 2023, 12, 1313. [Google Scholar] [CrossRef] [PubMed]
  42. Liang, L.; Zhang, Z.; Qin, X.; Gao, Y.; Zhao, P.; Liu, J.; Zeng, W. Gambogic Acid Inhibits Melanoma through Regulation of miR-199a-3p/ZEB1 Signalling. Basic Clin. Pharmacol. 2018, 123, 692–703. [Google Scholar] [CrossRef] [PubMed]
  43. Stein, C.S.; McLendon, J.M.; Witmer, N.H.; Boudreau, R.L. Modulation of miR-181 influences dopaminergic neuronal degeneration in a mouse model of Parkinson’s disease. Mol. Ther. Nucleic Acids 2022, 28, 1–15. [Google Scholar] [CrossRef] [PubMed]
  44. Chen, B.; Deng, Y.N.; Wang, X.; Xia, Z.; He, Y.; Zhang, P.; Syed, S.E.; Li, Q.; Liang, S. miR-26a enhances colorectal cancer cell growth by targeting RREB1 deacetylation to activate AKT-mediated glycolysis. Cancer Lett. 2021, 521, 1–13. [Google Scholar] [CrossRef] [PubMed]
  45. Yi, R.; O’Carroll, D.; Pasolli, H.A.; Zhang, Z.; Dietrich, F.S.; Tarakhovsky, A.; Fuchs, E. Morphogenesis in skin is governed by discrete sets of differentially expressed microRNAs. Nat. Genet. 2006, 38, 356–362. [Google Scholar] [CrossRef]
  46. Zhu, Z.; He, J.; Jia, X.; Jiang, J.; Bai, R.; Yu, X.; Lv, L.; Fan, R.; He, X.; Geng, J.; et al. MicroRNA-25 functions in regulation of pigmentation by targeting the transcription factor MITF in alpaca (Lama pacos) skin melanocytes. Domest. Anim. Endocrinol. 2010, 38, 200–209. [Google Scholar] [CrossRef]
  47. Zhang, H.; Fu, Y.; Su, Y.; Shi, Z.; Zhang, J. Identification and expression of HDAC4 targeted by miR-1 and miR-133a during early development in Paralichthys olivaceus. Comp. Biochem. Physiol. Part. B Biochem. Mol. Biol. 2015, 179, 1–8. [Google Scholar] [CrossRef] [PubMed]
  48. Ceinos, R.M.; Guillot, R.; Kelsh, R.N.; Cerdá-Reverter, J.M.; Rotllant, J. Pigment patterns in adult fish result from superimposition of two largely independent pigmentation mechanisms. Pigment Cell Melanoma Res. 2015, 28, 196–209. [Google Scholar] [CrossRef]
  49. Xu, F.; Zhang, H.; Su, Y.; Kong, J.; Yu, H.; Qian, B. Up-regulation of microRNA-183-3p is a potent prognostic marker for lung adenocarcinoma of female non-smokers. Clin. Transl. Oncol. 2014, 16, 980–985. [Google Scholar] [CrossRef]
  50. Zhang, C.; Gu, H.; Liu, D.; Tong, F.; Wei, H.; Zhou, D.; Fang, J.; Dai, X.; Tian, H. The circ_FAM53B-miR-183-5p-CCDC6 axis modulates the malignant behaviors of papillary thyroid carcinoma cells. Mol. Cell. Biochem. 2022, 477, 2627–2641. [Google Scholar] [CrossRef]
  51. Kaken, H.; Wang, S.; Zhao, W. P53 Regulates Osteogenic Differentiation Through miR-153-5p/miR-183-5p-X-Linked IAP (XIAP) Signal in Bone Marrow Mesenchymal Stem Cell (BMSC). J. Biomater. Tissue Eng. 2022, 12, 2427–2431. [Google Scholar] [CrossRef]
  52. Jie, C.; Lin, G.; Jie, N.; Ping, H.; Kai, H.; Ying-Li, S. MiR-183 Regulates ITGB1P Expression and Promotes Invasion of Endometrial Stromal Cells. Biomed. Res. Int. 2015, 2015, 340218. [Google Scholar]
  53. Zhu, Y.; Li, Q. Mitf involved in shell pigmentation by activating tyrosinase-mediated melanin synthesis in Pacific oyster (Crassostrea gigas). Gene 2024, 897, 148086. [Google Scholar] [CrossRef]
  54. Yu, F.; Qu, B.; Lin, D.; Deng, Y.; Huang, R.; Zhong, Z. Pax3 Gene Regulated Melanin Synthesis by Tyrosinase Pathway in Pteria penguin. Int. J. Mol. Sci. 2018, 19, 3700. [Google Scholar] [CrossRef]
  55. Kang, D.; Kim, H. Functional relation of agouti signaling proteins (ASIPs) to pigmentation and color change in the starry flounder, Platichthys stellatus. Comp. Biochem. Physiol. Part A Mol. Integr. Physiol. 2024, 291, 111524. [Google Scholar] [CrossRef] [PubMed]
  56. Zhou, K.; Song, H.; Pan, X.; Liu, Y.; Jiang, Y.; Yang, Y.; Mou, X.; Liu, C.; Hu, Y.; Zhou, S. Expression analysis of mc1r gene relating to body color variation in Amphilophus citrinellus. Chin. J. Zool. 2019, 54, 45–56. [Google Scholar]
  57. Motohiro, M.; Hiroyuki, T.; Akiko, S.; Tetsuaki, K.; Ikuko, W.; Hikaru, K.; Yusuke, N.; Kiyoshi, N.; Shin-Ichi, H.; Takashi, S. A gene regulatory network combining Pax3/7, Sox10 and Mitf generates diverse pigment cell types in medaka and zebrafish. Development 2023, 19, dev202114. [Google Scholar]
  58. Yin, H.; Luo, M.; Luo, W.; Wang, L.; Zhu, W.; Fu, J.; Dong, Z. miR-196a regulates the skin pigmentation of koi carp (Cyprinus carpio L.) by targeting transcription factormitfa. Aquac. Res. 2021, 52, 229–236. [Google Scholar] [CrossRef]
  59. Yan, B.; Liu, B.; Zhu, C.D.; Li, K.L.; Yue, L.J.; Zhao, J.L.; Gong, X.L.; Wang, C.H. microRNA regulation of skin pigmentation in fish. J. Cell Sci. 2013, 126, 3401–3408. [Google Scholar]
  60. Kanehisa, M.; Araki, M.; Goto, S.; Hattori, M.; Hirakawa, M.; Itoh, M.; Katayama, T.; Kawashima, S.; Okuda, S.; Tokimatsu, T.; et al. KEGG for linking genomes to life and the environment. Nucleic Acids Res. 2007, 36, D480–D484. [Google Scholar] [CrossRef]
  61. Suzuki, N.; Mutai, H.; Miya, F.; Tsunoda, T.; Terashima, H.; Morimoto, N.; Matsunaga, T. A case report of reversible generalized seizures in a patient with Waardenburg syndrome associated with a novel nonsense mutation in the penultimate exon of SOX10. BMC Pediatr. 2018, 18, 171. [Google Scholar] [CrossRef] [PubMed]
Figure 1. Morphological color change in the Midas cichlid. Viable melanophores and xanthophores in the dispersed and aggregated states are shown in (a). Melanophores of transitional fish showing a mixture of aggregated, dispersed, and dead melanophores are shown in (b). A scale of a gold fish completely lacking melanophores is shown in (c). A representative individual at three stages (B, T, and G) is shown in (d).
Fishes 09 00194 g001
Figure 2. Length distribution and abundance of small RNAs in the three distinct stages of color transformation in Amphilophus citrinellus scale. B: the black phase, T: the transitional phase; G: the golden phase.
Fishes 09 00194 g002
Figure 3. Unique Small RNA reads were BLAST searched against the Rfam database of non-coding RNAs to annotate rRNA, tRNA, snoRNA, snRNA, and other RNAs.
Fishes 09 00194 g003
Figure 4. Differentially expressed miRNAs in three distinct stages of color transformation (B, T, and G). (a) Scatter plots of three pairwise comparisons. Red, green, and blue show the expression of miRNAs up-regulated, down-regulated, and non-significant, respectively. (b) Red and blue indicate numbers of significantly up- and down-regulated miRNAs, respectively. (c) Venn diagram showing the distribution of known differentially expressed miRNAs. B: the black phase; T: the transitional phase; G: the golden phase.
Fishes 09 00194 g004
Figure 5. Relative expression of 10 miRNAs in three distinct stages of color transformation (B: the black phase; T: the transitional phase; G: the golden phase) using Stem-loop qRT-PCR. All samples were run in triplicate. Error bars represent standard deviation from the mean (* represents p < 0.05, ** represents p < 0.01, *** represents p < 0.001).
Fishes 09 00194 g005aFishes 09 00194 g005b
Figure 6. qRT-PCR validation of known and novel miRNAs with expression in three distinct stages of color transformation of Amphilophus citrinellus (B, T, and G). The expression of miRNAs was normalized to the abundance of U6. Each column represents the mean ± standard error (n = 3 each). B: the black phase; T: the transitional phase; G: the golden phase.
Fishes 09 00194 g006
Figure 7. Network of putative interactions between miRNAs and their target genes related to the pigmentation process. The regulation network of miRNAs and their target genes was illustrated using Cytoscape. Red and blue circles represent miRNAs and target genes, respectively.
Fishes 09 00194 g007
Figure 8. Gene Ontology (GO) classification of differential expression genes in B vs. G, B vs. T, and T vs. G groups. (a) B vs. T, (b) B vs. G, and (c) T vs. G.
Fishes 09 00194 g008aFishes 09 00194 g008b
Figure 9. KEGG pathways-enriched analysis for target genes of differentially expressed miRNAs in B vs. T, B vs. G, and T vs. G groups. (a) B vs. T, (b) B vs. G, and (c) T vs. G.
Fishes 09 00194 g009aFishes 09 00194 g009b
Table 1. Primers used in the present study for tailing reaction qRT-PCR.
miRNAs IDPrimerSequence (5′-3′)
miRNA RT-primerRT TTACCTAGCGTATCGTTGACAGCTTTTTTTTTTTTTTTTTTTTVN
miR-4492-yForwardCGGGGCTGGGCTCGCGCC
miR-183-xForwardTATGGCACTGGTAGAATTCACT
miR-451-xForwardAAACCGTTACCATTACTGAGTTT
miR-1335-yForwardCGGCTGAGGTGGGATCCC
miR-6937-xForwardTGGCTCTAAGGGCTGGGTC
miR-133-xForwardAGCTGGTAAAATGGAACCAAAT
novel-m0009-5pForwardGTGAATCCTTGGACCCATTGTCA
miR-551-yForwardGCGACCCATCCTTTGTTTCTG
miR-193-yForwardAACTGGCCTACAAAGTCCCAGT
novel-m0091-3pForwardGTTCAAATCCGGATGCCCCCT
U6 ForwardCTCGCTTCGGCAGCACA
Universal PrimerReverseTTACCTAGCGTATCGTTGAC
Table 2. Highly expressed known miRNAs in the black (B), transitional (T), and golden (G) stages, three distinct stages of color transformation in Amphilophus citrinellus scale.
miRNA BmiRNA TmiRNA G
miR-26-x159,339 miR-199-x130,621 miR-199-x120,493
miR-199-x127,301 miR-26-x121,902 miR-100-x85,094
miR-181-x94,227 miR-181-x83,262 miR-26-x79,633
miR-205-x82,376 miR-21-x74,605 miR-181-x61,932
miR-22-y47,845 miR-10-x68,839 let-7-x57,923
let-7-x46,787 miR-100-x64,030 miR-205-x55,605
miR-21-x45,663 miR205-x62,212 miR-21-x55,018
miR-200-y38,329 let-7-x46,821 miR-146-x49,708
miR-203-y32,515 miR-146-x43,975 miR-10-x44,171
miR-199-y30,214 miR-22-y34,915 miR-200-y39,404
Disclaimer/Publisher’s Note: The statements, opinions and data contained in all publications are solely those of the individual author(s) and contributor(s) and not of MDPI and/or the editor(s). MDPI and/or the editor(s) disclaim responsibility for any injury to people or property resulting from any ideas, methods, instructions or products referred to in the content.

