Article

Genetic Characterization of Endangered Sterlet (Acipenser ruthenus, Linnaeus 1758) Gene Bank Broodstock, Natural and Cultured Populations in Hungary

1
Research Centre for Fisheries and Aquaculture (HAKI), Institute of Aquaculture and Environmental Safety, Hungarian University of Agriculture and Life Sciences, Anna-Liget Str. 35, H-5540 Szarvas, Hungary
2
Department of Molecular Ecology, Institute of Aquaculture and Environmental Safety, Szent István Campus, Hungarian University of Agriculture and Life Sciences, Páter Károly Str. 1, H-2100 Gödöllő, Hungary
*
Authors to whom correspondence should be addressed.
Fishes 2024, 9(6), 201; https://doi.org/10.3390/fishes9060201
Submission received: 14 April 2024 / Revised: 24 May 2024 / Accepted: 24 May 2024 / Published: 28 May 2024
(This article belongs to the Section Genetics and Biotechnology)

Abstract

:
The sterlet (Acipenser ruthenus) is the smallest-bodied endangered species among the six native sturgeon species of the Danube River, and self-sustaining populations still inhabit the Hungarian section of the Danube River and its largest tributary, the Tisza River. Their populations are drastically decreasing; however, they still have natural reproduction in these habitats. For the genetic conservation of the species, an ex situ gene bank is maintained in Hungary. The present study aimed to analyze the genetic resources of a gene bank with a near 40-year history and to compare it with natural populations and farmed stocks. Twelve microsatellites were used for population genetics analyses and individual genotyping of 268 specimens from two natural habitats (Danube and Tisza Rivers) and three captive stocks (a gene bank broodstock and two farms). Microsatellites revealed similar patterns among wild populations and gene bank stocks and did not show genetic differentiation (FST: 0.016–0.017) among them. These results confirmed that the gene bank broodstock properly represents the genetic background of the Danube and Tisza populations and is suitable as a source of breeding materials for the restocking programs. Negative trends were detected in the farmed stocks, reflected in reduced polymorphism at a few loci. The results of the principal component analyses indicate the farm stocks’ separation from the wild and gene bank stocks. The present genetic characterization study reveals a valuable captive stock of the endangered sterlet populations and provides unique information about the genetic similarities and differences among farms and wild stocks in Hungary. Our results provide information that contributes to preserving the genetic structure and variability in sterlet populations and supports the management of gene bank broodstock—avoiding inbreeding and preserving the unique genetic background of the Carpathian basin.
Key Contribution: This study investigates the genetic background of a Hungarian, ex situ endangered sterlet gene bank, comparing the current broodstock of the 40-year-old population with the two natural populations and two cultured stocks. The results show no significant genetic differentiation between the natural and gene bank populations, strengthening the case for conservation and restoration efforts for this species in the Danube Basin.

1. Introduction

Historically, five sturgeon species, Acipenser ruthenus, A. stellatus, A. nudiventris, A. gueldenstaedtii and Huso huso, were identified in the Hungarian catchment area of the Danube River. Populations of all these sturgeon species are declining in their native habitat due to various anthropogenic effects such as dams and hydropower plants, overfishing, poaching and water pollution [1]. In several studies, the negative impacts of these environmental and hydroelectric changes on sturgeon populations in Hungary were reported [2,3,4]. Four migratory species, Acipenser stellatus, A. nudiventris, A. gueldenstaedtii and Huso huso, are currently critically endangered, while the sterlet has been listed as endangered since 2019 on the IUCN Red List [5]. The changes affecting sterlet (A. ruthenus, Linnaeus 1758) populations have been previously reviewed [6]. The sterlet is the only sturgeon species in the Hungarian section of the Danube and Tisza Rivers that has self-sustaining populations and is the only sturgeon species in Europe that has a life cycle entirely dependent on freshwater [7]. Since the 1990s, its wild populations have declined in the upper and middle Danube regions [8]. Up until 2014, sterlets were caught for commercial and recreational purposes in Hungary. Based on catch data, changes in natural population size can be estimated. An ecologically considerable decrease in estimated population size was observed between 1993 and 2013. In the late 1990s, the annual catch of wild sterlet was more than 30 tons, but by 2013, this decreased to 5 tons [9].
According to a recent study by Neuburg and Friedrich [10], this species is on the brink of extinction in the Austrian Danube. This conclusion was based on extensive monitoring conducted over several years, when the population size of the affected river section was estimated by analyzing catch data. The primary reasons were already established as the following: there are low numbers of mature sterlets, insufficient evidence of natural reproduction, and the habitat is being fragmented and lost. Similar trends can be observed in other habitats of the species [10,11,12,13,14]. In response to the significant decline in sterlet populations including the Hungarian section of the Danube and its tributaries, several national and international conservation initiatives have been implemented [1,12,13].
The Gene Bank of HAKI (Research Centre for Aquaculture and Fisheries) has an important role in conservation efforts, preserves valuable stocks and utilizes its gene pool through the use of offspring for restoration programs of natural populations. The sturgeon gene bank was established in 1988 (HAKI, Szarvas, Hungary) with the dual purpose of research and conservation [4]. The broodstock collection for sterlets started by capturing wild individuals primarily from the Danube River and its tributaries, from the Tisza, as well as from the Körös River (a tributary of the Tisza) for breeding purposes. The resulting offspring were raised in ex situ conditions, in tanks and ponds. In the early years, only wild-caught sterlets were bred, but by the mid-1990s, the stock from their offspring had already reached sexual maturity, so they were also used for reproduction. The gene bank’s stock is replenished approximately every five years by breeding the existing stock (presumably descendants of the founding population) and introducing newly captured individuals. Almost every year since 2016, offspring from gene bank breeding have been regularly used as breeding animals to refresh and maintain the stock.
The living gene bank boasts ten separate generations, including six mature generations (the oldest stock dates back to 2008) and four juvenile generations. As a result of periodic artificial propagation [15,16], the size of the sterlet broodstock in the gene bank currently exceeds 200 sexually mature specimens. Mature individuals are labelled with Passive Integrated Transponder (PIT) tags, which allow us to identify the individuals and link them with genotype and phenotype data among other information for each examined fish (age, metric characteristics, egg/sperm quality from previous seasons’ propagation). Currently, 221 sexually mature individuals are kept, of which 55% are females and 45% are males. The average weight of mature fish varies between 3.01 (male) and 3.79 (female) kg.
To characterize our nearly 40-year-old gene bank population, we assessed the genetic variability in the fish population and compared it with the natural populations in surrounding rivers and those in fish farms.

2. Materials and Methods

2.1. Sampling and DNA Isolation

Fin clip samples were obtained from sterlet individuals at five different locations in Hungary, including two natural habitats, two aquaculture farms and one ex situ live gene bank facility. A total of 268 samples were collected between 2017 and 2020 (Supplementary Table S1). As part of a national conservation and restocking program, wild fish were captured from two major rivers in Hungary, 47 specimens from the Danube River and 22 specimens from the Tisza River, from which caudal fin samples were taken. Additionally, both Hungarian farm stocks (Farm I, Farm II) provided 30 samples each. From the live gene bank of HAKI, samples from 139 specimens were included in this study; each of them were labelled individually with PIT tags.
Tissue samples from individuals were preserved in 96% ethanol until DNA extraction. DNA isolation was conducted using the method of the E.Z.N.A.® Tissue DNA Kit (Omega Bio-tek Inc., Norcoss, GA, USA), following the instructions of the producer. The quality and quantity of the extracted DNA were measured with a NanoDrop® 2000 spectrophotometer (Whaltman, MA, USA). The integrity of the isolated DNA was evaluated in 1% agarose gels (Mini-Sub cell, BioRad, Hercules, CA, USA). For the genetic analysis, 100 ng DNA per sample was used as a template for the PCR reactions.

2.2. PCR and Microsatellite Analysis

Twelve microsatellite loci were analyzed in all 268 individuals using six duplex PCR reactions. Six of the twelve loci were isolated from the sterlet (Aru12, Aru13, Aru18, Aru19, Aru26 and Aru50) [17], and six loci were developed for other sturgeon species: locus Spl-163 for the shovelnose sturgeon (Scaphirhynchus platorynchus) [18]; loci AfuG 41, AfuG 51 and LS-68 (=Afu-68) for the lake sturgeon (A. fulvescens) [19,20]; locus An20 from the Adriatic sturgeon (A. naccarii) [21]; and locus AoxD161 from the Atlantic sturgeon (A. oxyrinchus) [22]. The composition of the PCR reaction was based on the protocol of the producer (Multiplex PCR Plus Kit, Qiagen, Germantown, MD, USA). Initially, we tested the microsatellite markers individually in PCR reactions (Supercycler Trinity, Kyratec) to identify the ideal duplex combinations (two microsatellite sequences amplified in a single reaction), considering the optimal annealing temperature. Tailed and tail sequence-specific fluorescent oligonucleotides were used to reduce the costs of analyses, according to the methods of [23]. The forward primers’ 5′ ends were elongated with a 17 bp tail sequence (tail; 5′ATTACCGCGGCTGCTGG-microsatellite-specific oligonucleotide-3′), which was non-specific for the examined species. PCRs were performed in a 25 µL final volume by adding a fluorescently labelled tail primer (dye: VIC, NED, PET; 5′dye-ATTACCGCGGCTGCTGG-3′): 1× Dream Taq DNA polymerase buffer (Thermo Fisher Scientific, USA), 250 nM forward and reverse primers, 125 nM labelled tail primer, 1.5–3.0 mM MgCl2, 0.2 mM dNTP, 1 U/µL Dream Taq DNA polymerase (Thermo Fisher Scientific, USA) and 100 ng template DNA.
Based on the different size ranges of the amplified PCR products, duplex PCR reactions were developed for more efficient analyses. The temperature profile was the following: initial denaturation at 94 °C for 2 min; 35 cycles of denaturation at 94 °C for 30 s; 57/60 °C annealing for 30 s; 72 °C extension for 1 min; and a final extension at 72 °C for 5 min. The PCR products were checked on 1.5% (w/v) agarose gels. The amplified fragments were separated by capillary electrophoresis using an ABI 3130 Genetic Analyzer (Applied Biosystems, Waltman, MA, USA). The lengths of these DNA fragments were determined by GENEMAPPER Software v.4.0 (Applied Biosystems, Waltman, MA, USA).

2.3. Statistical Analysis

Standard population genetics calculations were conducted with the GenAlEx 6.5 statistical software package [24]. Polymorphic information content (PIC) was estimated using Excel Microsatellite Toolkit version 3.1.1. [25]. The presence of null alleles and estimated allele frequencies was analyzed by MICRO-CHECKER software v.2.2.3 [26]. GENETIX. 4.05.2 [27] software was used for linkage disequilibrium (LD) analyses. The probability of genetic bottleneck was tested in all populations with BOTTLENECK 1.2.02 software [28], and the effective population size (Nep) was estimated as implemented in NeEstimator v.2.0 software [29].
To investigate the potential structure within and among the populations, STRUCTURE v2.3.3 [30] software was used with a Bayesian, Markov chain Monte Carlo (MCMC) model, set to 100,000 iterations for a different set number of genetic clusters (K: 1–8) involving 40 independent iterations. The most likely number of clusters (K) was estimated by using the ΔK method of Evanno et al. [31] by using Structure Harvester [32]. Admixture models were used, as we possessed prior knowledge about the origins of the populations under study. For visualization of the genetic variation among the individuals and populations, principal component analysis (PCA) was conducted in the R environment with the adegenet 2.0.1 package [33].

3. Results

3.1. Microsatellite Analysis

Following technical optimization, six duplex PCR sets were created, allowing for the testing of two markers simultaneously in one PCR reaction, with consideration of the annealing temperature and amplified allele range of the two microsatellites. Of the 12 microsatellite primer pairs examined, the markers exhibited successful amplification across all five studied groups of the sterlet, and none of the markers showed significant linkage equilibrium. All loci displayed polymorphism and were used in the analysis, except for one (AfuG 51), which was monomorphic in the Farm I group. MICRO-CHECKER revealed no evidence of large allele dropout. Using the 12 markers, 126 alleles were identified in total, 109 alleles for the Gene Bank, 96 alleles for the Danube group, 70 alleles each for the Tisza and Farm II groups, and 64 alleles for the Farm I group (the difference could be a consequence of the higher number of included samples in the gene bank and natural groups). Furthermore, private alleles were identified in four groups, a total of 14, the most in the Gene Bank (6), three each in Farm I and Danube, and two in Farm II. The highest allele number was detected at the AfuG 41 locus (24), while the lowest allele number was at the Aru19 locus (2). The average number of alleles across all loci was 10.5. The percentage of polymorphic loci was 100% in all groups, except in the Farm I group (91.7%). The polymorphic information content (PIC) of the microsatellite loci ranged from 0.120 to 0.917, with an average of 0.571 (Table 1). Among the twelve loci examined, six displayed a high PIC (>0.5), while four exhibited a moderate PIC. In the case of three loci (AfuG 51, Aru18 and Aru19), the PIC values were low due to low levels of polymorphism among the genotypes evaluated. In general, the PIC values were indicative of the highly polymorphic nature of the microsatellites analyzed.
The average expected and observed heterozygosities ranged from 0.51 to 0.58 and 0.46 to 0.59, respectively (Table 2), providing insights into the population’s status. Utilizing these, we conducted a χ2 test to assess deviations from the Hardy–Weinberg population equilibrium (HWE). In the Farm I stock, significant deviations from the Hardy–Weinberg equilibrium were found at seven loci; all deviations from this equilibrium were in the form of heterozygotic deficiencies (fewer heterozygotes than expected under equilibrium conditions). Both the gene bank and the Danube stocks at nine loci showed significant deviations from the HWE; at seven loci, heterozygotic deficiency was the cause of the deviation.
In contrast to the above results, no deviation from the HW equilibrium was observed at eight loci in the Tisza stock, indicating that this population may have been closest to the equilibrium state. The overall fixation index (Fis) ranged from −0.163 to 0.127. Among the Danube, Gene Bank and Farm II populations, the value was very close to zero, indicating reasonable conformance to the HW equilibrium, while in the Tisza population (average Fis: –0.163), the departure was considerable. These deviations were confirmed by the HWE values (Supplementary Table S2).
The estimated population size (Nep) was “infinite” in the Tisza population. The Nep estimation method frequently provides infinitely large estimates that can be the result of the small number of analyzed individuals originating from natural habitats of the Tisza River. The two wild populations and Farm I showed a higher relative size of the estimated population than the analyzed group, while the other two artificially propagated groups showed a smaller estimated effective size (Table 3). Among the analyzed groups, only the Farm I population showed a strong probability of bottleneck (Supplementary Table S3), which can be the consequence of artificial propagation (non-random mating, low number of breeders).
The FST values for each pair of the populations varied between 0.016 (the Danube–Gene Bank) and 0.119 (the Farm II–Tisza). An Fst value of 0 indicates no differentiation between the subpopulations, while a value of 1 indicates complete differentiation. There was considerable differentiation among the wild and cultured populations—FST varied between 0.066 and 0.119—which shows the importance of founder effects and random genetic drift in the cultured populations, furthermore indicating some isolation between wild and farmed populations, and most reflecting the fact that the populations are not currently breeding with one another. Values on the low end of this range (0.016, 0.017, close to 0) indicate that the populations (wild and gene bank) are sharing their genetic material. Although the two farm stocks showed a distinct genetic composition, the FST values did not indicate large genetic differentiation between farmed and wild populations (Table 4).

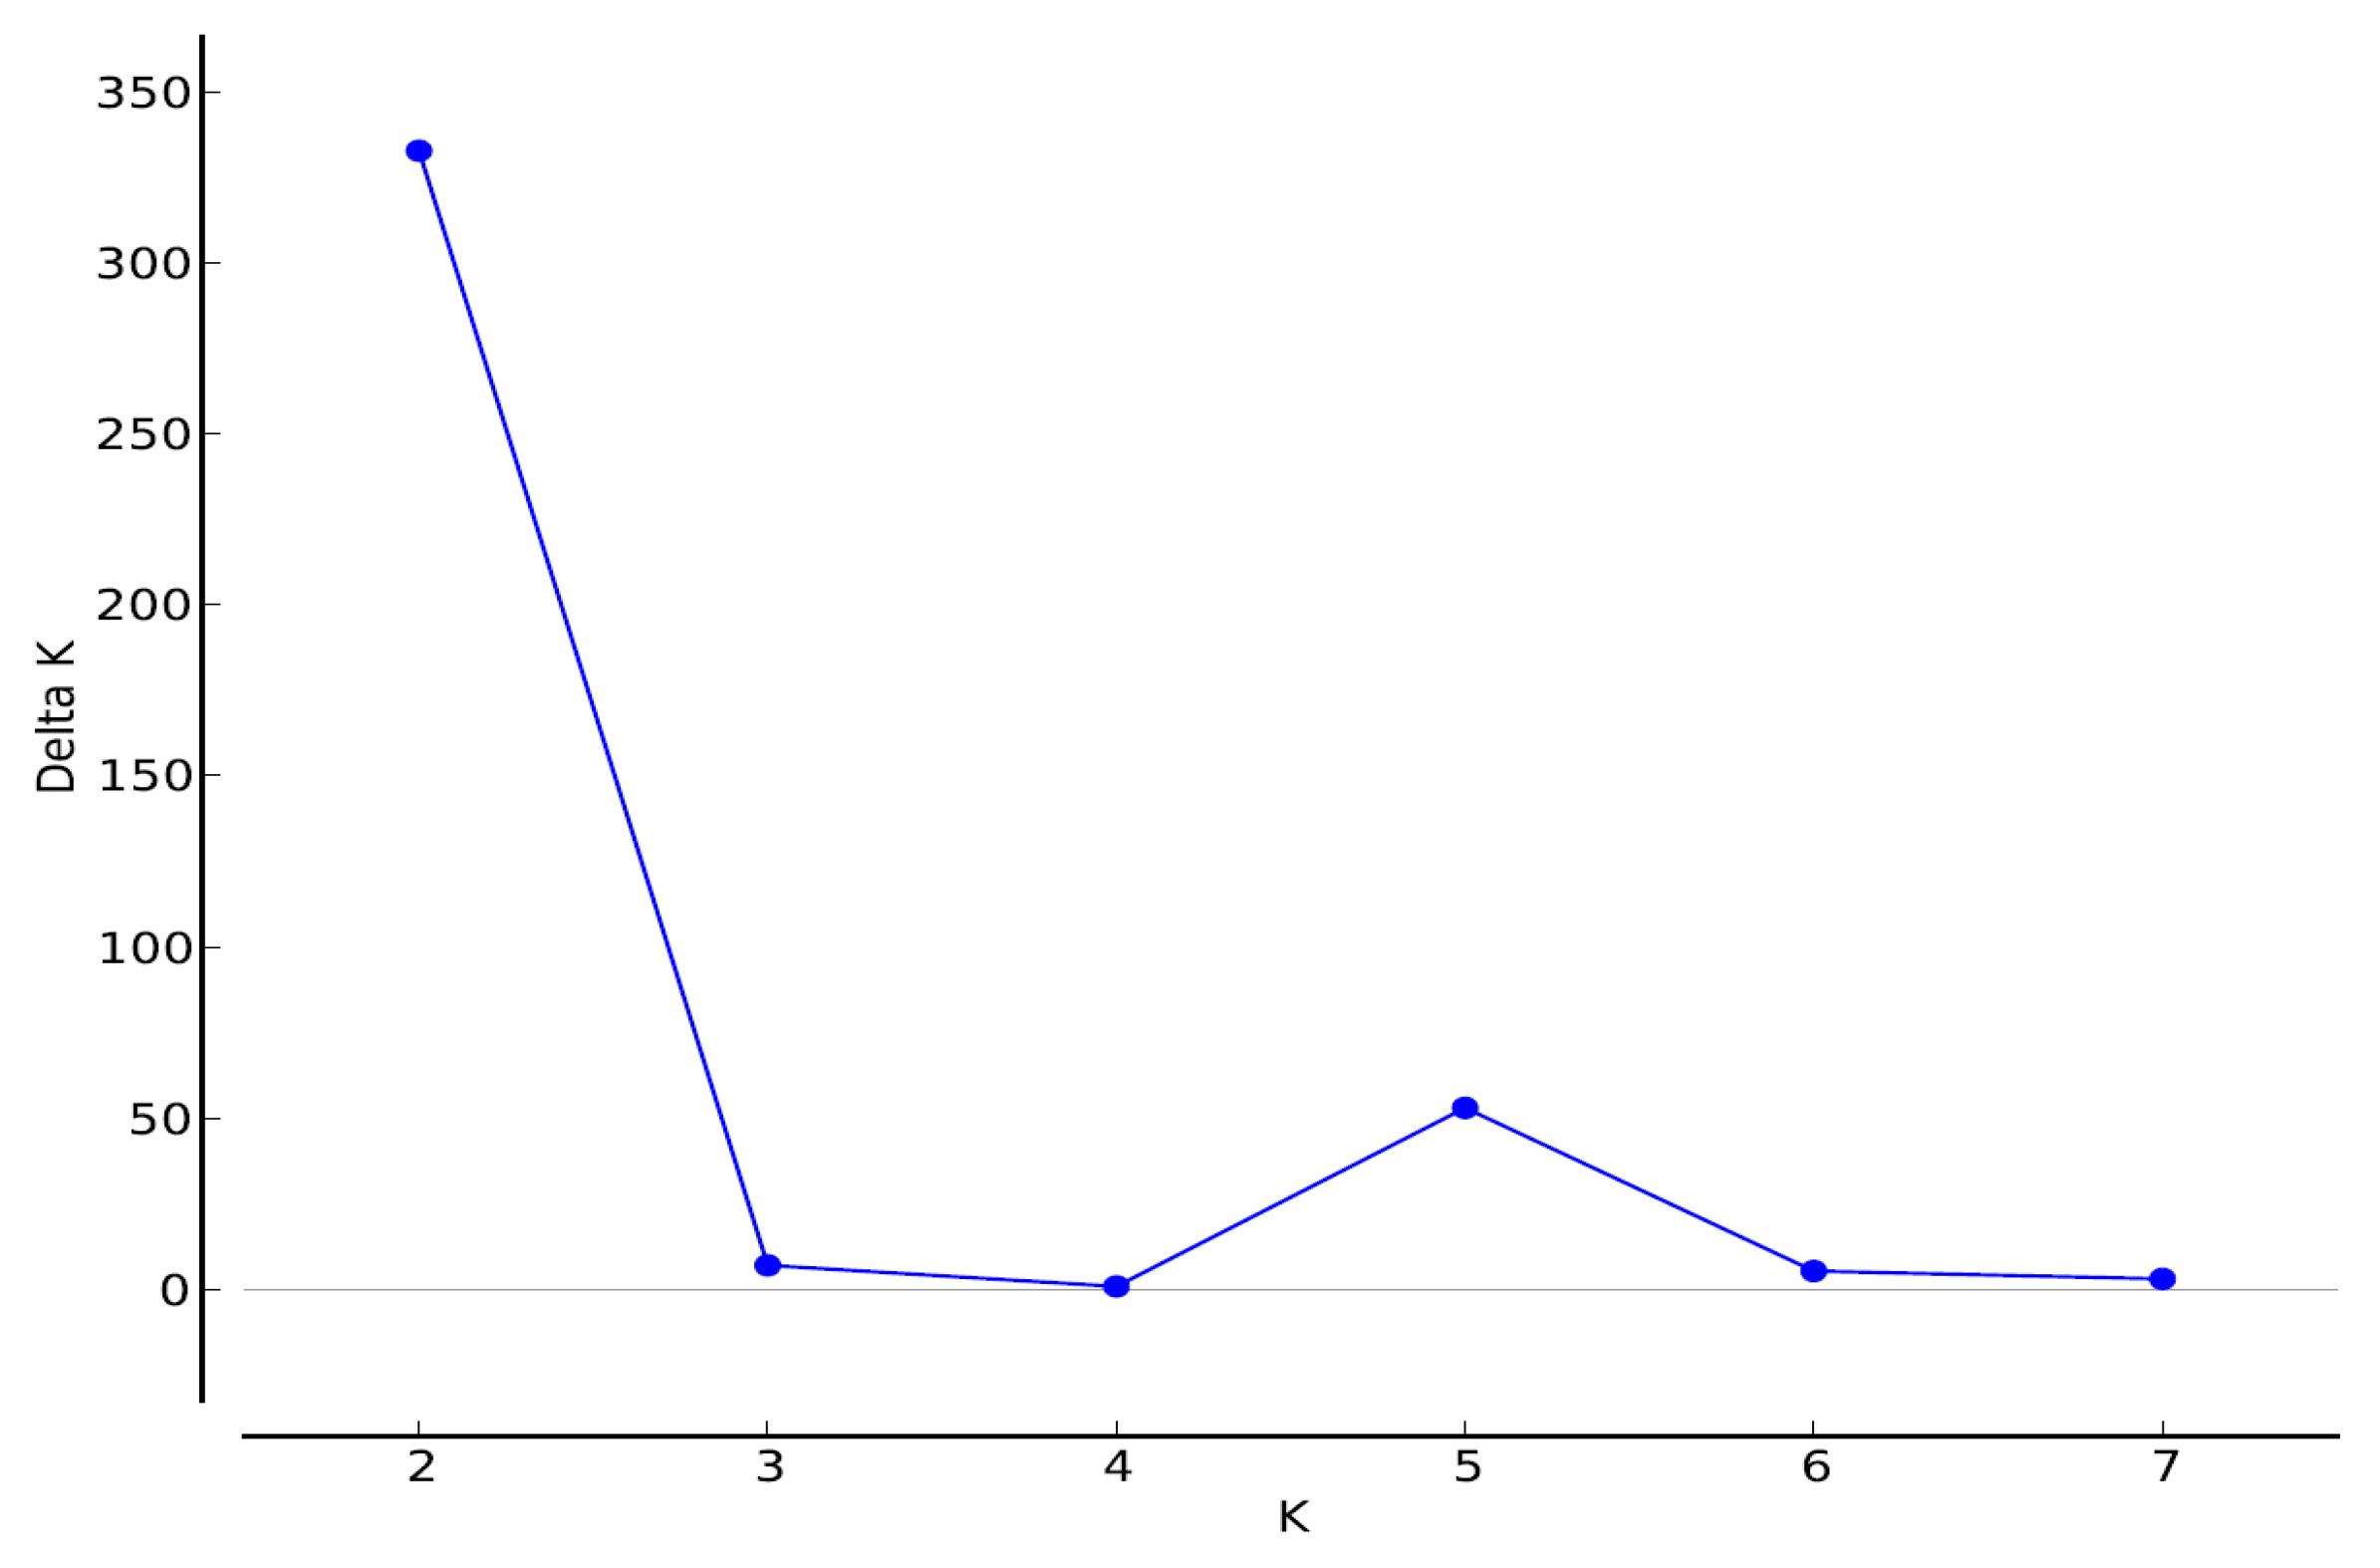
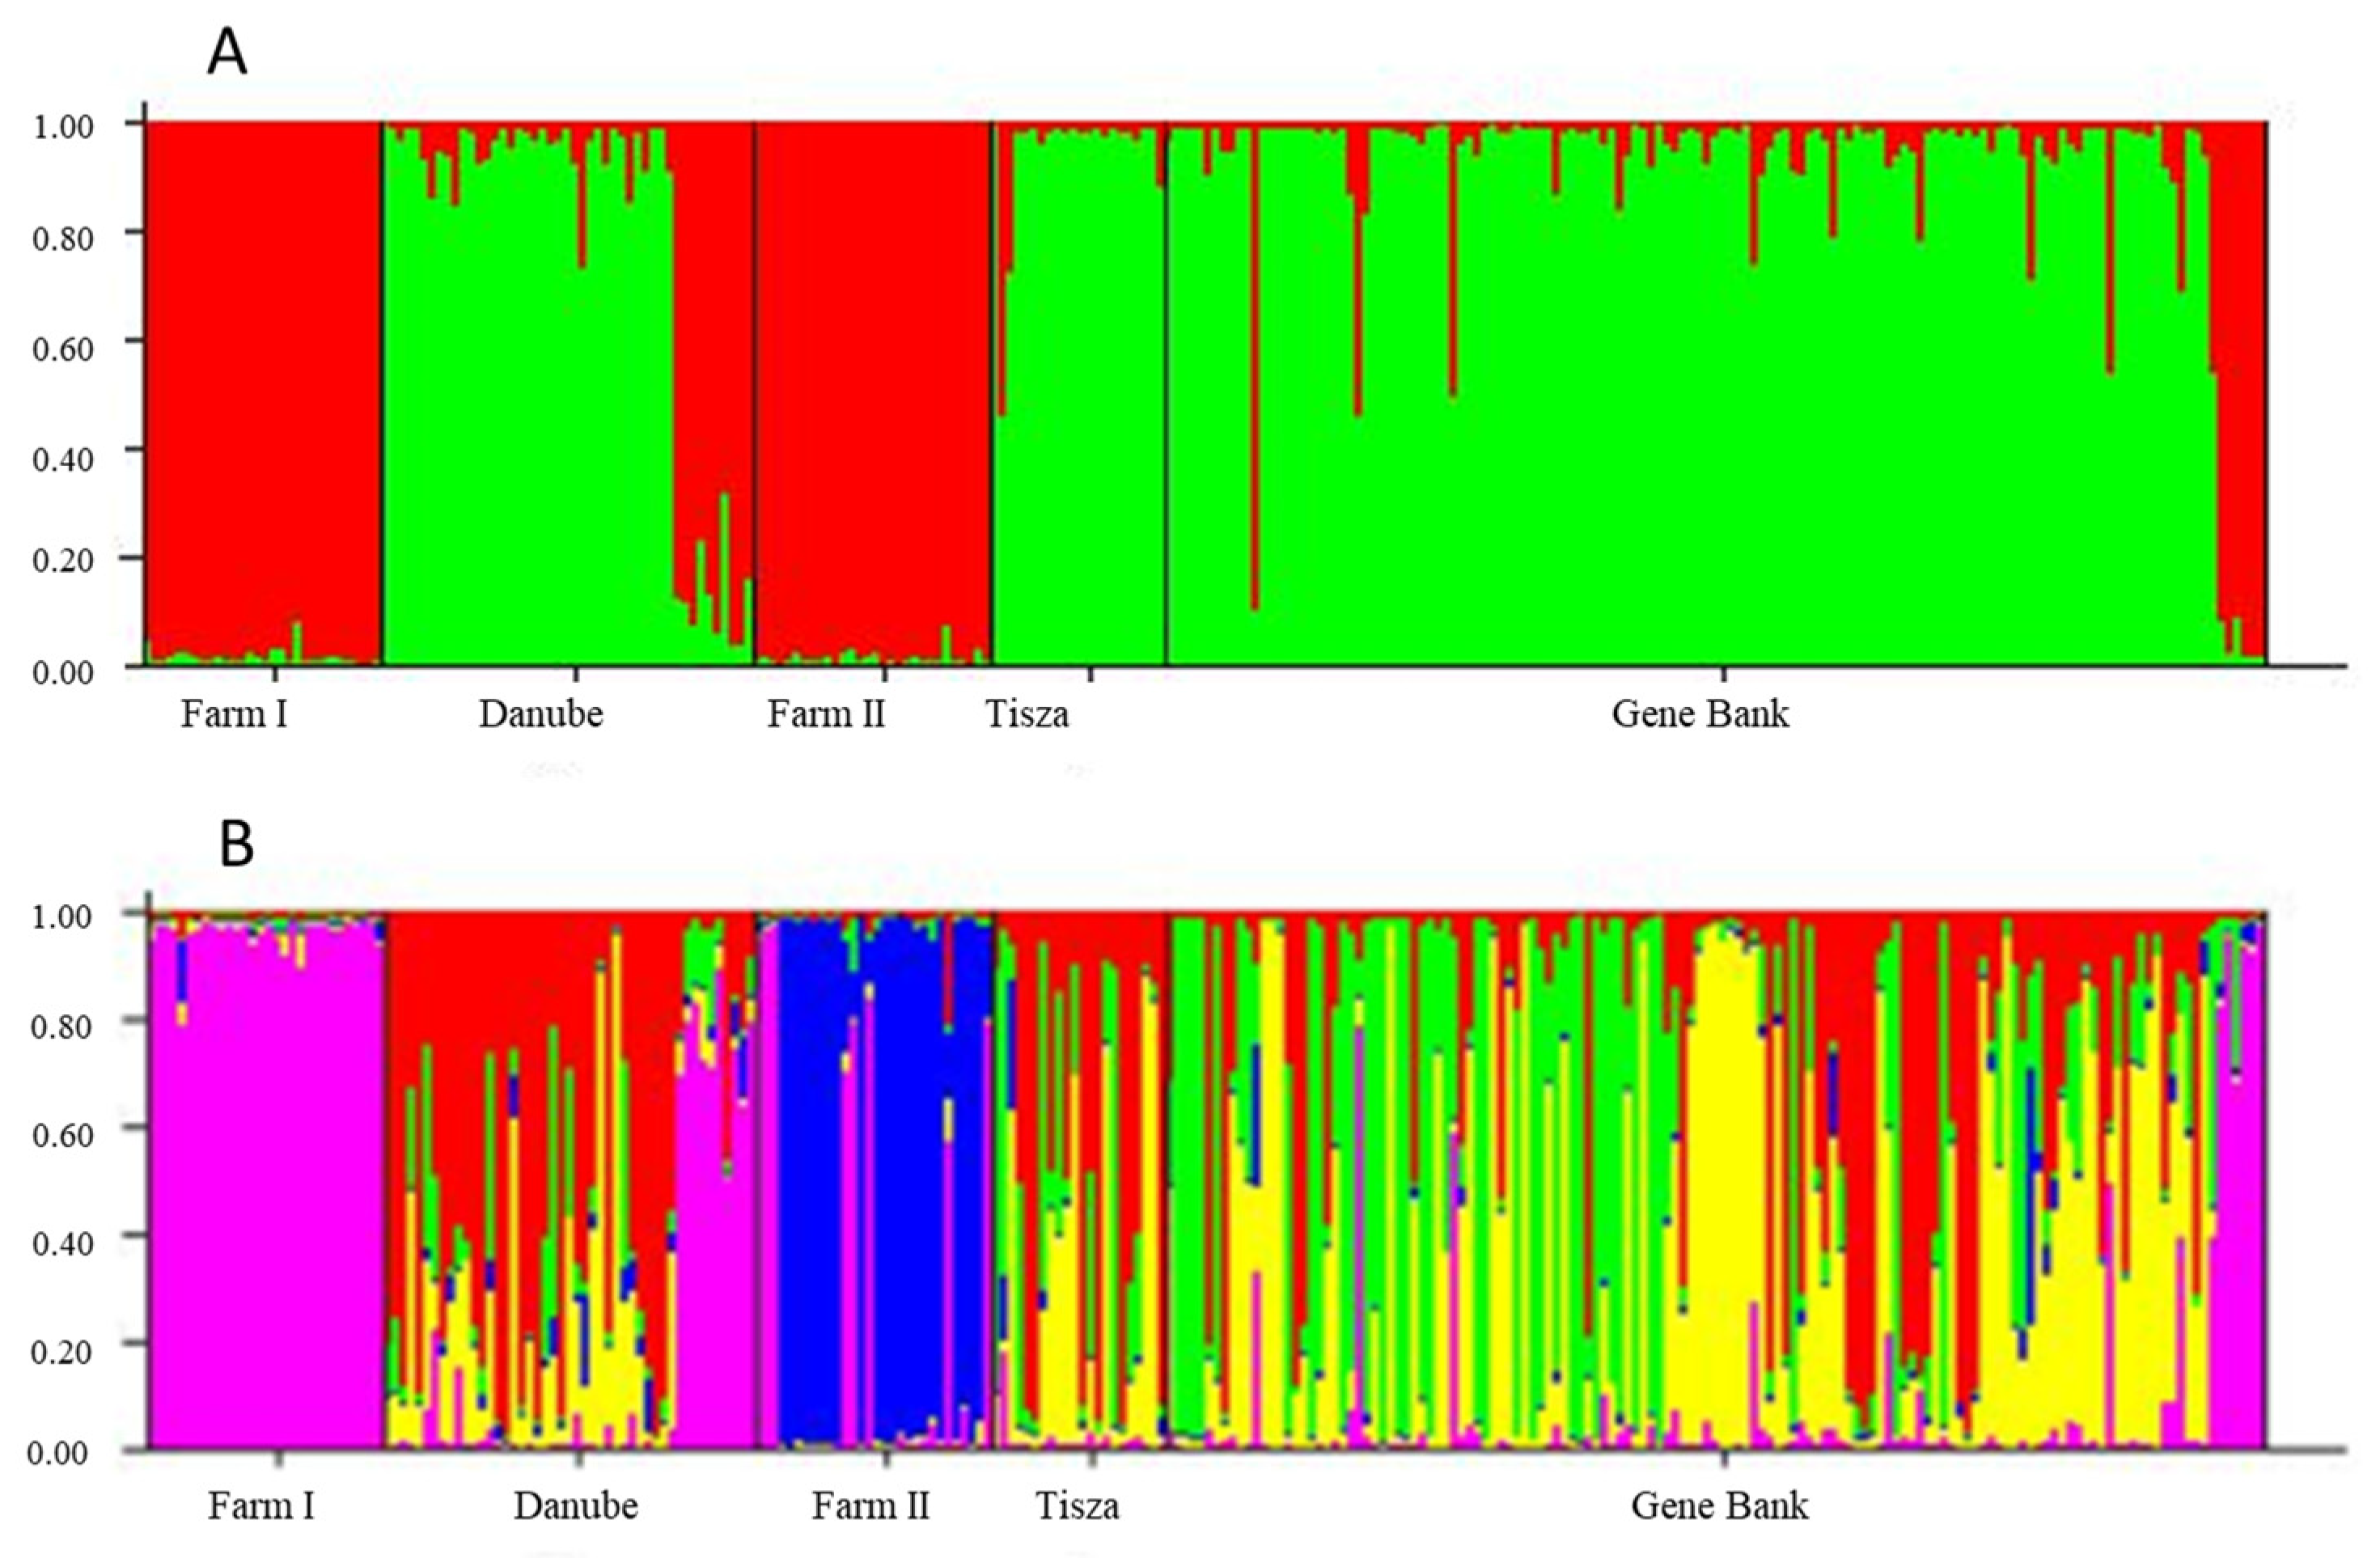
3.2. Structure Results

Genetic structure was assessed using the STRUCTURE software, and Structure Harvester calculated the most likely number of clusters (the highest delta K) chosen by the Evanno et al. method [30] (Figure 1). Accordingly, the samples from the five sampling locations could be classified into two clusters with high probability or into five distinct genetic groups with lower likelihood. Based on the two clusters, the natural (Danube and Tisza) and gene bank stocks were divided strongly from the farmed stocks (Figure 2, panel A).
A similar but more detailed distribution can be seen in the case of five assumed groups (Figure 2, panel B). In this case, the wild population (Danube, Tisza) individuals showed admixture between three main clusters. Like in the case of the wild populations, a high number of individuals in the gene bank stock showed varying degrees of admixture between four clusters. Bayesian clustering analysis indicated a diverse group among Danube, Tisza and Gene Bank populations. The specimens from the Farm I group were clustered in only one inferred group. However, specimens with similar genetic backgrounds were present in the Danube and Gene Bank groups. The assignment probability was higher than 0.95 in Farm I, while within the Farm II group, there was a certain proportion of mixing between the two genetic clusters of the two production stocks. The main cluster of Farm II’s stock was not present within any other group.

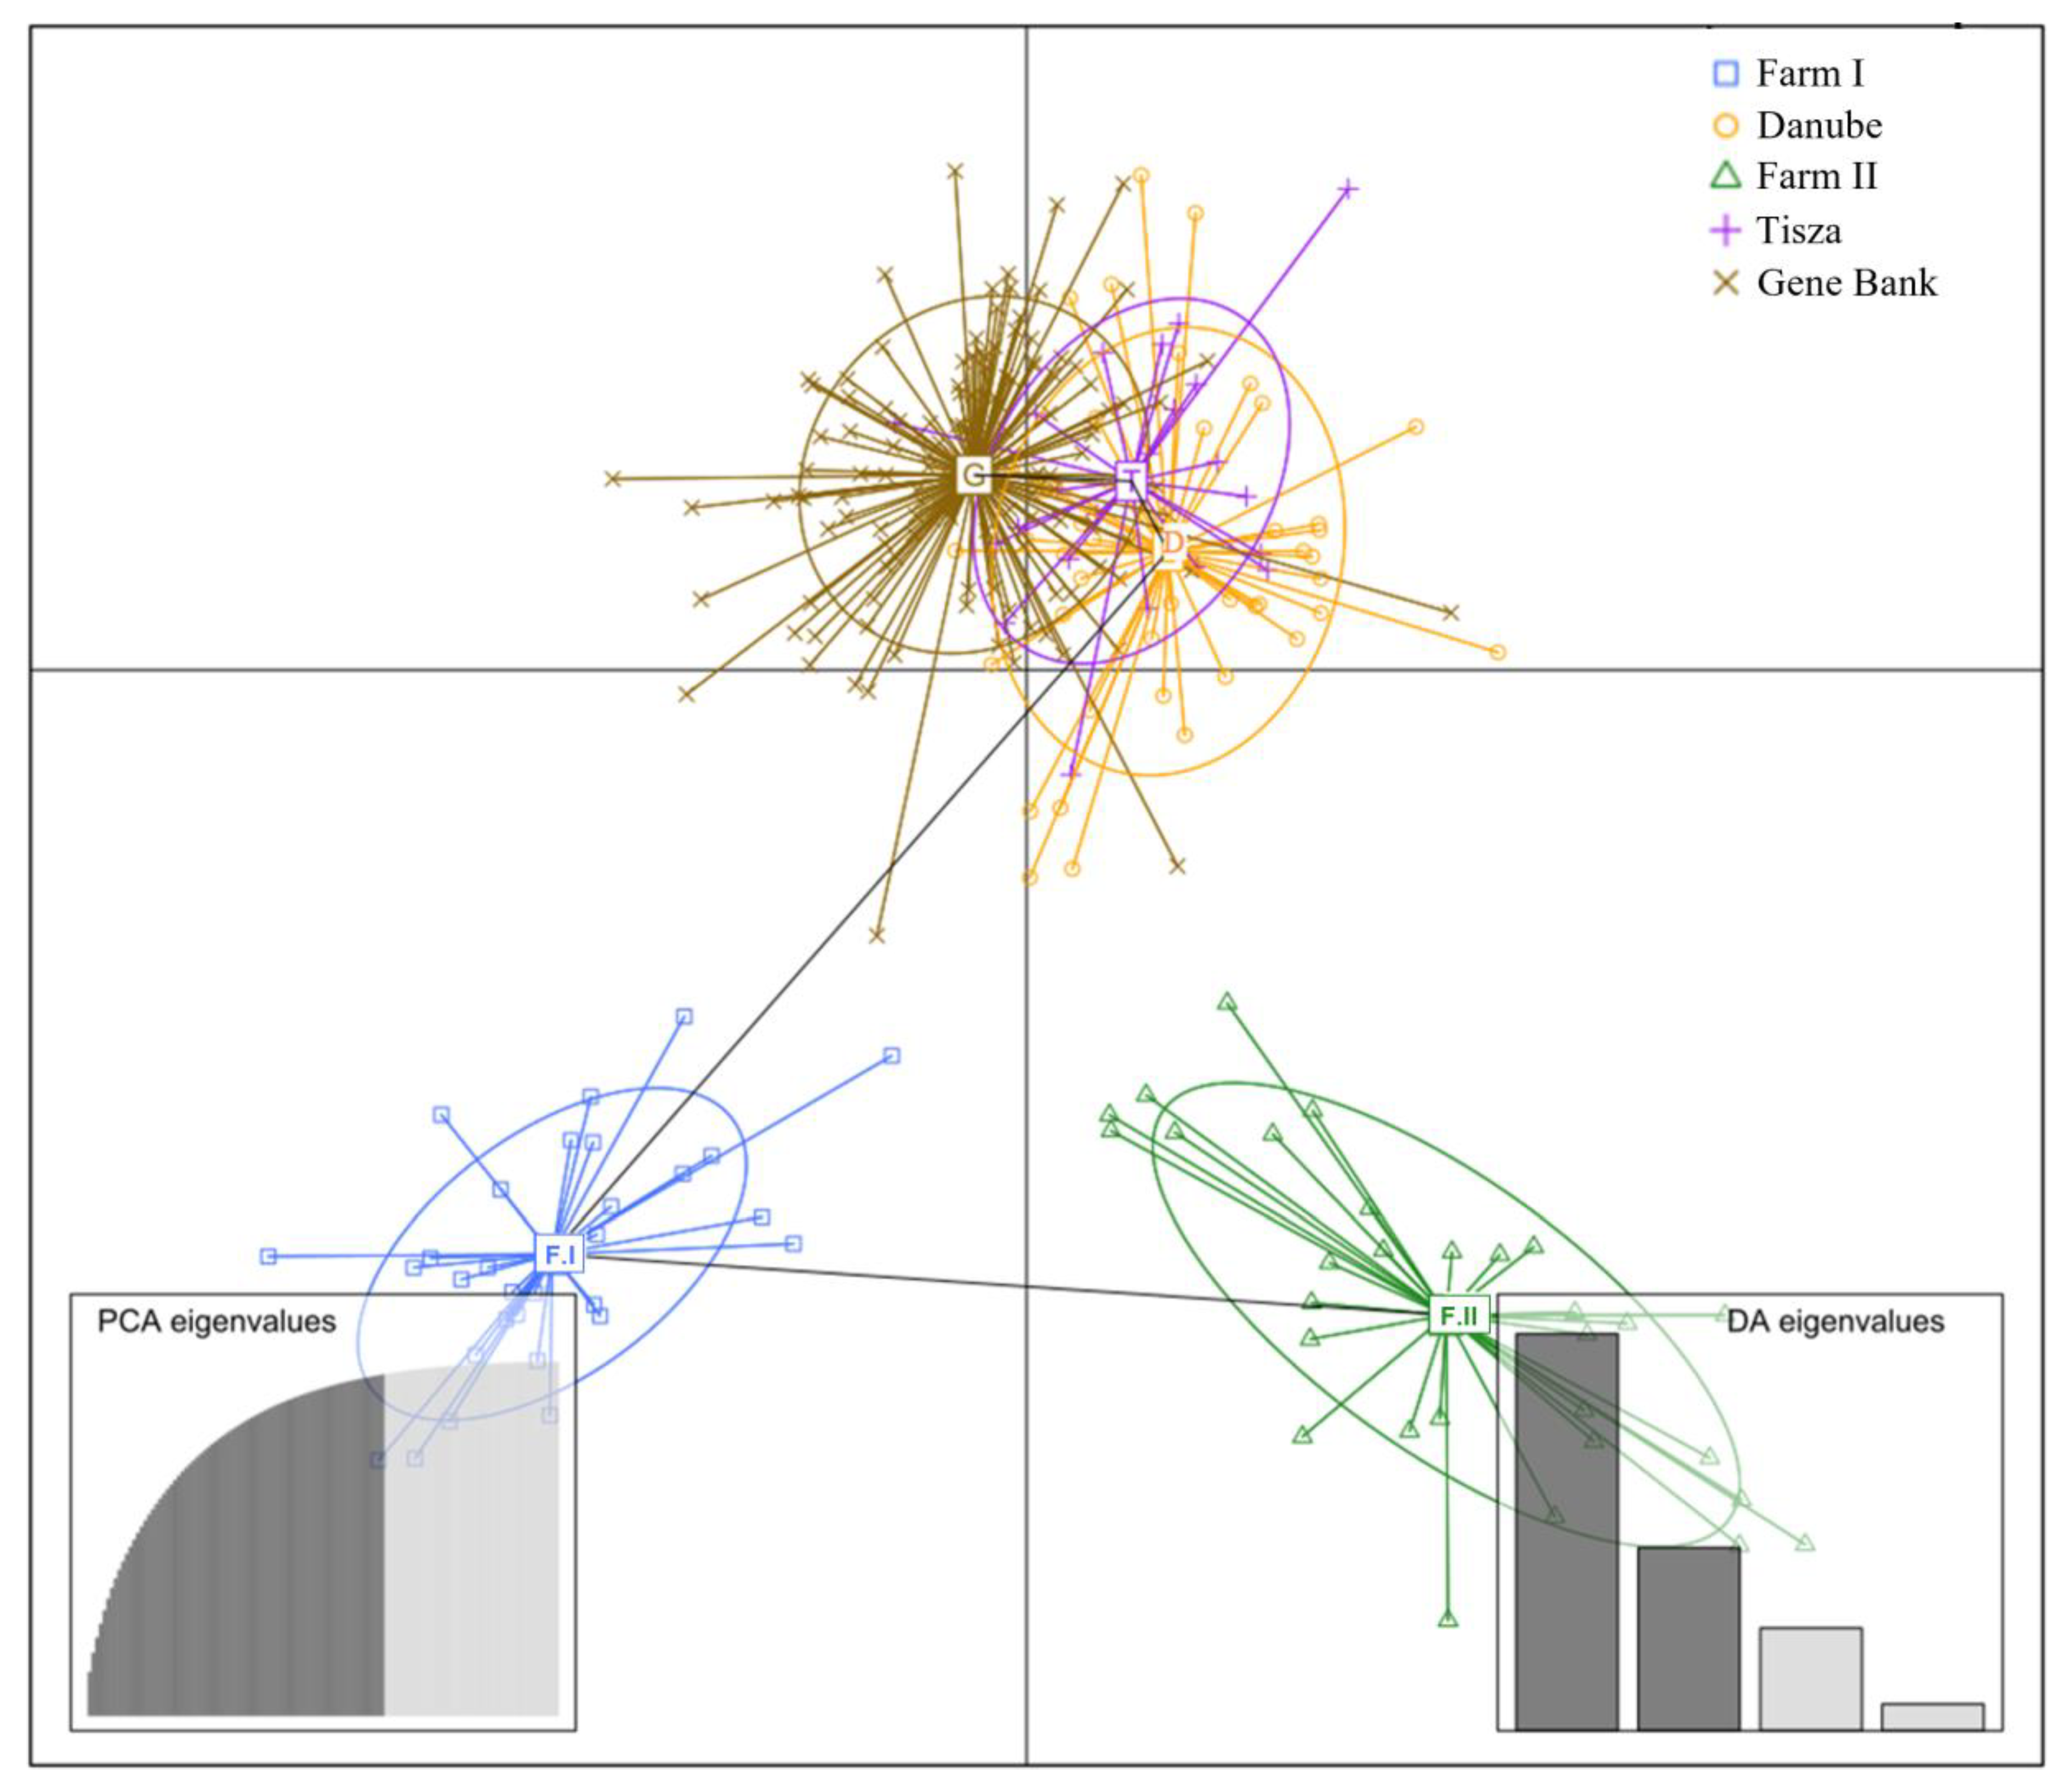
3.3. Principal Component Analysis (PCA) Results

The PCA analysis showed very similar but less structured clustering. The individuals were separated into three main groups by the first and second components (Figure 3). Overlap among Danube, Tisza and Gene Bank individuals shows limited geographic structure and that the gene bank is not divergent, while both farmed populations were separated from other populations and each other. The specimens which STUCTURE identified with a mixed genetic background from other stocks did not appear mixed with this analytic procedure.

4. Discussion

Genetic characteristics of fish populations are important not only for the protection of natural populations but also for breeding valuable fish species under aquaculture conditions [34,35]. Information regarding genetic variability within and among populations is also useful for researchers and managers because such results can provide information on stocks or populations and relatedness. Molecular genetic data may be used for determining genetic differences or similarities but can also help in planning the formation of a gene bank or farm broodstocks, based on genetic profiles [36].
The analysis presented in this study was the first assessment made to extensively compare the genetic diversity of the Hungarian sterlet gene bank and the main natural sterlet populations of the two largest river sections of Hungary. In a previous study, we examined the genetic composition of wild and our gene bank groups of sterlet; however, this analysis was limited to the assessment of four microsatellite markers and included fewer than one hundred individuals [9]. In the present study, fin clip samples were obtained from 268 individuals across three distinct habitat types (two natural populations, two farm stocks and a live gene bank broodstock). Analysis of twelve markers revealed a total of 126 alleles, with the highest number detected in the gene bank and the lowest in Farm II. Additionally, private alleles were discovered in all groups except the Tisza population. Among the analyzed groups, only the Farm I population showed the signature of a bottleneck, with the loss of genetic diversity not apparent in the other populations. Lower average numbers of alleles per locus were observed in the farmed groups; the mean values were 5.33 and 5.83, while the average allele number in the wild Danube populations was 8.00. The two wild populations and Farm I showed an increased effective population size, indicating a larger number of reproducing individuals in the full populations. The average observed heterozygosity parameters varied between 0.47 (Farm I) and 0.60 (Tisza). The average observed heterozygosity values across all groups were lower than the expected values, except for the Tisza group. This difference could signify family structure or mixing of populations. Presumably, there was gene flow between the populations of the studied rivers, and the results indicate no genetic differentiation (Figure 3, Table 4). Microsatellite data confirmed a high similarity between the Danube, Tisza and Gene Bank populations. No significant genetic structure was found between the Danube, Tisza and Gene Bank populations, although the two farm stocks showed a distinct pattern differentiation based on PCA results (Figure 3).
Numerous genetic studies have focused on sterlet populations living in the Danube River Basin. Futhermore, other populations from the Volga and Kuban rivers were examined using microsatellite markers and mtDNA sequence analysis, as part of an assessment of samples from the Danube sections in Slovakia, Serbia, Romania, Austria, Germany, Hungary and from two aquaculture facilities in Germany and Slovakia [1]. The analysis of nine microsatellite markers of the study revealed a typical panmictic population pattern in the Danube populations, indicating gene flow along the river without significant genetic substructuring for the sterlet population. These findings were corroborated by our study.
Kohlmann et al. [17] found a lower average allele number in a German farmed sterlet group (3.13) compared to a wild Romanian population (7.07). During our investigation, we observed similar results, as we found a lower average allele number in the farmed sterlet group than in the wild groups. In the current study, the observed heterozygosity (0.47–0.60) parameters in the analyzed groups of sterlet were comparable to reports from studies on other sterlet populations. For instance, Kohlmann et al. [17] reported heterozygosity values ranging between 0.52 and 0.63 in two investigated populations.

5. Conclusions

We developed six duplex PCR sets, consisting of twelve microsatellite loci that provided sufficient data on genetic variability and, therefore, proved suitable to characterize the genetic diversity and structure of Hungarian wild and farmed populations and gene bank broodstock of the sterlet. The results provided useful information for the effective conservation of the sterlet population in the Danube River Basin. Taking into account the genotype data of the individuals of the gene bank breeding stock, the ideal breeding candidates can be more consciously selected, avoiding the crossing of genetically close individuals, thus supporting the preservation of the genetic variability in the sterlet population.

Supplementary Materials

The following supporting information can be downloaded at: https://www.mdpi.com/article/10.3390/fishes9060201/s1, Table S1. Data on sterlet samples; Table S2. Summary of the population genetics analyses of twelve microsatellite loci for cultured, wild and gene bank populations in Hungary; Table S3. Bottleneck analysis of the sterlet populations.

Author Contributions

Conceptualization, G.F. and B.K; investigation, G.F., K.B., G.K. and A.G.; methodology, G.F. and B.K.; formal analysis, G.F, A.G. and K.B.; visualization, B.K. and Z.J.S.; writing—original draft, G.F.; supervision, B.K.; writing—review and editing, G.F., B.K., G.K., Z.J.S. and A.G.; All authors have read and agreed to the published version of the manuscript.

Funding

This research was partially sponsored by the Hungarian Ministry of Agriculture through projects HHgF/50/2015 and HHgF/194-1/2018, entitled “Development of conservation measures of endangered native sterlet and crucian carp species in Hungary”, and the Danube Transnational Programme: EU-INTERREG project MEASURES (Managing and Restoring Aquatic Bio-corridors for Migratory Fish Species in the Danube River Basin DTP2-038-2.3).

Institutional Review Board Statement

The animal study protocol was approved by the Institutional Ethics Committee of Research Institute for Fisheries and Aquaculture NAIK HAKI (Approval Code: 126-1/2016; Approval Date: 21 December 2016).

Informed Consent Statement

Not applicable.

Data Availability Statement

Raw data from this study are available upon request.

Acknowledgments

The authors are thankful to the technical staff of MATE for their support during the fish husbandry and laboratory sample analyses (Móni Farkas).

Conflicts of Interest

The authors declare no conflict of interest.

References

  1. Reinartz, R.; Lippold, S.; Lieckfeldt, D.; Ludwig, A. Population Genetic Analyses of Acipenser ruthenus as a Prerequisite for the Conservation of the Uppermost Danube Population. J. Appl. Ichtyol. 2011, 27, 477–483. [Google Scholar] [CrossRef]
  2. Guti, G. Ecological Impacts of the Gabčikovo River Barrage System on Fish in the Szigetköz Floodplain in Hungary. Int. Ver. Für Theor. Und Angew. Limnol. Verhandlungen 1998, 26, 2251–2254. [Google Scholar] [CrossRef]
  3. Guti, G. Past and Present Status of Sturgeons in Hungary and Problems Involving their Conservation. Riv. Syst. 2008, 18, 61–79. [Google Scholar] [CrossRef]
  4. Rónyai, A. Overview of Sturgeons Related Activities in HAKI. Presented at Visit of WWF Delegation to HAKI, Szarvas, Hungary. 2012; Unpublished Results. [Google Scholar] [CrossRef]
  5. Gessner, J.; Freyhof, J.; Kottelat, M.; Friedrich, T. Acipenser ruthenus. The IUCN Red List of Threatened Species. 2022. Available online: https://www.iucnredlist.org/species/227/135062526 (accessed on 9 April 2024).
  6. Guti, G.; Gaebele, T. Long-Term Changes of Sterlet (Acipenser ruthenus) Population in the Hungarian Section of the Danube. Opusc. Zool. Bp. 2009, 40, 17–25. [Google Scholar]
  7. Bemis, W.E.; Kynard, B. Sturgeon Rivers: An Introduction to Acipenseriform Biogeography and Life History. Environ. Biol. Fishes 1997, 48, 167–183. [Google Scholar] [CrossRef]
  8. Friedrich, T.; Reinartz, R.; Gessner, J. Sturgeon Re-Introduction in the Upper and Middle Danube River Basin. J. Appl. Ichtyol. 2019, 35, 1059–1068. [Google Scholar] [CrossRef]
  9. Fazekas, G.; Kovács, G.; Bogár, K.; Kovács, B. Genetic Analysis of Sterlet (Acipenser ruthenus) Related to Restocking Program in Hungary. Res. J. Agricult. Sci. 2018, 50, 166–170. [Google Scholar]
  10. Neuburg, J.; Friedrich, T. First Description of a Remnant Population of Sterlet (Acipenser ruthenus, LINNAEUS 1758) in the Eastern Austrian Danube. Nat. Conserv. 2023, 75, 126473. [Google Scholar] [CrossRef]
  11. Mikheev, P.B.; Kazarinov, S.N.; Melnikova, A.G.; Ponosov, S.V.; Petrenko, N.G.; Nikiforov, A.I.; Puzik, A.Y.; Elchenkova, O.N. Artificial Enhancement of Sturgeon Stock in Freshwater Reservoirs: A Case Study on Sterlet Acipenser ruthenus of the Kama Reservoir. Aquac. Fish. 2024, 9, 287–294. [Google Scholar] [CrossRef]
  12. Strat, D.; Gheorghe, I.F. Conservation Status and Effectiveness of the National and International Policies for the Protection and Conservation of Sturgeons in the Danube River and Black Sea Basin. Diversity 2023, 15, 568. [Google Scholar] [CrossRef]
  13. Holčík, J.; Klindová, A.; Masár, J.; Mészáros, J. Sturgeons in the Slovakian Rivers of the Danube River Basin: An Overview of Their Current Status and Proposal for Their Conservation and Restoration. J. Appl. Ichtyol. 2006, 22, 17–22. [Google Scholar] [CrossRef]
  14. Pekárik, L.; Ĝ Iamporová-Zať Ovičová, Z.; Arendt, D.; Ĝ Iampor, F. Current Stocking Program of the Sterlet (Acipenser ruthenus, L.) Can Negatively Shape Its Genetic Variability in the Middle Danube. Knowl. Manag. Aquat. Ecosyst. 2019, 420, 19. [Google Scholar] [CrossRef]
  15. Ljubobratović, U.; Bogár, K.; Káldy, J.; Fazekas, G.; Vass, N.; Feledi, T.; Kovács, G. Optimizing the Gonadoliberin Dosage and Evaluating the Egg Quality in the Preseason and Seasonal Artificial Reproduction of Pond-reared Sterlet Acipenser ruthenus. Anim. Reprod. Sci. 2022, 247, 107097. [Google Scholar] [CrossRef] [PubMed]
  16. Kovács, B.; Kovács, G.; Fazekas, G. A Tokfajok Genetikai Háttere és Erőforrásai In A Tokalakúak Biológiája és Tenyésztése; Urbányi, B., Horváth, Á., Eds.; Vármédia Print kft: Gödöllő, Hungary, 2019; pp. 77–107. [Google Scholar]
  17. Kohlmann, K.; Kersten, P.; Gessner, J.; Onara, D.; Taflan, E.; Suciu, R. New Microsatellite Multiplex PCR Sets for Genetic Studies of the Sterlet Sturgeon, Acipenser ruthenus. Env. Biotech. 2017, 13, 11–17. [Google Scholar] [CrossRef]
  18. McQuown, E.C.; Sloss, B.L.; Sheehan, R.J.; Rodzen, J.; Tranah, G.J.; May, B. Microsatellite Analysis of Genetic Variation in Sturgeon: New Primer Sequences for Scaphirhynchus and Acipenser. Trans. Am. Fish. Soc. 2000, 129, 1380–1388. [Google Scholar] [CrossRef]
  19. Welsh, A.B.; Blumberg, M.; May, B. Identification of Microsatellite Loci in Lake Sturgeon, Acipenser fulvescens, and Their Variability in Green Sturgeon. A. medirostris. Molec. Ecol. Notes 2003, 3, 47–55. [Google Scholar] [CrossRef]
  20. May, B.; Krueger, C.C.; Kincaid, H.L. Genetic Variation at Microsatellite Loci in Sturgeon: Primer Sequence Homology in Acipenser and Scaphirhynchus. Can. J. Fish. Aquat. Sci. 1997, 54, 1542–1547. [Google Scholar] [CrossRef]
  21. Zane, L.; Patarnello, T.; Ludwig, A.; Fontana, F.; Congiu, L. Isolation and Characterization of Microsatellites in the Adriatic Sturgeon (Acipenser naccarii). Molec. Ecol. Not. 2002, 2, 586–588. [Google Scholar] [CrossRef]
  22. Henderson-Arzapalo, A.; King, T.L. Novel Microsatellite Markers for Atlantic sturgeon (Acipenser oxyrinchus) Population Delineation and Broodstock Management. Molec. Ecol. Notes 2002, 2, 437–439. [Google Scholar] [CrossRef]
  23. Shimizu, M.; Kosaka, N.; Shimada, T.; Nagahata, T.; Iwasaki, H.; Nagai, H.; Shiba, T.; Emi, M. Universal Fluorescent Labeling (UFL) Method for Automated Microsatellite Analysis. DNA Res. 2002, 9, 173–178. [Google Scholar] [CrossRef]
  24. Peakall, R.; Smouse, P.E. GenALEx 6.5: Genetic Analysis in Excel. Population Genetic Software for Teaching and Research-an Update. Bioinformatics 2012, 28, 2537–2539. [Google Scholar] [CrossRef] [PubMed]
  25. Park, S.D.E. The Excel Microsatellite Toolkit. Trypanotolerance in West African Cattle and the Population Genetic Effects of Selection. Ph.D. Thesis, University of Dublin, Dublin, Ireland, 2001. [Google Scholar]
  26. Van Oosterhout, C.; Hutchinson, W.F.; Wills, D.P.M.; Shipley, P. MICRO-CHECKER: Software for Identifying and Correcting Genotyping Errors in Microsatellite Data. Molec. Ecol. Notes. 2004, 4, 535–538. [Google Scholar] [CrossRef]
  27. Belkhir, K.P.; Borsa, P.; Chikhi, L.; Raufaste, N.; Bonhomme, F. 1996–2004 GENETIX, Version 4.05. Available online: http://kimura.univ-montp2.fr/genetix/ (accessed on 9 April 2024).
  28. Piry, S.; Luikart, G.; Cornuet, J.-M. BOTTLENECK: A Computer Program for Detecting Recent Reductions in the Effective Size Using Allele Frequency Data. J. Heredity 1999, 90, 502–503. [Google Scholar] [CrossRef]
  29. Do, C.; Waples, R.S.; Peel, D.; Macbeth, G.M.; Tillett, B.J.; Ovenden, J.R. NeEstimator v2: Re-implementation of software for the estimation of contemporary effective population size (Ne) from genetic data. Mol. Ecol. Res. 2014, 14, 209–214. [Google Scholar] [CrossRef] [PubMed]
  30. Pritchard, J.K.; Stephens, M.; Donnelly, P. Inference of Population Structure Using Multilocus Genotype Data. Genetics 2000, 155, 945–959. [Google Scholar] [CrossRef] [PubMed]
  31. Evanno, G.; Regnaut, S.; Goudet, J. Detecting the Number of Clusters of Individuals Using the Software STRUCTURE: A Simulation Study. Mol. Ecol. 2005, 14, 2611–2620. [Google Scholar] [CrossRef] [PubMed]
  32. Earl, D.A.; vonHoldt, B.M. STRUCTURE HARVESTER: A Website and Program for Visualizing STRUCTURE Output and Implementing the Evanno Method. Conserv. Genet. Resour. 2012, 4, 359–361. [Google Scholar] [CrossRef]
  33. Jombart, T. Adegenet: A R Package for the Multivariate Analysis of Genetic Markers. Bioinformatics 2008, 24, 1403–1405. [Google Scholar] [CrossRef] [PubMed]
  34. Kaczmarczyk, D.; Fopp-Bayat, D. Assemblage of Spawning Pairs Based on Their Individual Genetic Profiles—As Tool for Maintaining Genetic Variation within Sturgeon Populations. Aquac. Res. 2013, 44, 677. [Google Scholar] [CrossRef]
  35. Fopp-Bayat, D.; Kuzniar, P.; Kolman, R.; Liszewski, T.; Kucinski, M. Genetic Analysis of Six Sterlet Populations—Recommendations for The Plan of Restitution in the Dniester River. Iran.S J. Fish Sci. 2015, 14, 634–645. [Google Scholar]
  36. Østbye, K.; Næsje, T.F.; Bernatchez, L.; Sandlund, O.T.; Hindar, K. Morphological Divergence and Origin of Sympatric Populations of European Whitefish (Coregonus lavaretus L.) in Lake Femund, Norway. J Evol Biol. 2005, 18, 683–702. [Google Scholar] [CrossRef] [PubMed]
Figure 1. Delta K value of the sterlet sample set. The best-supported number of clusters was calculated by using the Evanno et al. method [31].
Fishes 09 00201 g001
Figure 2. STRUCTURE bar plot assigning sterlet stocks to two (panel (A); K = 2) or five clusters (panel (B), K = 5), where the different colors represent the genetic clusters. Each vertical bar represents a single individual; the five respective populations are separated by a black line where each color within an individual representing a fractional assignment to one of the genetic clusters.
Fishes 09 00201 g002
Figure 3. Principal component analysis (PCA) showing the sampled 268 sterlet individuals from Hungary. The x-axis represents 9.7% while the y-axis represents 6.7% of the total variance. Each circle represents a population, and each dot represents an individual.
Fishes 09 00201 g003
Table 1. Summary information of the six duplex microsatellite sets analyzed with observed size ranges, primer sequences and duplex PCR annealing temperatures.
PCR Duplex SetAnnealing TemperatureLocusDyePrimer Sequence 5′-3′Allele Size Range (bp)Number of AllelesPIC Value
1.57 °CAfuG 41NEDTGACGCACAGTAGTATTATTTATG208–274240.92
TGATGTTTGCTGAGGCTTTTC
An20AATAACAATCATTACATGAGGCT162–194150.88
TGGTCAGTTGTTTTTTTATTGAT
2.57 °CAfuG 51VICATAATAATGAGCGTGCTTTCTGTT247–25940.12
ATTCCGCTTGCGACTTATTTA
Aru12AAATAGCATGTTCCCCAGCA187–19430.40
TCCATTGCACTTTTCCTTCTTT
3.57 °CSpl-163PETTGCTTGTAAACTGCCCCACT206–242170.83
CCACATGCAGTTTGAGCTGC
Aru26AAAGCAACAACTCCACCAGG156–18880.48
TGCCTTGTCTACTGTCCGAA
4.60 °CLS-68NEDTTATTGCATGGTGTAGCTAAAC177–245170.91
AGCCCAACACAGACAATATC
Aru13TCCACTTTATTCCGTTGTGG90–150150.79
AGACCGGAATCAAACCCAG
5.60 °CAoxD161VICGTTTGAAATGATTGAGAAAATGC122–162110.70
TGAGACAGACACTCTAGTTAAACAGC
Aru19GCGTGGTGTAAGTGAACCCT206–20820.21
CTTCAATTGTGCTTGGCTCA
6.60 °CAru50PETTGGAAACCAAATTAATTCACAAAA116–14260.47
TGGGATCCTCTGTAGAACAGTCT
Aru18CCTGGAACACGTCCAGTTTT158–16440.15
TGGGTGAATGTTTTGGTGTG
Table 2. Summary of the population genetics analyses of twelve microsatellite loci for farmed, wild and gene bank sterlet populations in Hungary.
PopulationNaNeHoHeFis
Gene Bank9.084.4730.5470.5570.015
Danube8.004.6860.5390.5880.090
Tisza5.833.3930.5950.517−0.163
Farm I5.333.6280.4650.5680.127
Farm II5.833.0280.4940.5310.005
Na—average number of alleles, Ne—average effective number of alleles, Ho—average observed heterozygosity, He—average expected heterozygosity, Fis—average fixation index.
Table 3. Estimated effective sizes of the analyzed populations based on microsatellite DNA.
PopulationsNumber of IndividualsEstimated NeParametric 95%
Confidence Interval for Ne
Gene Bank138107.591.7–109.7
Danube4768.750.9–100.9
Tisza22Infinite108–Infinite
Farm I303823.7–76.3
Farm II3021.515.5–30
Table 4. Pairwise FST divergences between the analyzed sterlet populations based on twelve microsatellites.
Gene BankDanubeTiszaFarm IFarm II
Gene Bank0.000
Danube0.0160.000
Tisza0.0160.0170.000
Farm I0.0670.0660.0910.000
Farm II0.0990.0910.1190.0680.000
Disclaimer/Publisher’s Note: The statements, opinions and data contained in all publications are solely those of the individual author(s) and contributor(s) and not of MDPI and/or the editor(s). MDPI and/or the editor(s) disclaim responsibility for any injury to people or property resulting from any ideas, methods, instructions or products referred to in the content.

