Abstract
The Danjiangkou Reservoir is the water source of the middle route of China’s South-to-North Water Diversion Project, encompassing the Dan Reservoir and Han Reservoir. However, little is known about the ecological functions of this important ecosystem. Based on a survey conducted in 2023 in the Dan Reservoir, a mass balance model was constructed using Ecopath with Ecosim 6.6 software to characterize its food web structure and ecosystem properties. The model consisted of 18 functional groups, including producers, consumers, and detritus, covering the entire process of energy flow in the ecosystem. The outputs indicated that the fractional trophic level of functional groups in the Dan Reservoir ecosystem ranged from 1.00 to 3.50. The ecotrophic efficiencies of the main economic fish species were all less than 0.9, and the ecotrophic efficiencies of phytoplankton and detritus were less than 0.5. There were two main food chains: the detritus food chain (39%) and the grazing food chain (61%). The total energy transfer efficiency between trophic levels was only 6.02%, and there was a significant phenomenon of energy transfer blockage between trophic levels II and V. Analysis of the overall characteristics of the ecosystem revealed that the total primary production to total biomass (67.96619), connectance index (0.274), and Finn’s cycling index (2.856) of the Dan Reservoir ecosystem all indicate that the ecosystem is immature, with low nutrient recycling efficiency and poor resistance to external disturbances. This may be related to the low proportion of silver carp and bighead carp in the reservoir and the unreasonable structure of the fish community. Our results suggest that it is necessary to scientifically adjust the structure of the fish community, enhance the proportion of filter-feeding and omnivorous fish to improve the energy flow efficiency, and promote the maturity and stability of the Dan Reservoir.
Keywords:
Dan Reservoir; Ecopath model; food web; ecosystem function; South-to-North Water Diversion Project Key Contribution:
This study constructed an Ecopath model for the Dan Reservoir to evaluate the ecosystem scale and characteristics. The constructed model suggested that the current fishery structure in the Dan Reservoir is unreasonable, with low primary productivity utilization efficiency and energy transfer efficiency, a simple food web structure, and poor resistance to external interference. Based on this, some fishery management suggestions were proposed, providing a scientific basis for the ecological protection of the Dan Reservoir and the protection of fishery resources in the Yangtze River.
1. Introduction
The Ecopath model, proposed by Polovina in 1984, is based on the principles of trophic dynamics. Initially, it was designed to describe the process of energy flow in production and consumption among various functional groups in the ecosystem food web under equilibrium conditions [1]. In 2005, Christensen et al. [2] developed the software application Ecopath with Ecosim (EwE 3.1) for quantitatively assessing the process of ecosystem energy flow, with the Ecopath model serving as an important module within the EwE software. Through the Ecopath model it is possible to evaluate the impacts of fishing, stock enhancement, and other activities on aquatic ecosystems; to determine the trophic level range and energy conversion efficiency of each functional group; and to understand the proportion of energy in primary producers and detritus and thus to judge the stability and development status of the ecosystem [3]. As a cutting-edge tool for aquatic ecosystem research, the Ecopath model has found widespread application in diverse ecosystems across the globe, such as marine [4,5], lake [6,7], reservoir [8,9], and river [10,11] ecosystems in different regions around the world.
To alleviate the shortage of water resources and spur growth between its north and south, China has implemented one of the world’s largest inter-basin water diversion projects, known as the South-to-North Water Diversion Project, which includes eastern, middle, and western routes [12]. The Danjiangkou Reservoir, the water source of the middle route of the South-to-North Water Diversion Project in China, encompasses the Dan Reservoir in Henan province and the Han Reservoir in Hubei province. It serves as a vital water source for over 20 major and medium-sized cities spread across the provinces of Henan and Hebei, as well as the cities of Beijing and Tianjin, catering to the daily and industrial water needs of a populace exceeding 108 million. The reservoir’s ecological integrity is paramount for ensuring the water security of the receiving regions in the north [13]. Post-impoundment, a total of over 55 billion cubic meters of water has been diverted, and the Danjiangkou Reservoir has witnessed substantial alterations in its fish and plankton populations [14,15,16]. Furthermore, given the ecological significance of fish in maintaining the reservoir’s balance, the implementation of the “Ten-Year Fishing Ban” (TYFB) in January 2021 marks a significant conservation effort. This policy, aimed at allowing the fish populations to recover, mandates a semi-annual closed fishing season with conditional fishing privileges in the interim periods in the Dan Reservoir [17]. The TYFB’s enforcement has reduced human interference, providing a unique opportunity to study the ecosystem’s response to reduced anthropogenic pressure.
However, the efficacy of current management strategies in safeguarding and cultivating fish resources within the Yangtze River Basin, and their impact on the ecosystem’s vitality and stability, remain uncertain. In light of this, this study aimed to address these knowledge gaps by constructing an Ecopath model of the ecosystem in the Dan Reservoir. Using this model, we meticulously analyzed the trophic attributes and energy flow mechanisms and evaluated the developmental and stability statuses of the ecosystem. This comprehensive assessment not only provided insights into the current ecological state but can also inform strategies for the sustainable management of the Danjiangkou Reservoir’s ecosystem.
2. Materials and Methods
2.1. Study Area and Sampling Procedure
The Danjiangkou Reservoir (32°36′–33°48′ N, 110°59′–111°49′ E) lies in the upper middle reaches of the Han River, which is the largest tributary of the Yangtze River. Spanning a water area of 1050 square kilometers with an average water depth of 28 m, it encompasses the Han Reservoir in Hubei and the Dan Reservoir in Henan, making it the second largest artificial lake-type reservoir in China. This study concentrated on the Dan Reservoir located in Henan province, with a water surface area of approximately 506 square kilometers and a perennial water storage level fluctuating between 157 and 170 m. In 2023, seasonal field samplings were conducted in the Dan Reservoir in spring (May), summer (August), autumn (November), and winter (February). Considering the morphological traits and geographical divides of the water body, a total of 13 sampling stations were selected (Figure 1). At each monitoring station, fish, phytoplankton, zooplankton, benthic animals, and detritus were quantitatively sampled and analyzed. Macrophytes were excluded from the model construction because they were only collected in small quantities at site S11. Among them, the fish were collected using three-layer composite gill nets and ground cages, and parameters such as the catch type, quantities, body length, and weight were recorded on site; the phytoplankton and zooplankton were collected using the 25th (mesh 0.064 mm) and 13th (mesh 0.112 mm) plankton nets, respectively, and their biomass (mg/L) was calculated using conventional methods [8]; the benthic animals were collected using a 1/16 m2 Peterson sampler, weighed after classification and identification, and their biomass was calculated based on the opening area of the sampler and the reservoir [18]; the detritus was collected using an organic glass water sampler to collect a 20 L water sample, which was then filtered through the 25th plankton net and a Whatman GF/F filter membrane, weighed, and its biomass was calculated based on the volume of the water body in the Dan Reservoir [19].
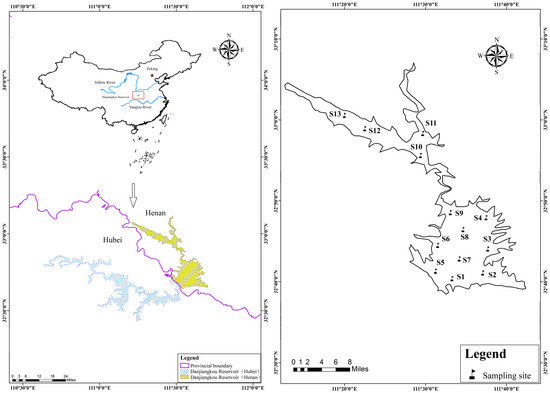
Figure 1.
Location (left) and sampling map (right) of the Dan Reservoir.
2.2. Ecopath Modelling Approach
The Ecopath model meticulously divides the intricate food web into a series of functionally interconnected groups, encompassing detritus, plankton, and a variety of fish species that exhibit parallel ecological characteristics. It is imperative that the sum of these functional components comprehensively encapsulates the entire energetic flow traversing the ecosystem [20]. This model assumes a state of stability among all biological functional groups within the modeled ecosystem, indicating a dynamic equilibrium between the energy inputs and outputs of each functional group. In essence, the production equals the collective predatory mortality, other natural mortality, and outflows. This can be expressed as follows [2]:
where P is the production, Q is the consumption, R is the respiration, and U is undigested food.
P = Q + R + U
This relationship can also be expressed as a linear equation as follows [2]:
where Bi is the biomass of functional group i in t/km2; (P/B)i is the ratio of production to biomass of functional group i; EEi is the trophic conversion efficiency of functional group i, which is generally calculated by the model; (Q/B)j is the ratio of consumption to the biomass of predator j; DCji is the proportion of prey group i in the food composition of predator group j; and EXi is the output of functional group i (including fishing yield and migration volume) in t/km2. Therefore, the basic parameters required for the establishment of the Ecopath model are Bi, (P/B)i, EEi, (Q/B)j, DCji, and EXi. Among them, one of the first four parameters can be unknown and calculated by the model based on other parameters, while DCji and EXi must be input [20].
2.3. Functional Groups
Utilizing the survey data collected in 2023 and taking into account the criteria of dietary habits, ecological niches, and the pivotal roles of the key species within the ecosystem, the Dan Reservoir ecosystem was meticulously categorized into 18 functional groups. These groups encompassed a comprehensive range of producers, consumers, and detritus, comprehensively reflecting the overall structure and energetic flow process within the Dan Reservoir. Producers referred to autotrophic organisms, including phytoplankton; consumers were heterotrophic organisms, including fish, shrimp, benthic animals, and zooplankton; and detritus was the sum total of all non-living organic matter in the system, which included the corpses of dead plants and animals, animal feces, bait residues, and particulate organic matter from the outside that entered rivers or lakes. The specific configuration of these functional groups is outlined in Table 1.

Table 1.
Functional groups and the main species of the Dan Reservoir.
2.4. Data Sources and Parameter Estimation
2.4.1. Biomass (B)
Biomass, also known as current stock, refers to the total amount of a particular species inhabiting a unit area or volume within a defined region at a given instant. It is represented by wet weight (t/km2) in the model. For this model, the biomass of fish was calculated using the empirical relationships of the Ecopath model based on the survey data of the study year [10]; the biomass of shrimp was estimated directly by the Dan Reservoir Fishery Management Department; and the biomasses of phytoplankton, zooplankton, benthic animals, and detritus were calculated by the four seasonal surveys in 2023 [21,22].
2.4.2. Production (P) and P/B Coefficient
Production is the growth of organisms per unit area or volume, expressed in the metric of t/(km2·a) in the model. The P/B coefficient, frequently referred to as the turnover rate of biomass, signifies the proportional relationship between the annual production and the average annual biomass. It is expressed in units of the reciprocal year (1/a). The P/B coefficient can be deduced from the relevant parameters of fish, accessible on http://www.fishbase.org (accessed on 15 January 2024), leveraging the built-in formula within the Ecopath model. The calculation formula is outlined as follows [2]:
where B, Y, F, Z, and M represent the biomass (t/km2), the annual catch yield (t·km−2·a−1), the fishing mortality (a−1), total mortality (a−1), and natural mortality (a−1); k is the coefficient of the von Bertalanffy growth equation; L∞ is the asymptotic total length of the fish (cm); Lmean is the average total length of the fish population (cm); and L′ denotes the average total length of the population entering the fishery (cm). The above parameters could also be readily retrieved from http://www.fishbase.org (accessed on 15 January 2024).
F = Y/B; F = Z − M
Z = P/B = k (L∞ − Lmean)/(Lmean − L′)
P/B coefficients for phytoplankton, zooplankton, and benthic animals referred to the relevant literature [23,24].
2.4.3. Q/B Coefficient
The Q/B coefficient is the ratio of consumption to biomass for a given species within a unit of time, expressed as the reciprocal of the year (1/a) in the model. The Q/B coefficient for fish in this study was derived from an empirical formula [1]. The formula is calculated as follows:
where W∞ is the asymptotic weight of the fish (g); T is the annual mean water temperature at the surface of the water column (°C); T′ is the Kelvin expression of T; A is the caudal fin shape parameter, which is generally assigned a value of 1.32 for most fish species; h is a Boolean-type variable (1 for herbivorous fishes and 0 for other piscivorous fishes); d is a Boolean-type variable (1 for fishes with detrital diet and 0 for other piscivorous fishes); H is the height of the caudal fin of the fish (cm); and a is the caudal fin area (cm2) [2]. The above parameters were combined with the morphological and biological data of the fish and can be obtained from http://www.fishbase.org (accessed on 15 January 2024).
log (Q/B) = 7.964 − 0.204logW∞ − 1.965T′ + 0.083A + 0.532h + 0.398d
T′ = 1000/(T + 273.15)
A = H2/a
Q/B coefficients for zooplankton, benthos, and detritus referred to the relevant literature [23,24,25].
2.4.4. EE (Ecological Efficiency)
EE is the conversion efficiency of the production volume within a functional group [2]. In this study, it was treated as an unknown parameter and was derived from other parameters by debugging the model.
2.4.5. Diet Composition Matrix
At present, research on the feeding habits of fish in the Danjiangkou Reservoir is scarce. Although Xing et al. [26] conducted an analysis on the dietary patterns of six ferocious fish species in the Danjiangkou Reservoir in 1992, the applicability of these findings is diminished by the considerable time elapsed and the ensuing changes in the reservoir’s fishery structure. Consequently, the specific dietary compositions of different functional groups in this study were determined by combining some of the results of this survey with references to the dietary habits of fish in Qiandao Lake, a comparable large deep-water reservoir in China, as well as with relevant data on fish species inhabiting the main canal of the South-to-North Water Diversion Central Line [23,24] (Table 2).
Table 2.
Dietary composition matrix of functional groups in the Dan Reservoir.
2.5. Model Debugging
Model balancing is an iterative process that involves iteratively adjusting input parameters and minimizing unreasonable factors, guided by objective laws and reliable experience. This process ensures that the model achieves a state of equilibrium, accurately reflecting the actual condition of the ecosystem to the utmost extent. Following the input and evaluation of parameters within the Ecopath model, it is common to encounter instances where the EE for one or more functional groups surpasses the threshold of 1. However, it is a fundamental principle that the sum of consumption and harvest for any species must not exceed its production capacity. To rectify this, it is essential to engage in a continuous refinement of parameters such as the P/B, Q/B, and dietary composition matrix, ensuring that the EE values for all functional groups are constrained within the realistic bounds of 0 to 1. In parallel, it is crucial to maintain a balanced state between the inputs and outputs of the ecosystem, ensuring its overall stability and ecological integrity [2].
3. Results
3.1. Trophic Level and Energy Flow Distribution
Upon entering the primary parameters into the Ecopath model and conducting a thorough balancing and debugging process, the outcomes for the Dan Reservoir were methodically generated (Table 3). The food web within the Dan Reservoir demonstrated a spectrum of effective trophic levels, extending from 1 to 3.50. The highest trophic levels were observed in the culter and sinipercine fish functional groups, which registered at 3.50 and 3.49, respectively. The yellow catfish were positioned at a trophic level of 3.01, while omnivorous fish were distributed within the range of 2.46 to 2.77. Filter-feeding fish were found at trophic levels of 2.38 and 2.44, with grass carp at 2.11, benthic animals at 2.27, and zooplankton at 2.0. The ecological efficiencies (EE) of different consumers ranged from 0.67 to 0.89. Primary producers, such as phytoplankton and detritus, showed respective efficiencies of 0.43 and 0.28, In line with previous research, the production to consumption ratio (P/Q) typically resided between 0.05 and 0.3, signifying that for the majority of functional groups, their intake exceeded their production by a factor of 3 to 10. Faster-growing small fish species typically exhibited lower P/Q ratios [25]. Consistent with this general pattern, the P/Q values of the various functional groups in the present study were all below 0.3.
Table 3.
Basic parameters and output of Ecopath model in the Dan Reservoir.
By aggregating trophic levels, the functional groups within the Dan reservoir were categorized into six trophic levels, and the majority of energy flow within this ecosystem was concentrated within trophic levels I–IV (Table 4). The distribution of energy flow within the ecosystem exhibited a gradual decline from the lower to the higher trophic levels, forming a classic pyramid-shaped representation. The energy flows of the first and second trophic levels were 9359 t·km−2·a−1 and 3396 t·km−2·a−1, which translated to 72.1% and 26.1% of the total energy flow. This indicated that the energy flows of low-trophic level consumers in the ecosystem were dominant, while those of high-trophic level consumers were relatively small. The consumption amounts of predators in trophic levels I and II were 3396 t·km−2·a−1 and 225.6 t·km−2·a−1, respectively, accounting for 92.5% and 6.2% of the total food consumption. The total energy flows from trophic levels I and II to detritus were 3146 t·km−2·a−1 and 693.0 t·km−2·a−1, respectively, representing 80.8% and 17.8% of the total flow to detritus, indicating that consumers had a low utilization efficiency of trophic level I, and there was a certain degree of obstruction in the flow of energy from trophic level I to II.
Table 4.
Energy flow in aggregated trophic levels of the Dan Reservoir (t·km−2·a−1).
3.2. Efficiency of Energy Flow and Conversion between Trophic Levels
The Ecopath model provides a powerful means of visualizing the intricate energy flows within an ecosystem through simplified depictions of food web relationships (Figure 2). In this model, the biomass of each functional group is depicted by the size of the circle (t·km−2), while the thickness of the lines interconnecting these groups signifies the magnitude of their predatory interactions. It was evident that the Dan Reservoir primarily included two energy flow pathways: the detritus food pathway and the grazing food pathway. Detritus and phytoplankton were identified as the main energy sources of the Dan Reservoir.
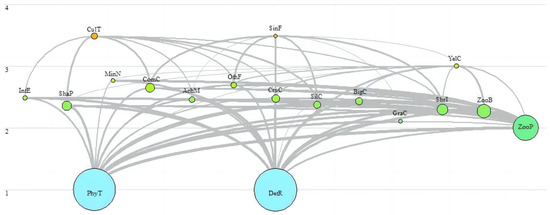
Figure 2.
Food web of the Dan Reservoir. Each functional group is shown as a circle and its size is approximately proportional to its biomass. The numbers demonstrate trophic levels of each functional group. The colors demonstrate different nutritional levels.
The “Lindeman spine” analyses, a methodological contribution from Ulanowicz, streamlined the complexity of the food webs into a straightforward sequence of trophic interactions and facilitated the computation of transfer efficiencies across these levels [27]. According to the Lindeman spine of the Dan Reservoir (Figure 3), this approach revealed a gradual decline in the consumption and output of biological components with each ascending trophic level. The transfer efficiencies between trophic levels II and V were observed to be 6.73%, 3.93%, 9.03%, and 6.25%, respectively, with an average of 6.21% That was lower than the 10% transfer efficiency between trophic levels according to Lindeman’s law [28], suggesting a lower than expected energy transfer rate within the ecosystem. Furthermore, the production of primary producers was approximately 5468 t·km−2·a−1, that of the prey was about 2333 t·km−2·a−1, and the rest entered the detritus. The amount of detritus ingested was 1075 t·km−2·a−1, and the remaining 3892 t·km−2·a−1 left the system and entered the sediment due to mineralization processes.
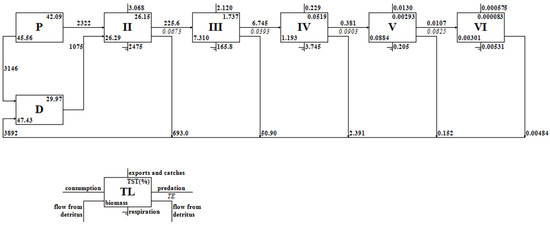
Figure 3.
Lindeman spine showing the aggregation of flow and conversion efficiency through trophic levels in the Dan Reservoir.
As shown in Table 5, approximately 61% of the total energy originated from phytoplankton, with the remaining 39% originating from detritus, indicating that the grazing food chain was the main energy flow pathway of the Dan Reservoir. Additionally, the energy transfer efficiencies of the grazing food chain were higher than that of the detritus food chain at trophic levels II, IV, and V, while that of trophic level III was lower than that of the detritus food chain. At trophic level VI, the energy transfer efficiency of the two food chains was almost equal. A closer examination of the transfer efficiencies between various trophic levels revealed a peak in efficiency between levels IV and V, both exceeding 8%. Conversely, the lowest transfer efficiency was observed between trophic levels III and IV, with both falling below the 5% mark.
Table 5.
Transfer efficiency among aggregated trophic levels in the Dan Reservoir.
3.3. The Overall Characteristics of the Dan Reservoir
The Ecopath model can reflect the scale, maturity, and stability of a system through indicators such as total respiration, total consumption, total output, and detritus flow [2]. The total respiration of the Dan Reservoir was 2644.581 t·km−2·a−1, and the total flow flux was 12,988.45 t·km−2·a−1. Of this, the total flow into the detritus was 3892.074 t·km−2·a−1, accounting for 29.9%. The total production capacity was 5725.961 t·km−2·a−1, the total primary production/total biomass was 67.96619, and the total primary production/total respiration of the system was 2.067. The average trophic level of the catch was 2.61, with the connectivity index and system omnivorous index being 0.274 and 0.271, respectively (Table 6).
The Finn’s cycle index (FCI) refers to the ratio of circulating flow to total flow in the system. The Finn’s mean path length (FML) refers to the average length of each cycle flowing through the food chain. Both of them are indicators of ecosystem maturity. The Finn’s cycle index and average path length of the Dan Reservoir were 2.856% and 2.376%, respectively, both indicating a relatively low level when compared with former studies on other Chinese lakes [29].
Table 6.
General properties of the Dan Reservoir compared to other ecosystems in the Yangtze River Basin.
Table 6.
General properties of the Dan Reservoir compared to other ecosystems in the Yangtze River Basin.
| Parameter | Dan Reservoir | Qiandao Lake [23] | Chaohu Lake [24] | Gehu Lake [25] | Taihu Lake [30] |
|---|---|---|---|---|---|
| Sum of all consumption (t·km−2·a−1) | 3629.178 | 5733.298 | 4486.67 | 2665.828 | 2320.373 |
| Sum of all exports (t·km−2·a−1) | 2822.619 | 5425.390 | 16,796.6 | 2184.73 | 1238.119 |
| Sum of all respiratory flows (t·km−2·a−1) | 2644.581 | 1623.460 | 1308.45 | 829.088 | 799.961 |
| Sum of all flows into detritus (t·km−2·a−1) | 3892.074 | 7330.43 | 18,411.37 | 2892.898 | 3029.265 |
| Total system throughput (t·km−2·a−1) | 12,988.45 | 20,112.58 | 41,003.08 | 8562.544 | 7387.718 |
| Sum of all production (t·km−2·a−1) | 5725.961 | 7341.1 | 17,937.42 | 1974.82 | 2401.587 |
| Mean trophic level of the catch | 2.61 | 2.575 | 2.87 | 2.56 | 2.603 |
| Calculated total net primary production (t·km−2·a−1) | 5467.2 | 7058.526 | 17,703.42 | 1815.238 | 2038.080 |
| Total primary production/total respiration | 2.067322 | 4.348 | 13.53 | 2.189 | 2.548 |
| Total primary production/total biomass | 67.96619 | 109.472 | 137.92 | 3.509 | 15.592 |
| Total biomass/total throughput | 0.006 | 0.003 | 0.003 | 0.060 | 0.018 |
| Total biomass (excluding detritus) (t·km−2) | 80.44 | 64.478 | 128.36 | 517.286 | 130.709 |
| Connectance index | 0.274 | 0.219 | 0.20 | 0.219 | 0.210 |
| System omnivory index | 0.217 | 0.1 | 0.092 | 0.189 | 0.067 |
| Finn’s cycling index (%) | 2.856 | 11.13 | 3.32 | 7.99 | 21.65 |
| Finn’s mean path length | 2.376 | 2.853 | 2.37 | 2.841 | 3.625 |
4. Discussion
4.1. Nutritional Structure and Overall Characteristics of the Dan Reservoir
This study successfully constructed an Ecopath model of the Dan Reservoir using survey data from 2023 and official statistical data from the local authorities of the Dan Reservoir. It preliminarily clarified the system’s food web structure, trophic status, energy distribution, and flow, as well as the overall characteristics of the system. Odum used 24 parameters to describe the maturity and stability of an ecosystem [31], from which the Ecopath model extracted some of the more important parameters for quantification. For instance, in the early stage of development, the system’s production would exceed respiration due to primitive accumulation, resulting in a total primary production/total respiration greater than 1. The more mature the system is, the closer the ratio is to 1 and the more stable and resistant the system is to external shocks [32]. In this model, the total system throughput of the Dan Reservoir was 12,988.45 t·km−2·a−1, lower than the values of Qiandao Lake (20,112.58 t·km−2·a−1) [23] and Chaohu Lake (41,003.08 t·km−2·a−1) [24] but higher than those of Gehu Lake (8562.544 t·km−2·a−1) [25] and Taihu Lake (7387.718 t·km−2·a−1) [30]. The total primary production/total respiration of the system was 2.067, which was lower than the values of Qiandao Lake (4.348) [23], Gehu Lake (2.189) [25], and Taihu Lake (2.548) [32] and higher than that of the Three Gorges Reservoir (1.899) [33] in China. The above two indicators indicate that the Dan Reservoir system is relatively small and doesn’t meet the standards of a mature ecosystem. This could be attributed to the low biomass of phytoplankton, aquatic plants, and other organisms present in the Dan Reservoir, leading to a reduced primary productivity in the system. Consequently, the ecosystem exhibited a smaller scale and a lower level of maturity, potentially limiting its ecological functions and resilience.
In this model, the EEs of major economic fish species such as culter, sharpbelly, silver carp, bighead carp, crucian carp, and grass carp were all above 0.6 but below 0.9, indicating that the fishing pressure affecting the fish population growth was relatively significant. However, the EEs of phytoplankton and debris were relatively low, with neither exceeding 0.5, indicating that only a portion of primary productivity was utilized by high-nutrient level consumers, while the rest entered sediment and exited the nutrient cycle. Possibly due to the absence of structured and extensive breeding and release programs for silver carp and bighead carp in the Dan Reservoir, the current biomass of these species in the reservoir area has remained relatively scant. Consequently, phytoplankton is not being fully and efficiently utilized, leading to a significant amount of energy remaining unused at lower trophic levels. This can potentially give rise to poor material circulation within the system, instability, and a weakened resilience to external disturbances. Simultaneously, the EE values of benthic and planktonic animals were observed to be comparatively high, indicating that benthic and planktonic animals are under greater predation pressure, which is related to the high proportion of carnivorous and omnivorous fish in the Dan Reservoir. In response to this situation, the utilization efficiency of nutrients in the system can be improved by evaluating the breeding capacity of the Dan Reservoir and implementing reasonable proliferation and release measures. The current food web structure of the Dan Reservoir can be optimized to improve the structure and function of the ecosystem.
The mean trophic level of the catch (MTLC) in the Dan Reservoir, which was determined to be 2.61, is a critical indicator reflecting the impact of fishing practices on the ecosystem’s trophic structure. Compared with other ecosystems, the MTLC in the Dan Reservoir was at a relatively high level, surpassing those of freshwater ecosystems such as Taihu Lake (2.60), Qiandao Lake (2.58), and Gehu Lake (2.56) and lower than that of Chaohu Lake (2.87), which may indicate a more pronounced fishing pressure on intermediate trophic levels. The intermediate trophic levels are pivotal in nutrient cycling and energy transfer, and their depletion can lead to a cascade of ecological imbalances and a decline in overall ecosystem health [34]. The low energy transfer efficiency observed between trophic levels II and V, particularly from III to IV, further supported the hypothesis of energy transfer blockage, which may be exacerbated by selective fishing practices [35]. To ensure the sustainability of the fishery and the integrity of the ecosystem, it is crucial to adopt ecosystem-based fisheries management strategies that consider the trophic interactions and the cumulative impacts of fishing across different trophic levels. This approach should also take into account the natural variability and resilience of the ecosystem, as well as the potential for recovery following the implementation of conservation measures [36].
The ratio of total primary production to total biomass (P/B) is a critical metric for assessing the efficiency of energy capture and conversion at the base of the aquatic food web, and it is also a key determinant of the capacity of an ecosystem to support higher trophic levels and is closely linked to the productivity and sustainability of the entire ecosystem [37]. It can be influenced by various factors, including nutrient availability, light conditions, and the presence of grazers or predators that may impact primary producer populations [38]. A high P/B ratio can suggest a productive ecosystem with an abundance of resources. However, it must be balanced against energy transfer efficiencies at higher trophic levels. With a P/B ratio of 67.96619 in the Dan Reservoir, far higher than Taihu Lake (15.592) and Gehu Lake (3.509) but lower than Qiandao Lake (109.472) and Chaohu Lake (137.92), the ecosystem demonstrated a high potential for energy input through photosynthesis by primary producers. The overall energy transfer efficiency of 6.02% in the Dan Reservoir indicated that while there was a significant input of energy at the primary production level, there may be inefficiencies or bottlenecks in the transfer of this energy to higher trophic levels [39]. This may imply that the ecosystem has the potential to support more life but also highlights the need for careful monitoring and sustainable practices to ensure that this productivity is not compromised [40].
The Finn cycling index (FCI) is a metric used to quantify the proportion of energy that is recycled within an ecosystem before being transferred to the next trophic level. In the Dan Reservoir, an FCI of 2.856% indicated a relatively low rate of energy recycling compared to other systems in the Yangtze River Basin, which can reflect the efficiency of energy use within the ecosystem and its maturity (Table 6). A lower FCI suggested that a smaller fraction of the energy was being channeled back into the system through processes such as predation and decomposition, which might imply a less complex or less mature ecosystem. Ecosystems with higher recycling rates are often more resilient to external disturbances and can maintain their functions with fewer external inputs [41]. The low FCI observed in the Dan Reservoir, therefore, might indicate a reliance on external inputs of energy, such as primary production or allochthonous material, to sustain its trophic structure. Moreover, the FCI can be linked to the system’s mean path length (FML), which in the Dan Reservoir was 2.376. A lower FML in conjunction with a low FCI might suggest a more straightforward and less interconnected food web, which could be indicative of a system that is still developing or one that has been simplified by human activities or environmental changes [42].
4.2. Energy Transfer Efficiency of the Dan Reservoir
The inter-nutrient level energy transfer efficiency of the Dan Reservoir was 6.2%. Notably, the efficiencies between trophic levels III and IV were below 5%, lower than in the 1/10 efficiency ecological pyramid proposed by Lindeman, indicating a significant obstruction in the transfer of energy between trophic levels [27]. Li et al. [43] believed that a low transfer efficiency of primary productivity could lead to defects such as structural instability of the ecosystem, susceptibility to algal blooms, and miniaturization of fish. Lun et al. [44] and Bai et al. [45] found a trend of smaller fish sizes in the Dan Reservoir, indirectly confirming the correctness of this model. However, many scholars have observed low system transfer efficiencies in the Ecopath models constructed for reservoirs. For instance, the conversion efficiency between trophic levels Ⅰ and Ⅱ in the Ravishankar Sagar Reservoir was merely 2.4%, and the total conversion efficiency of the system amounted to a mere 6.4% [46]. The conversion efficiency of the Pasak Jolasid Reservoir between trophic levels I and II was 2%, and the total conversion efficiency of the system was 5.3% [47]. The results of this study revealed that consumers occupying higher trophic levels exhibited greater conversion efficiency. However, owing to the comparably minute proportion of biomass attributed to these high-nutrient level consumers, the overall conversion efficiency of the ecosystem remained unsatisfactorily low. Panikkar [48] suggested that a lower transfer efficiency between different trophic levels in the food web may be related to lower EE values in each functional group. The results of this study indicated that the nutrient transfer efficiency (EE) of phytoplankton was only 0.42, further indicating the irrationality of the current fishery structure in the Dan Reservoir.
Jørgensen [49] indicated that the amount of recycling in mature ecosystems accounted for a significant proportion of the internal circulation of the ecosystems. The connectivity index (CI) and the system omnivorous index (SOI) are indicators that reflect the complexity of the connections between various food chains within a system. Furthermore, the Finn’s cycle index (FCI) and Finn’s mean path length (FML) are indicators that reflect the system’s recycling characteristics. In this study, the CI, SOI, FCI, and FML were 0.274, 0.217, 2.856%, and 2.376, respectively. In comparison to other reservoirs in China, the indices in the Dan Reservoir were consistently lower [23,25,50], suggestive of a simpler connectivity between its food webs, a lower recycling efficiency, and an immature stage of ecosystem development.
4.3. Strategies for Ecosystem-Based Management in the Dan Reservoir
In natural ecosystems, the ongoing development of ecosystems will lead to a continuous accumulation of biomass at higher trophic levels, resulting in an increasingly intricate food web structure. Concurrently, as detritus food chains proliferate, the system’s recycling flux intensifies, gradually propelling the system to maturity and stability. However, artificial ecosystems, due to a high degree of human intervention and a specific functional orientation, possess uncertain developmental trajectories. Therefore, how to maintain a balance between system stability and serving humanity remains a subject deserving of profound exploration [19]. Inter-basin water transfer has become one of the most controversial water resource management methods in the world due to its potential impact on ecosystems [51]. Since the launch of the middle route of the South-to-North Water Diversion Project, there has been a notable absence of a comprehensive management and development plan for fishery resources in the Dan Reservoir, which has led to an overall decline in fishery resources within the reservoir [15,35,45]. However, the findings of this study revealed that, since the implementation of the “Ten-Year Fishing Ban” policy in the Yangtze River Basin in 2021, fishery resources have exhibited signs of recovery (unpublished data). Additionally, the Ecopath model of the Dan Reservoir indicated that the ecosystem was in a developing “juvenile” stage, and a significant portion of the energy generated by primary producers flowed towards detritus, which has not been effectively utilized. The food web structure of the Dan Reservoir was relatively uncomplicated, characterized by low nutrient transfer and recycling efficiencies, rendering it susceptible to external disturbances and possessing limited recovery capabilities.
Given the aforementioned situation, two suggestions have been proposed for enhancing water quality protection and fishery resource management in the Dan Reservoir. Firstly, addressing the current low utilization and nutrient transformation efficiency of plankton in the Dan Reservoir, increasing the proliferation and release rates of filter feeding fish, such as silver carp and bighead carp, as well as omnivorous fish, is recommended. This measure is aimed to enhance the utilization efficiency of primary productivity and mitigate the risk of water quality degradation caused by algae blooms. Especially during the summer, when upstream water carried a heavy nutrient load, silver carp and bighead carp were effective in controlling excessive algal growth, thus playing a crucial role in maintaining the water quality. Secondly, given the current dearth of research on the food web structure and ecosystem characteristics of the Dan Reservoir, constructing Ecopath models of different periods based on comprehensive environmental monitoring and biological surveys is advised to gain an in-depth understanding of the developmental process of the Dan Reservoir’s ecosystem. In conjunction with the Ecosim model, simulating the developmental trends of the Dan Reservoir under various management measures will provide a more comprehensive reference for accurately assessing the impact of dynamic water allocation on the ecosystem.
5. Conclusions
To thoroughly understand the complex structure of nutrient levels, as well as the attributes and functionalities of the ecosystem, a customized Ecopath model was developed for the Dan Reservoir. As a key water source for a globally significant, large-scale water diversion project, the Danjiangkou Reservoir is still in its nascent stages, making it highly susceptible to external disturbances. Notably, the utilization efficiency of phytoplankton and detritus is substandard, indicating a rudimentary level of connectivity among food webs. Additionally, there is a more prominent blockage in energy transfer between trophic levels, leading to a low recycling efficiency. Consequently, an overabundance of nutrients fails to circulate through higher trophic levels of the food chain. To address these challenges, strategic measures such as proliferation and release can be implemented to fine-tune and enhance the fish community structure. This can improve the efficiency of material and energy cycling, bolster the stability and maturity of the ecosystem, and ultimately enhance the functionality of the Danjiangkou Reservoir.
Author Contributions
Conceptualization, Y.Z. and Q.L.; data curation, K.G., X.W. and J.Z.; formal analysis, Y.Z. and K.G.; funding acquisition, Y.Z., Z.H. and Q.L.; writing—original draft, Y.Z. and J.D.; writing—review and editing, Y.Z. and Q.L. All authors have read and agreed to the published version of the manuscript.
Funding
This work was funded by the National Natural Science Foundation of China (32172995) and Henan Provincial Department of Science and Technology Research Project (202102110382).
Institutional Review Board Statement
This research was authorized by Shanghai Ocean University’s Institutional Animal Care and Use Committee (IACUS) (Shanghai, China). Approval Code: SHOW-DW-2021-056.
Informed Consent Statement
Not applicable.
Data Availability Statement
Data are contained within the article.
Conflicts of Interest
The authors declare no conflicts of interest.
References
- Polovina, J.J. Model of a coral reef ecosystem. Coral Reefs 1984, 3, 1–11. [Google Scholar] [CrossRef]
- Christensen, V.; Walters, C.J.; Pauly, D. Ecopath with Ecosim: A User’s Guide; University of British Columbia: Vancouver, BC, Canada, 2005; Volume 12, 154p. [Google Scholar]
- Janjua, M.Y.; Tallman, R.F. A mass-balanced Ecopath model of Great Slave Lake to support an ecosystem approach to fisheries management: Preliminary Results. Can. Tech. Rep. Fish. Aquat. Sci. 2015, 3138, vi+32 p. [Google Scholar]
- Gorokhova, E.; Hansson, S.; Höglander, H.; Andersen, C.M. Stable isotopes show food web changes after invasion by the predatory cladoceran Cercopagis pengoi in a Baltic Sea bay. Oecologia 2005, 143, 251–259. [Google Scholar] [CrossRef]
- Faye, D.; Morais, T.D.; Raffray, J.; Sadio, O.; Thiaw, O.T.; Le Loc’h, F. Structure and seasonal variability of fish food webs in an estuarine tropical marine protected area (Senegal): Evidence from stable isotope analysis. Estuar. Coast. Shelf Sci. 2011, 92, 607–617. [Google Scholar] [CrossRef]
- Hossain, M.M.; Matsuishi, T.; Arhonditsis, G. Elucidation of ecosystem attributes of an oligotrophic lake in Hokkaido, Japan, using Ecopath with Ecosim (EwE). Ecol. Model. 2010, 221, 1717–1730. [Google Scholar] [CrossRef]
- Song, G.; Hu, M.H.; Liu, Q.G. Study on the feeding habits and trophic levels of the gillnet catches of Qiandao Lake in autumn by stable isotope technology. Shanghai Ocean Univ. 2014, 23, 117–122. [Google Scholar]
- Hu, Z.J.; Shi, X.H.; Wu, H.; Li, Y.L.; Li, X.X.; Chen, L.Q.; Liu, Q.G. Food Web Structure in Qingcaosha Reservoir of Shanghai, China. J. Hydroecol. 2019, 40, 47–54. [Google Scholar]
- Abobi, S.M. Fisheries Assessment and Trophic Modelling of Tono, Bontanga and Golinga Reservoirs, Ghana. Ph.D. Thesis, University of Bremen, Bremen, Germany, 2020. [Google Scholar]
- Christensen, V.; Pauly, D. ECOPATH II-a software for balancing steady-state ecosystem models and calculating network characteristics. Ecol. Model. 1992, 61, 169–185. [Google Scholar] [CrossRef]
- Sinnickson, D.; Chagaris, D.; Allen, M. Exploring Impacts of River Discharge on Forage Fish and Predators Using Ecopath With Ecosim. Front. Mar. Sci. 2021, 8, 689950. [Google Scholar] [CrossRef]
- Zhuang, W. Eco-environmental impact of inter-basin water transfer projects: A review. Environm. Sci. Pollut. Res. 2016, 23, 12867–12879. [Google Scholar] [CrossRef]
- Zhang, W.W.; Gao, S.S.; Li, M.L.; Chen, Y.; Nicola, F.; Robert, C.; Li, Y.Y.; Chen, Z.J. Vertical Distribution Characteristics and Driving Factors of Bacterioplankton and Nitrogen Phosphorus Cycle Genes in Danjiangkou Reservoir. Environ. Sci. 2023, 1–17. Available online: https://link.oversea.cnki.net/doi/10.13227/j.hjkx.202307255 (accessed on 10 February 2024).
- Pan, Y.D.; Guo, S.J.; Li, Y.Y.; Yin, W.; Qi, P.C.; Shi, J.W.; Hu, L.Q.; Li, B.; Bi, S.G.; Zhu, J.Y. Effects of water level increase on phytoplankton assemblages in a drinking water reservoir. Water 2018, 10, 256. [Google Scholar] [CrossRef]
- Liao, C.S.; Xiong, M.T.; Yin, Z.; Liu, J.S. Studies on the Fishery Fishing and Community Structure of Fish in the Danjiangkou Reservoir. Anhui Agric. Sci. 2018, 46, 87–90. [Google Scholar]
- Gao, D.; Wang, G.T.; Xi, B.W.; Yao, W.J.; Nie, P. A New Species of Allocreadium (Trematoda: Allocreadiidae) from Freshwater Fishes in the Danjiangkou Reservoir in China. J. Parasitol. 2008, 94, 176–180. [Google Scholar] [CrossRef] [PubMed]
- Wang, H.; Wang, P.; Xu, C.; Sun, Y.; Shi, L.; Zhou, L.; Jeppesen, E.; Chen, J.; Xie, P. Can the “10-year fishing ban” rescue biodiversity of the Yangtze River? Innovation 2022, 3, 100235. [Google Scholar] [CrossRef] [PubMed]
- Zhang, M.; Shao, M.L.; Cai, Q.H.; Xu, Y.Y.; Wang, L.; Kong, L.H. Macroinvertebrate community structure and the biological assessment to the water quality of the Danjiangkou Reservoir. J. Lake Sci. 2010, 22, 281–290. [Google Scholar]
- Liu, Q.G. Aquatic Environmental Protection Oriented Fishery in Lake Qiandaohu and Its Influences on Lake Ecosystem; East China Normal University: Shanghai, China, 2005. [Google Scholar]
- McGregor, M.A. Using Ecopath Modeling to Describe Historical Conditions for a Large, Boreal Lake Ecosystem prior to European Settlement. N. Am. J. Fish. Manag. 2014, 34, 16–29. [Google Scholar] [CrossRef]
- Xie, B.; Zhou, X.; Huang, L.; Zheng, X.; Du, J.; Yu, W.; Chen, G.; Hu, W.; Gao, S. The ecological functions and risks of expansive bivalve-macroalgae polyculture: A case study in Sansha Bay, China. Aquaculture 2022, 560, 738549. [Google Scholar] [CrossRef]
- Tang, J.F.; Xiao, X.Z.; Wang, Y.C.; Hu, S.; Wang, Y. Ecosystem structure and function of the main channel of the middle route of south-north water diversion project. China Environ. Sci. 2020, 40, 5391–5402. [Google Scholar]
- Deng, Y.; Zheng, Y.C.; Chang, J.B. Evaluation of the effect of stocking silver carp and bighead carp on the ecosystem of Qiandao Lake using Ecopath model. Acta Ecol. Sin. 2022, 42, 6853–6862. [Google Scholar]
- Liu, E.S.; Li, Y.K.; Zang, R.W.; Wang, H. A preliminary analysis of the ecosystem structure and functioning of Lake Chaohu based on Ecopath model. J. Fish. China 2014, 38, 417–425. [Google Scholar]
- Jia, P.Q.; Hu, Z.J.; Wu, Z.; Liu, Q.G. Quantitative analysis on the structure and function of the Gehu lake ecosystem based on ecopath model. Resour. Environ. Yangtze Basin 2010, 2, 1169–1179. [Google Scholar]
- Xing, D.Y.; Yang, G.R. The feeding habits of six fierce fish species in Danjiangkou Reservoir. Reserv. Fish. 1992, 3, 10–14. [Google Scholar]
- Ulanowicz, R.E. Ecosystem trophic foundations: Lindeman exonerate. In Evolution, Order and Complexity; Routledge: London, UK, 1995. [Google Scholar]
- Janjua, M.Y.; Gerdeaux, D. Preliminary trophic network analysis of subalpine Lake Annecy (France) using an Ecopath model. Knowl. Manag. Aquat. Ecosyst. 2009, 2, 1–18. [Google Scholar] [CrossRef][Green Version]
- Guo, C.B.; Chen, Y.S.; Li, W.; Xie, S.G.; Lek, S. Food web structure and ecosystem properties of the largest impounded lake along the eastern route of China’s South-to-North Water Diversion Project. Ecol. Inform. Int. J. Ecoinform. Comput. Ecol. 2018, 43, 174–184. [Google Scholar] [CrossRef]
- Zhao, X.H.; Xu, D.P.; Ren, L.; Xu, P. Assessment of the ecological carrying capacity of silver and bighead carp in the Taihu Lake based on Ecopath model. J. Fish. Sci. China 2021, 28, 785–795. [Google Scholar]
- Odum, E.P. The Strategy of Ecosystem Development. Science 1969, 164, 262–270. [Google Scholar] [CrossRef]
- Ulanowicz, R.E. Growth and Development:Ecosystems Phenomenology. Q. Rev. Biol. 1987, 62, 337–338. [Google Scholar]
- Han, R.; Chen, Q.; Wang, L.; Tang, X. Preliminary investigation on the changes in trophic structure and energy flow in the Yangtze estuary and adjacent coastal ecosystem due to the Three Gorges Reservoir. Ecol. Inform. 2016, 36, 152–161. [Google Scholar] [CrossRef]
- Duarte, C.M.; Lenton, T.M.; Winder, M.; Sommer, U. Regime shifts in marine ecosystems: Detection, dynamics, and early warnings. Philos. Trans. R. Soc. B Biol. Sci. 2015, 370, 20130263. [Google Scholar]
- Hornborg, L.K.; Bouwman, A.F.; Beusen, A.H.W.; Slomp, C.P. Global environmental consequences of human modification of nitrogen and phosphorus flows through the Holocene. Biogeosciences 2014, 11, 345–360. [Google Scholar]
- Garibaldi, L.; Dearing, J.A. Ecosystem-based fisheries management in a human-dominated world. Curr. Opin. Environ. Sustain. 2016, 21, 74–81. [Google Scholar]
- Baird, D.; Ulanowicz, R.E. The seasonal dynamics of an estuarine ecosystem: A network approach. Estuar. Coast. Shelf Sci. 2017, 194, 176–186. [Google Scholar]
- Duarte, C.M.; Regaudie, D.; Cole, J.J. The role of aquatic vegetation in the coastal carbon sink. Ecology 2013, 94, 771–777. [Google Scholar]
- Post, E.; Pedersen, C.; Wilmers, C.C.; Forchhammer, M.C. Phenological responses to climate change in an Arctic ungulate. Glob. Chang. Biol. 2013, 19, 3003–3012. [Google Scholar]
- Halpern, B.S.; Frazier, M.; Potapenko, J.; Casey, K.S.; Koeve, W.; Longo, C.; Lowndes, J.S.; Rockwood, R.C.; Selig, E.R.; Selkoe, K.A.; et al. Spatial and temporal changes in cumulative human impacts on the world’s ocean. Nat. Commun. 2015, 6, 7615. [Google Scholar] [CrossRef] [PubMed]
- Anderson, T. Ecosystem resilience and the role of energy cycling. Ecol. Complex. 2011, 8, 262–266. [Google Scholar]
- Ulanowicz, R.E.; Abarca-Arenas, L. An informational perspective on ecosystem development and health. Ecol. Model. 2017, 343, 14–23. [Google Scholar]
- Li, Y.K.; Liu, E.S.; Wang, H.; Gong, Y. Analysis on the ecosystem structure and function of Lake Taihu based on Ecopath model. Chin. J. Appl. Ecol. 2014, 25, 2033–2040. [Google Scholar]
- Lun, F.; Zhou, B.X.; Li, Z.; Wang, C.X.; Li, Y.Y. Investigation of fish resources in Danjiangkou Reservoir in Henan province. J. Henan Agric. Sci. 2016, 45, 150–155. [Google Scholar]
- Bai, J.P.; Huang, G.; Jiang, C.J.; Zhang, W.C.; Wang, Q.D.; Yao, L.G. Characteristics and historical changes of the fish assemblage in the Danjiangkou Reservoir. Biodivers. Sci. 2020, 28, 1202–1212. [Google Scholar] [CrossRef]
- Thapanand, T.; Jutagatee, T.; Wongrat, P.; Lekcholayut, T.; Meksumpun, C.; Janekitkarn, S.; Rodloi, A.; Moreau, J.; Wongrat, L. Trophic relationships and ecosystem characteristics in a newly-impounded man-made lake in Thailand. Fish. Manag. Ecol. 2009, 16, 77–87. [Google Scholar] [CrossRef]
- Parnell, A.C.; Inger, R.; Bearhop, S.; Jackson, A.L.; Rands, S. Source Partitioning Using Stable Isotopes: Coping with Too Much Variation. PLoS ONE 2010, 5, e9672. [Google Scholar] [CrossRef]
- Panikkar, P.; Khan, M.F.; Desai, V.R.; Shrivastava, N.P.; Sharma, A.P. Characterizing trophic interactions of a catfish dominated tropical reservoir ecosystem to assess the effects of management practices. Environ. Biol. Fishes 2015, 98, 237–247. [Google Scholar] [CrossRef]
- Jørgensen, S.E.; Patten, B.C.; Straškraba, M. Ecosystems emerging: 4. growth. Ecol. Model. 2000, 126, 249–284. [Google Scholar] [CrossRef]
- Zhou, Z.; Huang, Y.B.; Wang, B.L.; Mi, W.J.; Song, Q.Y.; Xu, Y.Z.; Bi, Y.H. The analysis of food web structure in the area in front of the Three Gorges Dam using the stable isotope technology. Ecol. Sci. 2020, 39, 82–90. [Google Scholar]
- Zhang, L.; Li, S.; Loáiciga, H.A.; Du, Y. Opportunities and challenges of interbasin water transfer: A literature review with bibliometric analysis. Scientometrics 2015, 105, 279–294. [Google Scholar] [CrossRef]
Disclaimer/Publisher’s Note: The statements, opinions and data contained in all publications are solely those of the individual author(s) and contributor(s) and not of MDPI and/or the editor(s). MDPI and/or the editor(s) disclaim responsibility for any injury to people or property resulting from any ideas, methods, instructions or products referred to in the content. |
© 2024 by the authors. Licensee MDPI, Basel, Switzerland. This article is an open access article distributed under the terms and conditions of the Creative Commons Attribution (CC BY) license (https://creativecommons.org/licenses/by/4.0/).