
Compatibilities of Cyprinus carpio with Varied Colors of Robotic Fish


 , and
, and
Abstract
1. Introduction
2. Materials and Methods
2.1. Materials
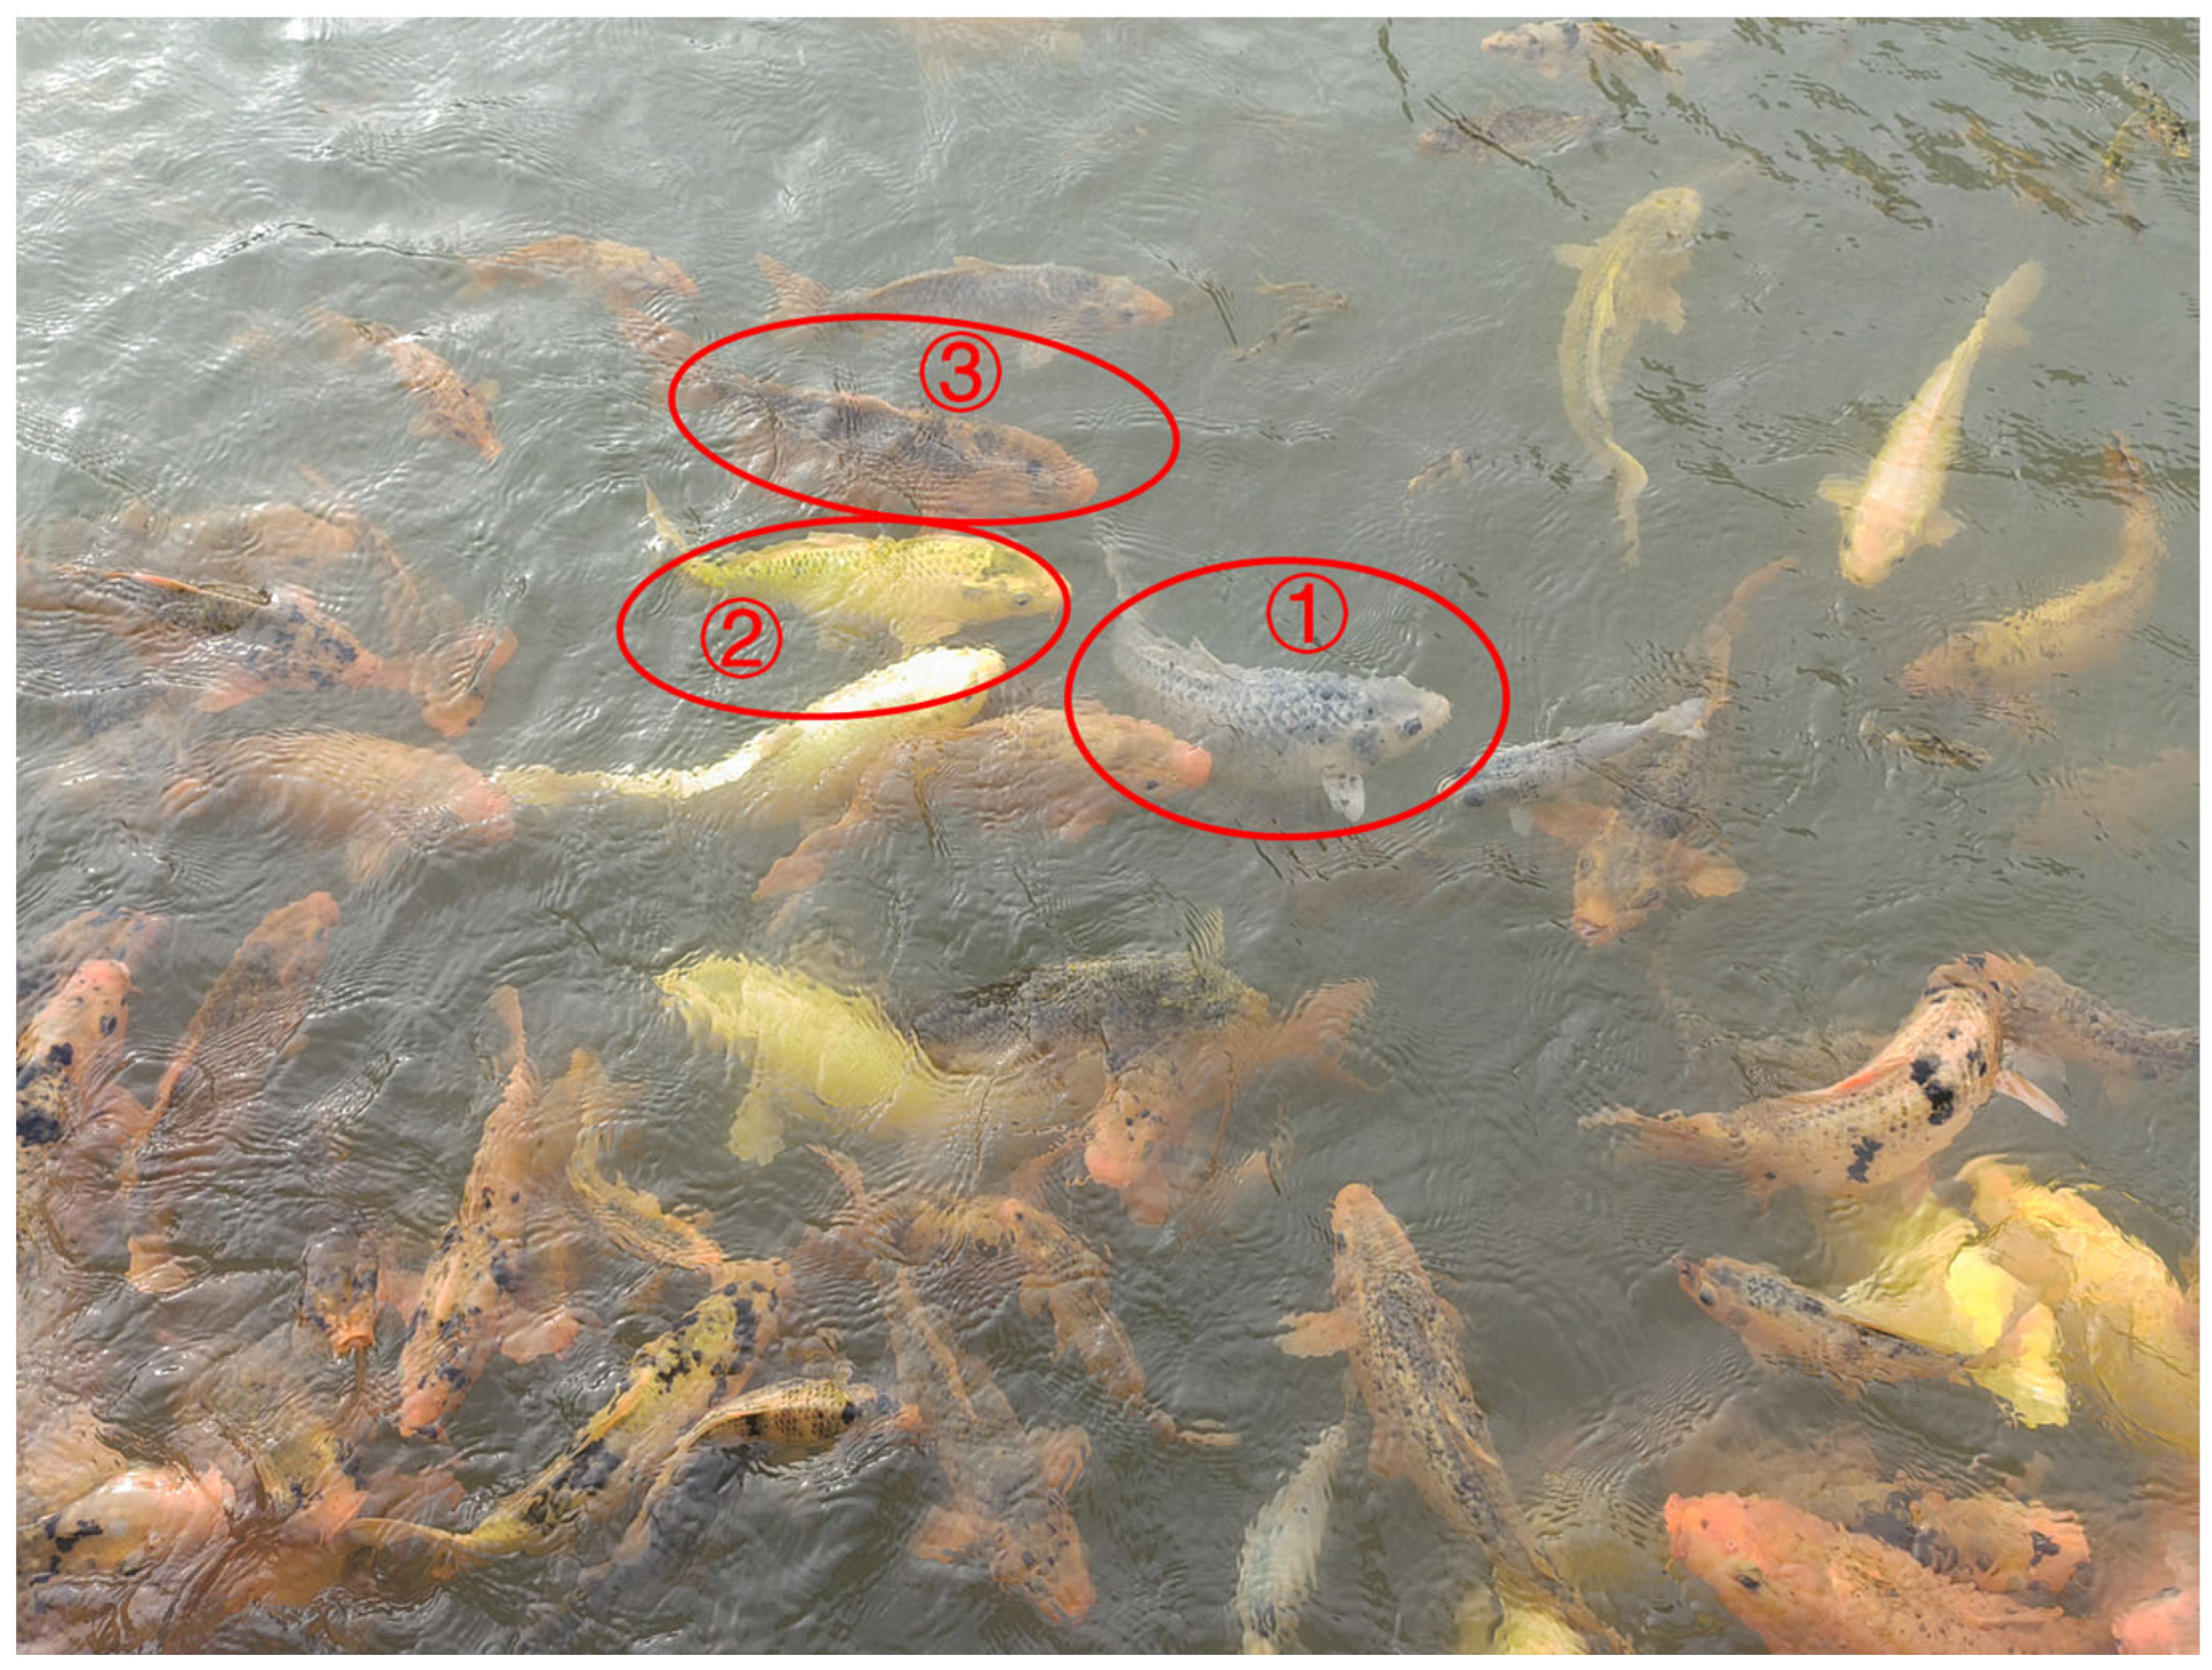
2.1.1. Animals
2.1.2. Bioinspired Robotic Fish
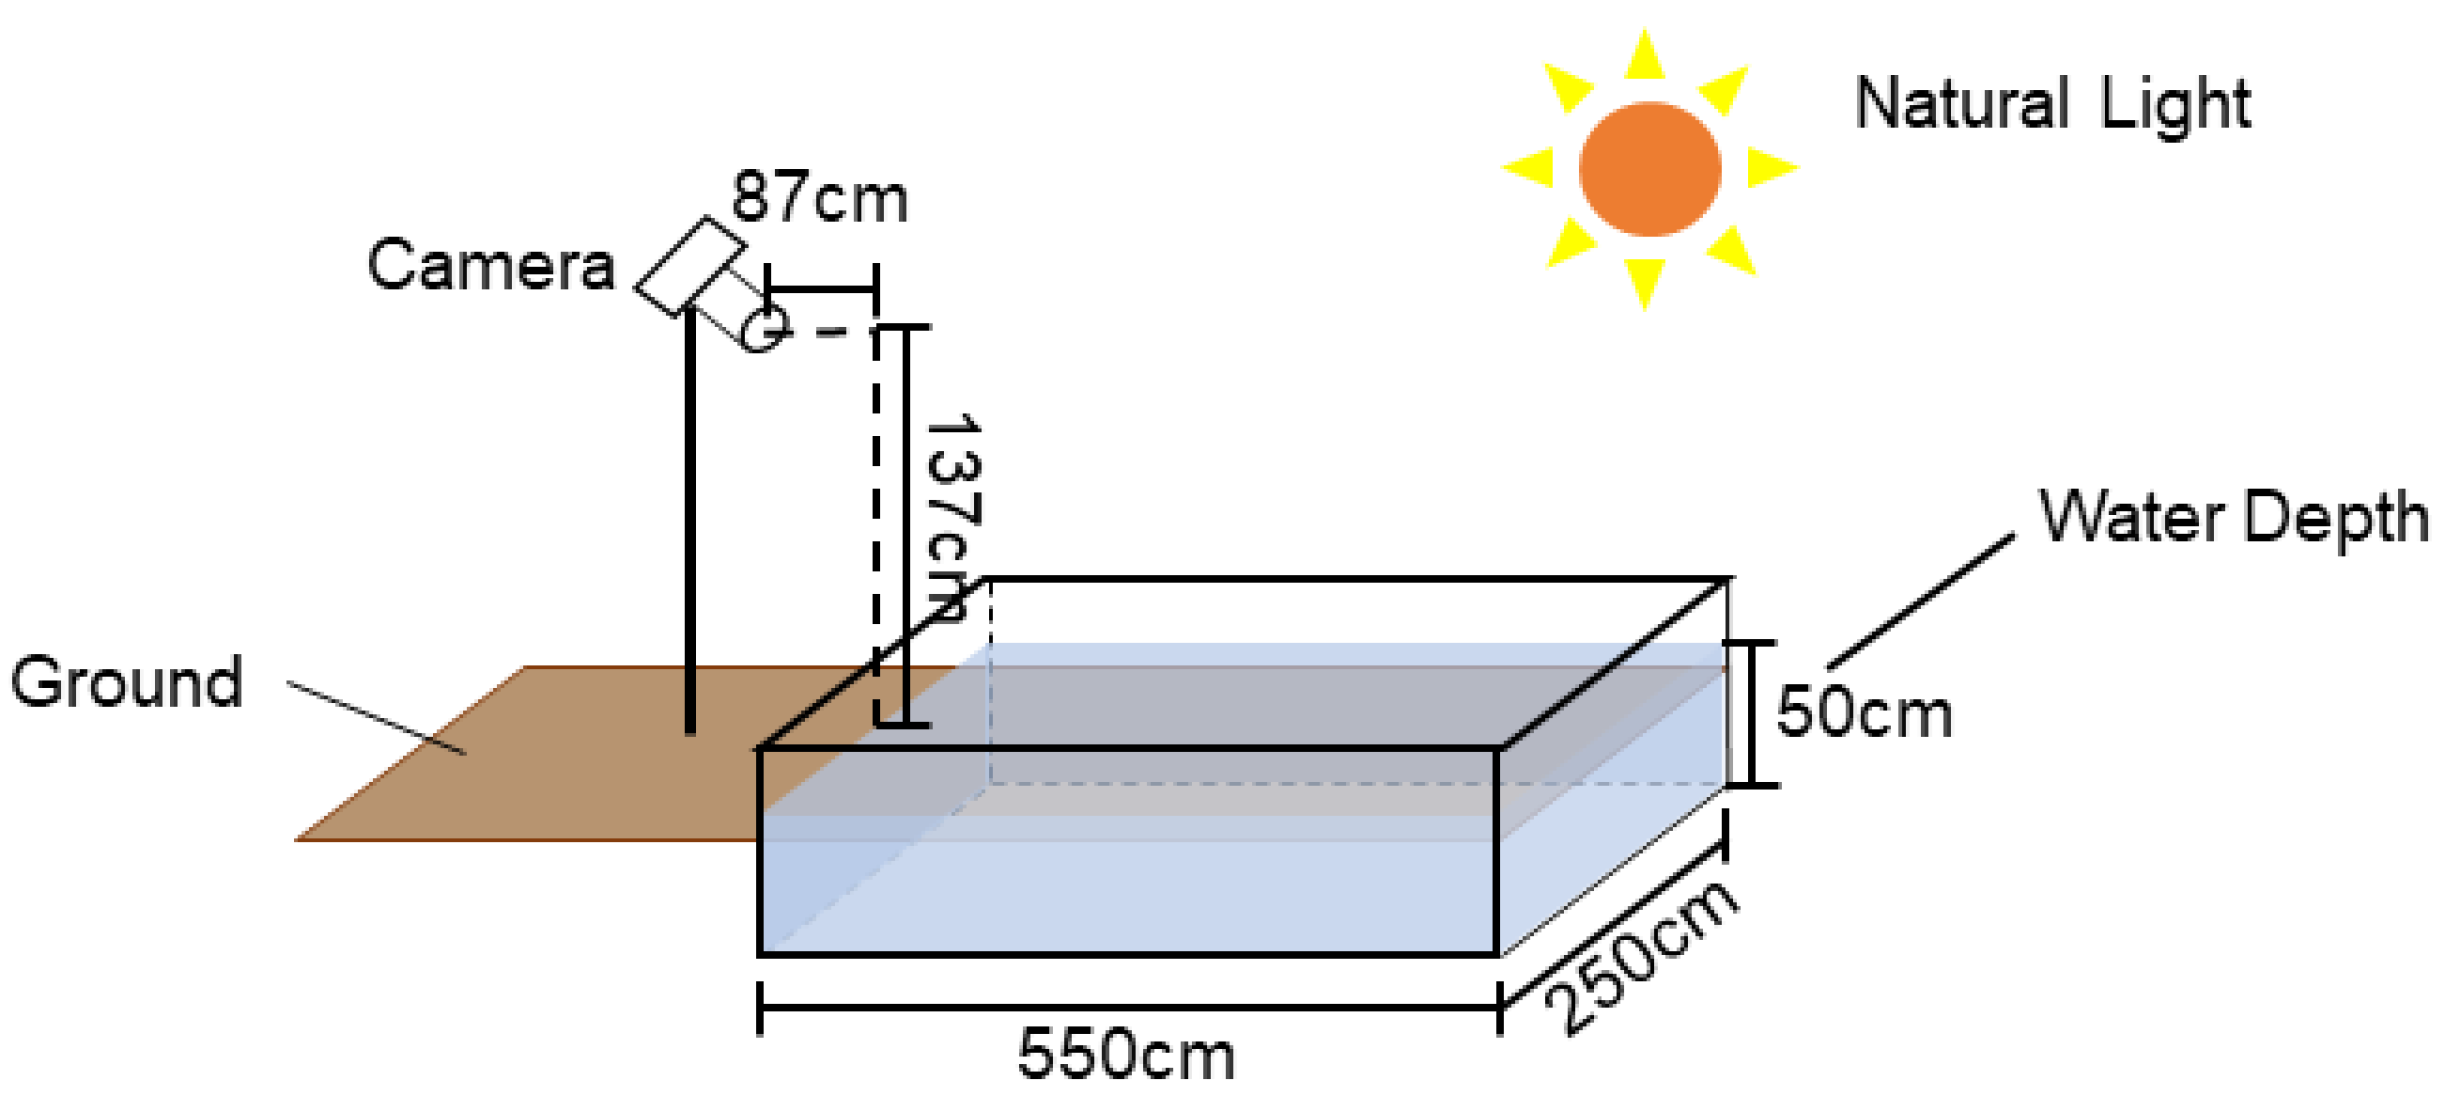
2.1.3. Apparatus
2.2. Methods
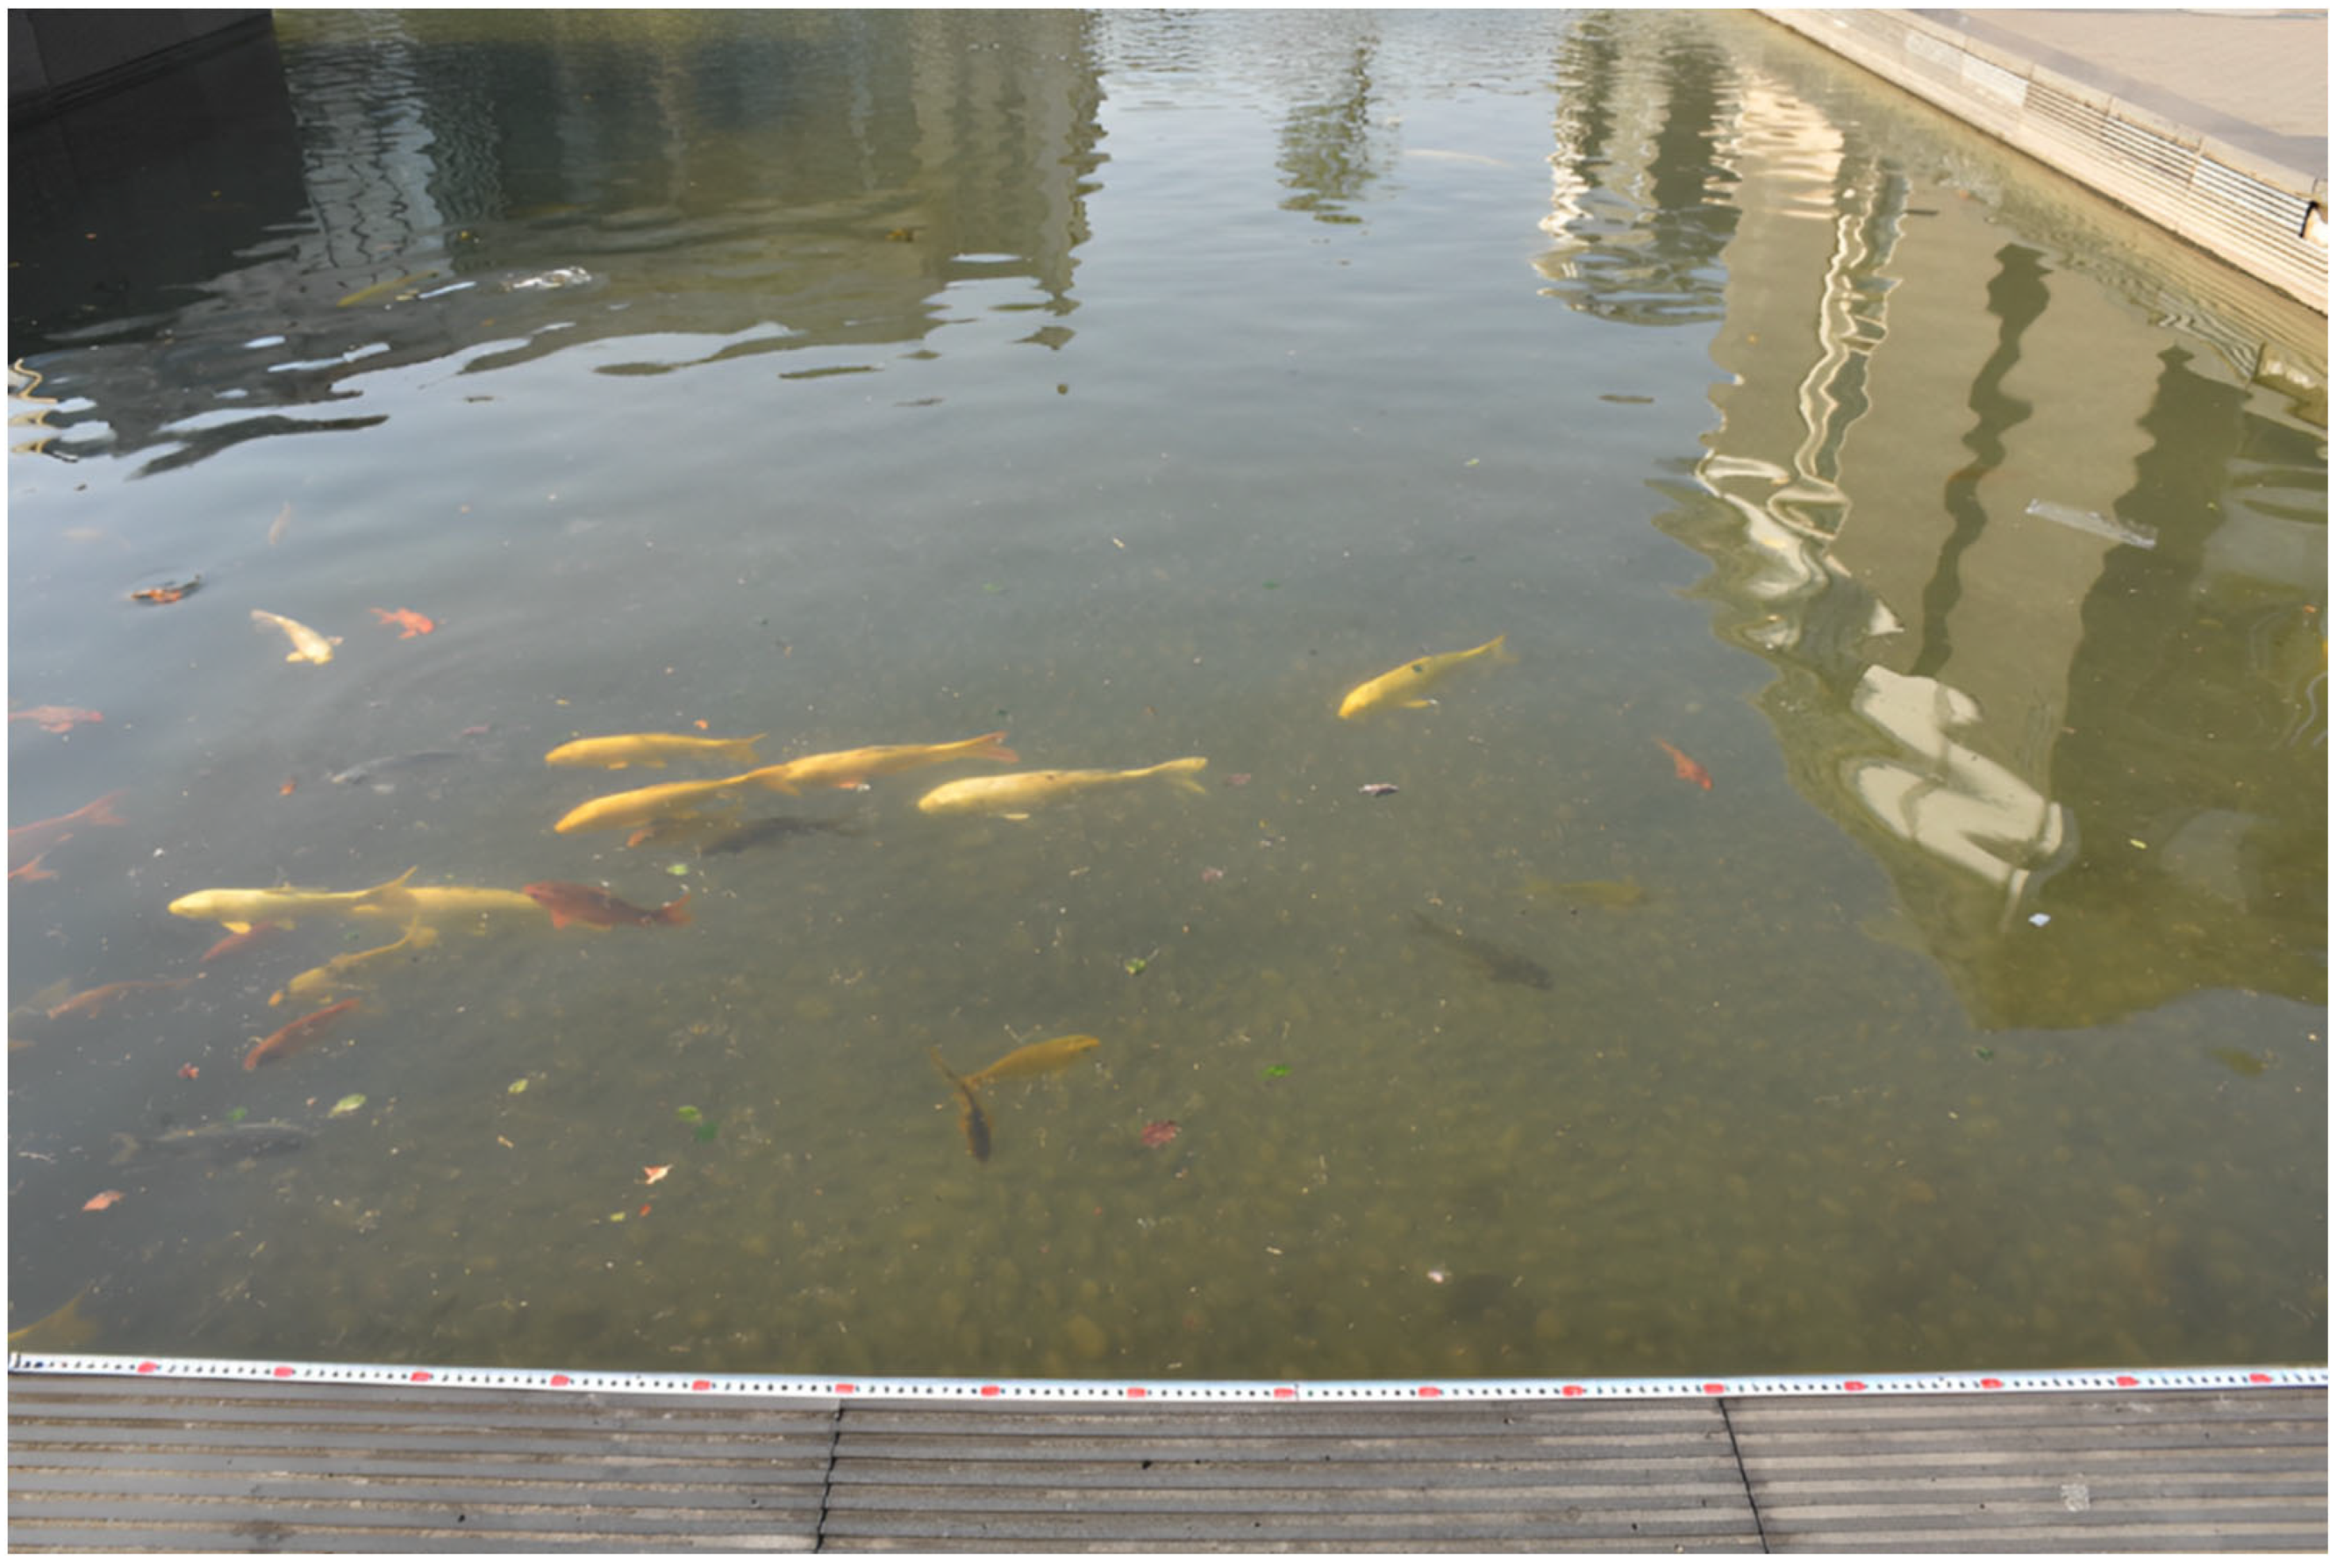
2.2.1. Experimental Operation
2.2.2. Image Correction
2.2.3. Experimental Data Extraction
2.2.4. Visible Light Underwater Attenuation Law
2.2.5. Data Acquisition of Carp Population Variation
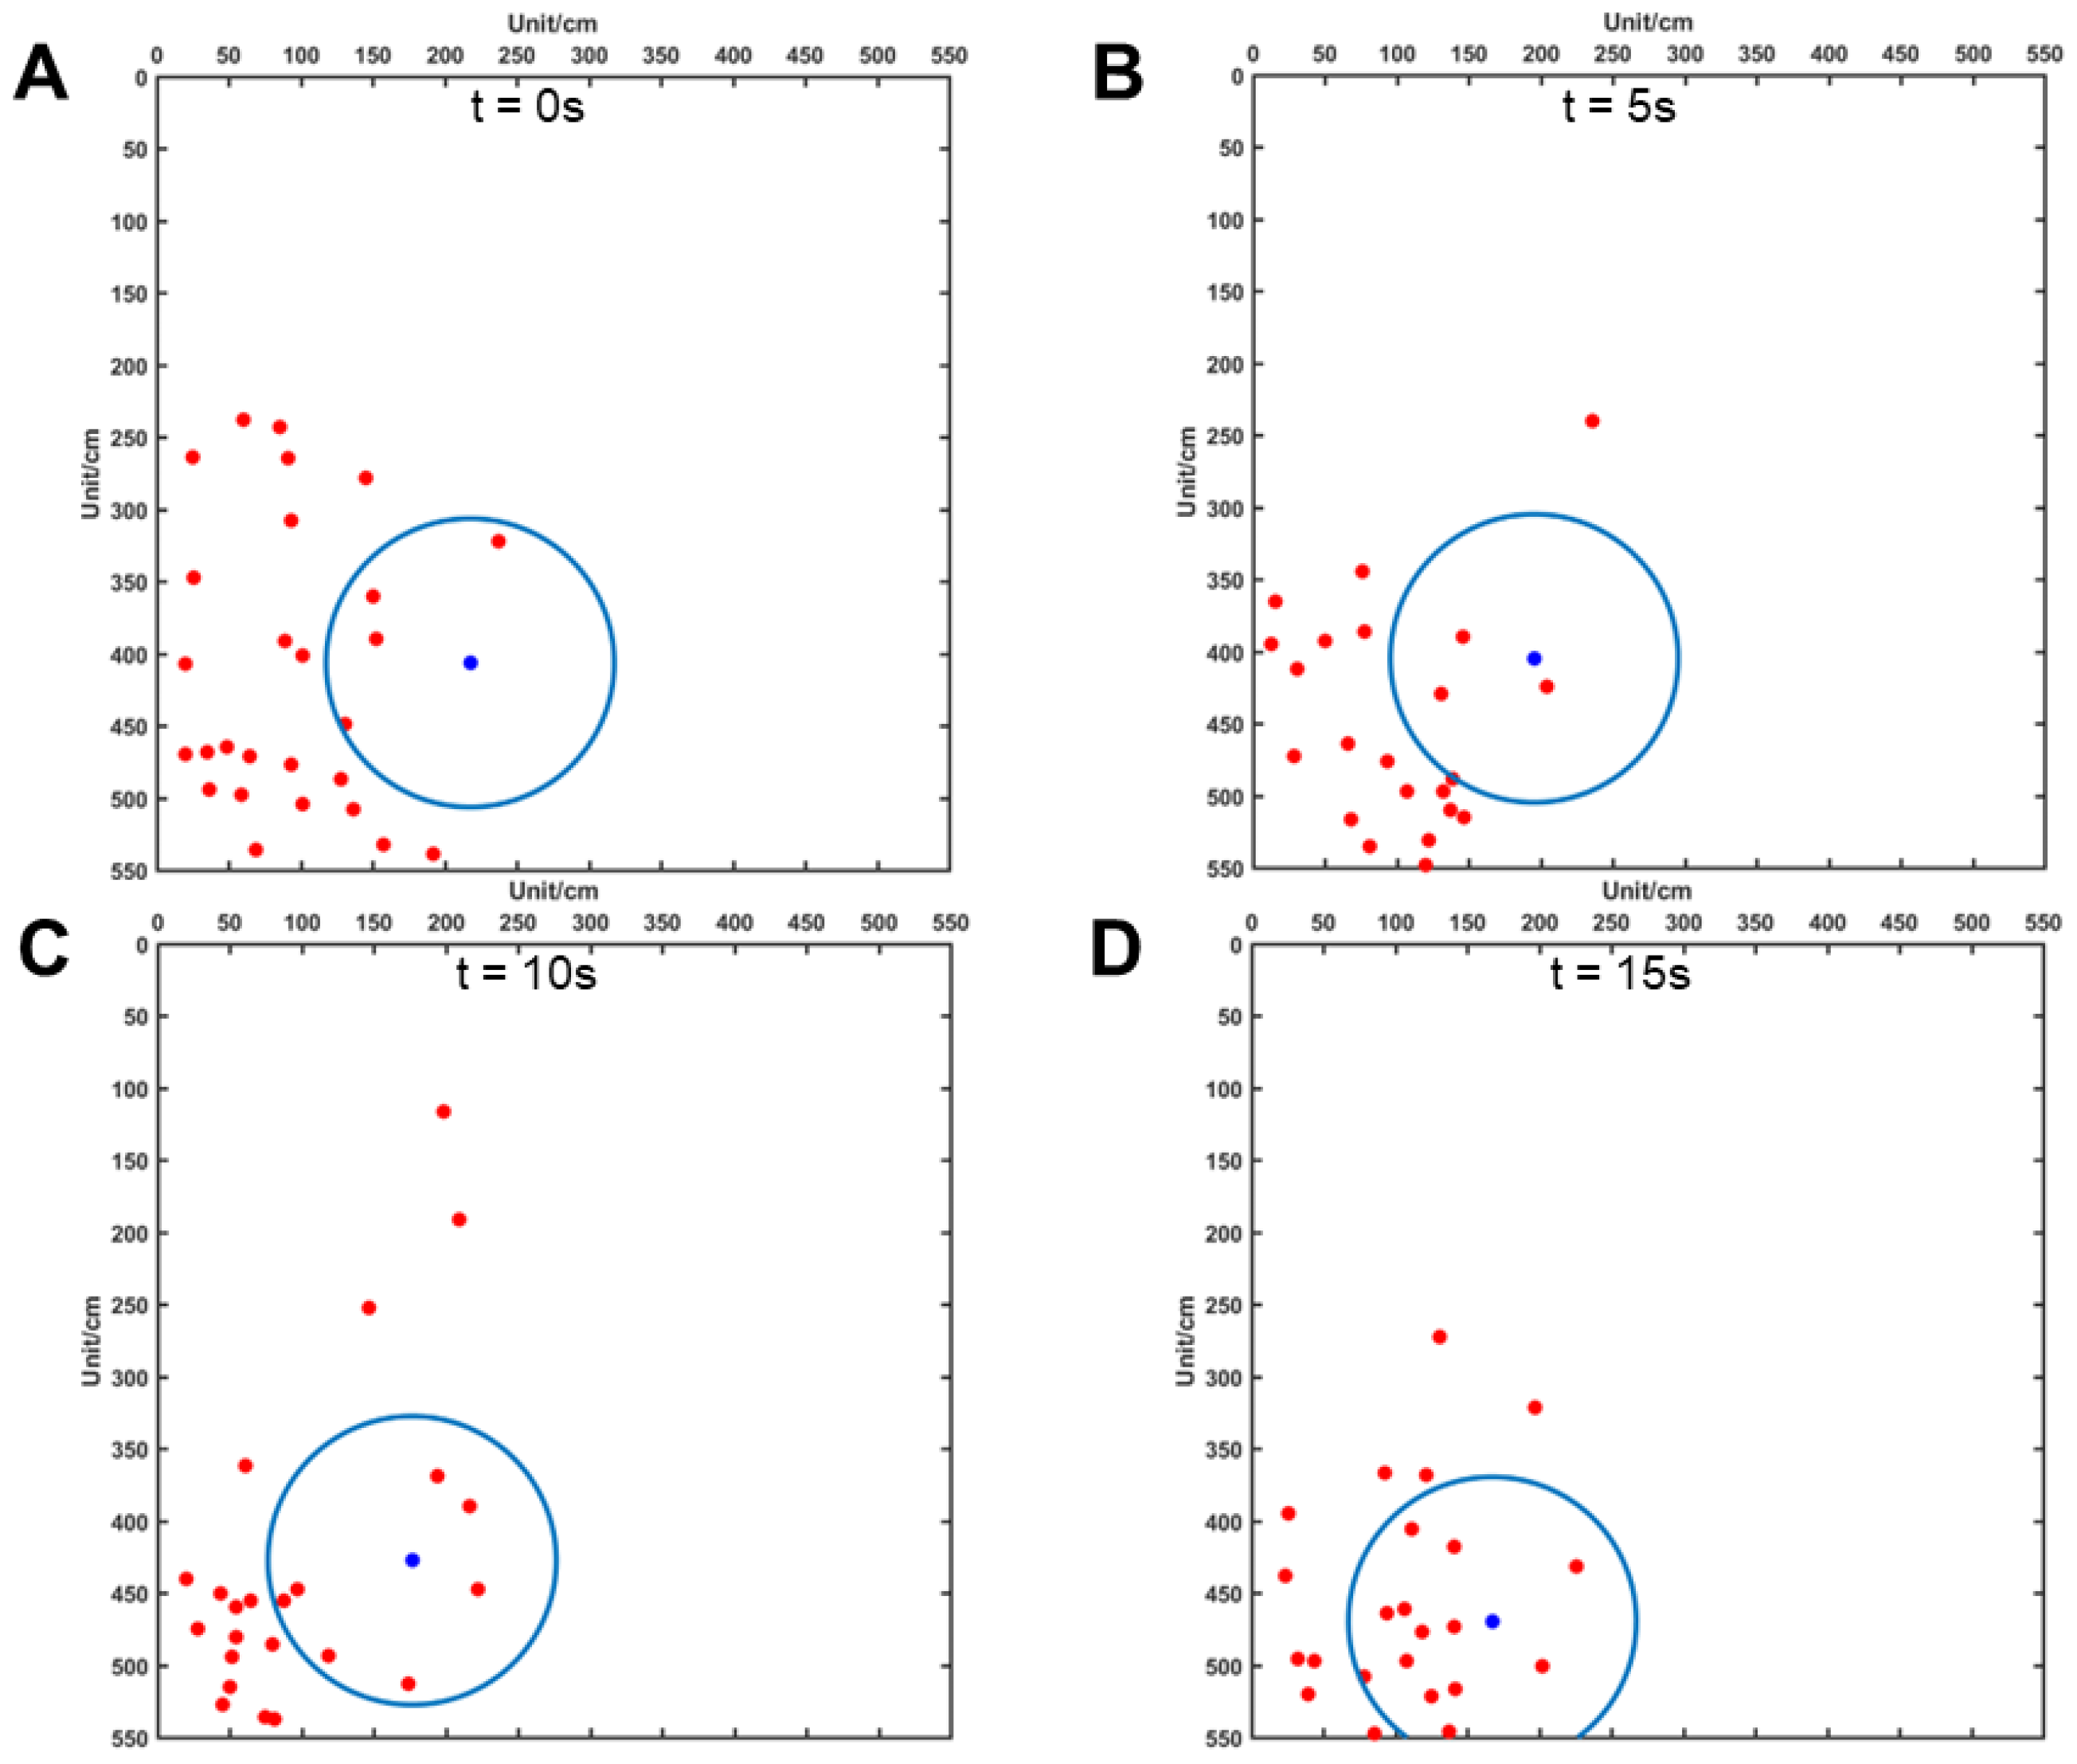
2.2.6. Distance Data Acquisition between Carp and Robot Fish
2.2.7. Statistical Analysis
3. Results
3.1. Hydrodynamic Coefficient
3.2. Changes in Light Attenuation of Different Colored Robots in Water
3.3. Variation in Carp Numbers
3.4. Distance between Carp and the Robotic Fish
4. Discussion
4.1. Changes in Light Attenuation of Different Colored Robots in Water
4.2. Variation in Carp Numbers
4.3. Distance between Carp and Robotic Fish
5. Conclusions and Future Work
Supplementary Materials
Author Contributions
Funding
Institutional Review Board Statement
Informed Consent Statement
Data Availability Statement
Acknowledgments
Conflicts of Interest
References
- Escobar Camacho, D.; Marshall, J.; Carleton, K. Behavioral Color Vision in a Cichlid Fish: Metriaclima Benetos. J. Exp. Biol. 2017, 220, 2887–2899. [Google Scholar] [CrossRef] [PubMed]
- Siebeck, U.E.; Wallis, G.M.; Litherland, L. Colour Vision in Coral Reef Fish. J. Exp. Biol. 2008, 211, 354–360. [Google Scholar] [CrossRef] [PubMed]
- Lau, B.Y.; Mathur, P.; Gould, G.G.; Guo, S. Identification of a Brain Center Whose Activity Discriminates a Choice Behavior in Zebrafish. Proc. Natl. Acad. Sci. USA 2011, 108, 2581–2586. [Google Scholar] [CrossRef]
- Wang, J. Study on the Relationship between the Schooling Structure of Pseudorasbora Parva and Their Vision. Master’s Thesis, Shanghai Ocean University, Shanghai, China, 2015. [Google Scholar]
- Liang, B.X.; Xu, Y.P.; Wu, Z.J.; Huang, J.L. Visual Recognition of Carp on Invasive Species Alligator Snapping Turtle and Red-Eared Slider. Chin. J. Ecol. 2019, 38, 205–209. [Google Scholar]
- Roberts, C.M.; Loop, M.S. Goldfish Color Vision Sensitivity Is High under Light-Adapted Conditions. J. Comp. Physiol. A Neuroethol. Sens. Neural Behav. Physiol. 2004, 190, 993–999. [Google Scholar] [CrossRef] [PubMed]
- Lin, H.R. Fish Physiology; Sun Yat-sen University Press: Guangzhou, China, 2011. [Google Scholar]
- Yu, W.Z. Fish Phototaxis Physiology; Agriculture Press: Beijing, China, 1980. [Google Scholar]
- Zhou, Y.Q. Applied Fish Behavior Science; Science Press: Beijing, China, 2011. [Google Scholar]
- Song, C.B.; Li, X.; Shi, C. Analysis of Artificial Light Source Selection Based on Visual Sensitivity Ofaquatic Animals. China Illum. Eng. J. 2020, 31, 51–57. [Google Scholar]
- Sabbah, S.; Troje, N.F.; Gray, S.M.; Hawryshyn, C.W. High Complexity of Aquatic Irradiance May Have Driven the Evolution of Four-Dimensional Colour Vision in Shallow-Water Fish. J. Exp. Biol. 2013, 216, 1670–1682. [Google Scholar] [CrossRef] [PubMed]
- Kelber, A.; Vorobyev, M.; Osorio, D. Animal Colour Vision–Behavioural Tests and Physiological Concepts. Biol. Rev. 2003, 78, 81–118. [Google Scholar] [CrossRef] [PubMed]
- Bowmaker, J.K. Evolution of Vertebrate Visual Pigments. Vis. Res. 2008, 48, 2022–2041. [Google Scholar] [CrossRef]
- Bowmaker, J.K. Evolution of Colour Vision in Vertebrates. Eye 1998, 12, 541–547. [Google Scholar] [CrossRef]
- Escobar-Camacho, D.; Taylor, M.A.; Cheney, K.L.; Green, N.F.; Marshall, N.J.; Carleton, K.L. Color Discrimination Thresholds in a Cichlid Fish: Metriaclima Benetos. J. Exp. Biol. 2019, 222, jeb201160. [Google Scholar] [CrossRef] [PubMed]
- Neumeyer, C. Tetrachromatic Color Vision in Goldfish: Evidence from Color Mixture Experiments. J. Comp. Physiol. A 1992, 171, 639–649. [Google Scholar] [CrossRef]
- Bowmaker, J.K.; Thorpe, A.; Douglas, R.H. Ultraviolet-Sensitive Cones in the Goldfish. Vis. Res. 1991, 31, 349–352. [Google Scholar] [CrossRef] [PubMed]
- Okamoto, K.; Nomura, M.; Horie, Y.; Okamura, H. Color Preferences and Gastrointestinal-Tract Retention Times of Microplastics by Freshwater and Marine Fishes. Environ. Pollut. 2022, 304, 119253. [Google Scholar] [CrossRef] [PubMed]
- Nava, S.; An, S.; Hamil, T. Visual Detection of Uv Cues by Adult Zebrafish (Danio rerio). J. Vis. 2011, 11, 2. [Google Scholar] [CrossRef] [PubMed]
- Smith, E.J.; Partridge, J.C.; Parsons, K.N.; White, E.M.; Cuthill, I.C.; Bennett, A.T.D.; Church, S.C. Ultraviolet Vision and Mate Choice in the Guppy (Poecilia reticulata). Behav. Ecol. 2002, 13, 11–19. [Google Scholar] [CrossRef]
- Li, Q. Primary Study on the Status of Germ Plasm Resource of Four-Naris’ Carp Populations from Weishan Lake. Master’s Thesis, Soochow University, Suzhou, China, 2010. [Google Scholar]
- Li, S.F.; Wang, C.H.; Cheng, Q.Q. Morphological Variations and Phylogenesis of Four Strains in Cyprinus carpio. J. Fish. China 2005, 29, 24–29. [Google Scholar]
- Jacobs, G.H. Photopigments and the Dimensionality of Animal Color Vision. Neurosci. Biobehav. Rev. 2018, 86, 108–130. [Google Scholar] [CrossRef]
- Zhou, S.J.; He, D.R.; Liu, X.C. The Optomotor Response of Carp Juvenile to Surface Colored Stripe Screen. J. Xiamen Univ. (Nat. Sci.) 1991, 30, 73–77. [Google Scholar]
- Cai, H.C.; Zheng, G.C.; Jin, L.Z. A Study on the Optomotor Reaction Characteristics of Some Young Freshwater Cyprinids. J. Zhejiang Coll. Fish. 1987, 6, 39–47. [Google Scholar]
- Maia, C.M.; Volpato, G.L. A History-Based Method to Estimate Animal Preference. Sci. Rep. 2016, 6, 28328. [Google Scholar] [CrossRef] [PubMed]
- Park, J.-S.; Ryu, J.-H.; Choi, T.-I.; Bae, Y.-K.; Lee, S.; Kang, H.J.; Kim, C.-H. Innate Color Preference of Zebrafish and Its Use in Behavioral Analyses. Mol. Cells 2016, 39, 750–755. [Google Scholar] [CrossRef] [PubMed]
- Siregar, P.; Juniardi, S.; Audira, G.; Lai, Y.-H.; Huang, J.-C.; Chen, K.H.-C.; Chen, J.-R.; Hsiao, C.-D. Method Standardization for Conducting Innate Color Preference Studies in Different Zebrafish Strains. Biomedicines 2020, 8, 271. [Google Scholar] [CrossRef] [PubMed]
- Polverino, G.; Liao, J.; Porfiri, M. Mosquitofish (Gambusia affinis) Preference and Behavioral Response to Animated Images of Conspecifics Altered in Their Color, Aspect Ratio, and Swimming Depth. PLoS ONE 2013, 8, e54315. [Google Scholar] [CrossRef] [PubMed]
- Xu, J.W. Study on Light-Based Fish Attraction and Expulsion Technique in Fish Passage Facilities Grounded in the Tiny Phototaxis of Plateau Fish Species. Master’s Thesis, China Three Gorges University, Yichang, China, 2019. [Google Scholar]
- Spinello, C.; Macrì, S.; Porfiri, M. Acute Ethanol Administration Affects Zebrafish Preference for a Biologically Inspired Robot. Alcohol 2013, 47, 391–398. [Google Scholar] [CrossRef] [PubMed]
- Dennis, I.C.; Abeyesinghe, S.M.; Demmers, T.G.M. The Behaviour of Commercial Broilers in Response to a Mobile Robot. Br. Poult. Sci. 2020, 61, 483–492. [Google Scholar] [CrossRef] [PubMed]
- Romano, D.; Donati, E.; Benelli, G.; Stefanini, C. A Review on Animal–Robot Interaction: From Bio-Hybrid Organisms to Mixed Societies. Biol. Cybern. 2019, 113, 201–225. [Google Scholar] [CrossRef] [PubMed]
- Kubinyi, E.; Miklósi, Á.; Kaplan, F.; Gácsi, M.; Topál, J.; Csányi, V. Social Behaviour of Dogs Encountering Aibo, an Animal-Like Robot in a Neutral and in a Feeding Situation. Behav. Process. 2004, 65, 231–239. [Google Scholar] [CrossRef] [PubMed]
- Bierbach, D.A.-O.; Landgraf, T.A.-O.; Romanczuk, P.; Lukas, J.A.-O.X.; Nguyen, H.; Wolf, M.; Krause, J.A.-O. Using a Robotic Fish to Investigate Individual Differences in Social Responsiveness in the Guppy. R. Soc. Open Sci. 2018, 5, 181026. [Google Scholar] [CrossRef]
- Polverino, G.; Abaid, N.; Kopman, V.; Macrì, S.; Porfiri, M. Zebrafish Response to Robotic Fish: Preference Experiments on Isolated Individuals and Small Shoals. Bioinspiration Biomim. 2012, 7, 036019. [Google Scholar] [CrossRef]
- Kong, X.H.; Huang, X.S.; Liu, F.; Li, B.L.; Wang, J.F.; Liu, B.L.; Chen, X.J. Design and Implementation of Afish Symbiotic Device Based on Bionic Porpoise. Fish. Mod. 2021, 48, 18–25. [Google Scholar]
- Raj, A.; Thakur, A. Fish-Inspired Robots: Design, Sensing, Actuation, and Autonomy—A Review of Research. Bioinspiration Biomim. 2016, 11, 031001. [Google Scholar] [CrossRef] [PubMed]
- Wang, R.; Wang, S.; Wang, Y.; Cheng, L.; Tan, M. Development and Motion Control of Biomimetic Underwater Robots: A Survey. IEEE Trans. Syst. Man Cybern. Syst. 2020, 52, 833–844. [Google Scholar] [CrossRef]
- Kruusmaa, M.; Gkliva, R.; Tuhtan, J.; Tuvikene, A.; Alfredsen, J.A. Salmon Behavioural Response to Robots in an Aquaculture Sea Cage. R. Soc. Open Sci. 2020, 7, 191220. [Google Scholar] [CrossRef] [PubMed]
- Salazar, R.; Fuentes, V.; Abdelkefi, A. Classification of Biological and Bioinspired Aquatic Systems: A Review. Ocean. Eng. 2017, 148, 75–114. [Google Scholar] [CrossRef]
- Bonnet, F.; Cazenille, L.; Séguret, A.; Gribovskiy, A.; Collignon, B.; Halloy, J.; Mondada, F. Design of a Modular Robotic System That Mimics Small Fish Locomotion and Body Movements for Ethological Studies. Int. J. Adv. Robot. Syst. 2017, 14, 1729881417706628. [Google Scholar] [CrossRef]
- Polverino, G.; Phamduy, P.; Porfiri, M. Fish and Robots Swimming Together in a Water Tunnel: Robot Color and Tail-Beat Frequency Influence Fish Behavior. PLoS ONE 2013, 8, e77589. [Google Scholar] [CrossRef] [PubMed]
- Abaid, N.; Bartolini, T.; Macri, S.; Porfiri, M. Zebrafish Responds Differentially to a Robotic Fish of Varying Aspect Ratio, Tail Beat Frequency, Noise, and Color. Behav. Brain Res. 2012, 233, 545–553. [Google Scholar] [CrossRef]
- Kopman, V.; Laut, J.; Polverino, G.; Porfiri, M. Closed-Loop Control of Zebrafish Response Using a Bioinspired Robotic-Fish in a Preference Test. J. R. Soc. Interface 2013, 10, 20120540. [Google Scholar] [CrossRef]
- Bierbach, D.; Lukas, J.; Bergmann, A.; Elsner, K.; Höhne, L.; Weber, C.; Weimar, N.; Arias-Rodriguez, L.; Mönck, H.J.; Nguyen, H.; et al. Insights into the Social Behavior of Surface and Cave-Dwelling Fish (Poecilia mexicana) in Light and Darkness through the Use of a Biomimetic Robot. Front. Robot. AI 2018, 5, 3. [Google Scholar] [CrossRef]
- Swain, D.; Couzin, I.; Leonard, N. Real-Time Feedback-Controlled Robotic Fish for Behavioral Experiments with Fish Schools. Proc. IEEE 2012, 100, 150–163. [Google Scholar] [CrossRef]
- Wilkins, L.; Marshall, N.; Johnsen, S.; Osorio, D. Modelling Fish Colour Constancy, and the Implications for Vision and Signalling in Water. J. Exp. Biol. 2016, 219, 1884–1892. [Google Scholar] [CrossRef] [PubMed]
- Volpato, G.L.; Barreto, R.E. Environmental Blue Light Prevents Stress in the Fish Nile Tilapia. Braz. J. Med. Biol. Res. 2001, 34, 1041–1045. [Google Scholar] [CrossRef] [PubMed]
- Maia, C.M.; Volpato, G.L. Environmental Light Color Affects the Stress Response of Nile Tilapia. Zoology 2013, 116, 64–66. [Google Scholar] [CrossRef] [PubMed]
- de Abreu, M.S.; Giacomini, A.; Genario, R.; Dos Santos, B.E.; Marcon, L.; Demin, K.A.; Kalueff, A.V. The Impact of Housing Environment Color on Zebrafish Anxiety-Like Behavioral and Physiological (Cortisol) Responses. Gen. Comp. Endocrinol. 2020, 294, 113499. [Google Scholar] [CrossRef] [PubMed]
- Zhou, X.Q.; Niu, C.J.; Li, Q.F. Effects of Light on Feeding Behavior, Growth and Survival of Aquatic Animals. Acta Hydrobiol. Sin. 2000, 24, 178–181. [Google Scholar]
- Fang, J.; Song, L.M.; Cai, H.C.; Yu, Z.; Peng, Y.E. Reactions of Cage-Cultured Large Yellow Croaker (Pseudosciaena Crocea)to Colors and Illumination Intensities. J. Shanghai Ocean. Univ. 2007, 16, 269–274. [Google Scholar]
- Zhang, H.M.; Li, K.L.; Chen, X.Q. Preferencesfor Colored Backgroundsin Fish Tanksin Theg Oldfish Carassius auratus. Sichuan J. Zool. 2010, 29, 419–421+23. [Google Scholar]
- Bertozz, M.; Broggi, A.; Fascioli, A. Stereo Inverse Perspective Mapping: Theory and Applications. Image Vis. Comput. 1998, 16, 585–590. [Google Scholar] [CrossRef]
- Zhang, Q.G.; Deng, K.; Destech, P.I. Perspective Image Correction Based on Edge-Line Segment Detection and Perspective Transform. In Proceedings of the International Academic Conference on the Information Science and Communication Engineering (ISCE 2014), Jeju, Republic of Korea, 22–25 June 2014; pp. 403–409. [Google Scholar]
- Marchesan, M.; Spoto, M.; Verginella, L.; Ferrero, E.A. Behavioural Effects of Artificial Light on Fish Species of Commercial Interest. Fish. Res. 2005, 73, 171–185. [Google Scholar] [CrossRef]
- Smith, R.C.; Baker, K.S. Optical Properties of the Clearest Natural Waters (200–800 Nm). Appl. Opt. 1981, 20, 177–184. [Google Scholar] [CrossRef] [PubMed]
- Green, N.F.; Guevara, E.; Osorio, D.C.; Endler, J.A.; Marshall, N.J.; Vorobyev, M.; Cheney, K.L. Colour Discrimination Thresholds Vary Throughout Colour Space in a Reef Fish (Rhinecanthus aculeatus). J. Exp. Biol. 2022, 225, jeb243533. [Google Scholar] [CrossRef] [PubMed]
- Nguyen, K.Q.; Winger, P.D. Artificial Light in Commercial Industrialized Fishing Applications: A Review. Rev. Fish. Sci. Aquac. 2018, 27, 106–126. [Google Scholar] [CrossRef]
- Sardo, G.; Okpala, C.; Geraci, M.; Fiorentino, F.; Vitale, S. The Effects of Different Artificial Light Wavelengths on Some Behavioural Features of Juvenile Pelagic Atlantic Horse Mackerel, Trachurus Trachurus (Actinopterygii: Perciformes: Carangidae). Acta Ichthyol. Piscat. 2020, 50, 85–92. [Google Scholar] [CrossRef]
- Hoare, D.; Krause, J.; Peuhkuri, N.; Godin, J.-G. Body Size and Shoaling in Fish. J. Fish Biol. 2005, 57, 1351–1366. [Google Scholar] [CrossRef]
- Zhang, C.N.; Tang, T.; Kang, X.L.; Zhang, M.M. Lane Detection Algorithm Research Based on Revised Perspective Transform. In Proceedings of the the International Conference on Photonics and Image in Agriculture Engineering, Zhangjiajie, China, 11–12 July 2009. [Google Scholar]
- Xu, X.W.; Wu, J.L.; Ye, T.; Wang, X.D. A Method of Container Image Rectification Based on Computer Vision. In Proceedings of the 2018 7th International Conference on Digital Home (ICDH), Guilin, China, 7 February 2018. [Google Scholar]
- Cheney, K.L.; Newport, C.; McClure, E.C.; Marshall, N.J. Colour Vision and Response Bias in a Coral Reef Fish. J. Exp. Biol. 2013, 216 Pt 15, 2967–2973. [Google Scholar] [CrossRef] [PubMed]
- Nababan, B.; Ulfah, D.; Panjaitan, J. Light Propagation, Coefficient Attenuation, and the Depth of One Optical Depth in Different Water Types. IOP Conf. Ser. Earth Environ. Sci. 2021, 944, 012047. [Google Scholar] [CrossRef]
- He, D.; Zhou, S.; Liu, L.; Cai, H.; Zhen, W. A Study on the Optomotor Reaction of Some Young Fishes. Acta Hydrobiol. Sin. 1985, 9, 365–373. [Google Scholar]
- Roy, T.; Suriyampola, P.S.; Flores, J.; Lopez, M.; Hickey, C.; Bhat, A.; Martins, E.P. Color Preferences Affect Learning in Zebrafish, Danio Rerio. Sci. Rep. 2019, 9, 14531. [Google Scholar] [CrossRef]
- Kelber, A.; Osorio, D. From Spectral Information to Animal Colour Vision: Experiments and Concepts. Proc. Biol. Sci. 2010, 277, 1617–1625. [Google Scholar] [CrossRef]
- Margulies, D. Development of the Visual System and Inferred Performance Capabilities of Larval and Early Juvenile Scombrids. Mar. Freshw. Behav. Physiol. 1997, 30, 75–98. [Google Scholar] [CrossRef]
- Romano, D.; Stefanini, C. Any Colour You Like: Using Animal-Robot Interaction to Unravel Mechanisms Promoting Phenotypically Heterogeneous Fish Aggregations. In ALIFE 2021: The 2021 Conference on Artificial Life; MIT Press: Cambridge, MA, USA, 2021; Volume 32. [Google Scholar]
- Zhou, Y.Q.; Wang, J.; Qian, W.G.; Cao, D.M.; Zhang, Z.Q.; Liu, L.F. Review of Fish Schooling Behavior Study. J. Shanghai Ocean Univ. 2013, 22, 734–743. [Google Scholar]


| Color | ) | ) | ) | ) |
|---|---|---|---|---|
| Red | 650 | 0.3490 | 0.0007 | 0.34935 |
| Yellow | 580 | 0.1080 | 0.0012 | 0.10860 |
| Green | 530 | 0.0507 | 0.0017 | 0.05155 |
| Blue | 460 | 0.0156 | 0.0031 | 0.01715 |
| Color | ) | (lux) | |
|---|---|---|---|
| Natural | * | * | 50,000 |
| Red | 650 | 0.34935 | 10,889 |
| Yellow | 580 | 0.1086 | 5371 |
| Green | 530 | 0.05155 | 11,053 |
| Blue | 460 | 0.01715 | 7370 |
Disclaimer/Publisher’s Note: The statements, opinions and data contained in all publications are solely those of the individual author(s) and contributor(s) and not of MDPI and/or the editor(s). MDPI and/or the editor(s) disclaim responsibility for any injury to people or property resulting from any ideas, methods, instructions or products referred to in the content. |
© 2024 by the authors. Licensee MDPI, Basel, Switzerland. This article is an open access article distributed under the terms and conditions of the Creative Commons Attribution (CC BY) license (https://creativecommons.org/licenses/by/4.0/).
Share and Cite
Huang, X.; Zhang, Y.; Chen, X.; Kong, X.; Liu, B.; Jiang, S. Compatibilities of Cyprinus carpio with Varied Colors of Robotic Fish. Fishes 2024, 9, 211. https://doi.org/10.3390/fishes9060211
Huang X, Zhang Y, Chen X, Kong X, Liu B, Jiang S. Compatibilities of Cyprinus carpio with Varied Colors of Robotic Fish. Fishes. 2024; 9(6):211. https://doi.org/10.3390/fishes9060211
Chicago/Turabian StyleHuang, Xiaoshuang, Ying Zhang, Xinjun Chen, Xianghong Kong, Bilin Liu, and Shuxia Jiang. 2024. "Compatibilities of Cyprinus carpio with Varied Colors of Robotic Fish" Fishes 9, no. 6: 211. https://doi.org/10.3390/fishes9060211
APA StyleHuang, X., Zhang, Y., Chen, X., Kong, X., Liu, B., & Jiang, S. (2024). Compatibilities of Cyprinus carpio with Varied Colors of Robotic Fish. Fishes, 9(6), 211. https://doi.org/10.3390/fishes9060211