Article

Sex-Linked Changes in Biotransformation of Phenol in Brook Trout (Salvelinus fontinalis) over an Annual Reproductive Cycle

by
Richard C. Kolanczyk
1,*,
Laura E. Solem
2,†,
Mark A. Tapper
1,
Alex D. Hoffman
1,†,
Barbara R. Sheedy
1,†,
Patricia K. Schmieder
1,† and
James M. McKim III
1,‡
1
Great Lakes Toxicology and Ecology Division, Center for Computational Toxicology and Exposure, Office of Research and Development, United States Environmental Protection Agency, 6201 Congdon Boulevard, Duluth, MN 55804, USA
2
National Research Council, 6201 Congdon Boulevard, Duluth, MN 55804, USA
*
Author to whom correspondence should be addressed.
Retired.
Deceased.
Fishes 2024, 9(8), 311; https://doi.org/10.3390/fishes9080311
Submission received: 17 June 2024 / Revised: 22 July 2024 / Accepted: 1 August 2024 / Published: 6 August 2024

Abstract

:
The microsomal metabolism of phenol (11 °C) over an annual reproductive cycle from June to December was studied using fall spawning adult brook trout (Salvelinus fontinalis). Hepatic microsomes were isolated from three male and three female fish each month. Incubations were optimized for time, cofactor concentration, pH, and microsomal protein concentration. The formation of phase I ring-hydroxylation metabolites, i.e., hydroquinone (HQ) and catechol (CAT), was quantified by HPLC with dual-channel electrochemical detection. Sample preparation and chromatographic conditions were optimized to achieve the separation and sensitivity required for the analysis of these labile products. Biotransformation of phenol over a range of substrate concentrations (1 to 150 mM) was quantified for the calculation of Michaelis–Menten constants (Km and Vmax) for each month. Results indicate a nearly equal production of HQ and CAT among males and females in late June. At the peak of maturity in October, there was an approximate ten-fold greater production of ring-hydroxylation metabolites noted in females in comparison with males on a total liver basis. In vitro phase II biotransformation of phenol glucuronidation was assessed by determining the Michaelis–Menten constants (Km, Vmax) using brook trout hepatic microsomes over a range of substrate concentrations (1 to 60 mM). Initially, there were no significant differences in the glucuronide rate of formation (pmol/min/mg protein) or total capacity (nmol/min/liver) between females and males. At the peak of maturation, the maximum rate of glucuronide formation was 4-fold less in females; however, the total capacity was 2-fold less in females due to the increased liver size in the females. The alterations in biotransformation coincided with increases in the hepatic and gonadal somatic indices and with changes in plasma hormone concentrations. These experiments provide insight into the metabolic deactivation of xenobiotics and to provide data for the prediction of altered hepatic biotransformation rates and pathways during the reproductive cycle.
Key Contribution: The microsomal metabolism of phenol (11 °C) over an annual reproductive cycle from June to December was studied using hepatic microsomes isolated from three male and three female fish each month from fall spawning adult brook trout (Salvelinus fontinalis). Alterations in the biotransformation of phenol to hydroquinone, catechol, and phenylglucuronide were reported as Michaelis–Menten constants (Km and Vmax) and coincided with increases in the hepatic and gonadal somatic indices and with changes in plasma hormone concentrations.

1. Introduction

The ability of fish to bio-transform a broad range of xenobiotic organic chemicals is well known [1,2]. With reactive chemicals such as phenol, it is extremely important to understand the biotransformation kinetics (activation/deactivation) as the toxicity of most reactive chemicals is balanced by the production of reactive metabolites and the elimination of conjugated deactivated forms of the reactive metabolites, which directly impacts toxicity [3,4]. The P450 or mixed function oxidase (MFO) system, Phase I, is the first and most critical system involved in the biotransformation of the non-polar lipid-soluble compounds commonly found in marine and freshwater environments [5]. Many environmental chemicals are known to induce the P450 system, which can increase certain MFO enzymes and be monitored as an indication of environmental pollution [5,6,7]. Adjustments in the P450 system are made in response to environmental chemicals and their specific chemical structures. In addition, species, age, sex, reproductive cycles, and seasonal temperatures have all been shown to impact the function of the Phase I MFO system and the Phase II transferase system [8,9,10,11,12].
Glucuronidation and sulfation are known to be the two most common Phase II conjugation systems for phenolic compounds in fish, with phenylglucuronide (PG) being by far the most abundant [13,14,15,16]. Phase II biotransformation involves the process of reducing the lipophilicity of endogenous and exogenous organic chemicals through the formation of water-soluble compounds that are more readily excreted from the animal’s body. The synthesis of glucuronides by microsomal UDP-glucuronosyltransferase (UDPGT) is quantitatively the most important pathway in fish for the detoxification and elimination of xenobiotics in fish [17]. This major detoxification system is located mainly in the liver, although UDPGT activity has been found in several other extra-hepatic tissues as well (e.g., intestine, kidney, and gill) [18,19,20].
A considerable amount of research effort has been placed on chemical activation and deactivation, which includes mode of action determinations for reactive chemicals [21]; metabolite identification of reactive chemicals [22,23,24,25,26]; determination of species differences in biotransformation rate and capacity parameters for use in species extrapolation [27]; and for the development of fish physiologically based toxicokinetic modeling for reactive toxic metabolites formed by individual animals and populations [28,29,30,31,32,33].
If this research effort on understanding and modeling reactive chemicals is to provide data useful for environmental risk assessments for reactive chemicals, it is our opinion that a better understanding of the biochemical changes that occur during the reproductive cycles of oviparous fish must be understood in the context of changes in hepatic biotransformation kinetics among males and females of each species. To date, most work in this area has involved measuring enzyme activity and not biotransformation kinetics, which does not allow a complete understanding of the toxicity of the compound when parameters involving enzymatic deactivation are required [4].
Generally, most fish go through an annual reproductive cycle that involves gonad development and spawning, followed by regression and gonad inactivity. These annual cycles bring extreme changes in metabolism and biochemistry between males and females [34]. It is well known that the livers of oviparous female fish are subjected to large biochemical and physiological changes during the annual reproductive cycle that can last for up to 7 months in some species [35]. These changes involve increased levels of pituitary and gonadal hormones coupled with the biochemical changes that accompany the production of vitellogenin, the complex precursor of egg yolk protein. Concern over the impact of the biochemical changes in the liver during sexual maturation on major hepatic biotransformation reactions has been investigated in several fish species with respect to the activity of P450 enzymes. Several laboratories have demonstrated that mature male rainbow trout and brook trout have significantly higher levels of MFO activity than mature females during the annual reproductive cycle, which may be indicative of a greater ability to bio-transform certain xenobiotics [11,36,37,38]. The pattern of plasma steroid levels of estradiol and testosterone matched the changes noted in sex-dependent P450 and supports the idea that sex steroids play an important role in regulating the P450 system [39]. Because of the huge biochemical changes known to occur in the liver during the reproductive cycle of an oviparous fish [35], we felt it was imperative to further evaluate the impact of these changes on hepatic biotransformation kinetics. Changes in rate and capacity parameters brought on by annual alterations in hepatic biochemistry and metabolism during maturation must be understood to allow the effective use of predictive fish physiologically based toxicokinetic (PB-TK) models for highly reactive chemicals [28].
Efforts by Kolanczyk et al. [27] on reactive Phase I metabolites of phenol (HQ and CAT) in adult male and female rainbow trout, brook trout, and lake trout provided rate and capacity parameters (Km and Vmax) required for use in fish PB-TK models for adult fish. The present study records the month-by-month sex-related changes in Phase I (activation/ring hydroxylation) and Phase II (deactivation/glucuronidation) phenol biotransformation rate and capacity parameters (Km and Vmax) that occur during the reproductive cycle of the brook trout. This study includes monthly measurements of the Hepatic Somatic Index (HSI), the Gonad Somatic Index (GSI), plasma steroid hormone levels, hepatic microsomal protein levels, hepatic P450 levels, and hepatic EROD levels. The Km and Vmax values for phenol metabolism provide the necessary activation and deactivation rate constants required to successfully build a predictive fish PB-TK model for a reactive chemical.

2. Methods and Materials

2.1. Chemicals

Phenol [108-95-2] (98%), hydroquinone (HQ) [123-31-9] (99%), benzoquinone (BQ) [106-51-4] (>98%), and catechol (CAT) [120-80-9] (98%) were obtained from Aldrich Chemical Company (Milwaukee, WI, USA). Reducing equivalents, magnesium chloride (MgCl2), uridine 5′-diphosphoglucuronic acid (UDPGA), buffer components, phenylglucuronide (PG) [17685-05-1] (>99%), G-6-P dehydrogenase, and 7-ethoxyresorufin were purchased from Sigma Chemical Co. (St. Louis, MO, USA). Acetonitrile and methanol from Burdick and Jackson (Muskegon, MI, USA) were of analytical grade. Resorufin was obtained from Pierce Chemical Company (Rockford, IL, USA). Disodium ethylenediaminetetraacetate and sodium dithionite were purchased from Fisher Scientific (Eden Prairie, MN, USA).

2.2. Standard and Sample Preparation and Handling

Standards and samples required special precautions to ensure stability. In all cases, cold solvents, buffers, and water were used to solubilize solid compounds. Solutions were kept on ice and protected from light to avoid degradation of analytes [40]. HQ, CAT, and BQ standard solutions were prepared daily in acetonitrile/water (1:1).

2.3. Animals

Four-year-old fall-spawning brook trout (BKT) (750–1500 g), obtained from Stockton Hatchery (Winona, MN, USA), were fed commercial trout chow (Nelson and Sons Inc., Murray, UT, USA) and held at 11 °C in flow-through 815 L tanks with sand filtered Lake Superior water (4 L/min). Fish were maintained on a Duluth photoperiod and sampled monthly (3 females, 3 males) for blood and liver tissue from June through December.
Blood was drawn for assessment of plasma levels of testosterone, 11-ketotestosterone, estradiol, and vitellogenin. General radioimmunoassay (RIA) measurements were modified for steroids, according to Jensen et al. [41]. Plasma vitellogenin concentrations were determined using a competitive enzyme-linked immunosorbent assay (ELISA) procedure developed for quantification of rainbow trout vitellogenin [42].
All procedures involving fish were performed in accordance with an approved Animal Care and Use Plan for the Duluth (MN, USA) US EPA facility.

2.4. Microsomal Characterization

Liver microsomes were prepared from 24 h fasted trout. Livers from individual trout were homogenized for the preparation of each of six microsomal preparations [40]. Isolated microsomes were stored at −80 °C for up to 12 months [43]. Microsomal preparations were characterized as to total protein [44], P450 protein content as measured by the method of Estabrook et al. [45] using an extinction coefficient of 0.1 mM−1cm−1, and 7-ethoxyresorufin-O-deethylase (EROD) activity by a modified method of Pohl and Fouts [46] utilizing excitation and emission wavelengths of 530 and 585 nm, respectively. The EROD reaction product formed after 10 min at 11 °C was quantified against a resorufin standard curve [27].

2.5. Phase I Microsomal Incubations

Incubations (0.5 mL total volume) of substrate (phenol; 1 to 150 mM) with six microsome preparations for each species were conducted in open microcentrifuge tubes at 11 °C with MgCl2 (20 mM), glucose-6-phosphate (10 mM), NADP (13.5 mM), G-6-P dehydrogenase (10 units), and microsomes (0.75 mg/mL protein) in 0.1 M Trizma-HCl buffer (pH 8.0) for 15 min as previously described by Kolanczyk et al. [27,40]. Microsomes and cofactors were incubated for 5 min prior to initiation of the reaction by addition of the substrate. At completion, 0.05 mL of cold Ba(OH)2 (saturated) and 0.05 mL cold ZnSO4 (25%) were added to the incubate. Samples were then vortexed, stored on ice for 5 min, and centrifuged for 3 min at 18,200× g. Samples were placed back on ice for 5 min, and centrifuged for 3 min at 18,200× g. The supernatant was transferred to amber HPLC vials equipped with inserts, maintained at 4 °C, and analyzed immediately by HPLC to preserve sample integrity.

2.6. Phase II Microsomal Incubations

Microsomal incubations (0.5 mL total volume) were conducted at 11 °C with phenol (1–60 mM), MgCl2 (20 mM), UDPGA (8 mM), and microsomes (0.75 mg/mL protein) in 0.1 M Tris-HCl buffer (pH 8.0) for 20 min. The reaction was terminated by the addition of 20 μL cold Ba(OH)2 (saturated) and 20 μL cold ZnSO4 (25%). Samples were vortexed, stored on ice for 5 min, and centrifuged. The supernatant was transferred to HPLC vials equipped with narrow inserts for analysis. Samples were maintained at 4 °C and analyzed immediately by HPLC to preserve sample integrity. No activators (e.g., Triton X-100 or Digitonin) were used in the preparation of the microsomes in this study. Earlier work on glucuronosyltransferase enzyme activity reported as much as 50% latent in fish [47,48,49]. However, experiments were conducted in this laboratory to assess microsomal PG formation with and without activators (Triton X-100 or Digitonin). A maximum increase of 6% in glucuronidation activity relative to control was observed. With such a relatively small increase and the desire to run a simplified assay for glucuronosyltransferase activity, activators were not utilized. For future comparison to results obtained in different laboratories, it is desirable to have a standardized assay, which should provide a reproducible result and not necessarily the conditions for maximal activity. Microsomes had been stored at −80 °C in a 20% glycerol-Tris HCl buffer. The process of a freeze-thaw cycle for tissue samples and to some extent, the isolated microsome preparations themselves to overcome glucuronosyltransferase enzyme latency have been demonstrated [43,50]. Therefore, it was possible that the freeze-thaw conditions experienced in our assay resulted in the activation of the microsomes.

2.7. Phase I Metabolite Identification and Quantification

The analysis of Phase I microsomal incubation samples was performed on a Beckman System Gold HPLC (Fullerton, CA, USA) equipped with a refrigerated autosampler, diode array UV detector, and a BAS CC-5 dual-channel LC-4C electrochemical detector (ECD) described by Kolanczyk et al. [27,40]. Injections (20 µL) were made onto a Shandon Hypersil ODS (C18) 5 µ 4.6 × 250 mm column. An isocratic mobile phase (1 mL/min) consisting of 9.6% ACN and 0.1 M sodium acetate (pH 4.2) was employed. The ECD featured a glassy carbon working electrode and Ag/AgCl reference electrode, using hydrodynamic voltammograms to determine optimum oxidation or reduction potentials for each analyte. The optimum ECD potential for detection of HQ was E° = +0.425 V [ox], CAT was E° = +0.550 V [ox], and BQ was E° = +0.050 V [red] (range = 10 nA; filter 0.1 Hz). The ECD stability and instrument performance were assessed daily. A dual-channel ECD was used for peak identification compared with standards and for HQ, CAT, and BQ quantitation. A UV-diode array detection was used to quantify levels of phenol and as an additional confirmation of metabolite identification. Measurement of HQ and CAT in microsomal samples were based on respective standard curves.

2.8. Phase II Metabolite Identification and Quantification

Microsomal incubation samples were analyzed on a Beckman System Gold HPLC, with a refrigerated autosampler, model 126 pump and model 168 diode array UV detector, and a Shandon Hypersil ODS (C18) 5 μ 4.6 × 250 mm column. The ODS wide separation applicability column and mobile phase conditions were optimized to allow the characterization of a very polar glucuronide metabolite on a C18 column without the need for reverse cleavage with glucuronidase. An isocratic mobile phase (1.5 mL/min) consisting of 9.6% acetonitrile 0.1 M sodium acetate pH 4.2 was employed. PG was detected at 265 nm and was quantified using a standard curve.

2.9. Data Analysis

Each data point in the Figures is expressed as the mean ± standard error of triplicate observations on one fish microsomal set at each phenol concentration tested. The apparent kinetic parameters (Km and Vmax ± standard error) of ring-hydroxylation (Phase I) or glucuronidation (Phase II) were determined for phenol based on the direct measurement of metabolite concentrations HQ and CAT (Phase I) or PG (Phase II). All Km and Vmax values for metabolite formation were fitted to the combined average rate of the three microsomal preparations from individual male and female trout at each phenol concentration tested each month from June through December. A non-linear least squares regression program (EZ-FitTM version 5.03; Perrella Scientific; Amherst, NH, USA) was used to fit untransformed kinetic data. Statistical comparisons between groups (n = 3) were performed using the unpaired t-test or one-way ANOVA at p ≤ 0.05.

3. Results

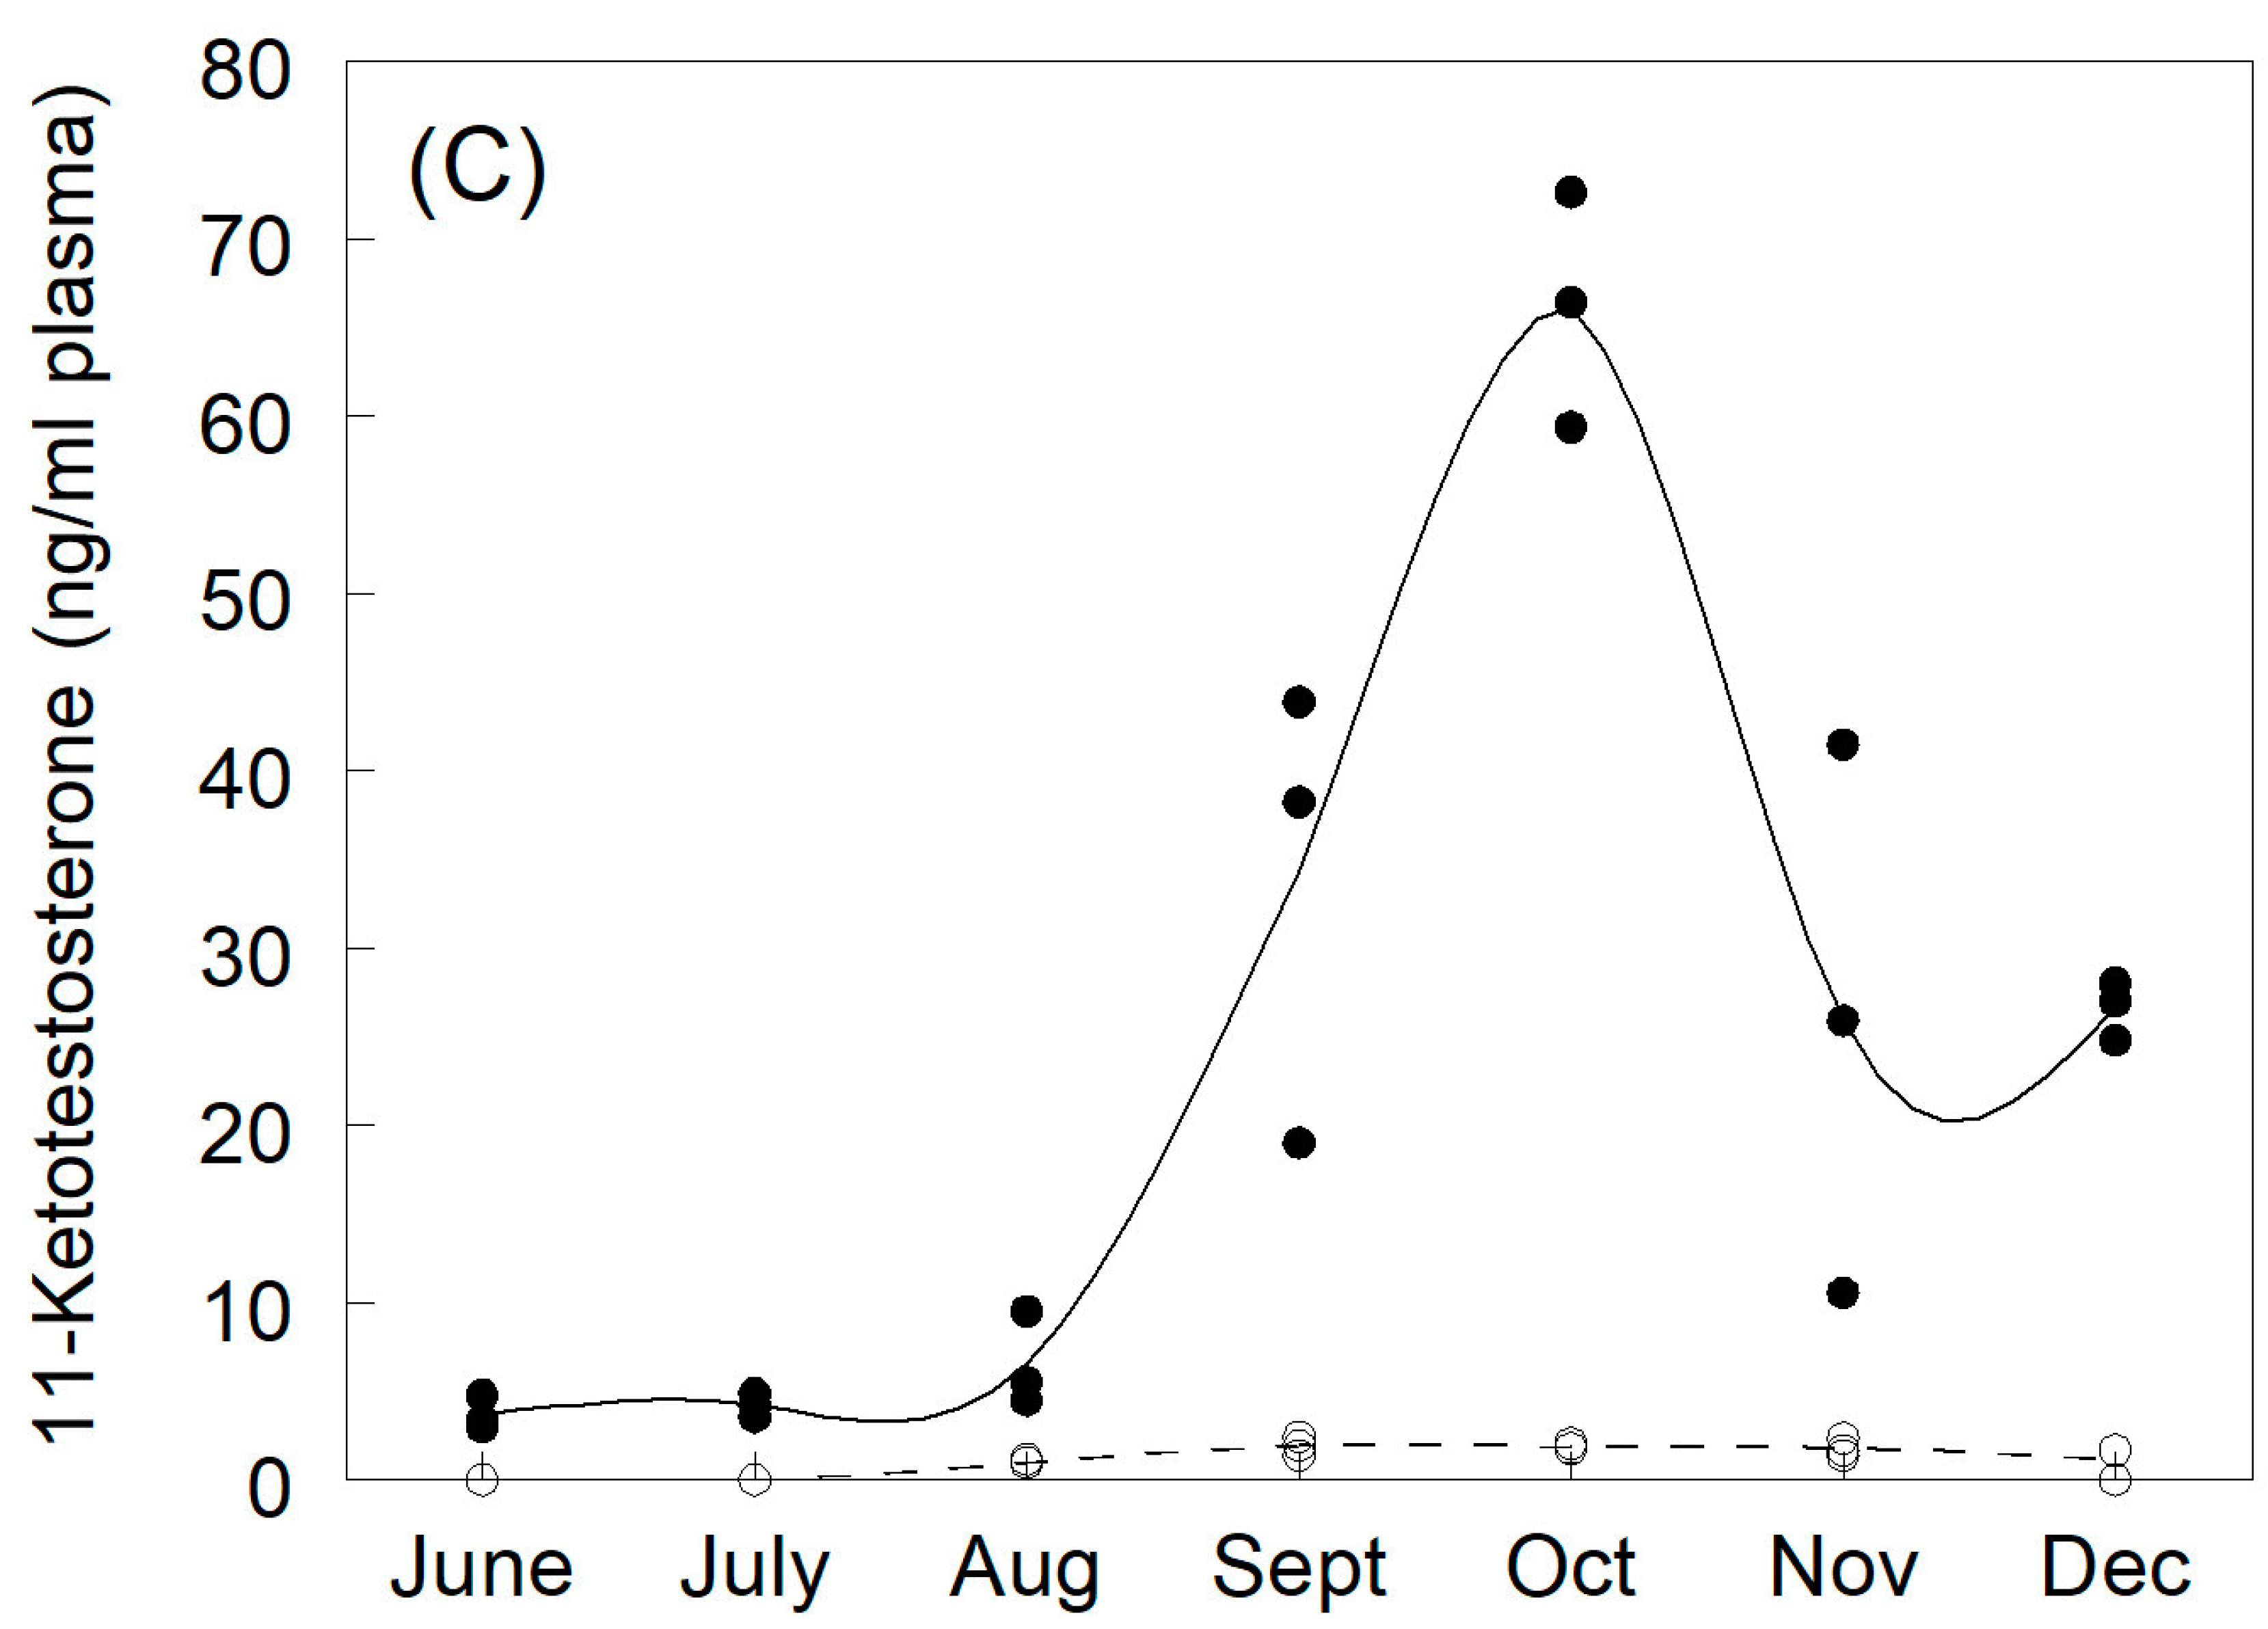
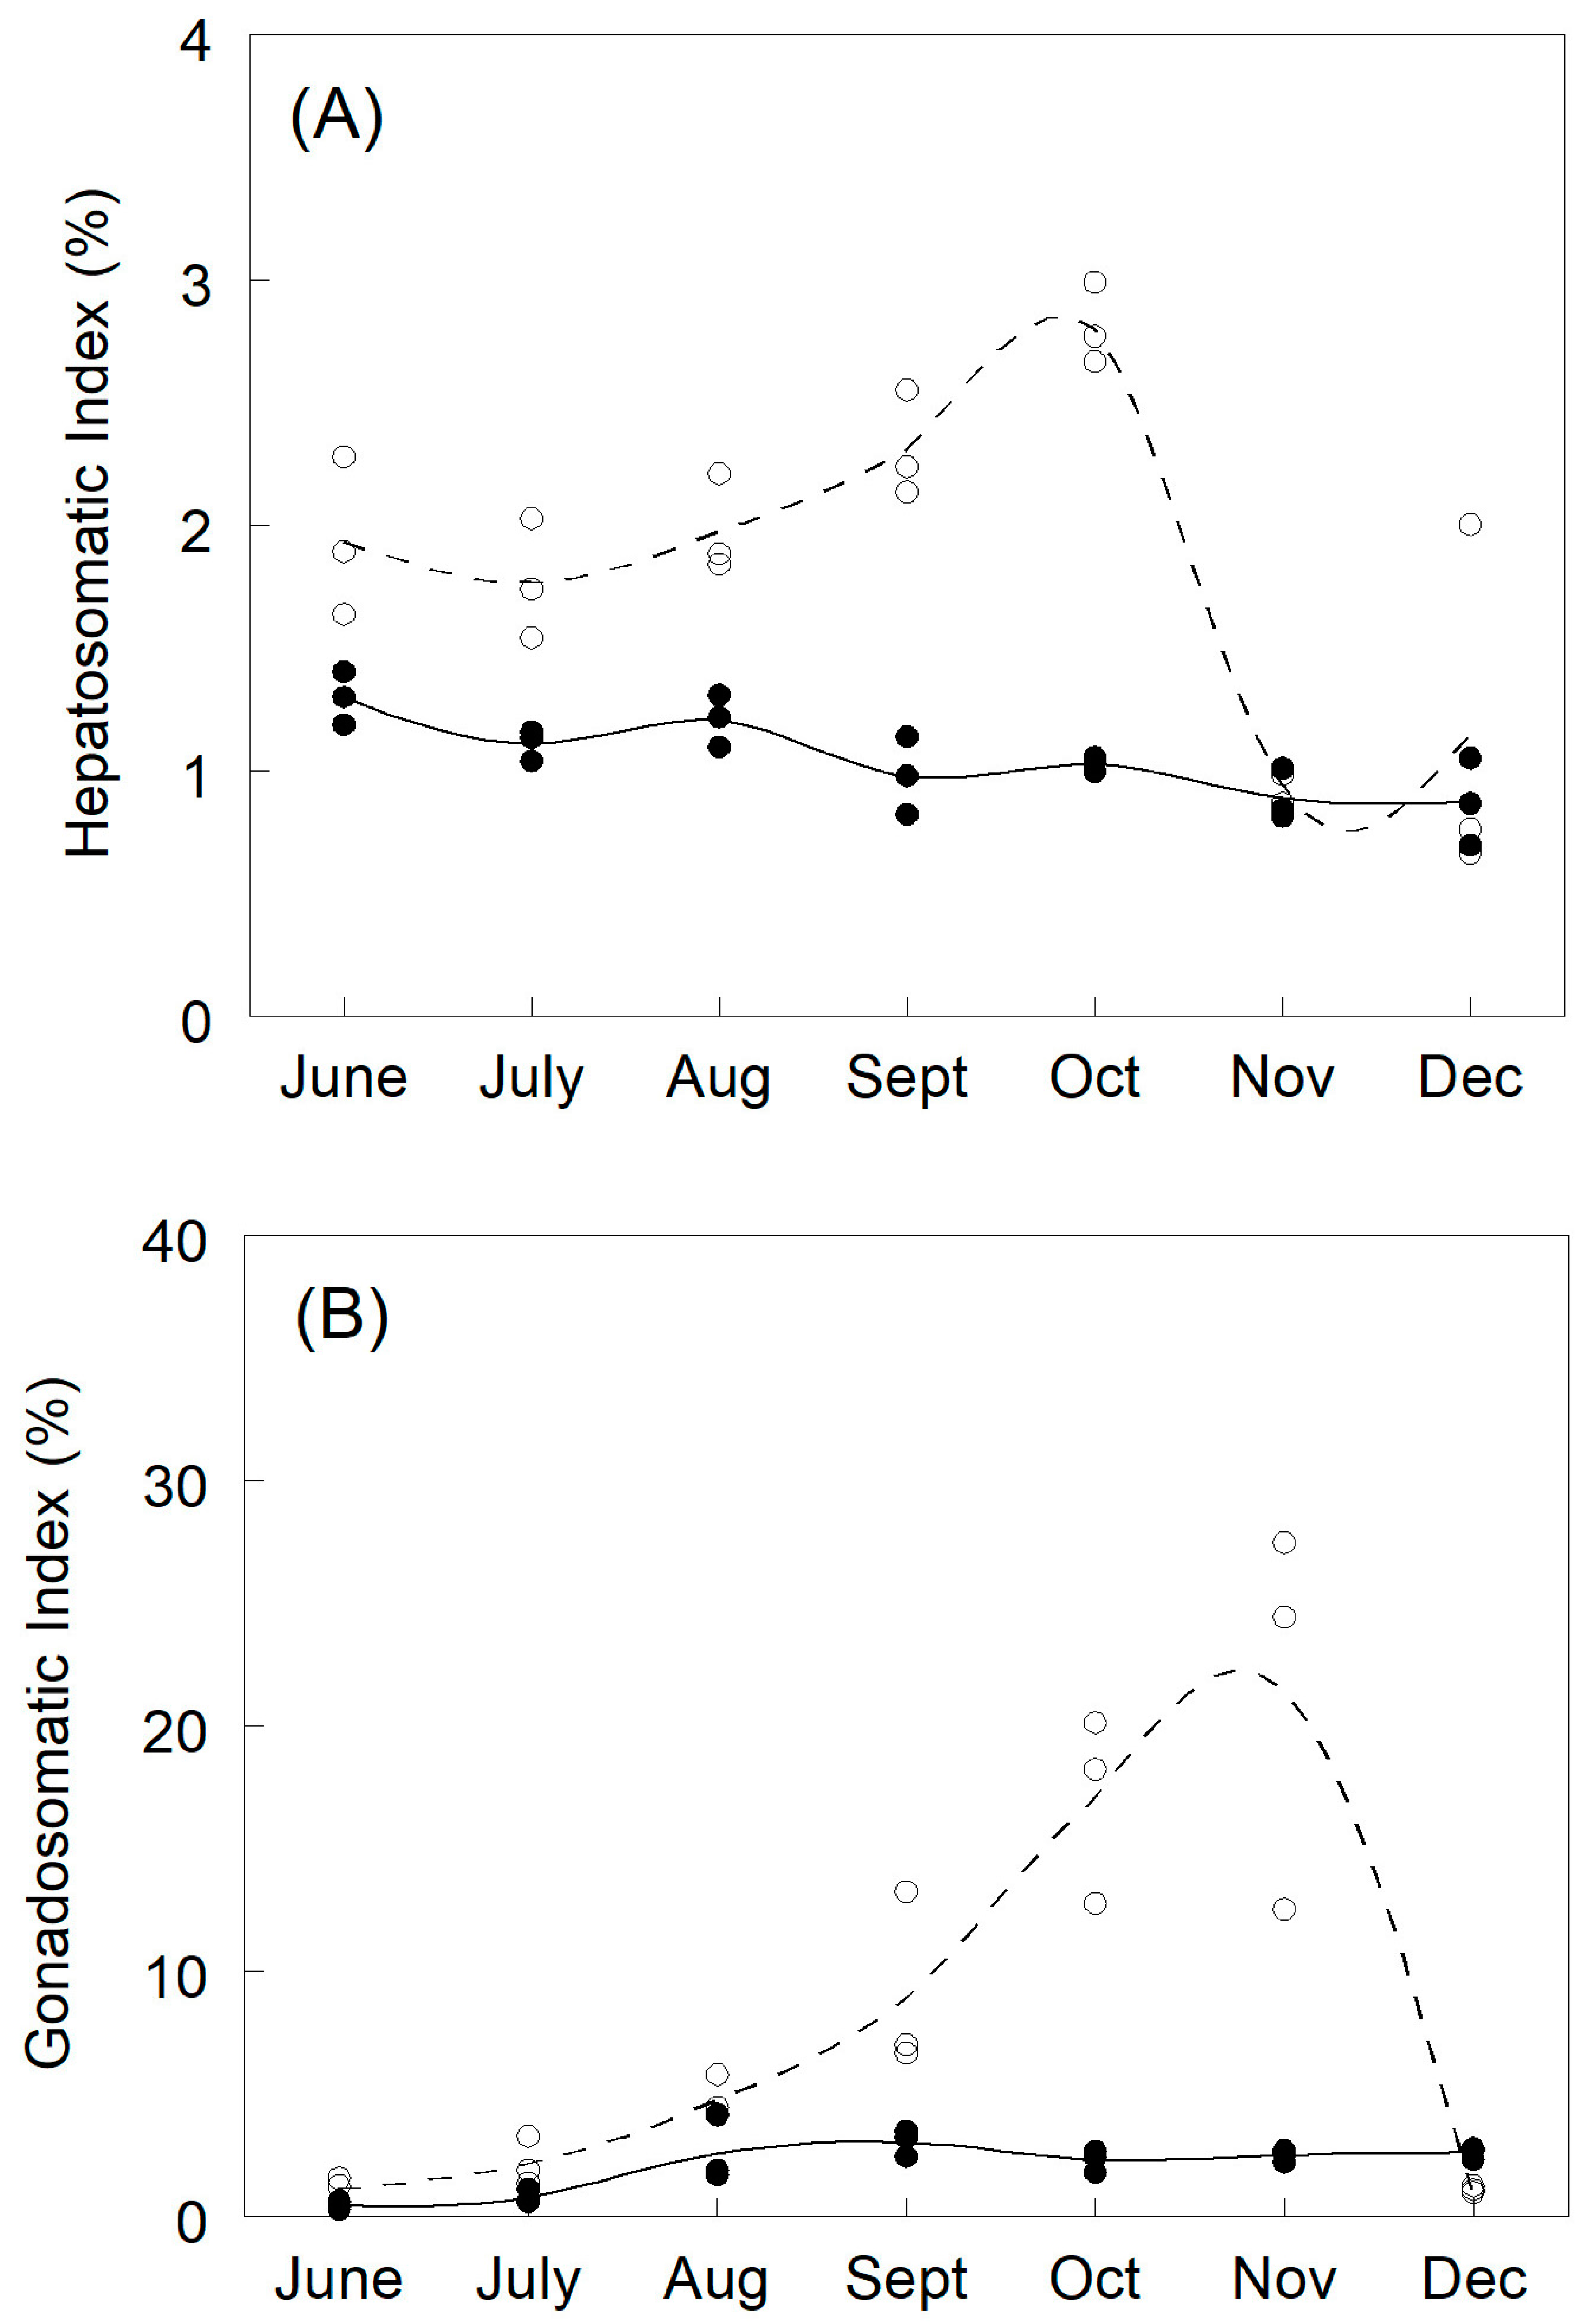
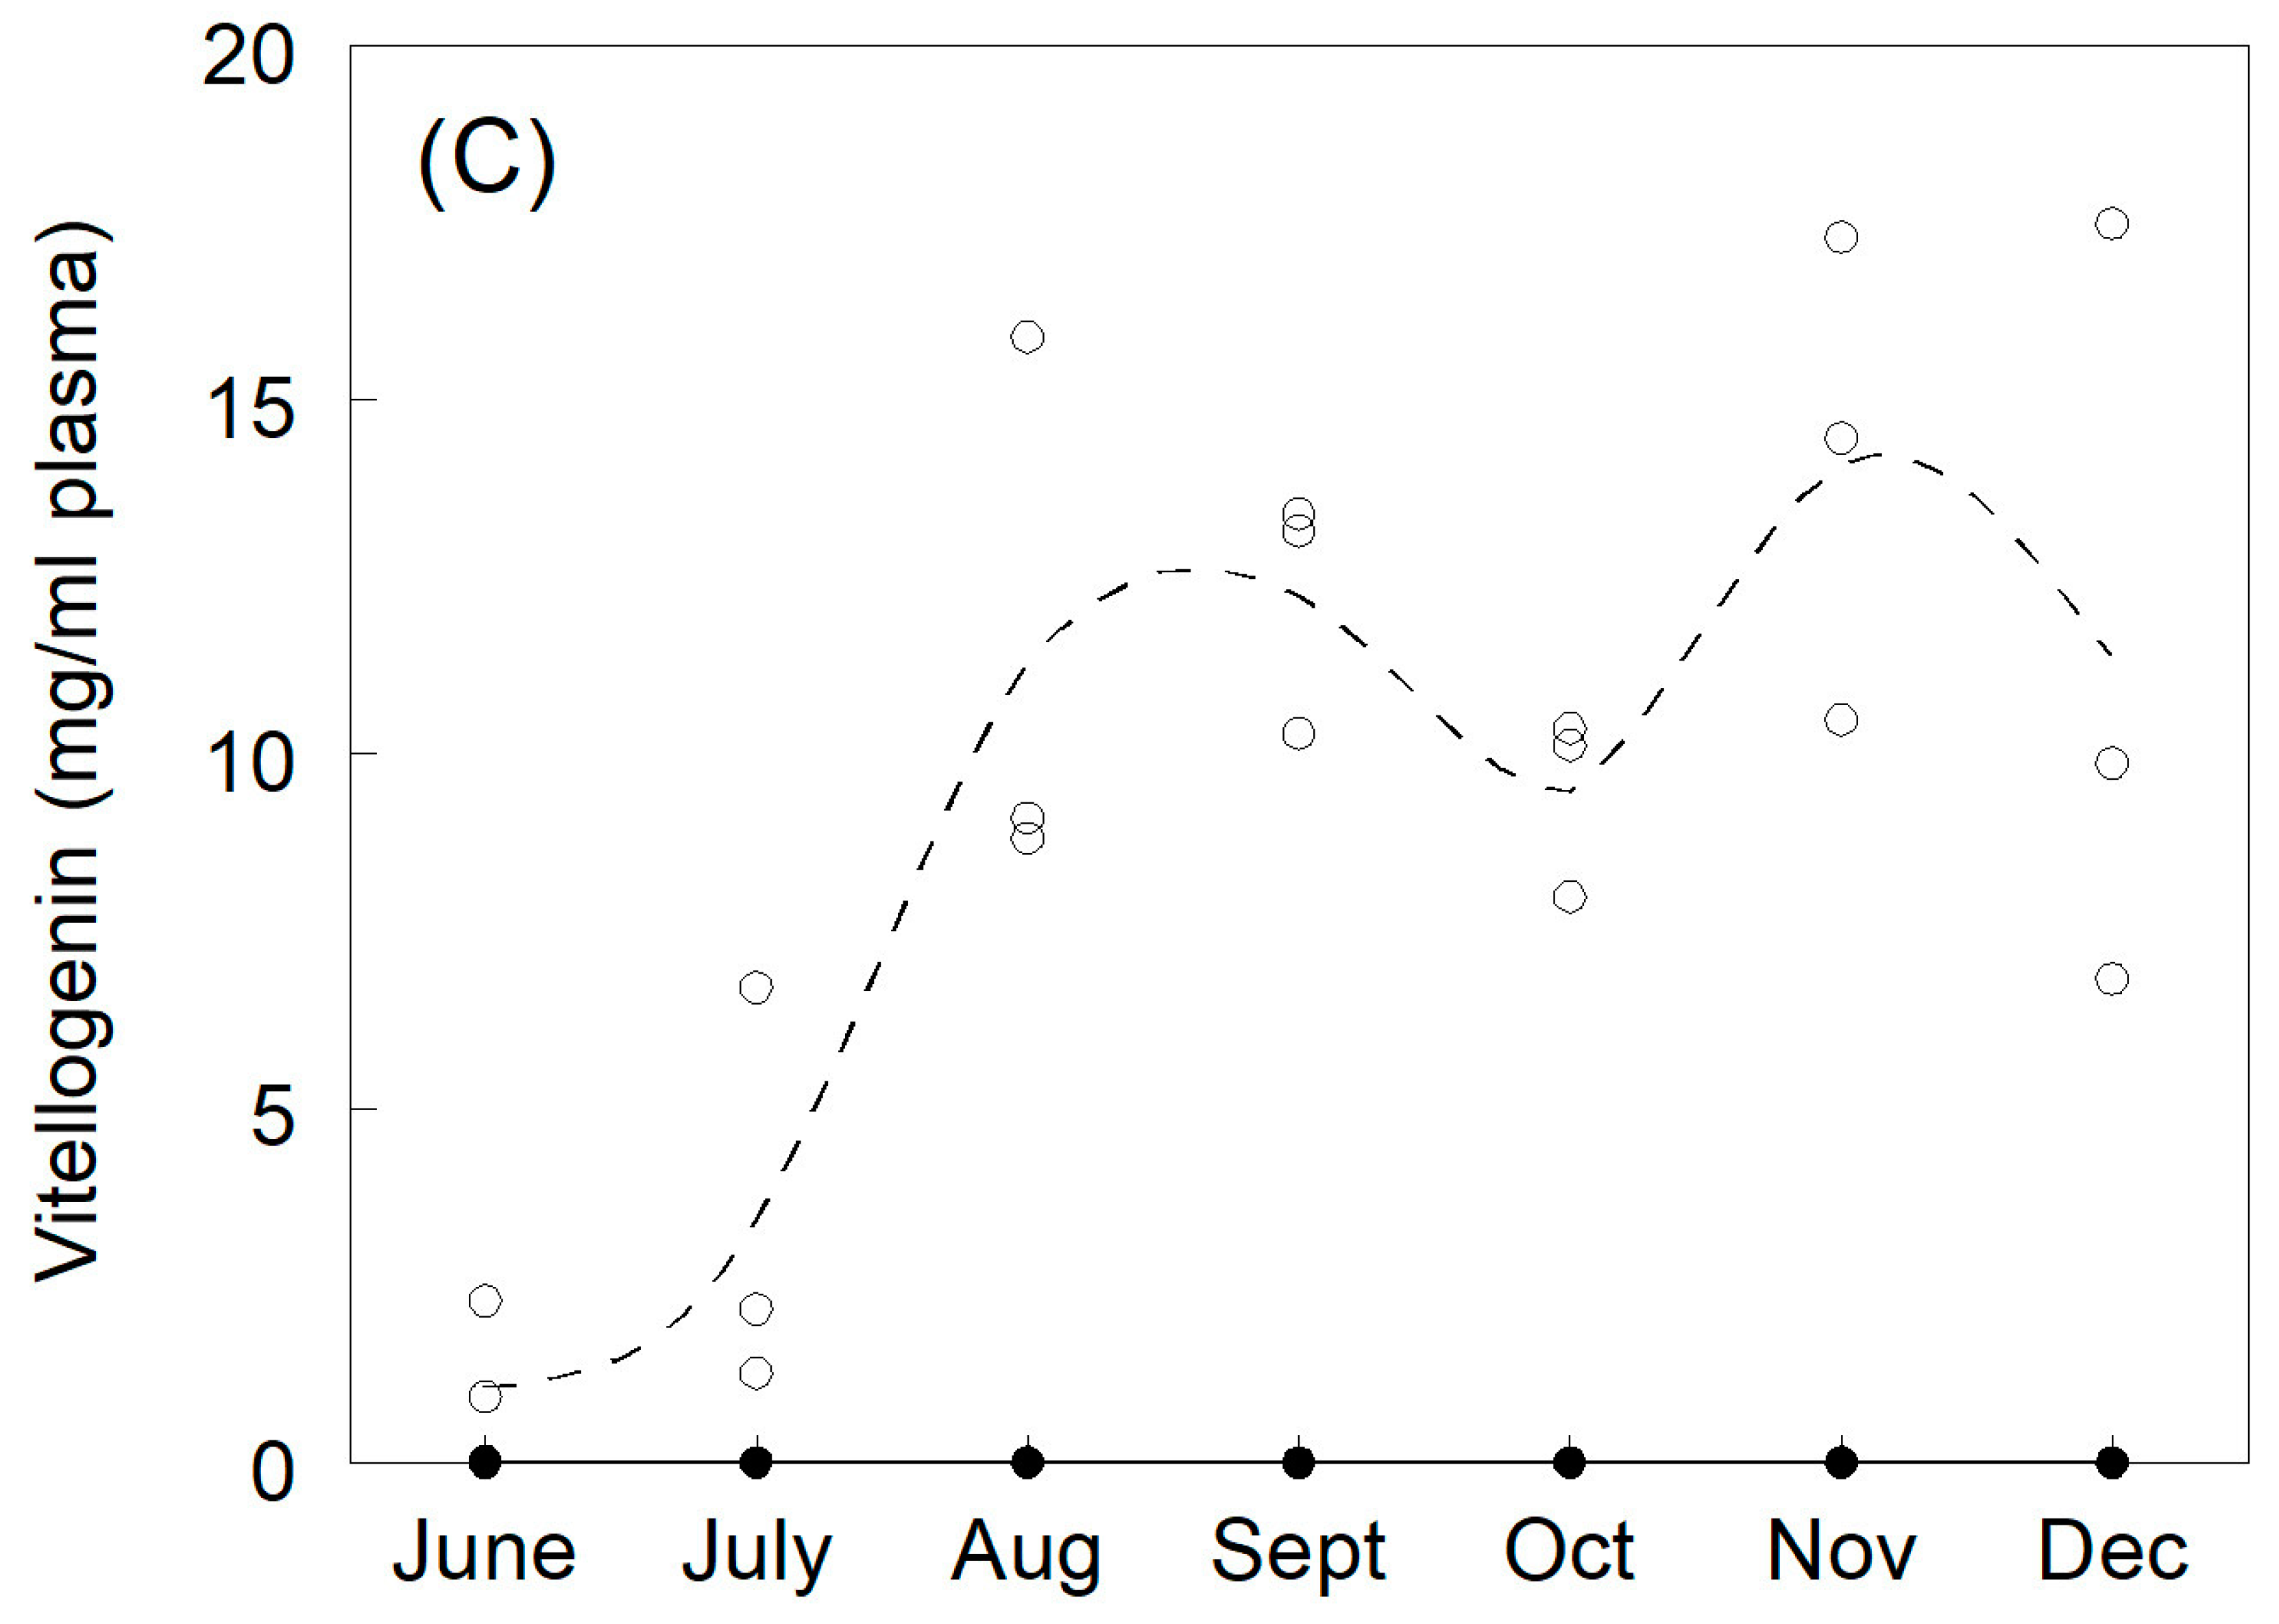
3.1. Plasma Sex Steroids and Vitellogenin

Throughout the 7-month annual reproductive cycle, there were continuous changes in the plasma sex steroids in both males and females, along with massive vitellogenin production in the females. In June, estradiol, testosterone, and 11-ketotestosterone were all at concentrations of about 2–5 ng/mL of plasma. In July, testosterone in the females began to increase, reached a peak of 40 ng/mL in October, and then declined rapidly in November/December down to the June value of 2–5 ng (Figure 1B, Table S1). Female plasma estradiol levels closely followed the testosterone levels, peaking in October at a concentration of 60 ng/mL and then returning to the June levels of 5 ng/mL in November/December. Testosterone in the males did not start to change until August when it began to increase and peaked in October at a concentration of 25 ng/mL and then dropped to about 10 ng/mL in November/December. The early rise in female testosterone (Figure 1B, Table S1) coincided with the rise in estradiol (Figure 1A, Table S1) and the initiation of vitellogenin production in the liver, while the later rise in male testosterone levels coincided with the rise in 11-ketotestosterone and the initiation of spermatogenesis at the peak in October (Figure 1C, Table S1).
Plasma vitellogenin levels closely followed plasma estradiol and reached a peak and held it from September through November at a plasma concentration of about 14.5 mg/mL (Figure 2C). The hepatosomatic index was at its highest for the females in October (30%), which corresponded with the maximum production of vitellogenin (Figure 2A, Table S2). The gonadosomatic index for females peaked in November (25%), which indicated mature gonads and ovulation (Figure 2B, Table S2). The males showed no changes in the hepatosomatic index and only a small 5% increase in the gonadosomatic index, which began in August with the rise in 11-ketotestosterone and continued through spawning to November/December.

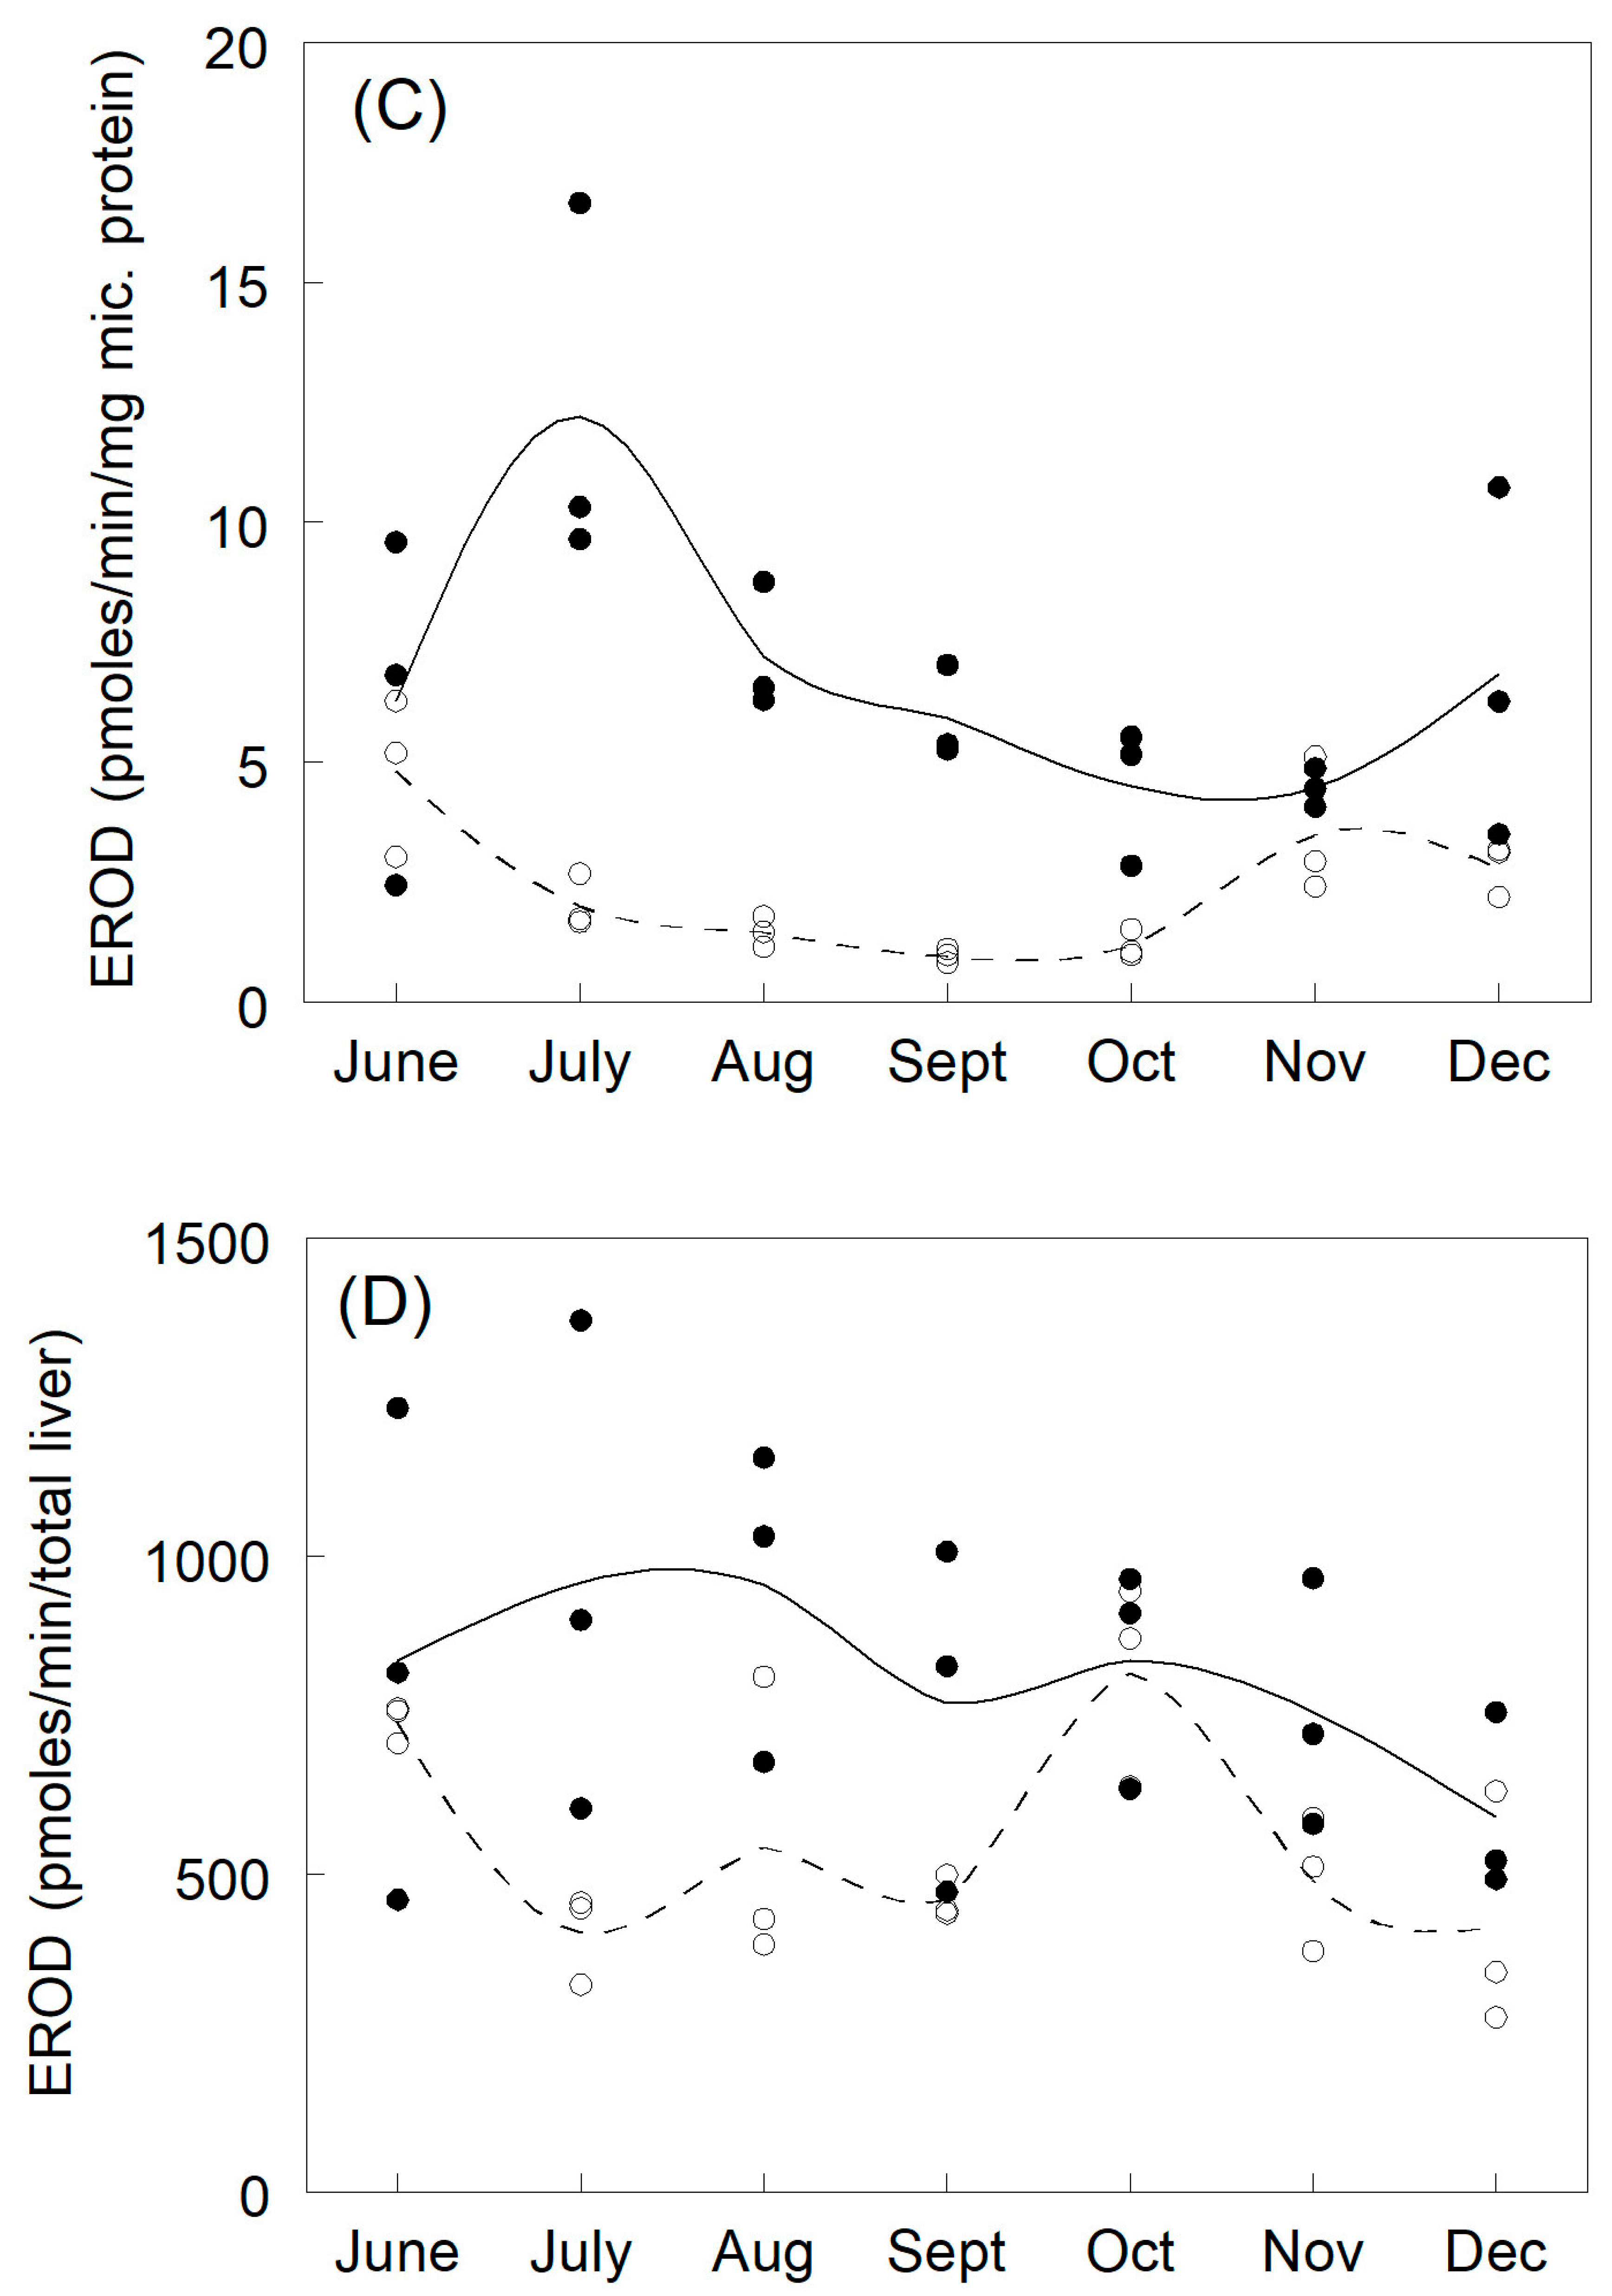
3.2. Microsomal Protein

In June, at the beginning of the annual reproductive cycle for brook trout, cytochrome P450 and EROD activity was at the same level in males and females (Figure 3, Tables S3 and S4). With the increase in sex steroids (estradiol, testosterone, 11-ketotestosterone) the P450 and EROD activity in males increased (when expressed as nmoles/mg of microsomal protein), while the activity in females decreased (Figure 3A,C, Tables S3 and S4). This condition continued throughout the reproductive period from July to December and was caused by an enlargement of the female liver during vitellogenin production. Therefore, when the microsomal activity was expressed as nmoles/total liver, the difference in MFO activity disappeared between males and females throughout the reproductive cycle (Figure 3B,D, Tables S3 and S4).

3.3. Biotransformation Kinetics

While the biotransformation rate data are usually expressed on a per mg microsomal protein basis, to emphasize the impact of the steady enlargement of the female liver during exogenous production of vitellogenin in this study, we have also expressed the rate of HQ, CAT, and PG formation on a total liver basis. Rates of metabolite formation were first determined experimentally in microsomal incubations and reported as pmol/min/mg microsomal protein. During the monthly preparation of microsomes, the amount of microsomal protein that could be obtained from a gram of liver tissue was determined. The mg/g scaling factor and the liver size for each individual fish allowed for the expression of rate data as nmol/min/total liver. We are defining this as the total capacity for each fish liver. The true impact of the increase in female liver size (2-X to 3-X) versus that of males during the maturation cycle can be assessed and incorporated into fish PB-TK models with a greater degree of accuracy.

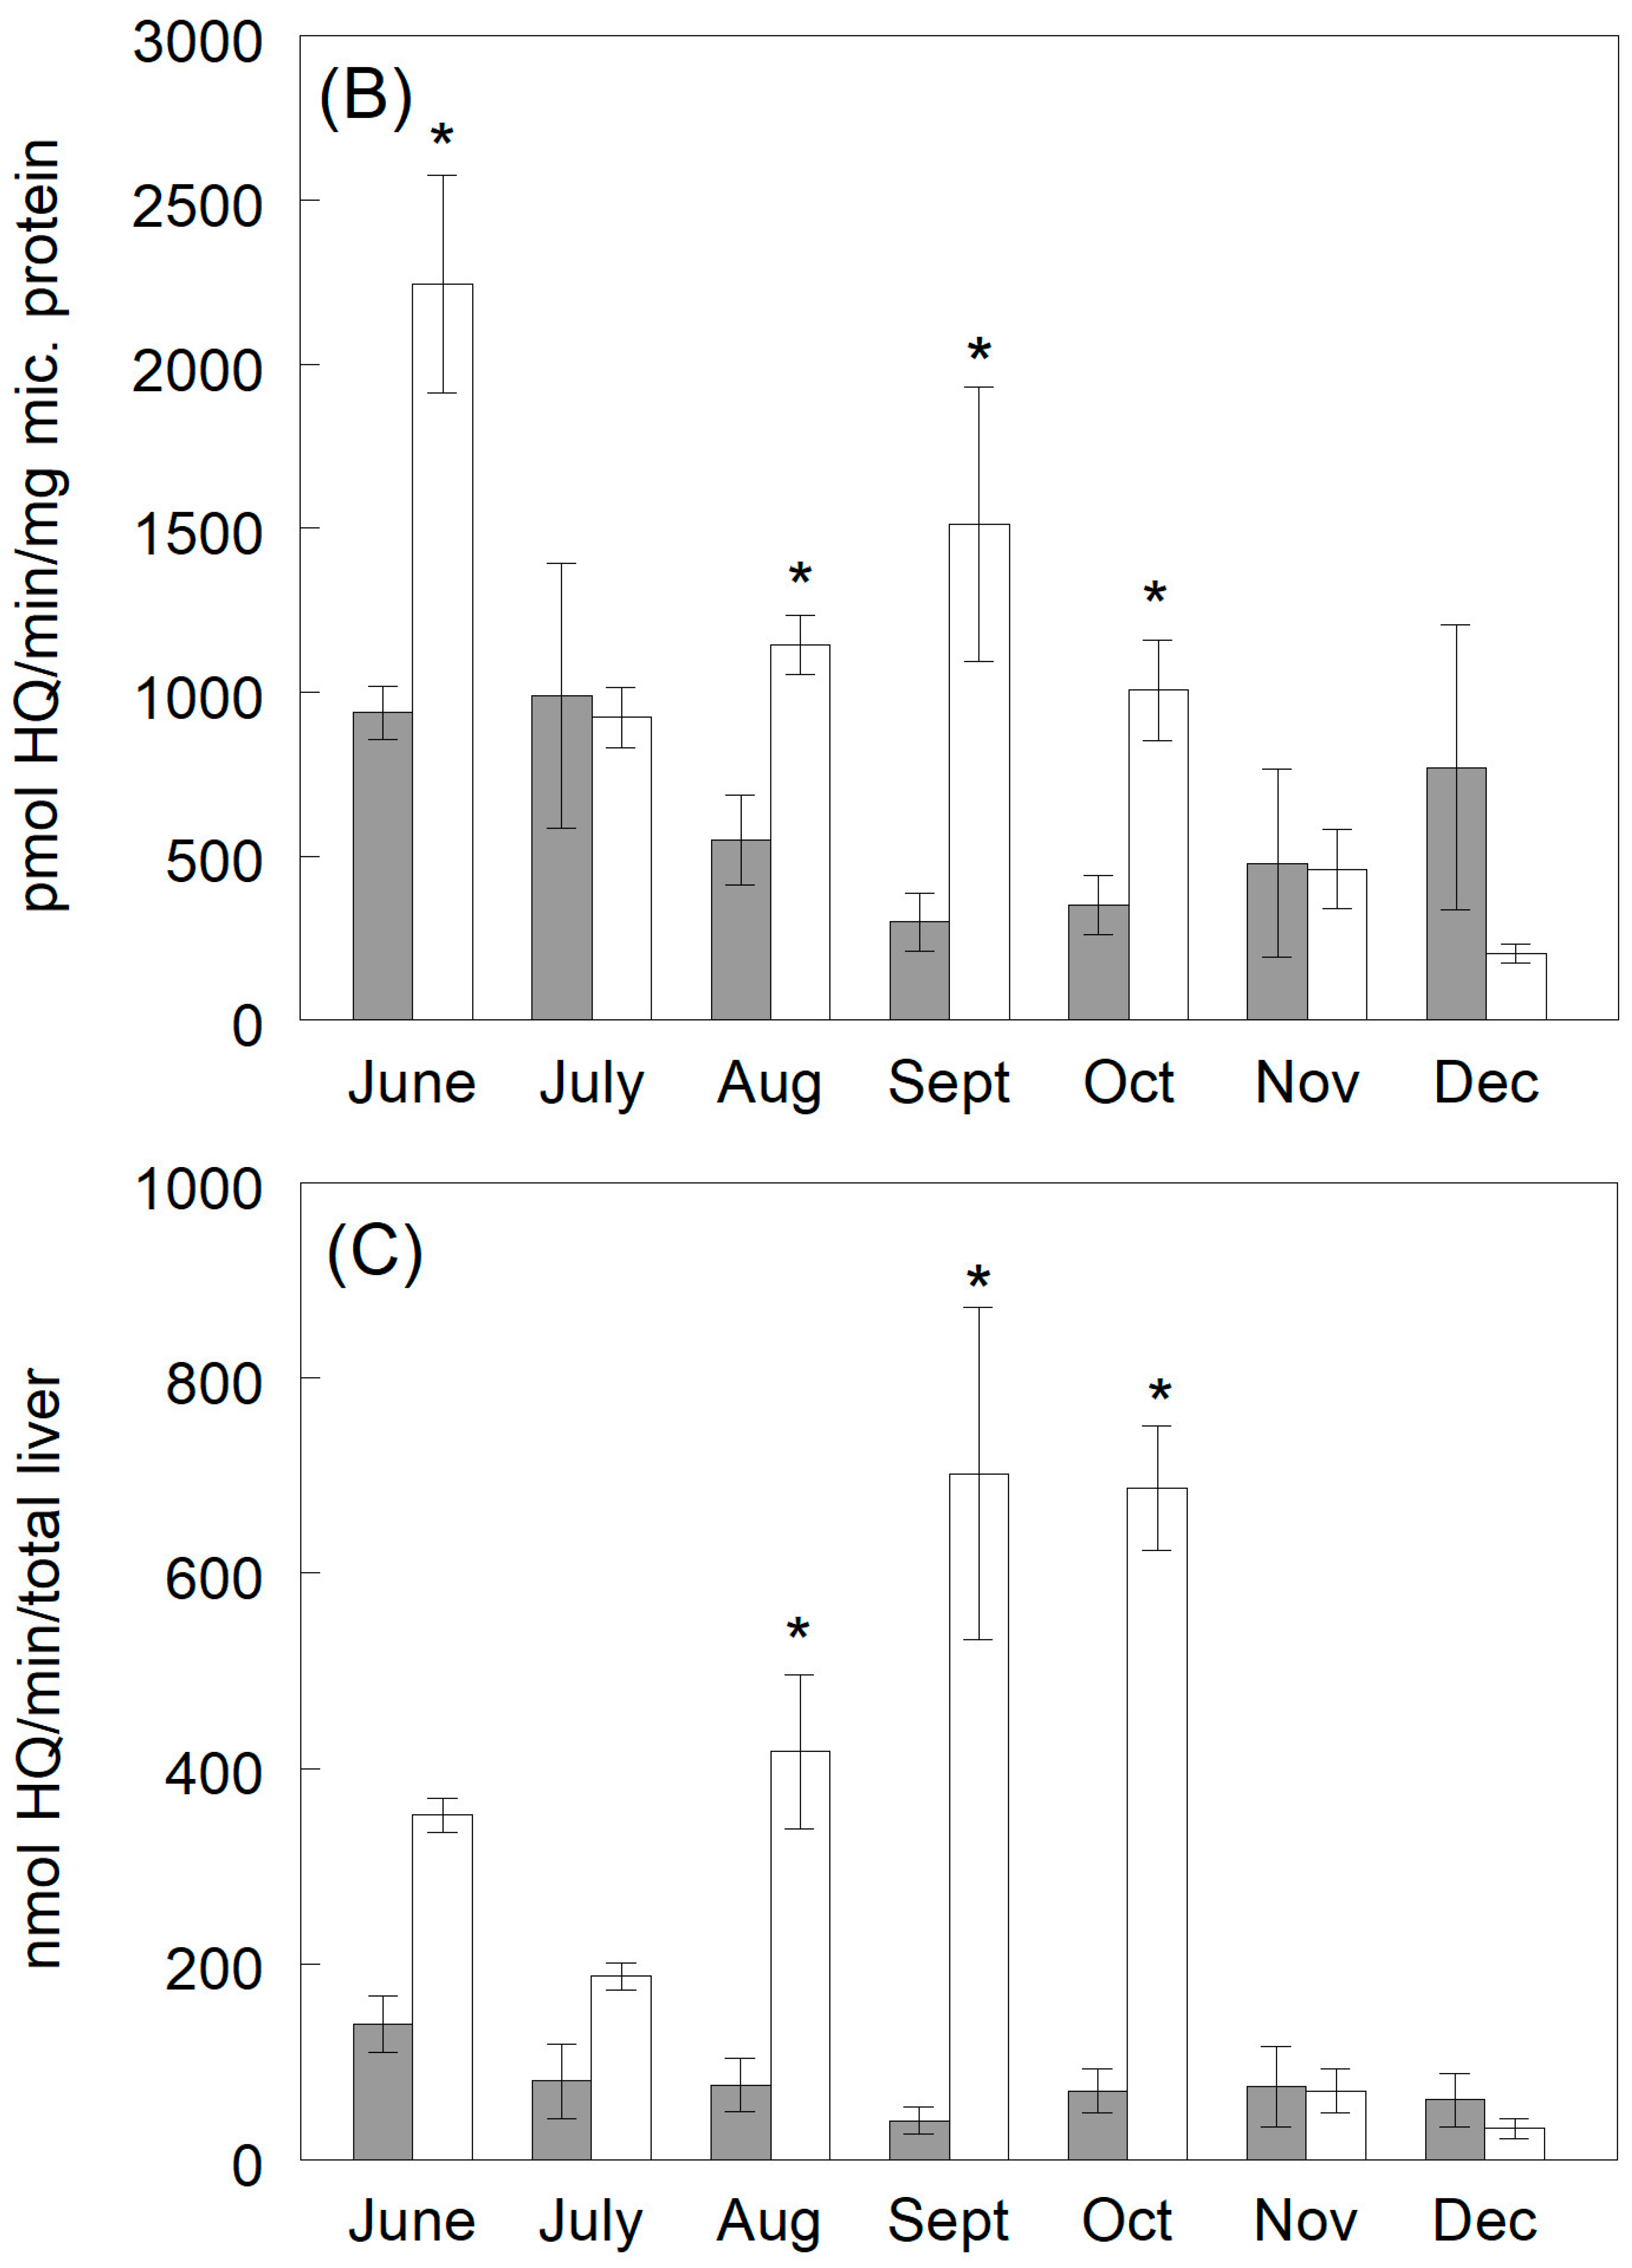
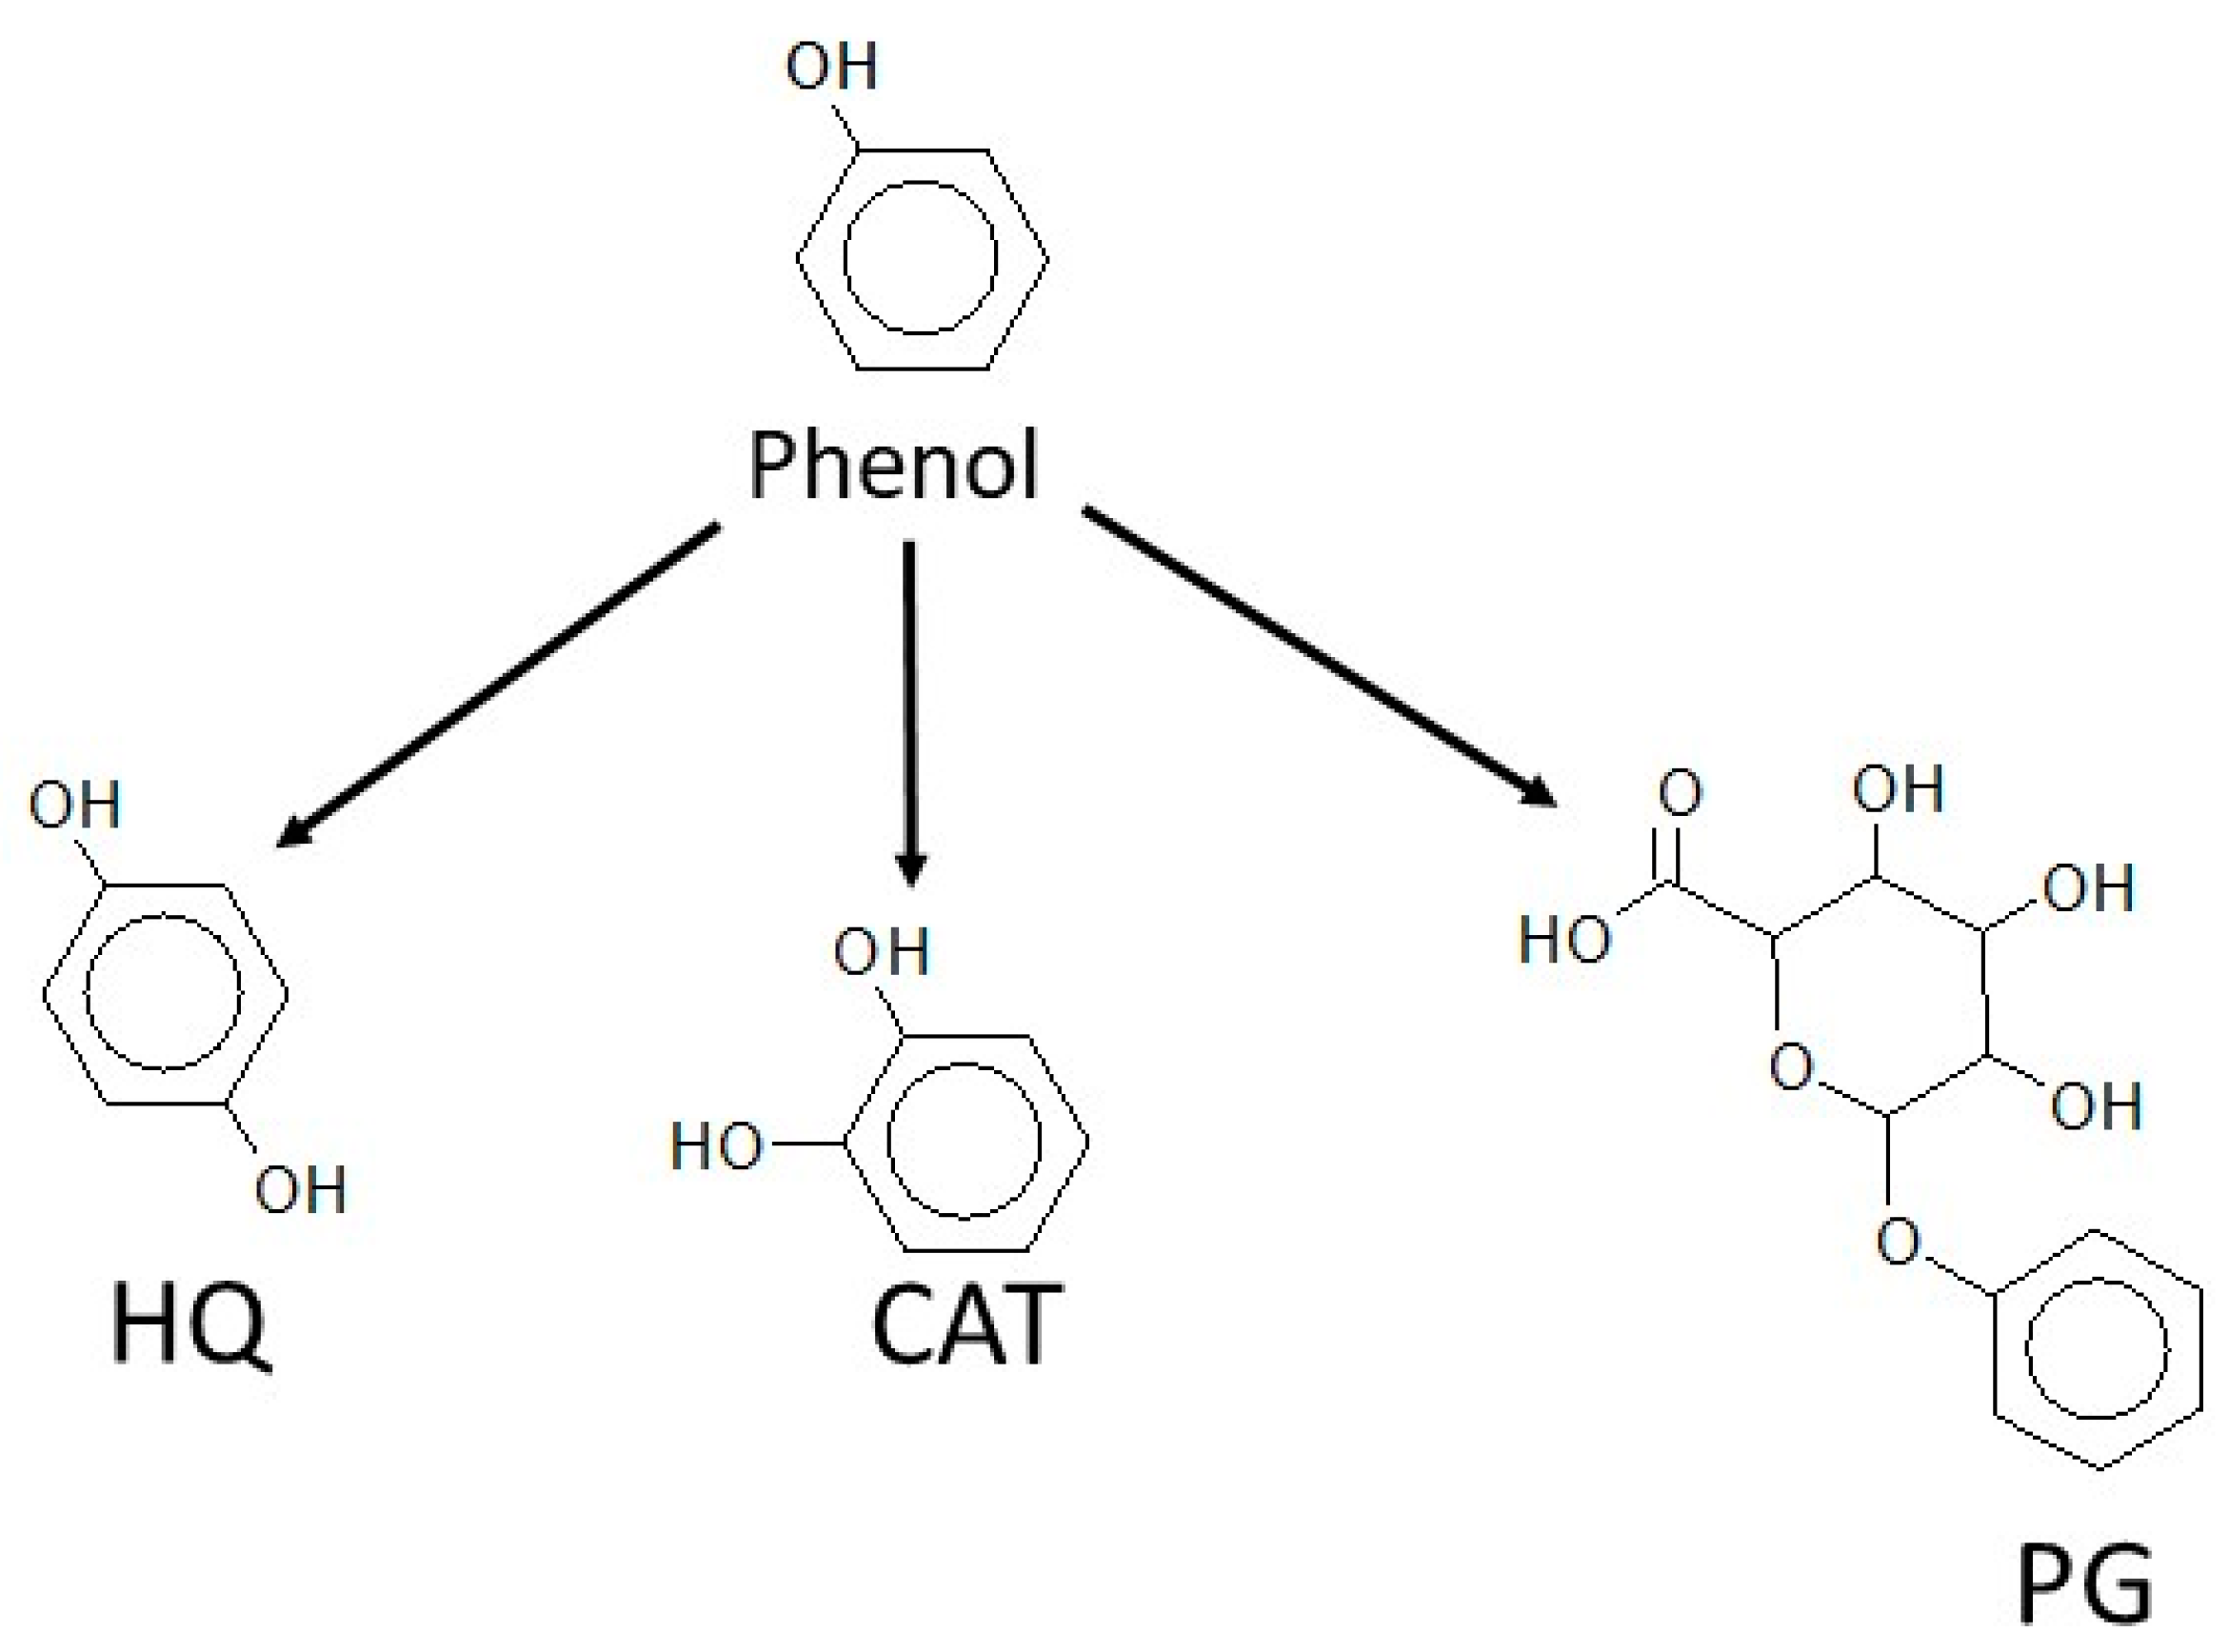
3.3.1. Hydroquinone Production

During the 7-month reproductive cycle of the experiment, there were large changes in HQ production rates in both male and female BKT. Beginning in June and July, rates of HQ production are essentially the same in male and female trout, but by August, the females have significantly higher rates of HQ production (Figure 4B, Tables S5 and S6). As spawning approaches in September and October, the HQ production rates are 17 to 10 times higher in the female trout than in the males on a total liver basis (Figure 4C, Tables S5 and S6). Then, in November and December, following spawning, the rates of HQ production in both males and females fell rapidly to rates similar to or slightly lower than seen previously in June and July, with no significant differences between males and females.
During the 7-month reproductive cycle, rate and capacity parameters (Km and Vmax) were calculated from the monthly HQ rate constants for both males and females. The monthly male BKT Km and Vmax values on a total liver basis fluctuated very little, while the females had minor changes in Km but a steady increase in Vmax from July to November (Figure 4, Tables S5 and S6).

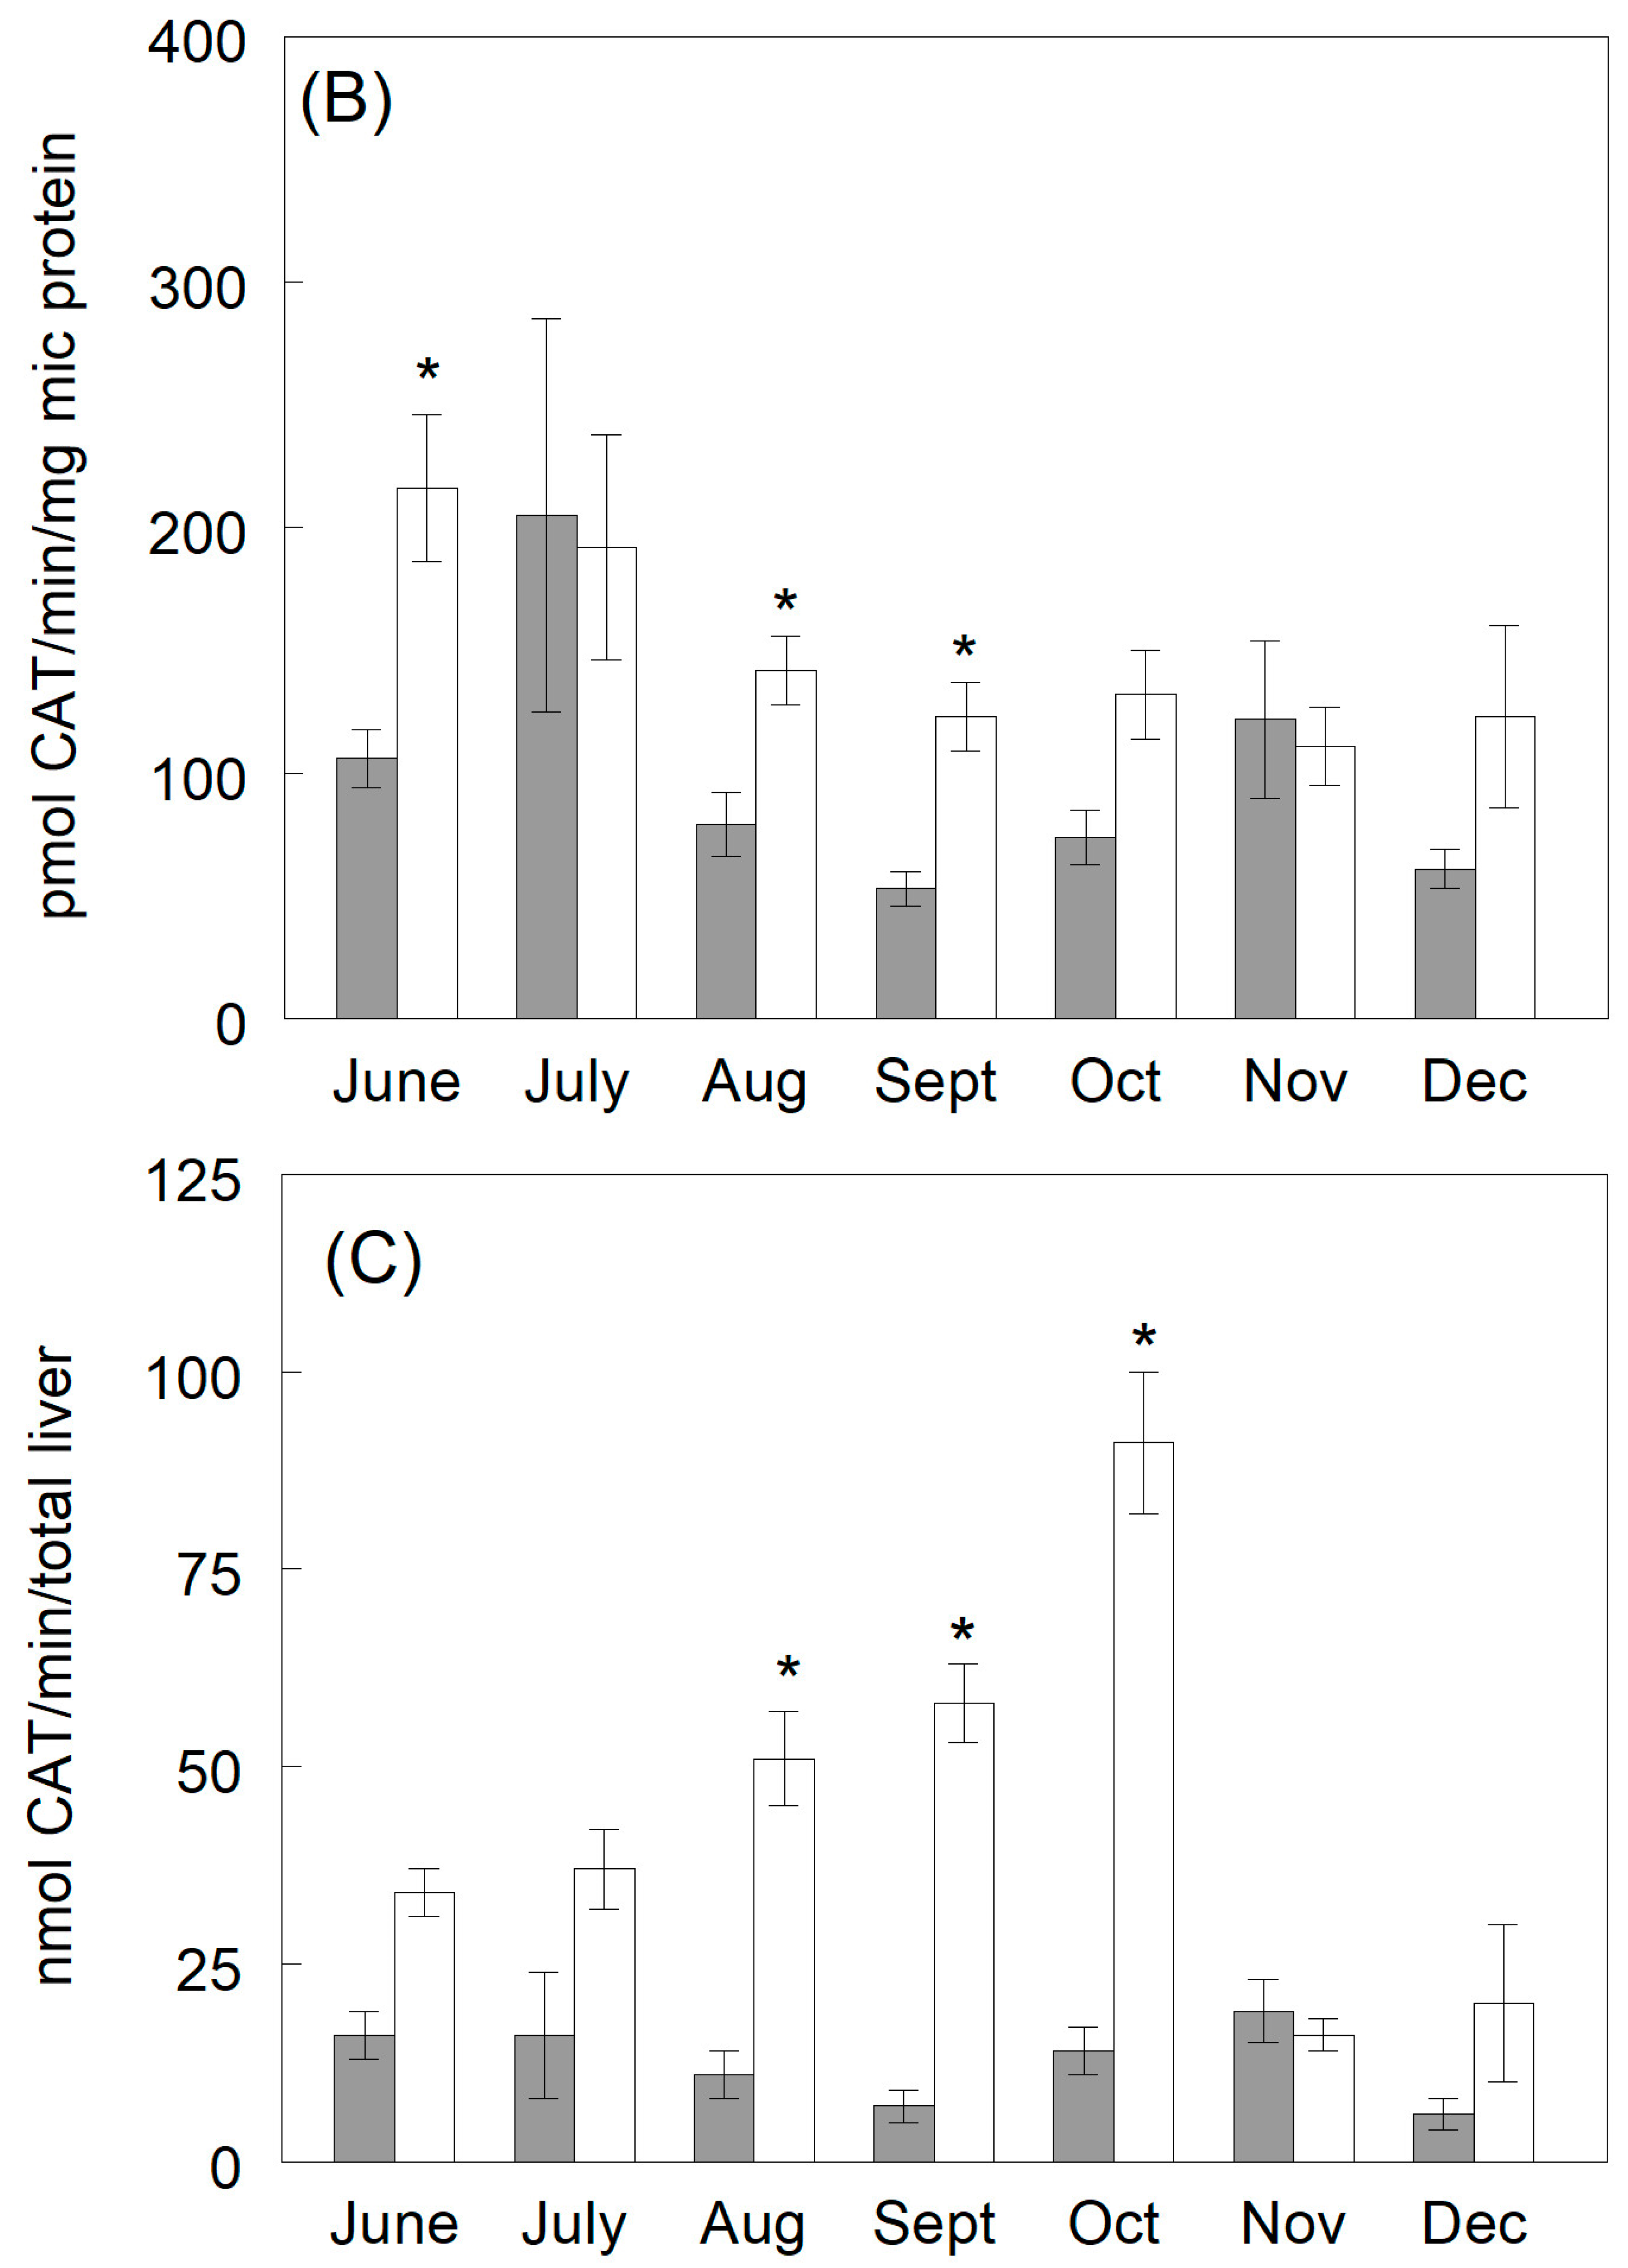
3.3.2. Catechol Production

The formation of CAT in BKT followed a similar monthly trend as HQ, but the average rates of production were much lower (Figure 5B, Tables S7 and S8). Again, as with HQ, there were no differences in the rates of production of CAT between males and females in June and July; however, in August, September, and October, the female BKT rate constants for CAT increased 6 to 10 times above those of the males on a total liver basis (Figure 5C, Tables S7 and S8). In November and December, following spawning, there was a rapid decrease in CAT biotransformation rates back to rates comparable to those seen in June and July.
The calculated monthly Km and Vmax values for CAT expressed on a total liver basis fluctuated very little in males. The females also had no major changes in Km for CAT, but a significant increase in Vmax for CAT from July to November, with the highest Vmax occurring in October (Figure 5, Tables S7 and S8).

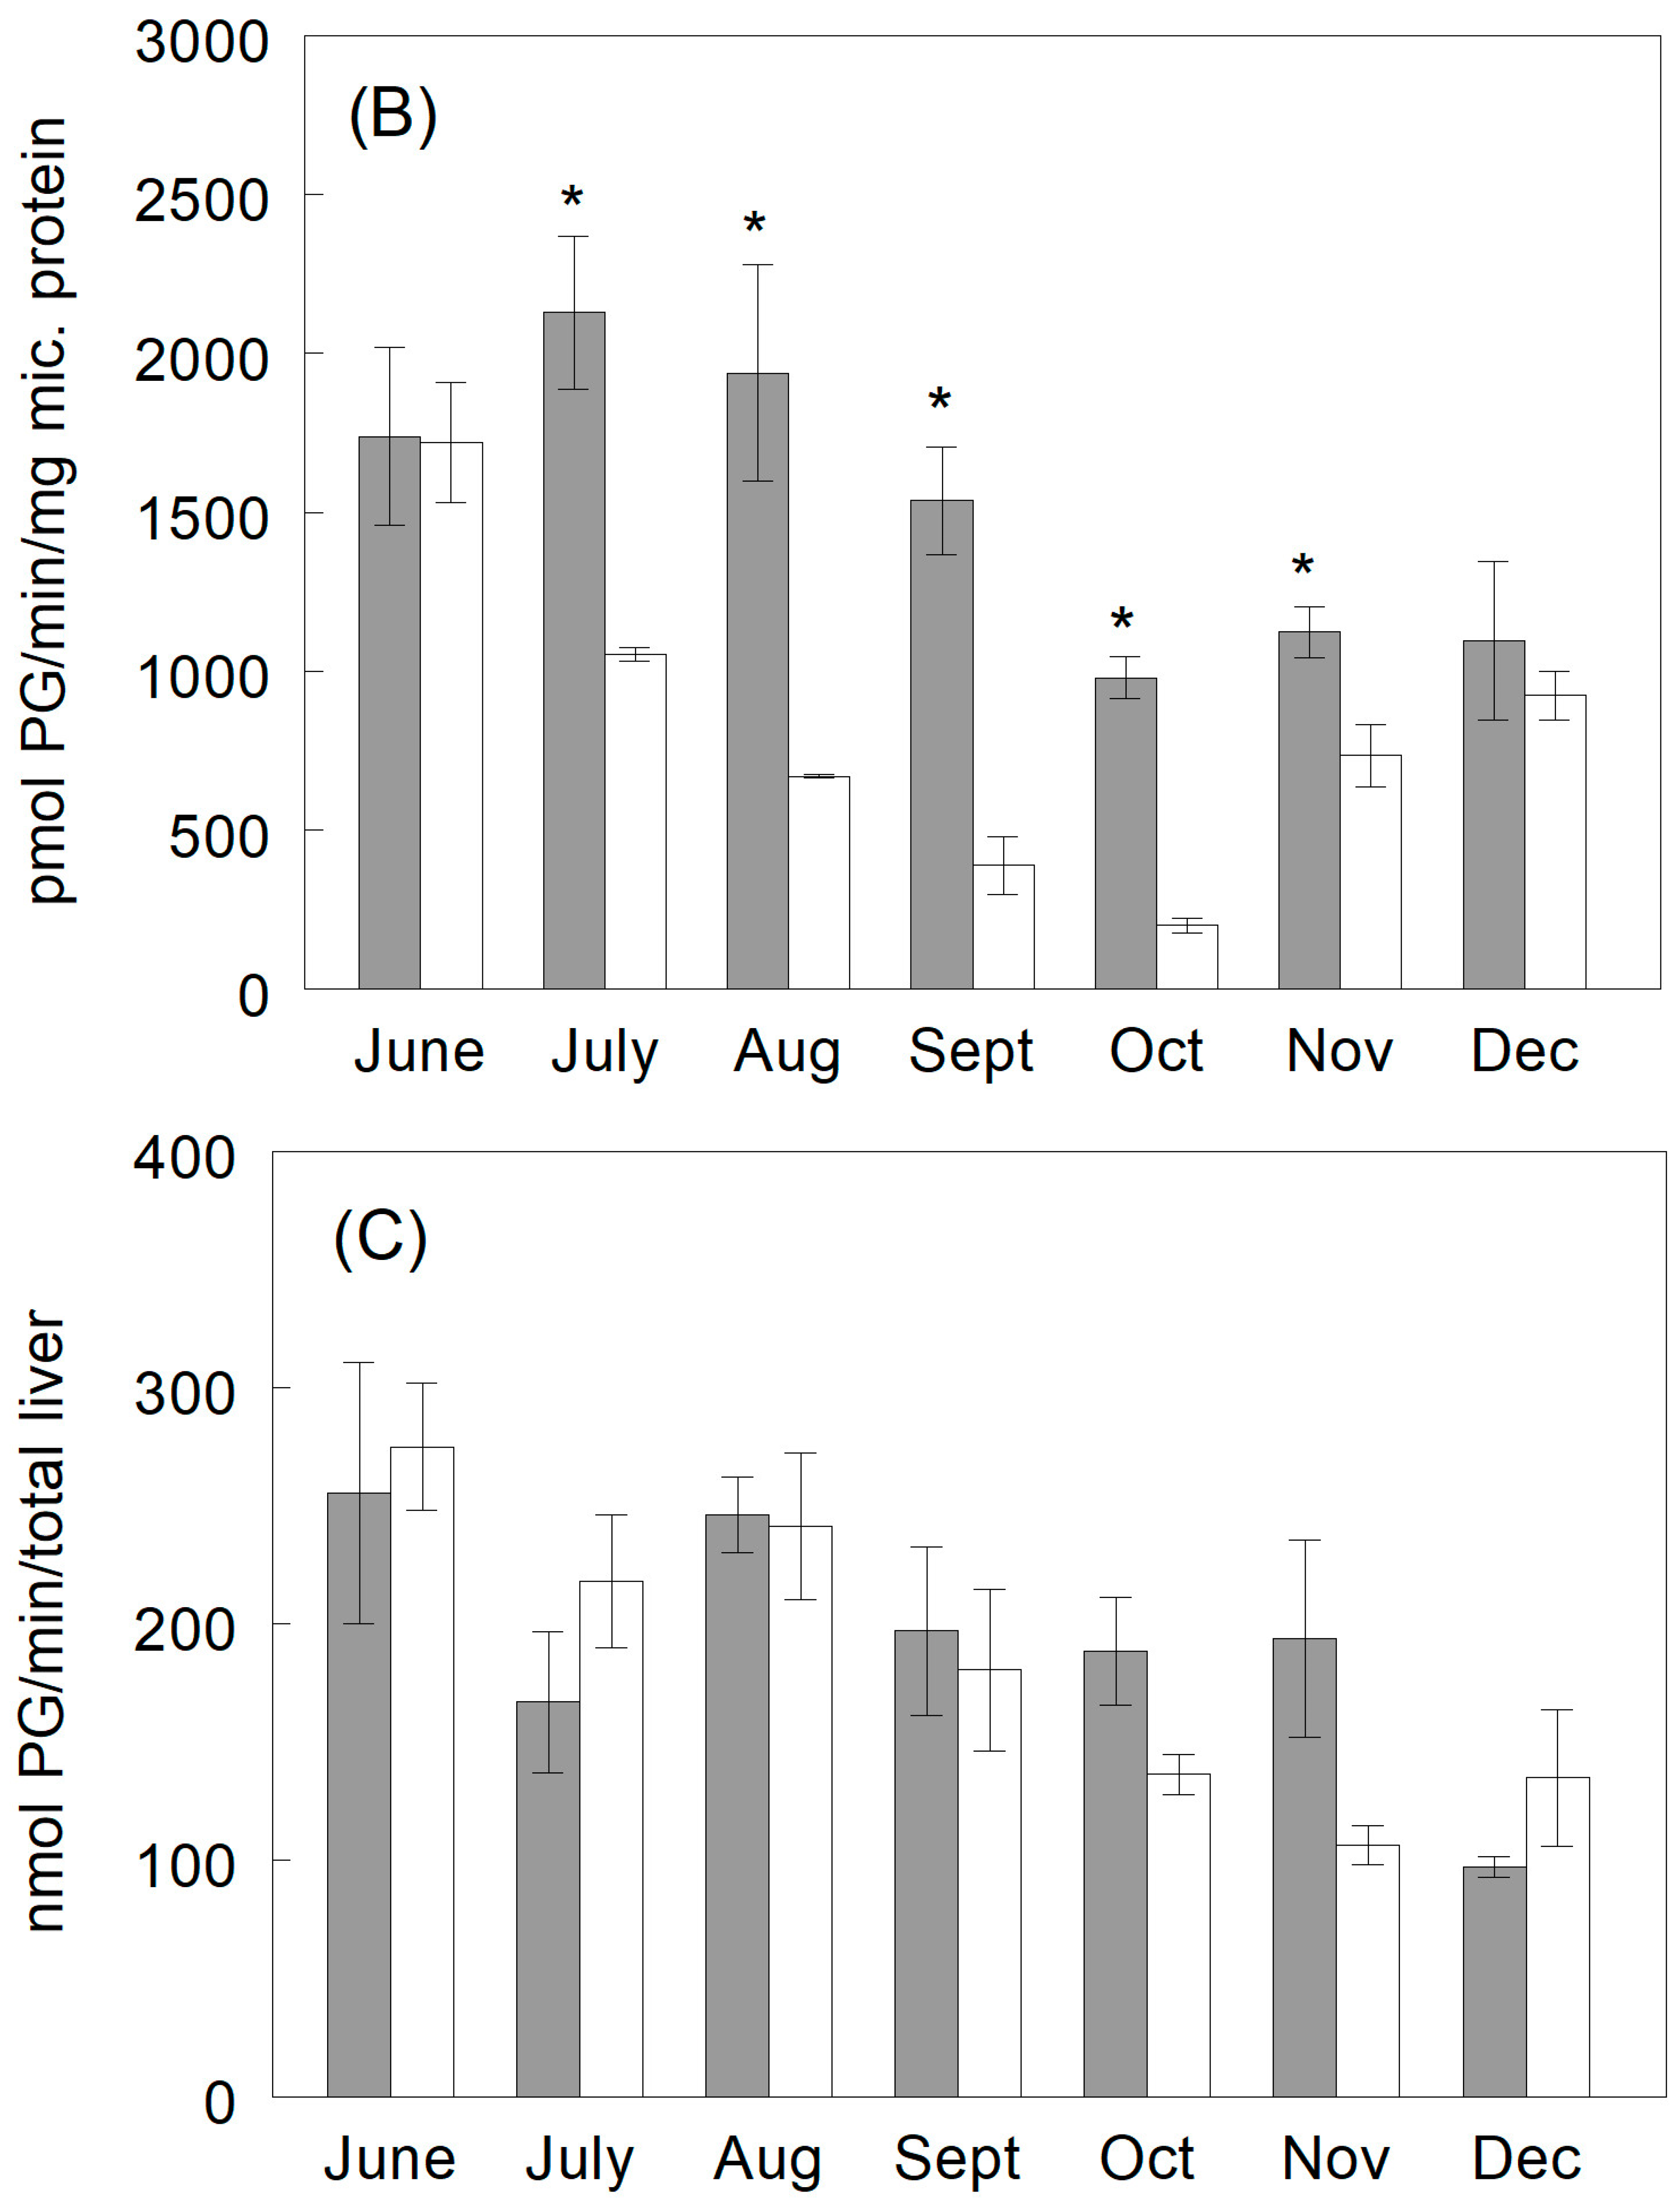
3.3.3. Phenylglucuronide Production

Prior to the onset of maturation in June, there were no differences in the rate of phenylglucuronide formation (pmol/min/mg of protein) or in the total capacity of the liver (nmol/min/liver) in males and females (Figure 6B,C, Tables S9 and S10). There was a steady drop in PG formation in females following the onset of maturation in July when expressed as pmol/min/mg of protein. The females showed a 9-fold decrease at the peak of maturation in October, while the males showed only a 2-fold decrease in the formation of PG. The total capacity of the liver (nmol/min/liver) for phenylglucuronide formation at the peak of maturation (October) remained unchanged in the males and decreased moderately (2-fold) in the females.
During the 7-month reproductive cycle, rate and capacity parameters (Km and Vmax) were calculated from the monthly PG rate constants for both males and females. There were no significant (p > 0.05) differences between the males and females in the liver binding affinity (Km) of phenol prior to the onset of maturation in June (Figure 6A, Table S10). With the onset of maturation (July), there was a rapid increase in female affinity and a less rapid increase in males. At the peak of maturation in October, the binding affinity (Km) of phenol had increased 4.5- and 4.0-fold in females and males, respectively. The Vmax values on a whole liver basis for both males and females showed a steady decrease from the onset of maturation in July to the peak in October. The female Vmax values were significantly (p ≤ 0.05) lower than the males at the peak of maturation in October and November.

4. Discussion

It is well known that the enzyme-mediated biotransformation of phenol produces the metabolites HQ and CAT (Figure 7) [51,52]. In general, metabolite formation follows the rules of electrophilic aromatic hydroxylation established by the linear free energy relationships of physical organic chemistry (i.e., para > ortho > meta). The hydroxyl group of phenol pushes negative charge onto the benzene ring and increases the electron density in the benzene ring, making the ring more nucleophilic and more attractive to electrophiles. This resonance favors ortho (CAT) and para (HQ) ring hydroxylation with no observed hydroxylation in the meta position (resorcinol).
When using predictive methods for fish environmental risk assessment, such as physiologically based toxicokinetic (PB-TK) models for reactive metabolizable chemicals, accurate identification and biotransformation kinetics (Km and Vmax) for each metabolite must be determined [28]. Other factors such as species, gender, and sexual maturation can potentially affect biotransformation rate constants. Earlier studies on three species of adult salmonids (rainbow trout, brook trout, and lake trout) showed some differences between species but no gender-related changes in the Phase I or II biotransformations of phenol in any of the three trout species studied [27].
The present study quantified differences in the Phase I biotransformation of phenol between adult male and female fall spawning brook trout at 11 °C over a 7-month reproductive cycle. The product ratio for HQ and CAT was measured at 5:1 throughout the maturation period, which was consistent with that reported for juvenile rainbow trout [22]. In the presence of rat liver microsomes and an NADPH regenerating system, phenol was shown to produce hydroquinone and catechol at a ratio of 20:1 [51], suggesting that there is a greater relative ortho-hydroxylation rate in fish versus rats. Results indicated that in June and July at the beginning of the maturation period for brook trout, the rates of HQ and CAT production in males and females were similar. By August, HQ and CAT showed a rapid increase for females in the production rates on a total liver basis, while the males showed no increases above the June and July values. Female biotransformation rates for HQ and CAT continued to increase each month throughout the maturation period to a peak in October that was 10- to 17-fold higher for HQ and 6- to 8-fold higher for CAT than the males (Figure 4 and Figure 5). Differences in HQ and CAT production rates between males and females ended abruptly in November and December, as female rates dropped rapidly to levels below those in June and July on a total liver basis (Figure 4 and Figure 5). This rapid drop in November and December was the result of the rapid reduction in the size of the female liver caused by the reduction of plasma estradiol (Figure 1A), which turned off active exogenous vitellogenin production in the liver, as indicated by the fall in HSI from its peak in October (Figure 2A). The drop in GSI indicated ovulation in October or early November (Figure 2B). Vitellogenin plasma levels remained high through November and then declined in December (Figure 2C). This slow decline in plasma vitellogenin levels may in part be due to the reabsorption of vitellogenin from unspawned atretic eggs remaining in the body cavities of the females.
This study demonstrates a definite correlation between sexual maturation and alteration of hepatic Phase II biotransformation (glucuronidation), which was not influenced by temperature fluctuations, as temperature was held constant throughout the 7-month reproductive cycle. Following the onset of maturation, the rate of PG formation (pmol/mg microsomal protein) decreased markedly in females, while only a moderate (2-fold) decrease occurred in males (Figure 6B). If the rate of PG formation, following the onset of maturation, is expressed on a total capacity or total liver basis (Figure 6C), the males remained unchanged and the females decreased only 2-fold, probably due in part to the enlargement of the liver during maturation. The decrease in PG production rates in females may be related to the increased demand on the UDPGT system required to deactivate the high levels of sex steroids present in the blood at the peak of maturation. The occurrence of conjugated sex steroids in the urine of female rainbow trout at the peak of maturation that act as sex pheromones and assist in the successful spawning of salmonids has been reported [53] and would place a greater demand on the UDPGT system and reduce the production of PG in females.
The Km values for PG decreased in both males and females during maturation, showing a similarly strong enzyme affinity that indicates a high capacity for PG production at low environmental phenol concentrations, while Vmax values for PG in females showed a significant (p ≤ 0.05) drop at the peak of maturation in October and November (Figure 6), which indicates the females have less capacity than the males for PG production at high concentrations of phenol. The data indicate that sexually mature adult female brook trout may exhibit greater susceptibility to phenol toxicity than sexually mature adult males because of the combined effects of elevated Phase I biotransformation in mature females (Figure 4 and Figure 5) and diminished Phase II capacity in mature adult females observed (Figure 6).
Consistent with the literature [9,11], cytochrome P450 and EROD specific activity (per mg microsomal protein) in the present study were higher in males than females over the maturation period. When P450 and EROD levels are adjusted for the increased liver size at the time of increased liver activity for the production of vitellogenin and presented on a total liver basis, P450 protein levels and EROD rates showed no difference between males and females (Figure 3). In the past, sex-related changes in biotransformation have been measured almost entirely by enzyme activity. Sex-related changes were shown to occur in several species with males having higher levels of enzyme activity than females, but these studies expressed the values obtained on the basis of mg of microsomal protein and most have not corrected for the increased liver size of the females. Changes in the metabolic capacity of the liver must be addressed to fully understand the seasonal fluctuations in biotransformation. This study demonstrates the importance of looking at biotransformation kinetics and not just enzyme activity when dealing with enzyme activation and deactivation processes. This indicates changes in the amounts of both microsomal protein and liver/body weight ratios. Under these circumstances, the overall catalytic capacity derived from a specific P450 isoenzyme would change only when the amount of that isoenzyme relative to the total P450 is affected [54].
The sex-linked changes in P450 and EROD measurements indicate overall changes in MFO enzymes but do not point out changes in specific MFO responsible for metabolizing specific chemicals, such as phenols. It has been demonstrated that different forms of P450 exist in fish and exhibit specific monooxygenase activities [55,56,57,58,59], but the number and identity of the specific forms and their regulation by sex hormones are not known [54]. Therefore, knowing the total P450 or EROD levels in these trout does not inform us as to the sex-linked changes in the biotransformation of specific environmental chemicals or provide the necessary rate constants for use in fish PB-TK modeling. It is concluded that to properly assess sex-linked changes in biotransformation rates for specific P450 isoenzymes during the reproductive cycles of oviparous fish requires in-depth studies on the biotransformation kinetics of specific chemicals, like those carried out in the present study with phenol, over a wide range of substrate concentrations are necessary.
There are some dramatic changes in the Michaelis–Menten constants that should be accounted for over a maturation cycle to achieve the most accurate predictions possible when incorporated into PB-TK models. In the past, the assessment of fish toxicity and hepatic biotransformation was generally made using sexually immature juveniles or adults. However, the known metabolic changes that occur in fish during maturation and the results of those studies on mature adult male and female brook trout emphasize the importance of future efforts to understand the impact of annual reproductive cycles on the toxicity of xenobiotic chemicals for use in predictive toxicity models and environmental risk assessment.

Supplementary Materials

The following supporting information can be downloaded at: https://www.mdpi.com/article/10.3390/fishes9080311/s1, Table S1: Plasma Sex Steroids (Estradiol, Testosterone, and 11-Ketotestosterone as Reported Over a 7-Month Reproductive Cycle in the Brook Trout. Values are the mean ± standard error of three fish. Table S2: Hepatosomatic Index (HSI) and Gonadosomatic Index (GSI) as Reported Over a 7-Month Reproductive Cycle in the Brook Trout. Values are the mean ± standard error of three fish. Table S3: Cytochrome P450 Protein Content Reported Over a 7-Month Reproductive Cycle in the Brook Trout. Values are the mean ± standard error of three fish. Table S4: EROD Activity as Reported Over a 7-Month Reproductive Cycle in the Brook Trout. Values are the mean ± standard error of three fish. Table S5: Rates of hydroquinone (HQ) formation in adult male and female brook trout hepatic microsomes resulting from the incubation with phenol at 11 °C over a 7-month reproductive cycle from June to December. The Vmax values are fitted to the combined average rate ± standard error of the 3 male and 3 female microsomal preparations at each Phenol concentration. Table S6: Capacity parameter (Km) for hydroquinone (HQ) formation in adult male and female brook trout hepatic microsomes resulting from the incubation with phenol at 11 °C over a 7-month reproductive cycle from June to December. The Km values (mmol) are fitted to the combined average rate ± standard error of the 3 male and 3 female microsomal preparations at each phenol concentration. Table S7: Rates of catechol (CAT) formation in adult male and female brook trout hepatic microsomes resulting from the incubation with phenol at 11 °C over a 7-month reproductive cycle from June to December. The Vmax values are fitted to the combined average rate ± standard error of the 3 male and 3 female microsomal preparations at each Phenol concentration. Table S8: Capacity parameter (Km) for catechol (CAT) formation in adult male and female brook trout hepatic microsomes resulting from the incubation with phenol at 11 °C over a 7-month reproductive cycle from June to December. The Km values (mmol) are fitted to the combined average rate ± standard error of the 3 male and 3 female microsomal preparations at each phenol concentration. Table S9: Rates of phenylglucuronide (PG) formation in adult male and female brook trout hepatic microsomes resulting from the incubation with phenol at 11 °C over a 7-month reproductive cycle from June to December. The Vmax values are fitted to the combined average rate ± standard error of the 3 male and 3 female microsomal preparations at each Phenol concentration. Table S10: Capacity parameter (Km) for phenylglucuronide (PG) formation in adult male and female brook trout hepatic microsomes resulting from the incubation with phenol at 11 °C over a 7-month reproductive cycle from June to December. The Km values (mmol) are fitted to the combined average rate ± standard error of the 3 male and 3 female microsomal preparations at each phenol concentration. Supplementary S1. Three male and three female four-year-old brook trout (Salvelinus fontinalis) were sampled monthly over a seven-month annual reproductive cycle (June-December). Fish weight, gonad weight (GSI), liver weight (HSI), and plasma steroid levels (estradiol, testosterone, 11-Ketotestosterone) were measured monthly. Liver microsomes were prepared, characterized for microsomal protein, cytochrome P450, and EROD activity. Michaelis-Menten kinetics were determined for the xenobiotic metabolism of phenol to hydroquinone, catechol, and phenylglucuronide. The following panels in this atlas depict the changes in appearance of gonads during development as well as additional photos of secondary sex characteristics.

Author Contributions

Conceptualization, P.K.S., R.C.K. and J.M.M.III; methodology, M.A.T., R.C.K. and L.E.S.; validation, M.A.T., L.E.S., R.C.K. and P.K.S.; formal analysis, L.E.S. and R.C.K.; investigation, M.A.T., L.E.S., P.K.S., J.M.M.III and R.C.K.; resources, P.K.S.; data curation, A.D.H., B.R.S., M.A.T., L.E.S. and R.C.K.; writing—original draft preparation, R.C.K., M.A.T. and P.K.S.; writing—review and editing, M.A.T. and R.C.K.; supervision, J.M.M.III and P.K.S.; project administration, J.M.M.III and P.K.S.; funding acquisition, J.M.M.III and P.K.S. All authors have read and agreed to the published version of the manuscript.

Funding

This research received no external funding.

Institutional Review Board Statement

All procedures involving fish were performed in accordance with an approved Animal Care and Use Plan as signed under the workplan “Understanding Metabolism Across Species and Chemicals for Ecological Risk Assessment” MED-QAPP METSIM MT July 2016 USEPA/CCTE/GLTED (Duluth, MN, USA) facility.

Informed Consent Statement

Not applicable.

Data Availability Statement

All data from the present study are publicly available at the US Environmental Protection Agency Environmental Dataset Gateway (https://edg.epa.gov/metadata/catalog/main/home.page).

Acknowledgments

The authors would like to thank Jose Serrano and Colleen Elonen for their thoughtful reviews of the manuscript, which added significantly to the final product.

Conflicts of Interest

All studies reported in this manuscript were supported by the USEPA, Office of Research and Development. The authors declare no conflicts of interest. This paper has been reviewed in accordance with the requirements of the US Environmental Protection Agency (USEPA) Office of Research and Development. The views expressed in this paper are those of the authors and do not necessarily reflect the views or policies of the USEPA. Mention of trade names or commercial products does not indicate an endorsement by the USEPA.

References

  1. Chambers, J.E.; Yarbrough, J.D. Xenobiotic biotransformation systems in fish. Comp. Biochem. Physiol. 1976, 55C, 77–84. [Google Scholar]
  2. Bend, J.R.; James, M.O. Xenobiotic metabolism in marine and freshwater species. Biochem. Biophys. Perspect. Mar. Biol. 1978, 4, 125–187. [Google Scholar]
  3. Lech, J.J.; Statham, C.N. Role of glucuronide formation in the selective toxicity of 3-trifluoromethyl-4-nitrophenol (TFM) for the sea lamprey: Comparative aspects of TFM uptake and conjugation in sea lamprey and rainbow trout. Toxicol. Appl. Pharmacol. 1975, 31, 150–158. [Google Scholar] [CrossRef] [PubMed]
  4. Kane, A.S.; Kahng, M.W.; Reimschuessel, R.; Nhamburo, P.T.; Lipsky, M.M. UDP-glucuronyltransferase kinetics for 3-trifluoromethyl-4nitrophenol (TFM) in fish. Trans. Am. Fish. Soc. 1994, 123, 217–222. [Google Scholar] [CrossRef]
  5. James, M.O.; Bend, J.R. Polycyclic aromatic hydrocarbon induction of cytochrome P450 dependent mixed-function oxidases of marine fish. Toxicol. Appl. Pharmacol. 1980, 54, 117–133. [Google Scholar] [CrossRef]
  6. Kleinow, K.M.; Melancon, M.J.; Lech, J.J. Biotransformation and induction: Implications for toxicity, bioaccumulation and monitoring of environmental xenobiotics in fish. Environ. Health Perspect. 1987, 71, 105–119. [Google Scholar] [CrossRef] [PubMed]
  7. Haasch, M.L.; Wejksnora, P.J.; Stegeman, J.J.; Lech, J.J. Cloned rainbow trout liver P1 450 complimentary DNA as a potential environmental monitor. Toxicol. Appl. Pharmacol. 1989, 98, 362–368. [Google Scholar] [CrossRef] [PubMed]
  8. Dewaide, J.H.; Henderson, P.T. Seasonal variation of hepatic drug metabolism in the roach, Leuciscus rutilus L. Comp. Biochem. Physiol. 1970, 32, 489–497. [Google Scholar] [CrossRef] [PubMed]
  9. Forlin, L. Effects of Clophen A50, 3-methylcholanthrene, pregnenolone-16 alpha-carbonitrile and phenobarbital on the hepatic microsomal cytochrome P450 monooxygenase system in rainbow trout, Salmo gairdneri, of different age and sex. Toxicol. Appl. Pharmacol. 1980, 54, 420–430. [Google Scholar] [CrossRef]
  10. Hansson, T.; Rafter, J.; Gustafsson, J.A. Effects of some common inducers on the hepatic microsomal metabolism of androstenedione in rainbow trout with special reference to cytochrome P450 dependent enzymes. Biochem. Pharmacol. 1980, 29, 582–587. [Google Scholar] [CrossRef]
  11. Stegeman, J.J.; Chevion, M. Sex differences in cytochrome P450 and mixed-function oxygenase activity in gonadally mature trout. Biochem. Pharmacol. 1980, 29, 553–558. [Google Scholar] [CrossRef] [PubMed]
  12. Koivusaari, U.; Pesonen, M.; Hanninen, O. Polysubstrate monooxygenase activity and sex hormones in pre- and post-spawning rainbow trout (Salmo gairdneri). Aquat. Toxicol. 1984, 5, 67–76. [Google Scholar] [CrossRef]
  13. Stehly, G.R.; Hayton, W.L. Disposition of pentachlorophenol in rainbow trout (Salmo gairdneri): Effect of inhibition of metabolism. Aquat. Toxicol. 1989, 14, 131–148. [Google Scholar] [CrossRef]
  14. McKim, J.M., Jr.; McKim, J.M., Sr.; Naumann, S.; Hammermeister, D.E.; Hoffman, A.D.; Klaassen, C.D. In vivo microdialysis sampling of phenol and phenyl glucuronide in the blood of unanesthetized rainbow trout: Implications for toxicokinetic studies. Fundam. Appl. Toxicol. 1993, 20, 190–198. [Google Scholar] [CrossRef] [PubMed]
  15. McKim, J.M.; Kolanczyk, R.C.; Lien, G.J.; Hoffman, A.D. Dynamics of renal excretion of phenol and major metabolites in the rainbow trout (Oncorhynchus mykiss). Aquat. Toxicol. 1999, 45, 265–277. [Google Scholar] [CrossRef]
  16. Cravedi, J.P.; Lafuente, A.; Baradat, M.; Hillenweck, A.; Perdu-Durand, E. Biotransformation of pentachlorophenol, aniline and biphenyl in isolated rainbow trout (Oncorhynchus mykiss) hepatocytes: Comparison with in vivo metabolism. Xenobiotica 1999, 29, 499–509. [Google Scholar] [CrossRef] [PubMed]
  17. Clarke, D.J.; George, S.G.; Burchell, B. Glucuronidation in fish. Aquat. Toxicol. 1991, 20, 35–56. [Google Scholar] [CrossRef]
  18. Stegeman, J.J.; Binder, R.L.; Orren, A. Hepatic and extrahepatic microsomal electron transport components and mixed function oxygenase in the marine fish Stentomus versicolor. Biochem. Pharmacol. 1979, 28, 3431–3439. [Google Scholar] [CrossRef] [PubMed]
  19. Pesonen, M.; Andersson, T. Subcellular localization and properties of cytochrome P-450 and UDP-glucuronosyltransferase in the rainbow trout kidney. Biochem. Pharmacol. 1987, 36, 823–829. [Google Scholar] [CrossRef] [PubMed]
  20. Lindstrom-Seppa, P.; Koivusaari, U.; Hanninen, O. Extrahepatic metabolism in north european freshwater fish. Comp. Biochem. Physiol. 1981, 69C, 259–263. [Google Scholar] [CrossRef]
  21. Schmieder, P.K.; Tapper, M.A.; Kolanczyk, R.C.; Hammermeister, D.E.; Sheedy, B.R.; Denny, J.S. Discriminating redox cycling and arylation pathways of reactive chemical toxicity in trout hepatocytes. Toxicol. Sci. 2003, 72, 66–76. [Google Scholar] [CrossRef] [PubMed]
  22. Kolanczyk, R.C.; Schmieder, P.K. Rate and capacity of hepatic microsomal ring-hydroxylation of phenol to hydroquinone and catechol in rainbow trout (Oncorhynchus mykiss). Toxicology 2002, 176, 77–90. [Google Scholar] [CrossRef] [PubMed]
  23. Kolanczyk, R.C.; Tapper, M.A.; Sheedy, B.R.; Serrano, J.A. In vitro metabolism of imidacloprid and acetamiprid in rainbow trout and rat. Xenobiotica 2020, 50, 805–814. [Google Scholar] [CrossRef] [PubMed]
  24. Kolanczyk, R.C.; Denny, J.S.; Sheedy, B.R.; Olson, V.V.; Serrano, J.A.; Tapper, M.A. Increased endocrine activity of xenobiotic chemicals as mediated by metabolic activation. Environ. Toxicol. Chem. 2023, 42, 2747–2757. [Google Scholar] [CrossRef] [PubMed]
  25. Tapper, M.A.; Serrano, J.A.; Schmieder, P.K.; Hammermeister, D.E.; Kolanczyk, R.C. Metabolism of Diazinon in rainbow trout liver slices. Appl. Vitr. Toxicol. 2018, 4, 13–23. [Google Scholar] [CrossRef]
  26. Serrano, J.A.; Kolanczyk, R.C.; Tapper, M.A.; Lahren, T.; Dongari, N.; Hammermeister, D.E.; Kosian, P.A.; Schmieder, P.K.; Sheedy, B.R.; Challis, K.; et al. Characterization and analysis of estrogenic cyclic phenone metabolites produced in vitro by rainbow trout liver slices using GC-MS, LC-MS and LC-TOF-MS. J. Chromatogr. B 2019, 1126–1127, 121717. [Google Scholar] [CrossRef] [PubMed]
  27. Kolanczyk, R.C.; Solem, L.E.; McKim, J.M.; Schmieder, P.K. A comparative study of the Phase I and II Biotransformation of phenol in hepatic microsomes from three species of salmonidae: Hydroquinone, catechol and phenylglucuronide formation. Fishes 2024, 9, 284. [Google Scholar] [CrossRef]
  28. McKim, J.M.; Nichols, J.W. Use of physiologically-based toxicokinetic models in a mechanistic approach to aquatic toxicology. In Aquatic Toxicology: Molecular, Biochemical, and Cellular Perspectives; Malins, D.C., Ostrander, G.K., Eds.; CRC/Lewis Publishers: Boca Raton, FL, USA, 1994; Chapter 11; pp. 469–519. [Google Scholar]
  29. Nichols, J.W.; Schultz, I.R.; Fitzsimmons, P.N.I. A review of methods, and strategies for incorporating intrinsic clearance estimates into chemical kinetic models. Aquat. Toxicol. 2006, 78, 74–90. [Google Scholar] [CrossRef] [PubMed]
  30. Nichols, J.W.; Fitzsimmons, P.N.; Burkhard, L.P. In vitro-in vivo extrapolation of quantitative hepatic biotransformation data for fish. II. Modeled effects on chemical bioaccumulation. Environ. Toxicol. Chem. 2007, 26, 1304–1319. [Google Scholar] [CrossRef]
  31. Nichols, J.W.; Fitzsimmons, P.N.; Hoffman, A.D.; Wong, K. In vitro-in vivo extrapolation of hepatic biotransformation data for fish. III. An in-depth case study with pyrene. Environ. Toxicol. Chem. 2023, 42, 1501–1515. [Google Scholar] [CrossRef]
  32. Liu, Y.H.; Yao, L.; Zhang, Y.Y.; Chen, C.E.; Zhao, J.L.; Ying, G.G. Enhanced prediction of internal concentrations of phenolic endocrine disrupting chemicals and their metabolites in fish by a physiologically based toxicokinetic incorporating metabolism (PBTK-MT) model. Environ. Pollut. 2022, 314, 120290. [Google Scholar] [CrossRef]
  33. Mit, C.; Bado-Nilles, A.; Daniele, G.; Giroud, B.; Vulliet, E.; Beaudouin, R. The toxicokinetics of bisphenol A and its metabolites in fish elucidated by a PBTK model. Aquat. Toxicol. 2022, 247, 106174. [Google Scholar] [CrossRef] [PubMed]
  34. Hoar, W.S.; Randall, D.J.; Donaldson, E.M. Fish Physiology; Part A Endocrine Tissues and Hormones; Academic Press Inc., Harcourt Brace Jovanovich Publishers: New York, NY, USA, 1983; Volume IX. [Google Scholar]
  35. Mommsen, T.P.; Walsh, P.J. Vitellogenesis and oocyte assembly. In Fish Physiology; Hoar, W.S., Randall, R.J., Eds.; Academic Press: San Diego, CA, USA, 1988; Volume 11A, pp. 347–405. [Google Scholar]
  36. Buhler, D.R.; Wang-Buhler, J.L. Rainbow trout cytochrome P450s: Purification, molecular aspects, metabolic activity, induction and role in environmental monitoring. Comp. Biochem. Physiol. Part C 1998, 121, 107–137. [Google Scholar] [CrossRef]
  37. Koivusaari, U.; Harri, M.; Hanninen, O. Seasonal variation of hepatic biotransformation in female and male rainbow trout (Salmo gairdneri). Comp. Biochem. Physiol. 1981, 70C, 149–157. [Google Scholar] [CrossRef]
  38. Forlin, L.; Haux, C. Sex differences in hepatic cytochrome P450 monooxygenase activities in rainbow trout during and annual reproductive cycle. J. Endocrinol. 1990, 124, 207–213. [Google Scholar] [CrossRef] [PubMed]
  39. Hansson, T. Androgenic regulation of hepatic metabolism of 4-androstene-3,17-dione in the rainbow trout, Salmo gairdneri. J. Endocrinol. 1982, 92, 409–417. [Google Scholar] [CrossRef] [PubMed]
  40. Kolanczyk, R.; Schmieder, P.; Bradbury, S.; Spizzo, T. Biotransformation of 4-methoxyphenol in rainbow trout (Oncorhynchus mykiss) hepatic microsomes. Aquat. Toxicol. 1999, 45, 47–61. [Google Scholar] [CrossRef]
  41. Jensen, K.M.; Korte, J.J.; Kahl, M.D.; Pasha, M.S.; Ankley, G.T. Aspects of basic reproductive biology and endocrinology in the fathead minnow (Pimephales promelas). Comp. Biochem. Physiol. 2001, 128C, 127–141. [Google Scholar] [CrossRef]
  42. Schmieder, P.K.; Tapper, M.A.; Denny, J.S.; Kolanczyk, R.C.; Sheedy, B.R.; Henry, T.R.; Veith, G.D. Use of trout liver slices to enhance mechanistic interpretation of estrogen receptor binding for cost-effective prioritization of chemicals within large inventories. Environ. Sci. Technol. 2004, 38, 6333–6342. [Google Scholar] [CrossRef]
  43. Forlin, L.; Andersson, T. Storage conditions of rainbow trout liver cytochrome P-450 and conjugating enzymes. Comp. Biochem. Physiol. 1985, 80B, 569–572. [Google Scholar] [CrossRef]
  44. Bradford, M.M. A rapid and sensitive method for the quantitation of microgram quantities of protein utilizing the principle of protein-dye binding. Anal. Biochem. 1976, 72, 248–254. [Google Scholar] [CrossRef] [PubMed]
  45. Estabrook, R.; Peterson, W.J.; Baron, J.; Hildebrandt, A.G. The spectrophotometric measurement of turbid suspensions of cytochromes associated with drug metabolism. Methods Pharmacol. 1972, 2, 303–350. [Google Scholar]
  46. Pohl, R.J.; Fouts, J.R. A rapid method for assaying the metabolism of 7-ethoxyresorufin by microsomal subcellular fractions. Anal. Biochem. 1980, 107, 150–155. [Google Scholar] [CrossRef] [PubMed]
  47. Chowdhury, J.R.; Chowdhury, N.R.; Arias, I.M. Bilirubin conjugation in the spiny dogfish, Squalus acanthias, the small skate, Raja erinacea and the winter flounder, Pseudopleuronectes americanas. Comp. Biochem. Physiol. 1980, 66B, 523–528. [Google Scholar] [CrossRef]
  48. Sakai, T.; Kawatsu, H.; Gotoh, O. Intracellular distribution and enzymatic properties of bilirubin UDP glucuronyl transferase in carp, eel and yellow tail. Bull. Jpn. Soc. Sci. Fish. 1983, 49, 679–682. [Google Scholar]
  49. Sturm, A.; Hodson, P.V.; Carey, J.H.; Hansen, P.D. Hepatic UDP-glucuronyltransferase in rainbow trout (Oncorhynchus mykiss) and preliminary assessment of response to pulp mill cooking liquor. Bull. Environ. Contam. Toxicol. 1999, 62, 608–615. [Google Scholar] [CrossRef] [PubMed]
  50. Lindstrom-Seppa, P.; Hanninen, O. Sampling and storage conditions of rainbow trout liver affects monooxygenase and conjugation enzymes. Comp. Biochem. Physiol. Part C Comp. Pharmacol. 1988, 89, 221–224. [Google Scholar] [CrossRef] [PubMed]
  51. Sahawata, T.; Neal, R.A. Biotransformation of phenol to hydroquinone and catechol by rat liver microsomes. Mol. Pharmacol. 1983, 23, 453–460. [Google Scholar]
  52. Hibbs, B.; Wilbur, S.; George, J. Toxicokinetics. In Toxicological Profile for Benzene (Update); ATSDR (Agency for Toxic Substances and Disease Registry): Atlanta, GA, USA, 1997; p. 129. [Google Scholar]
  53. Scott, A.P.; Liley, N.R. Dynamics of excretion of 17a,20B-dihydroxy-4-pregnen-3-one 20-sulfate, and of the glucuronides of testosterone and 17B-oestradiol, by urine of reproductively mature male and female rainbow trout (Oncorhynchus mykiss). J. Fish Biol. 1994, 44, 117–129. [Google Scholar]
  54. Pajor, A.M.; Stegeman, J.J.; Thomas, P.; Woodin, B.R. Feminization of the hepatic microsomal cytochrome P-450 system in brook trout by estradiol, testosterone and pituitary factors. J. Exp. Zool. 1990, 253, 51–60. [Google Scholar] [CrossRef]
  55. Williams, D.E.; Buhler, D.R. Purification of cytochrome P448 from B-naphthoflavone-treated rainbow trout. Biochim. Biophys. Acta 1982, 717, 398–404. [Google Scholar] [CrossRef] [PubMed]
  56. Williams, D.E.; Buhler, D.R. Benzo[a]pyrene-hydroxylase catalyzed by purified isozymes of cytochrome P-450 from beta-naphthoflavone-fed rainbow trout. Biochem. Pharmacol. 1984, 33, 3743–3753. [Google Scholar] [CrossRef] [PubMed]
  57. Klotz, A.V.; Stegeman, J.J.; Walsh, C. An arylhydrocarbon hydroxylating hepatic cytochrome P450 from the marine fish, Stenotumus chrysops. Arch. Biochem. Biophys. 1983, 227, 578–587. [Google Scholar] [CrossRef] [PubMed]
  58. Goksoyr, A. Purification of hepatic microsomal cytochrome P450 from B-naphthoflavone-treated Atlantic cod (Gadus morhua), a marine teleost fish. Biochim. Biophys. Acta 1985, 850, 409–417. [Google Scholar] [CrossRef]
  59. Stegeman, J.J.; Kloepper-Sams, X.X. Cytochrome P450 isoenzymes and monooxygenase activity in aquatic animals. Environ. Health Perspect. 1987, 71, 87–95. [Google Scholar] [CrossRef]
Figure 1. The concentration of plasma sex steroid hormones (A) estradiol, (B) testosterone, and (C) 11-ketotestosterone in males and females measured over the 7-month reproductive cycle. Symbols represent values from individual males (solid) and females (open), while average values are represented by a line (males; solid and females; dashed).
Fishes 09 00311 g001aFishes 09 00311 g001b
Figure 2. (A) Hepatosomatic index, (B) gonadosomatic index, and (C) plasma concentrations of vitellogenin measured over the 7-month reproductive cycle. Symbols represent values from individual males (solid) and females (open), while average values are represented by a line (males; solid and females; dashed).
Fishes 09 00311 g002aFishes 09 00311 g002b
Figure 3. Cytochrome P450 (A) per mg microsomal protein or (B) per total liver and EROD (C) per mg microsomal protein or (D) per total liver activity of microsomal preparations measured over the 7-month reproductive cycle. Symbols represent values from individual males (solid) and females (open), while average values are represented by a line (males; solid and females; dashed).
Fishes 09 00311 g003aFishes 09 00311 g003b
Figure 4. Mean monthly male (solid bars) and female (open bars) (A) Km and Vmax (B) per mg microsomal protein or (C) per total liver values for the production of HQ resulting from the incubation of phenol with adult brook trout hepatic microsomes at 11 °C over the 7-month reproductive cycle. (Mean ± standard error). * indicates a statistical difference between male and female fish (p < 0.05).
Fishes 09 00311 g004aFishes 09 00311 g004b
Figure 5. Mean monthly male (solid bars) and female (open bars) (A) Km and Vmax (B) per mg microsomal protein or (C) per total liver values for the production of CAT resulting from the incubation of phenol with adult brook trout hepatic microsomes at 11 °C over the 7-month reproductive cycle. (Mean ± standard error). * indicates a statistical difference between male and female fish (p < 0.05).
Fishes 09 00311 g005aFishes 09 00311 g005b
Figure 6. Mean monthly male (solid bars) and female (open bars) (A) Km and Vmax (B) per mg microsomal protein or (C) per total liver values for the production of PG resulting from the incubation of phenol with adult brook trout hepatic microsomes at 11 °C over the 7-month reproductive cycle. (Mean ± standard error). * indicates a statistical difference between male and female fish (p < 0.05).
Fishes 09 00311 g006aFishes 09 00311 g006b
Figure 7. Metabolic conversion of Phenol to Hydroquinone (HQ), Catechol (CAT), and Phenylglucuronide (PG) in BKT microsomes.
Fishes 09 00311 g007
Disclaimer/Publisher’s Note: The statements, opinions and data contained in all publications are solely those of the individual author(s) and contributor(s) and not of MDPI and/or the editor(s). MDPI and/or the editor(s) disclaim responsibility for any injury to people or property resulting from any ideas, methods, instructions or products referred to in the content.

