Article

Comparison Study of Hydrodynamic Characteristics in Different Swimming Modes of Carassius auratus

by
Ying Zhang
1,
Di Jing
2,
Xiaoshuang Huang
1,
Xinjun Chen
1,3,4,5,
Bilin Liu
1,3,4 and
Xianghong Kong
1,3,*
1
College of Marine Living Resource Sciences and Management, Shanghai Ocean University, Shanghai 201306, China
2
College of Engineering Science and Technology, Shanghai Ocean University, Shanghai 201306, China
3
National Engineering Research Center for Oceanic Fisheries, Shanghai 201306, China
4
The Key Laboratory of Sustainable Exploitation of Oceanic Fisheries Resources, Shanghai Ocean University, Ministry of Education, Shanghai 201306, China
5
Key Laboratory of Oceanic Fisheries Exploration, Ministry of Agriculture and Rural Affairs, Shanghai 201306, China
*
Author to whom correspondence should be addressed.
Fishes 2024, 9(9), 365; https://doi.org/10.3390/fishes9090365
Submission received: 6 August 2024 / Revised: 16 September 2024 / Accepted: 19 September 2024 / Published: 21 September 2024

Abstract

:
This study utilized particle image velocimetry (PIV) to analyze the kinematic and hydrodynamic characteristics of juvenile goldfish across three swimming modes: forward swimming, burst and coast, and turning. The results demonstrated that C-shaped turning exhibited the highest speed, enabling rapid and agile maneuvers for predator evasion. Meanwhile, forward swimming was optimal for sustained locomotion, and burst-and-coast swimming was suited for predatory behaviors. A vorticity analysis revealed that vorticity around the tail fin was the primary source of propulsive force, corroborating the correlation between vorticity magnitude and propulsion found in previous research. The findings emphasize the crucial role of the tail fin in swimming efficiency and performance. Future research should integrate ethology, biomechanics, and physiology to deepen the understanding of fish locomotion, potentially informing the design of efficient biomimetic underwater robots and contributing to fish conservation efforts.
Key Contribution: This study employs PIV to analyze the hydrodynamic characteristics of juvenile goldfish during different swimming behaviors. The key finding is that the turning maneuver exhibits superior hydrodynamic performance, offering insights into fish swimming and biomimetic propulsion design.

1. Introduction

Particle image velocimetry (PIV) is a powerful technique employed for capturing the distribution of velocity fields in fluid dynamics [1]. Its fundamental principle involves introducing tracer particles into a flow field, illuminating these particles with a laser sheet, and recording their motion using a high-speed camera. Through the application of sophisticated correlation algorithms to process these images, researchers are able to obtain detailed maps of the velocity vectors within the flow field [2]. Among the various application areas of PIV technology, the study of the fluid dynamics associated with fish swimming has garnered significant interest. Fish generate propulsion through momentum transfer. Hence, investigating the flow patterns around them, including the boundary layer and wake, is crucial for understanding aquatic locomotion mechanisms. Recent technological advancements, such as digital particle image velocimetry (DPIV), have made it possible to quantify the characteristics of flows near freely swimming fish [3]. By adding reflective particles and analyzing consecutive flow images, researchers can compute the flow-field properties, such as velocity and vorticity.
Vorticity is a physical parameter that reflects the rotational motion of a fluid, and as one of the most fundamental flow patterns in nature, it is often altered by natural or anthropogenic phenomena [3,4]. As an integral part of hydrodynamics, vorticity is also a crucial parameter for analyzing the swimming behaviors and locomotion mechanisms of fish. By examining the vortical dynamics of fish through vorticity analysis, it will be possible to better understand the mechanisms by which fish transfer energy and momentum [5,6]. The data obtained from such research can contribute to the development of bionic interdisciplinary theories to some extent [7,8].
Fish propel themselves by transferring momentum to the surrounding fluid. Hence, the flow patterns near freely swimming fish, including the boundary layer and wake, are of great interest to researchers studying aquatic locomotion mechanisms. Technological advancements over the past decade have enabled investigators to quantify the flow characteristics near freely swimming fish using digital particle image velocimetry (DPIV). In contemporary practice, when referring to PIV, it is generally understood to imply DPIV, reflecting the prevalent use of digital technologies in this field. Currently, scholars worldwide primarily study the kinematics of fish swimming through biological experiments on live fish, as well as physical experiments and numerical simulations on biomimetic fish models. Piskur [9] conducted a PIV study to assess the performance of side fins in biomimetic unmanned underwater vehicles, testing various fin dimensions in a laboratory water tunnel and applying particle image velocimetry to analyze the fluid–structure interaction phenomena. Tytell [10] analyzed the wake structure of American eels during steady swimming and measured their propulsive efficiency. Mwaffo [11] investigated the kinematics and hydrodynamics of zebrafish in flowing water, demonstrating the distribution of vortex structures during maneuvers and cruising movements. Lauder [12] utilized PIV technology to experimentally study the function of the caudal fin in fish with homocercal tails (Ctenopoma acutidens) during steady swimming, revealing that the dorsal and ventral lobes produce different forces and torques during steady swimming. Nauen [13] found that the wake of the mackerel (Scomberomorus cavalla) produces a series of elliptical vortex rings. Tytell [14] analyzed the role of the flow patterns generated by the body, dorsal fin, and anal fin of bluegill sunfish during an escape response. Lao [15] studied the influence of different caudal fin shapes and oscillation parameters on the wake vortex flow-field structure based on the theory of vibrational plate propulsion, discovering that flexible caudal fins have higher propulsive efficiency than rigid ones. The study of crucian carp (Carassius carassius) escape responses revealed distinct flow-field structures produced by different caudal fin shapes [16]; zebrafish exhibit S-shaped starting movements during predatory reactions from low-speed cruising [17]. An analysis of the pressure distribution in the free-swimming Schizothorax richardsonii revealed negative fluid pressure at the tail concave and positive at the convex [18]. A mechanical analysis of zebrafish swimming in a micro-tunnel showed that a pair of vortices with opposite signs is produced near the fish’s body during burst movements [11]. Particle image velocimetry and vortex analysis principles were used to analyze the mechanical characteristics of juvenile goldfish, indicating that the power source for straight swimming and turning is mainly from the tail, while backward swimming relies mainly on pectoral fin propulsion [19]. By establishing C-shaped starting kinematic equations and analyzing the image sequence of crucian carp C-shaped starts, it was found that C-shaped starting bionic robots possess high maneuverability [20]. Utilizing scanning PIV, the hydrodynamic trails of Lepomis gibbosus (Centrarchidae), Colomesus psittacus (Tetraodontidae), and Thysochromis ansorgii (Cichlidae) were meticulously measured, elucidating the intricate vorticity fields that accompany their swimming patterns [21]. Similarly, the hydrodynamic determination of the moving direction of an artificial fin by a harbor seal (Phoca vitulina) was conducted using PIV to reveal the vorticity dynamics influencing the seal’s navigational capabilities [22]. It is evident that previous research on the measurement of flow fields around moving fish bodies has evolved from the initial extraction of simple kinematic data to the current quantification of the hydrodynamic forces generated by velocity and pressure fields. In addition to this, the field has also seen the application of techniques such as scanning particle image velocimetry (PIV) for the analysis of vorticity fields.
In this study, we focused on the turning mechanisms and carangiform propulsion of juvenile cyprinid fish. Utilizing particle image velocimetry (PIV) and the principles of vorticity analysis, we investigated the forces and propulsive efficiency of juvenile goldfish under three swimming conditions, namely straight swimming, turning, and burst and coast. Distinct from previous studies, this investigation represents a pioneering effort in the hydrodynamic analysis of juvenile cyprinid fish by examining these three distinct swimming modes. This is the first time in the literature that these specific swimming behaviors have been systematically analyzed using PIV and vorticity analysis. This approach not only allows for a comprehensive understanding of the transition mechanisms between different swimming states but also identifies the novel hydrodynamic characteristics associated with each mode. By quantitatively analyzing the forward and reverse forces, we elucidated the vorticity distribution characteristics during the transition of the juvenile fish among different swimming states and identified their efficient behavioral patterns. These findings not only enhance our understanding of fish locomotion mechanisms but also provide valuable scientific insights for the research on biomimetic robotic fish. Specifically, our findings can inform the design of propulsion systems for robotic fish, enabling them to replicate the efficient swimming behaviors observed, thereby enhancing their propulsive efficiency.

2. Materials and Methods

2.1. Experimental Subject Selection

The goldfish (Carassius auratus) belongs to the family Cyprinidae and is considered a primitive type of goldfish. It is a popular ornamental fish known for its laterally compressed, spindle-shaped body and long caudal fin. Native to China, it employs a carangiform propulsion mode, allowing it to swim swiftly through water. The mechanisms underlying the swimming locomotion of ornamental fish are not yet fully understood in China, making the analysis of the hydrodynamic characteristics of juvenile goldfish in various swimming modes particularly relevant for cyprinids, including ornamental species.
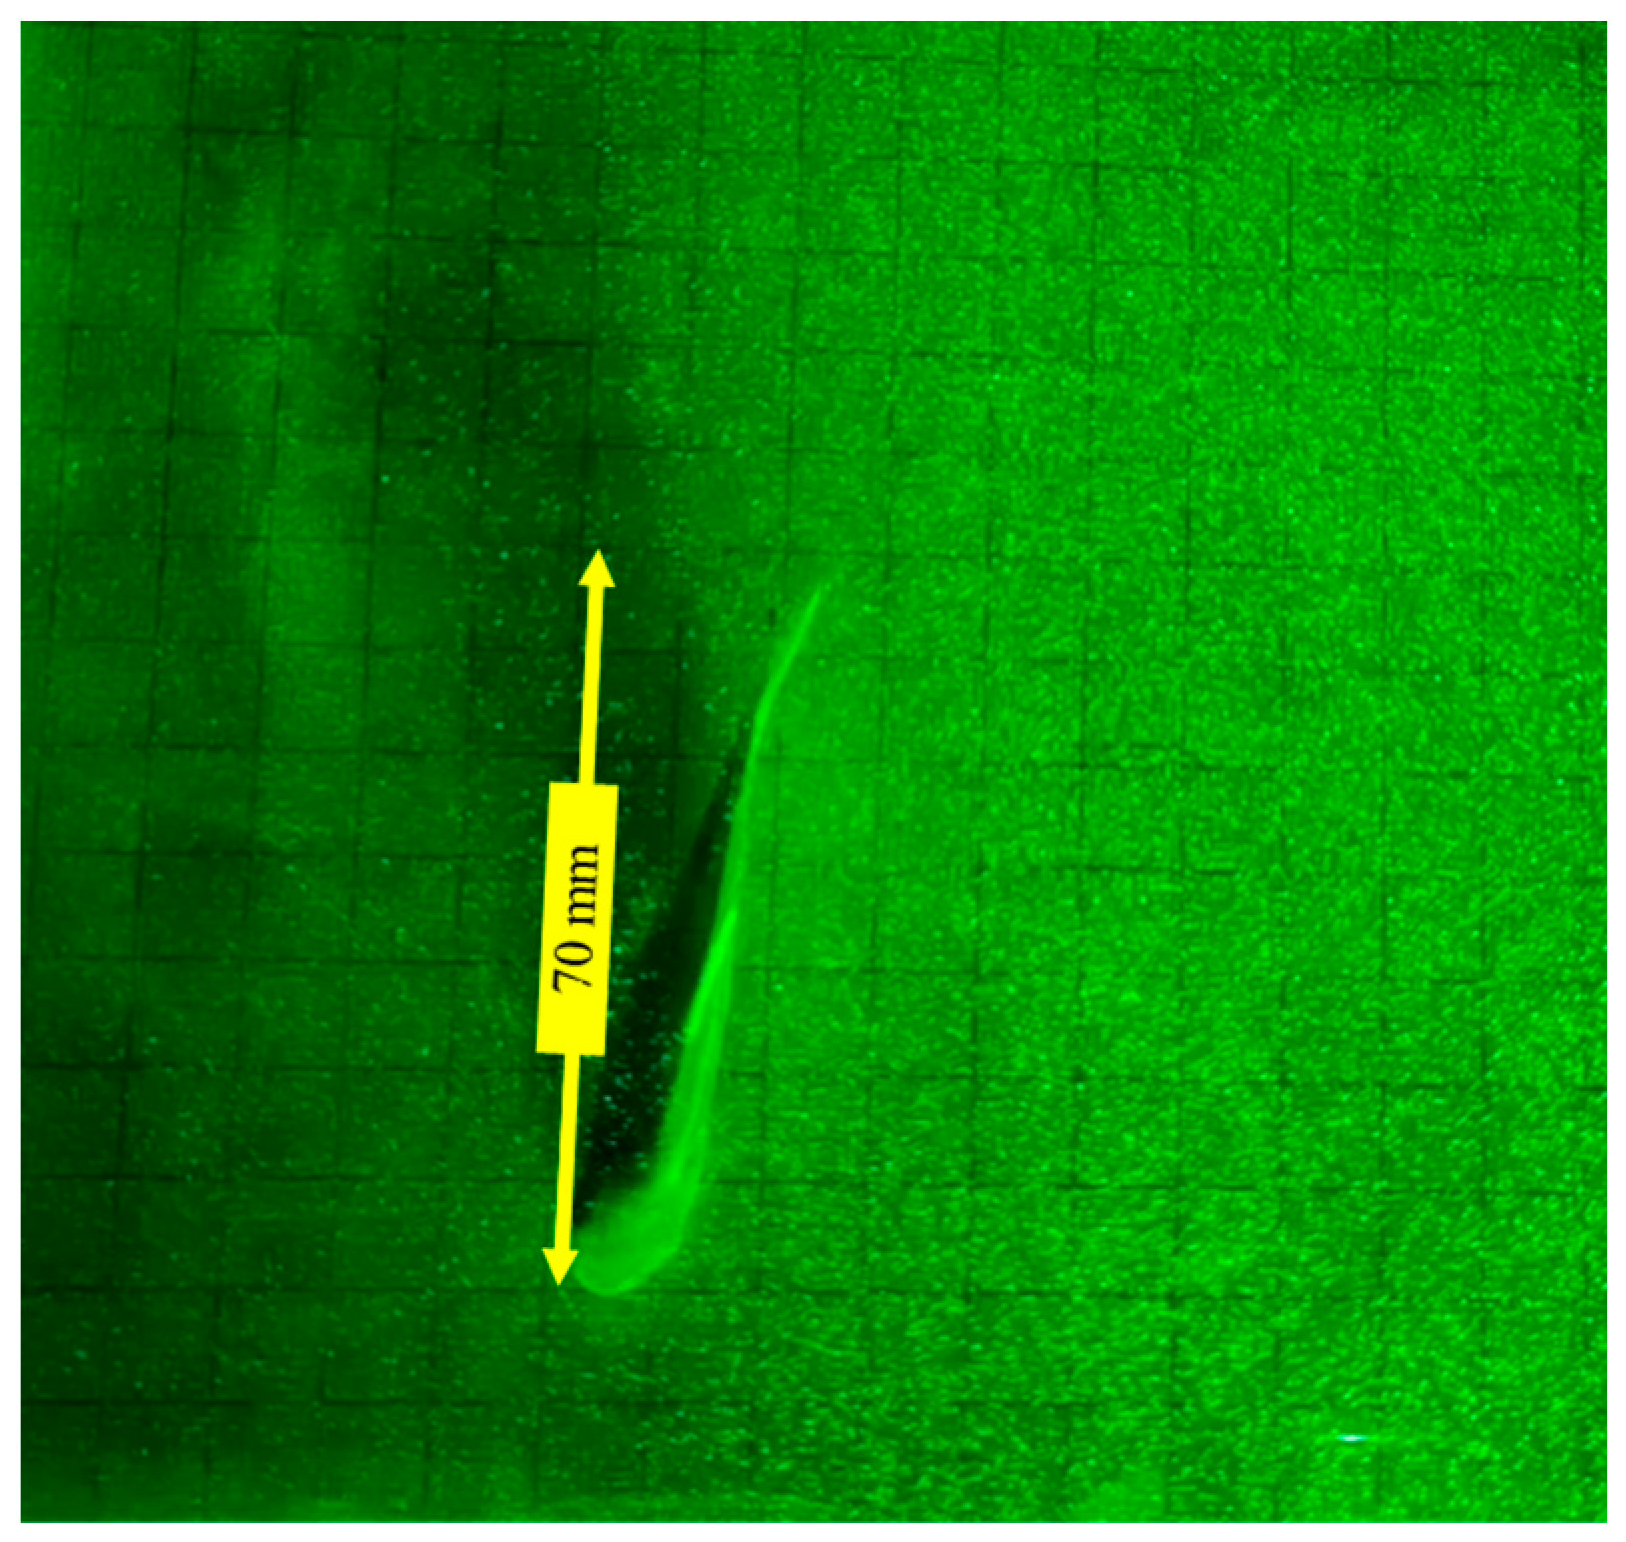
In this study, juvenile goldfish (Carassius auratus) were selected as the experimental subjects (Figure 1). Fifteen individuals with a body length ranging from 5 to 8 cm were acclimatized in four square tanks measuring 24 cm × 24 cm × 20 cm with a water depth of 15 cm. The water temperature was maintained at 18 °C, and the dissolved oxygen level was 8 mg/L. After a 24 h acclimatization period, the experiments were conducted in strict accordance with the “Regulations for the Management of Laboratory Animals”. Food was withheld for the 24 h leading up to the experiments [23].

2.2. Experimental Apparatus and Methods

2.2.1. Experimental Apparatus

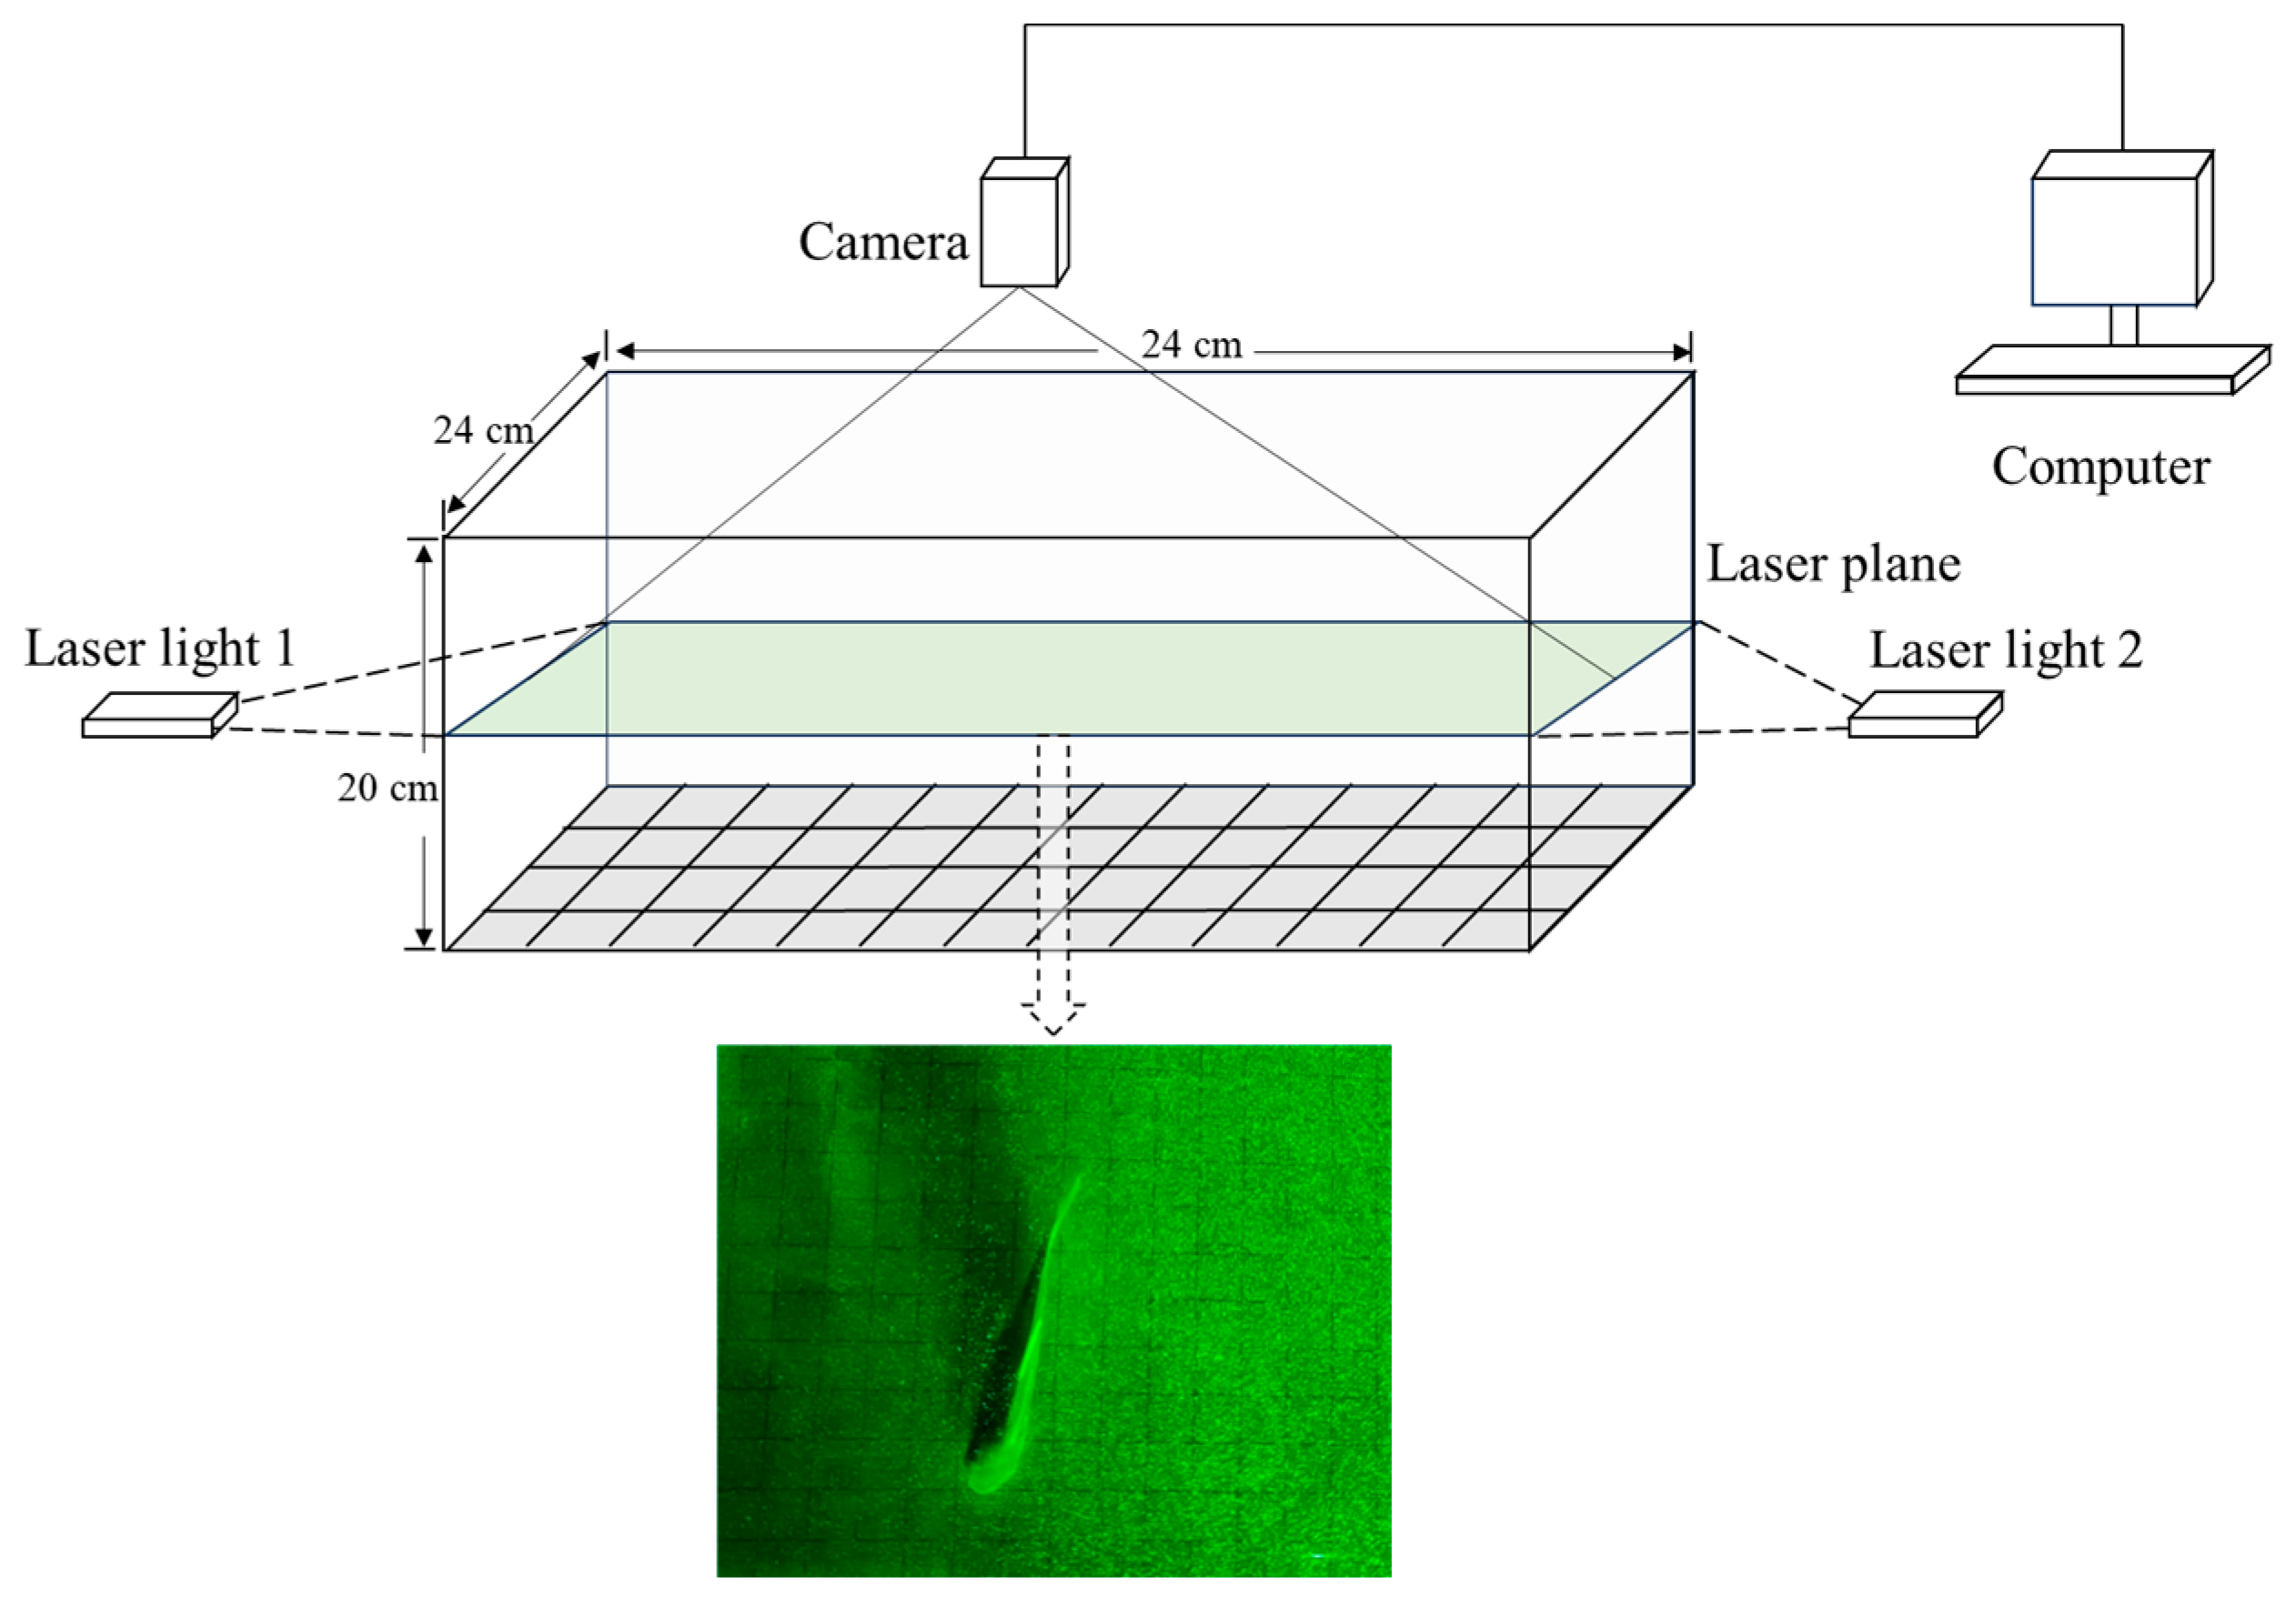
The experimental setup, as shown in Figure 2, consists of an experimental fish tank and a particle image velocimetry (PIV) system. The tank dimensions are 24 cm × 24 cm × 20 cm, with a water depth of 2 cm, just enough to submerge the entire fish body to prevent the fish from swimming up or down, which could affect the imaging quality. The PIV system comprises a light-source system, an image-acquisition system, a synchronization system, and a vector-calculation system [24]. The light-source system utilizes an Uniled green laser light (model LM555LD), sourced from UNI-T, a manufacturer based in Shenzhen, China, which is a pulsed laser with a wavelength range of 510 nm to 515 nm. Prior to the experiment, neutral PSP (polyamide seeding particles), with a diameter of 50 μm and a density of 1.03 to 1.05 g/cm3, are sprinkled into the experimental fish tank. The density of the tracer particles is close to that of water, allowing them to float easily on the water’s surface. To disrupt the surface tension and ensure uniform mixing of the PSP tracer particles with the water, a surfactant is added to the flow field. The Stokes number of the tracer particles is less than 0.01, indicating good followability [25]. The image-acquisition system primarily consists of a high-speed camera and a laser sheet [14]. The high-speed camera (Nikon D3500, from Nikon Corporation in Tokyo, Japan, with a spatial resolution of 1085 × 690 pixels, 120 fps) is positioned 30 cm above the tank, capturing images of the goldfish swimming with a vertically downward shooting angle. The synchronization system ensures that the laser and camera operate in coordination, capturing the entire turning process of the juvenile goldfish. The vector-calculation system employs the PIVlab 3.00 post-processing package to extract velocity field data from double-exposure particle images [26], indirectly obtaining other kinetic and mechanical data. The specific processing method is described in the data-processing section.

2.2.2. Experimental Methods

In this study, a group of 15 juvenile goldfish with very similar body lengths and masses were selected for the experiment. Upon observation, it was noted that, after a period of acclimation in the experimental tank, the different juvenile individuals exhibited similar movement trajectories. Consequently, a single representative juvenile with a body length of 6.5 cm was chosen for the experimental trials. The experiments were conducted between 3 pm and 6 pm in June 2024. Prior to each experiment, the fish were transferred from the holding tank to the experimental aquarium using a hand net. The juvenile goldfish were placed in the experimental aquarium, which is a tank of water with no flow. Please note that this also means that the local flow is generated by the movement of the fish. They were allowed to acclimate to the new environment for 5 min before the trial video recording commenced, which lasted approximately 10 min. Over a span of 20 h, recordings were conducted to ensure that each behavior was effectively captured at least 7 times. To prevent interference from other light sources, the entire experiment was conducted in a dark, light-free environment. Additionally, the position and direction of the laser were adjusted to create a sheet-like light source at the fork of the juvenile goldfish’s caudal fin. To reduce experimental errors, the parts of the experimental aquarium that were not facing the laser and camera were covered with black tape, as the reflection of the waves on the fish’s surface could distort the visualization of particle movement, leading to inaccurate measurement of the flow field [27]. The captured footage of the experiments depicted the spontaneous propulsion movements of the juvenile goldfish without any external stimulation. The experimental setup features a 10 × 10 mm experimental grid paper placed underneath, as shown in Figure 3, which can be used to measure the velocity information.

2.3. Flow-Field Measurement Techniques

2.3.1. Flow-Field Measurement Techniques

In this study, the PIVLab 3.00 [28] software was utilized for processing the raw video frames. This open-source digital particle image velocimetry (PIV) post-processing tool, based on MATLAB R2021a (MathWorks, Natick, MA, USA), is designed to extract velocity data from image sequences. The core principle of PIV technology involves dividing consecutive frames into numerous equally sized interrogation regions (i.e., interrogation windows) and applying the fast Fourier transform (FFT) algorithm to perform cross-correlation calculations on the corresponding regions [29]. By determining the average displacement of the particle clusters within each region and dividing it by the time interval between consecutive frames, the average velocity vector for each region can be computed [30]. After executing this correlation process across all interrogation regions, the velocity-vector distribution across the entire image is obtained. Furthermore, by differentiating the velocity vectors, the vorticity distribution can be determined, thereby elucidating the vortex characteristics of the flow field [31,32].
The density of velocity vectors is directly influenced by the number of interrogation regions, while the size of these regions significantly affects the precision of the velocity vectors. This necessitates a comprehensive consideration and setting based on factors such as the velocity range of the flow field, the camera’s object–image ratio, and the particle concentration [33]. If the maximum displacement of a particle in the x-direction is dx, and the maximum displacement in the y-direction is dy, with the correlation window size being N × N, according to the sampling theorem:
d x N 2 ,   d y N / 2
The maximum displacement of the particle, ds, is given by d s =   d x 2 + d y 2 . Then,
N 2 d s 1.5 d s
For a particle located in the middle of the window, the requirement should be met. For cross-correlation analysis, in order to achieve a higher rate of valid data, the new correlation window N is set to 2 N . Within the window, all particle pairs from the original window should satisfy Equation (2), which is:
N 3 d s
At that time, within window N , all particle pairs from window N will satisfy the Equation (2).
In this study, we experimented with interrogation window sizes of 64 × 64, 32 × 32, and 16 × 16 pixels [34], and set a 50% overlap rate for the interrogation windows, along with a 2 × 3 Gaussian sub-pixel interpolation method to enhance the accuracy and resolution of the measurements. Additionally, a 10 × 10 mm2 square checkerboard was used for calibration to ensure the precision of the measurement results.

2.3.2. Vorticity and Dynamics of the Flow Field

Water’s primary characteristics as a medium for locomotion have played a significant role in the evolutionary process of fish, namely its incompressibility and high density [35]. As an incompressible fluid, water ensures that any movement by an aquatic organism results in a corresponding movement of the surrounding water, and vice versa. With a density approximately 800 times that of air, water closely matches the density of marine animals’ bodies, effectively counteracting gravity. This allows fish to swim without the gravitational impediment faced by terrestrial organisms, enabling a greater range of movement [36]. The swimming motion of fish is, in fact, a result of the interaction between their bodies and the water flow. In this process, the hydrodynamic forces acting on a swimming fish are primarily determined by the pressure at the interface between the fluid and the fish’s body. The changes in this pressure distribution dictate the direction, speed, and stability of fish swimming, forming the basis for their free movement in water.
Vorticity, a kinematic parameter commonly used to represent fluid vortices, refers to the rotational motion generated by a fluid’s swirling motion. In this and subsequent sections, we use bold letters to represent vectors. Vorticity is calculated by measuring the mathematical curl of the velocity field [37,38], and its computational formula is as follows:
ω z = v x u y
In the above formula, ω z represents vorticity ( s 1 ), while u and v are the horizontal and vertical velocities of the particles, respectively ( m / s ).
In the two-dimensional case, the force exerted by the fluid on the fish body is as follows:
F = d d t s r × ω d S + s b V S
Here, r is the position vector, ω is the vorticity ( s 1 ), and V is the velocity of the particle ( m / s ). Herein, r × ω is defined as the vorticity moment. s represents the infinite domain flow field, and s b represents the region occupied by the object. It denotes the rate of change of a physical quantity over time on the integral domain or along a closed curve.
Goldfish swimming in the fish tank generate vortices near their bodies, which in turn, produce forces that can be expressed as:
F = d d t S e r × ω d S
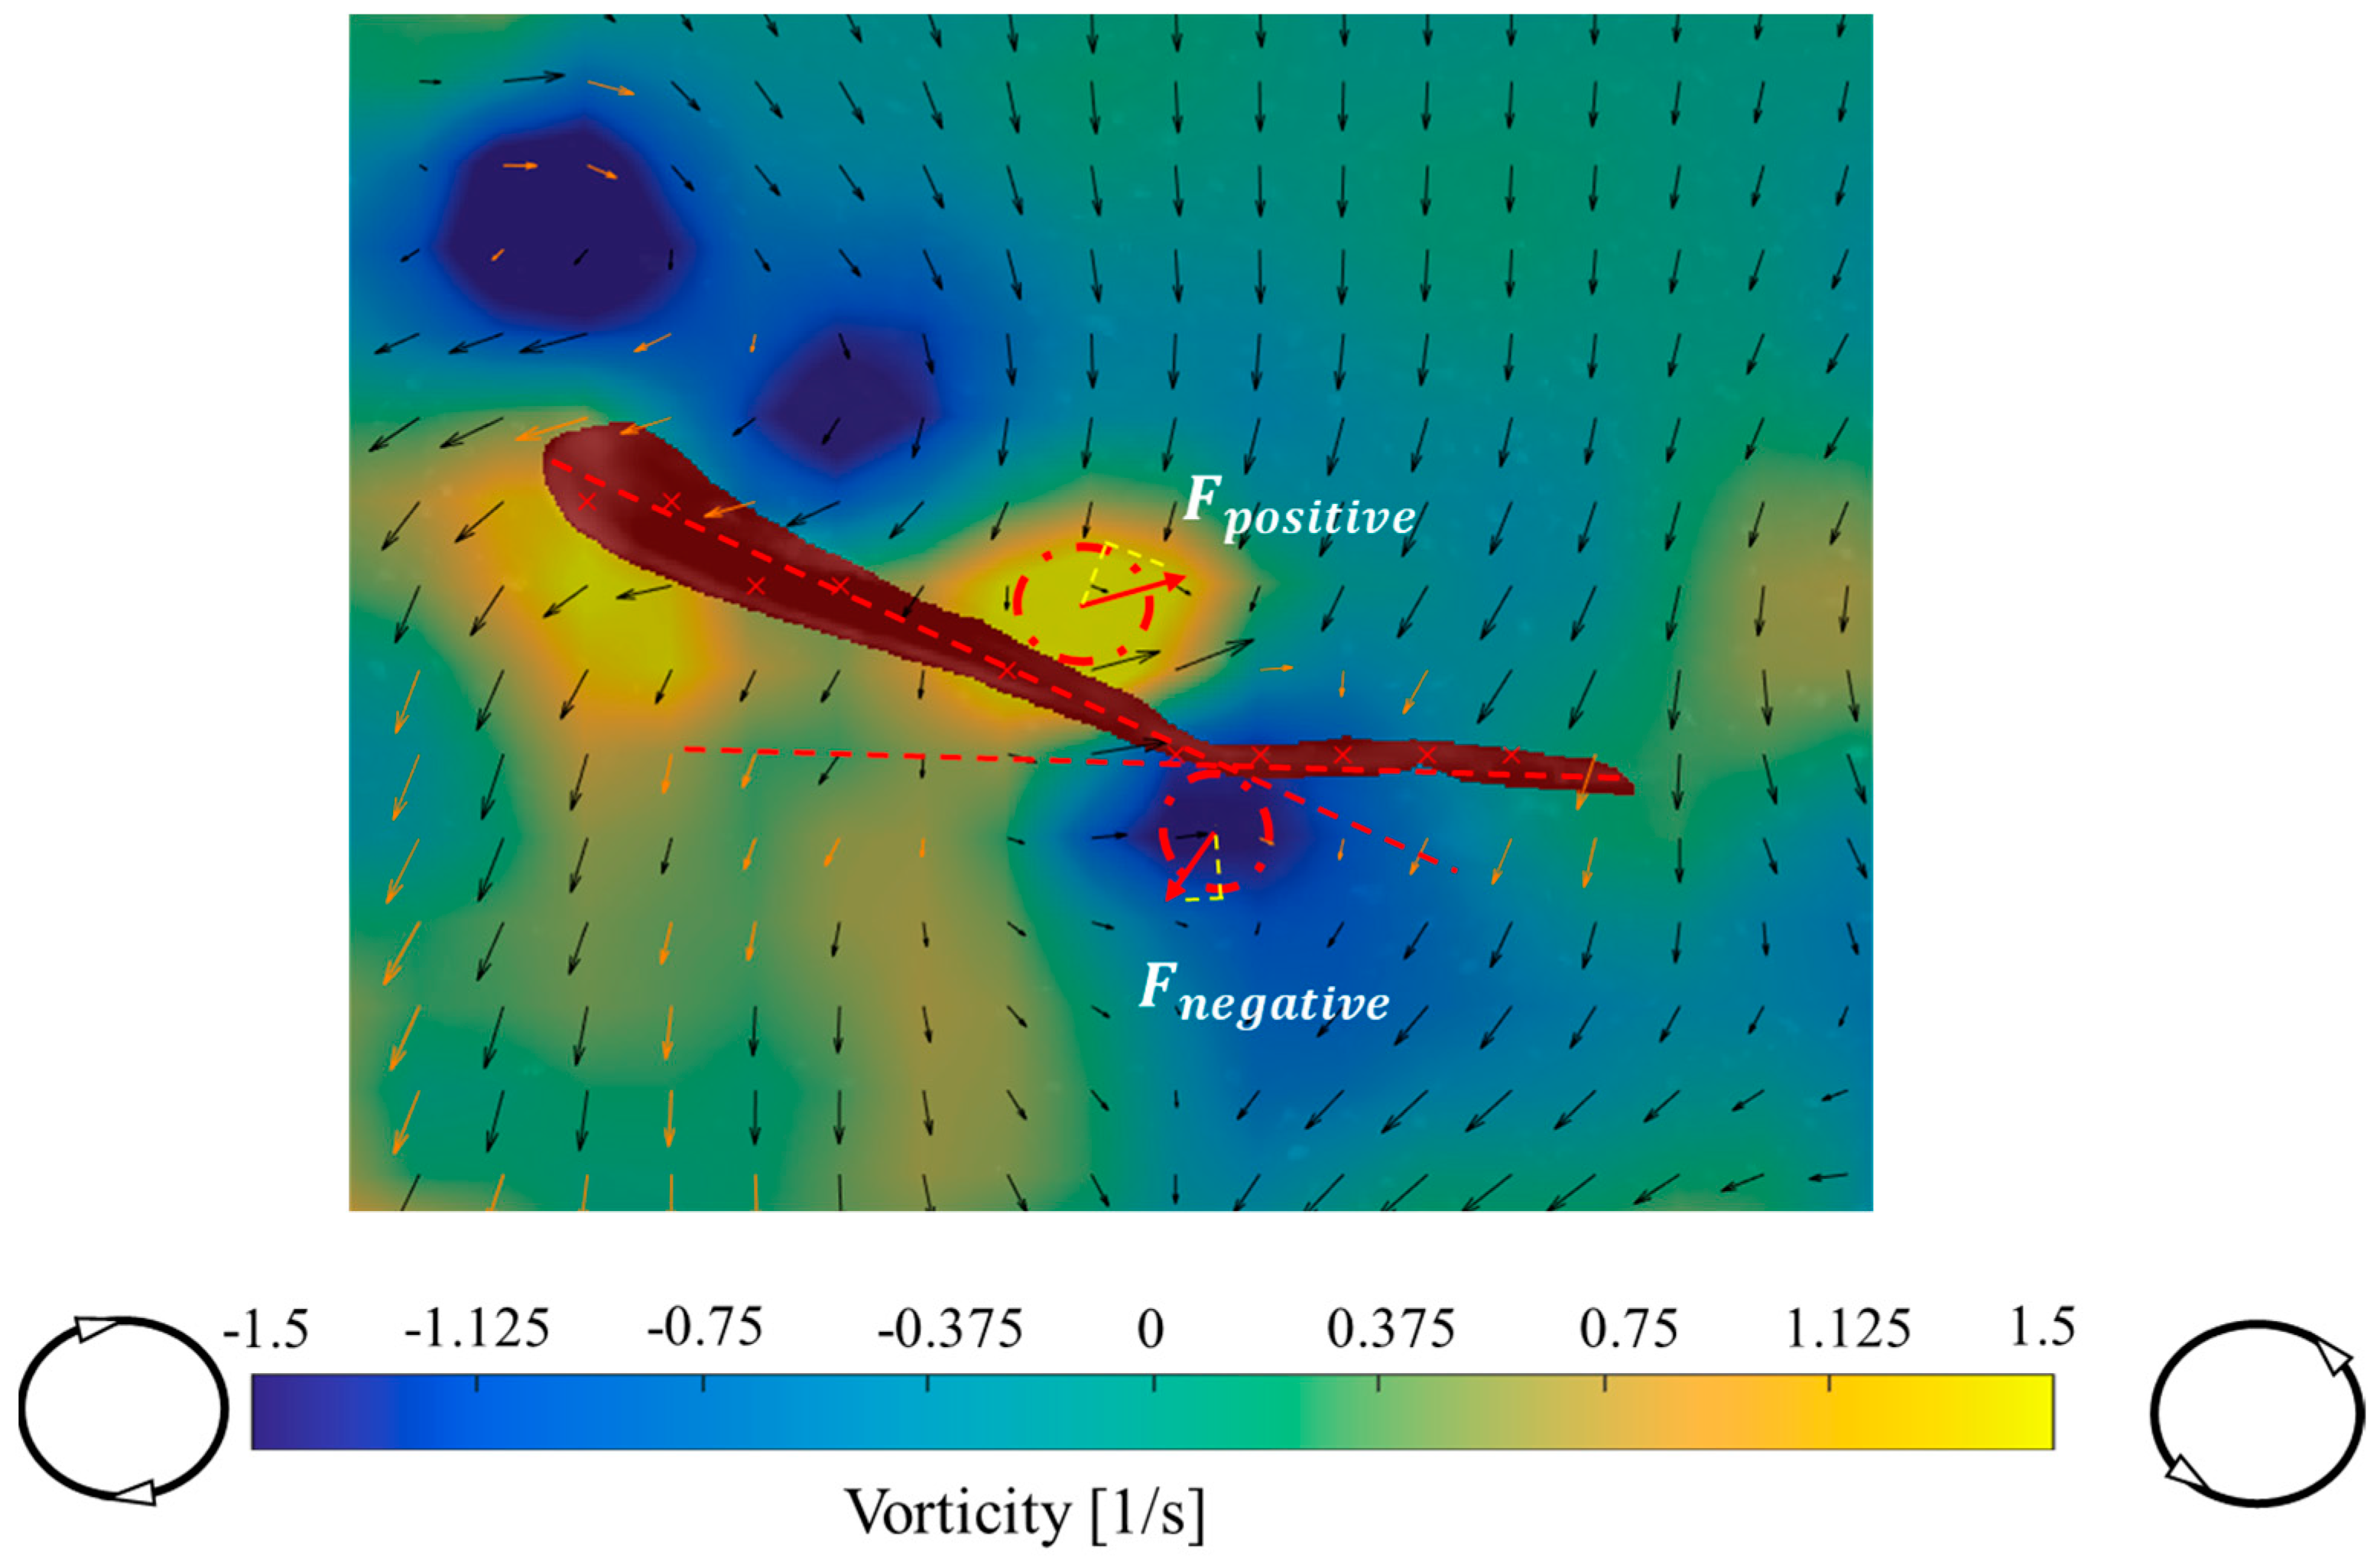
As shown in Figure 4, a counterclockwise vortex ring is considered to have a positive value, at which point the vortex generates positive forces, whereas a clockwise vortex ring is considered to have a negative value, at which point the vortex produces negative forces.
During the turning process of the fish, the strength of the vortex causes the fish to rotate, and the calculation formula for the resulting moment of force is:
τ = Γ × D
τ is the moment of force ( N / m ). D is the perpendicular distance from the fish body to the line of action of the force (m). Γ represents the velocity circulation ( m 2 / s ).
Significant hydrodynamic information was extracted from the velocity and vorticity fields obtained by PIV, and the circulation associated with vortex shedding was estimated based on the closed curve C, as defined in the literature [39], using the following equation:
Γ = V l
where l is the arc element vector of curve l .
During swimming, as the fish body undulates forward, the tail typically exhibits large amplitude oscillations, while the head undergoes smaller amplitude movements. The head remains relatively rigid during swimming [40], resulting in a constant angle θ formed between the midline of the head at any given moment and the initial straight midline. This angle is defined as the head deviation angle (as depicted in Figure 5A) [11,41].
In the following, we refer to the turn side as the lateral side of the body that faces the direction of the turn and call the contralateral side the opposite side [42]. The fish curvature coefficient β b is a quantitative measure used to quantify the overall curvature of a fish, serving as an index to assess the degree of curvature. It is defined as the ratio of the chord length ( L c ) from the tip of the snout to the end of the caudal fin to the body length ( L b ) subtracted from 1, as shown in Figure 5. The mathematical expression for this coefficient is as follows [43]:
β b = 1 L c / L b
The lateral offset refers to the vertical distance of the fish’s tail relative to its swimming path during locomotion, which aids in understanding how fish generate propulsion and navigate through tail movements. The side offset measures the vertical distance between the midline of the fish’s body at the start and the end of a swimming cycle.
The Reynolds number, defined as a ratio of fluid inertia to viscous forces [9], is:
R e = U L / μ
U is the average swimming speed of fish. The total length is L, and the kinematic viscosity is μ = 10 6   m 2 s 1 .
St is the Strouhal number:
S t = f A / U
where f is the burst frequency, and A is the peak-to-peak amplitude at the tail tip.

2.4. Error Analysis

In the process of capturing the fish’s movement state using the PIV system and processing the experimental data, experimental errors are inevitable. The potential sources of these errors and methods to reduce them are summarized as follows:
(1)
Reflection from the fish’s body during the experimental filming. Laser illumination on the fish’s body causes reflection, which can obscure particles around the fish, leading to measurement errors. To mitigate this, lasers were placed on both sides of the experimental aquarium, reducing the number of obscured particles and, thus, decreasing the measurement error;
(2)
Camera frame rate. Despite a frame rate of 120 fps, subtle changes in the fish’s contour occur between frames, leading to slight differences in the fish’s spatial coordinates from one frame to the next. These differences can introduce errors in the velocity-vector calculations during cross-correlation analysis. Therefore, this study aimed to minimize the time interval between image frames, ensuring that the selected frames adequately represent the changes in the juvenile goldfish’s various movement states;
(3)
Greater force exerted by the laser plane on the juvenile’s tail fork. To control the tail fork within the laser plane, the horizontal plane height was reduced. However, this adjustment may induce boundary effects on the fish’s body;
(4)
Particle sedimentation. Since the density of the tracer particles (1.03 g/cm3 to 1.05 g/cm3) is not identical to that of the water (1.0 g/cm3), particle sedimentation can occur at the fish’s contour when the fish body oscillates.

3. Results

3.1. Kinematic Characteristics under Different States

A comparative analysis of juvenile goldfish of varying body lengths revealed that, under identical experimental conditions, these juveniles exhibited similar kinematic characteristics and locomotory patterns [19,26,38]. Consequently, juvenile goldfish with a body length of 6.5 cm were selected as representative subjects for the analysis, with the aim of generalizing the findings to the broader range of 4 cm to 10 cm body lengths. By analyzing the kinematic features of these juveniles during forward swimming, turning maneuvers, and burst and coast, the derived conclusions are expected to offer valuable insights into the locomotory behaviors of juvenile goldfish within the specified body length range.
(1)
Forward swimming condition
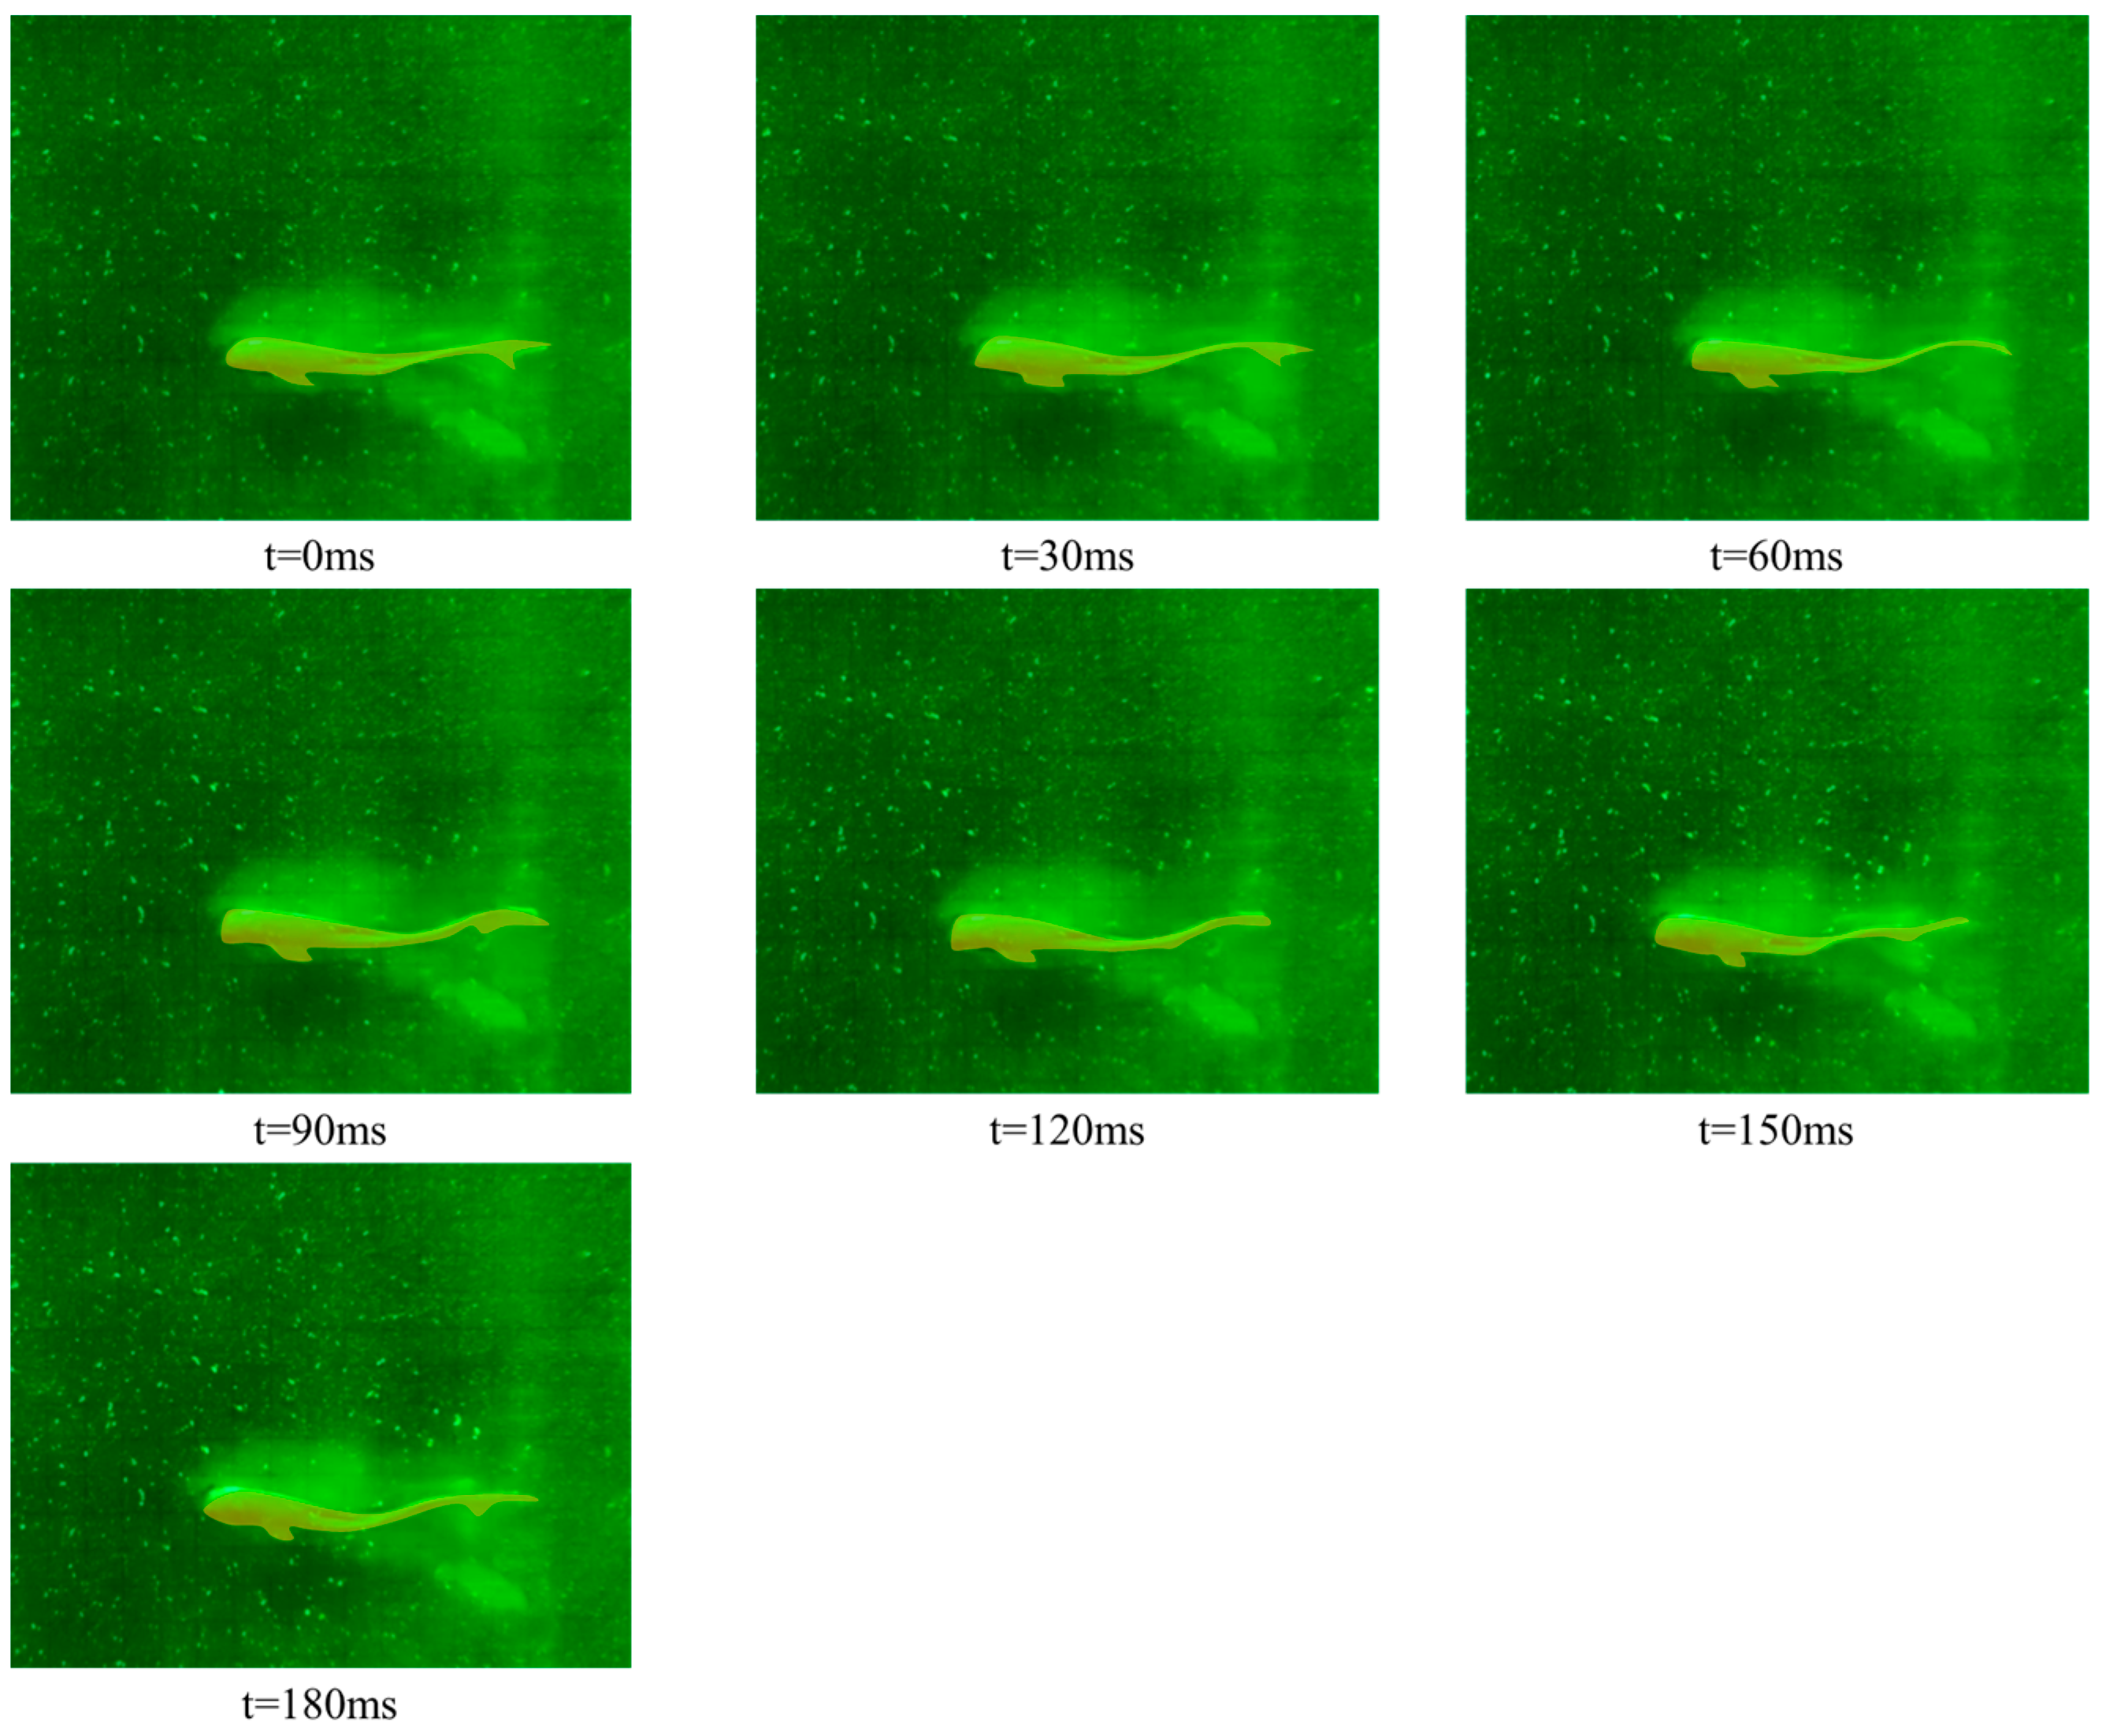
The duration required for juvenile goldfish to return to their initial straightened posture after undergoing a movement cycle is defined as the locomotory cycle T. Figure 6 illustrates a sequence of straight swimming for a juvenile goldfish over a single cycle, with a locomotory cycle duration of 180 ms and a time interval of 30 ms between consecutive images.
In the forward swimming state, the average velocity of the juvenile goldfish was measured at 0.0344 ± 0.0028 m/s. During this phase, the body undergoes an S-shaped deformation (Figure 4). The lateral displacement was 0.0095 ± 0.0009 m, with a side displacement being relatively small at 0.0031 ± 0.0009 m. This small lateral displacement is primarily attributed to the morphological changes of the fish body during forward locomotion, as the body does not undergo significant oscillations. During straight-line swimming, the Reynolds number is 2.2 × 10⁴;
(2)
Turning state
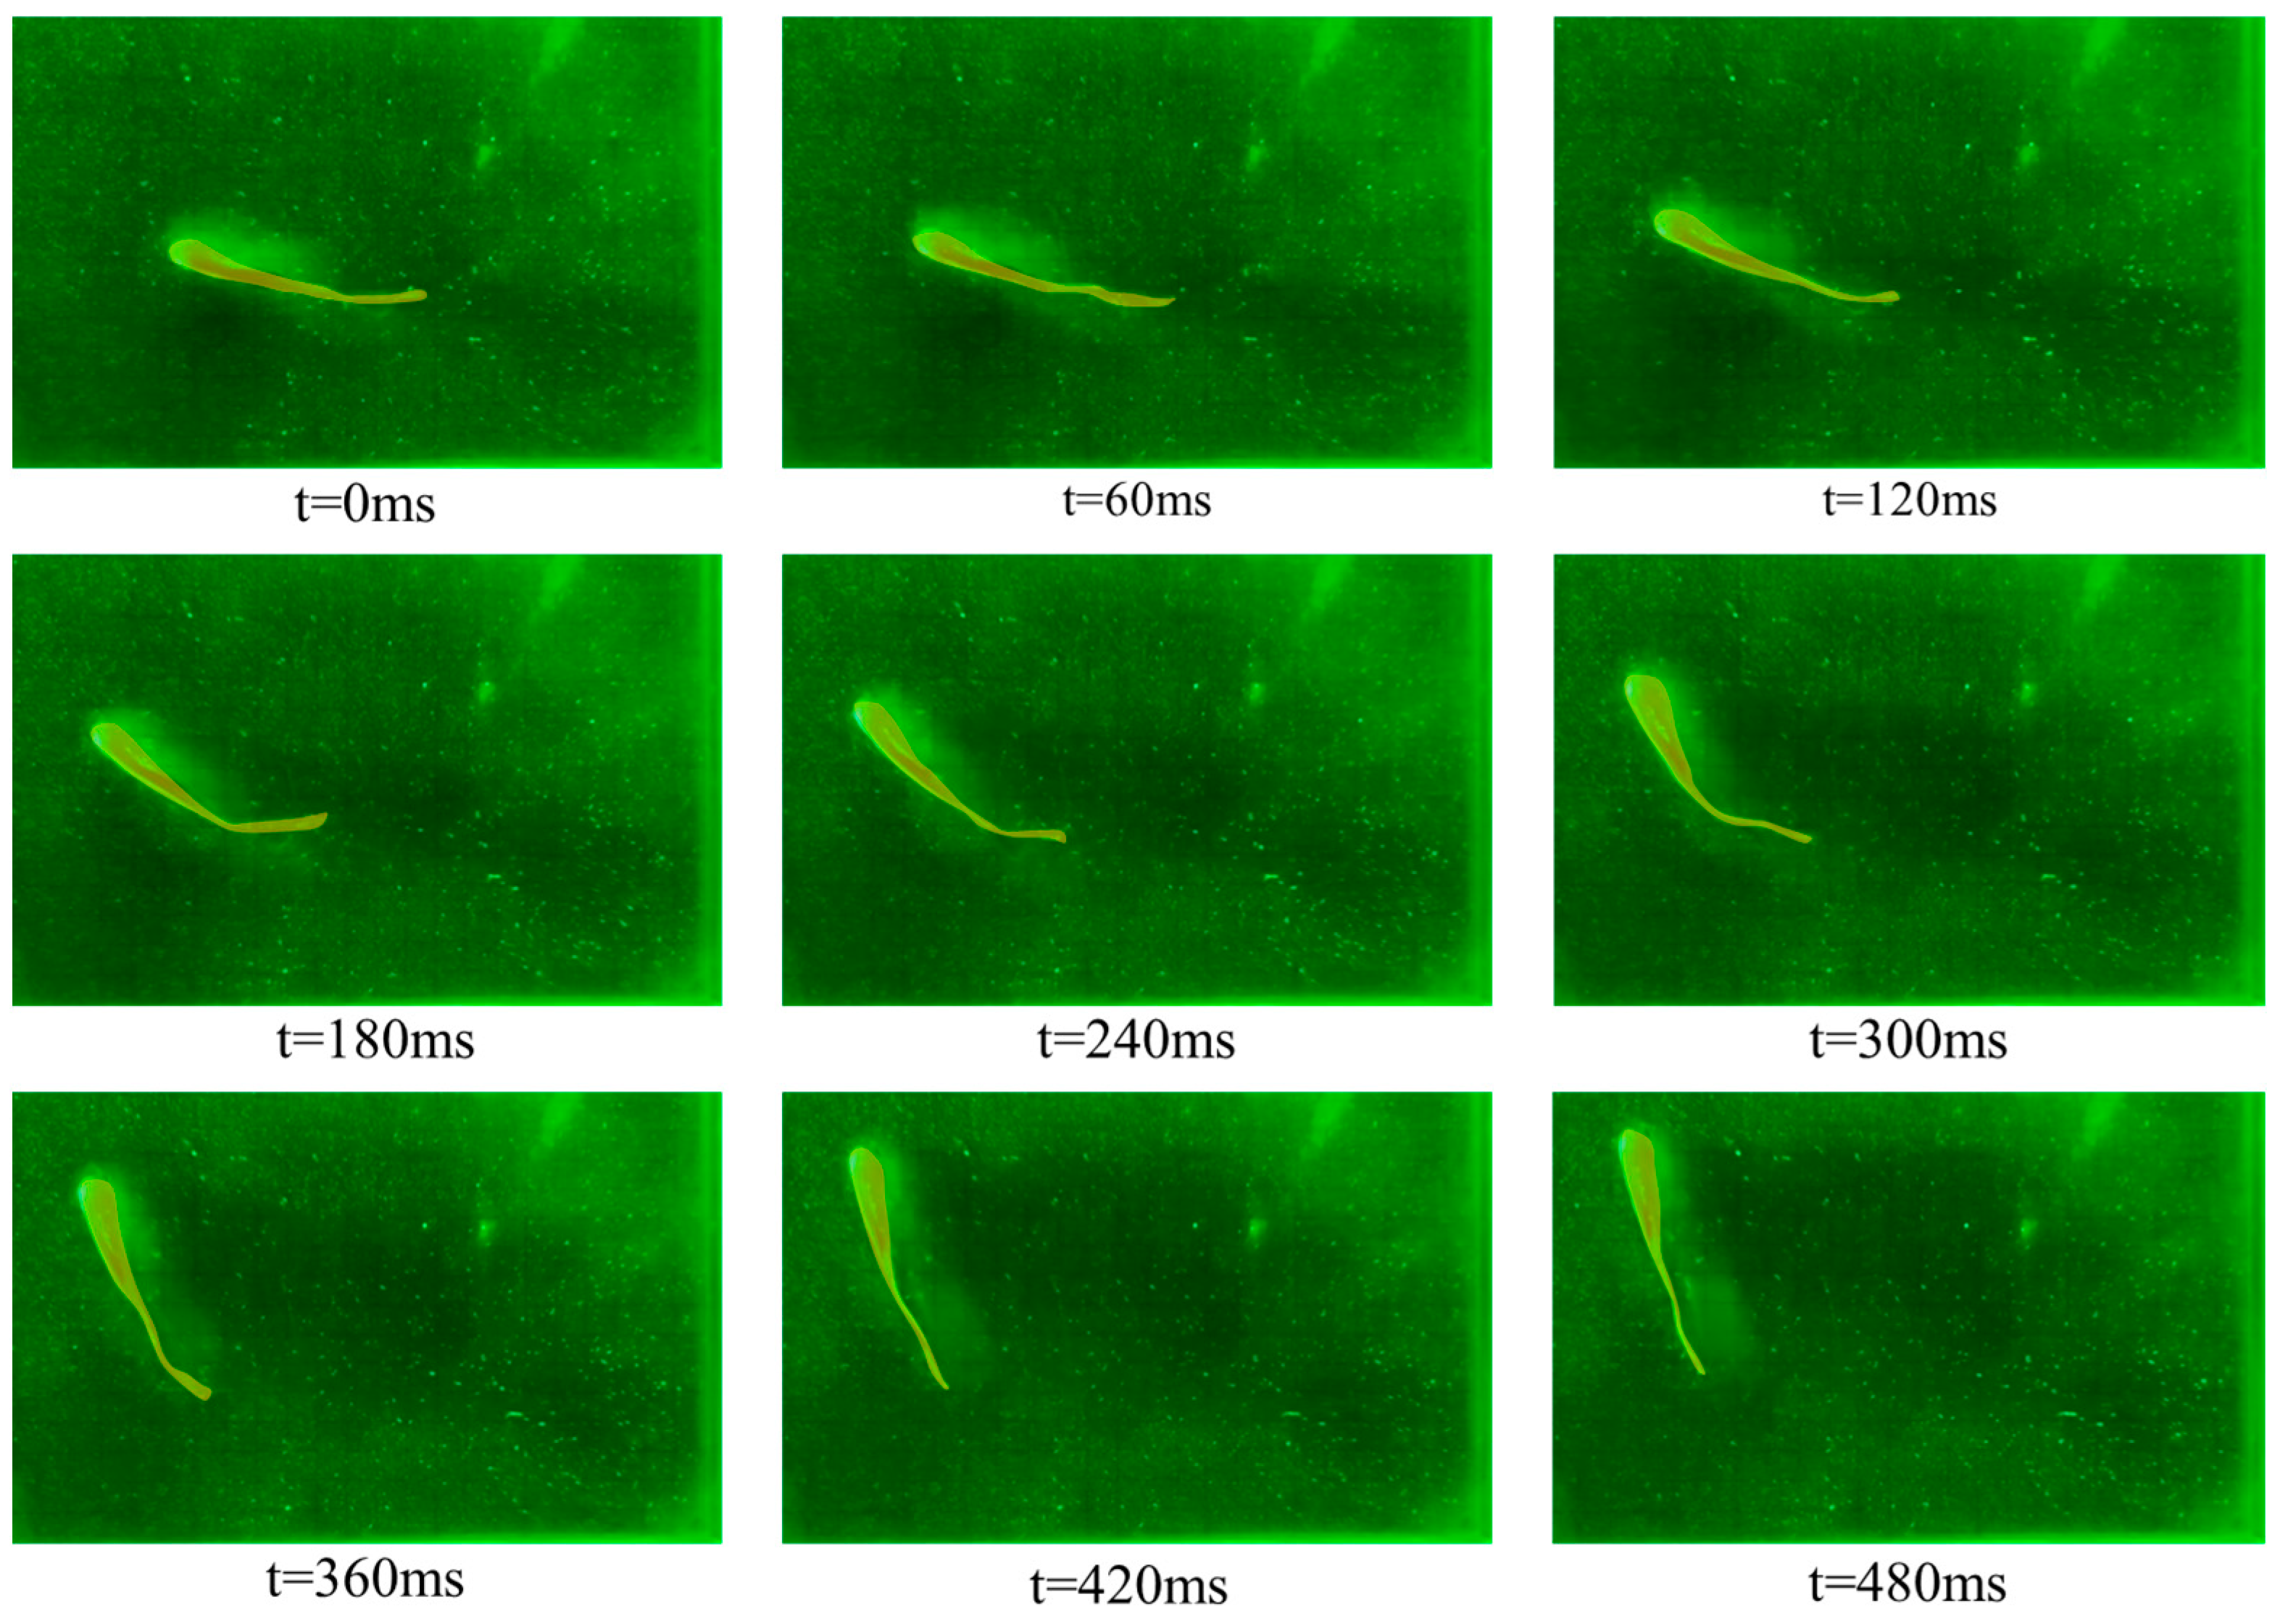
Turning is a component of the burst-and-glide behavior exhibited by juvenile goldfish. During this phase, the turning occurs during the glide, with the body adopting a straight longitudinal axis posture, with minimal curvature (straight) from head to tail. Consequently, the commencement of the turn can be defined as the first instance of the body deviating from the straight posture as detected in the high-speed video. The termination of the turn is defined as the point at which the turning motion ceases, and the body maintains a stationary posture from one frame to the next. Figure 7 depicts a sequence of a turning cycle for a juvenile goldfish, with a cycle duration of 480 ms and a time interval of 60 ms between consecutive frames.
In the C-shaped turning state of juvenile goldfish, the average velocity of the fish was measured at 0.1307 ± 0.0021 m/s. Throughout the turning process, the head and tail of the fish bend towards one side, resulting in a C-shaped deformation, as illustrated in Figure 5. The lateral offset during the turning process was 0.0122 ± 0.0009 m. The side offset was 0.0340 ± 0.0009 m, and βb is 0.09. During the turning maneuvers, the Reynolds number is 8.5 × 10⁴;
(3)
Burst-and-coast state
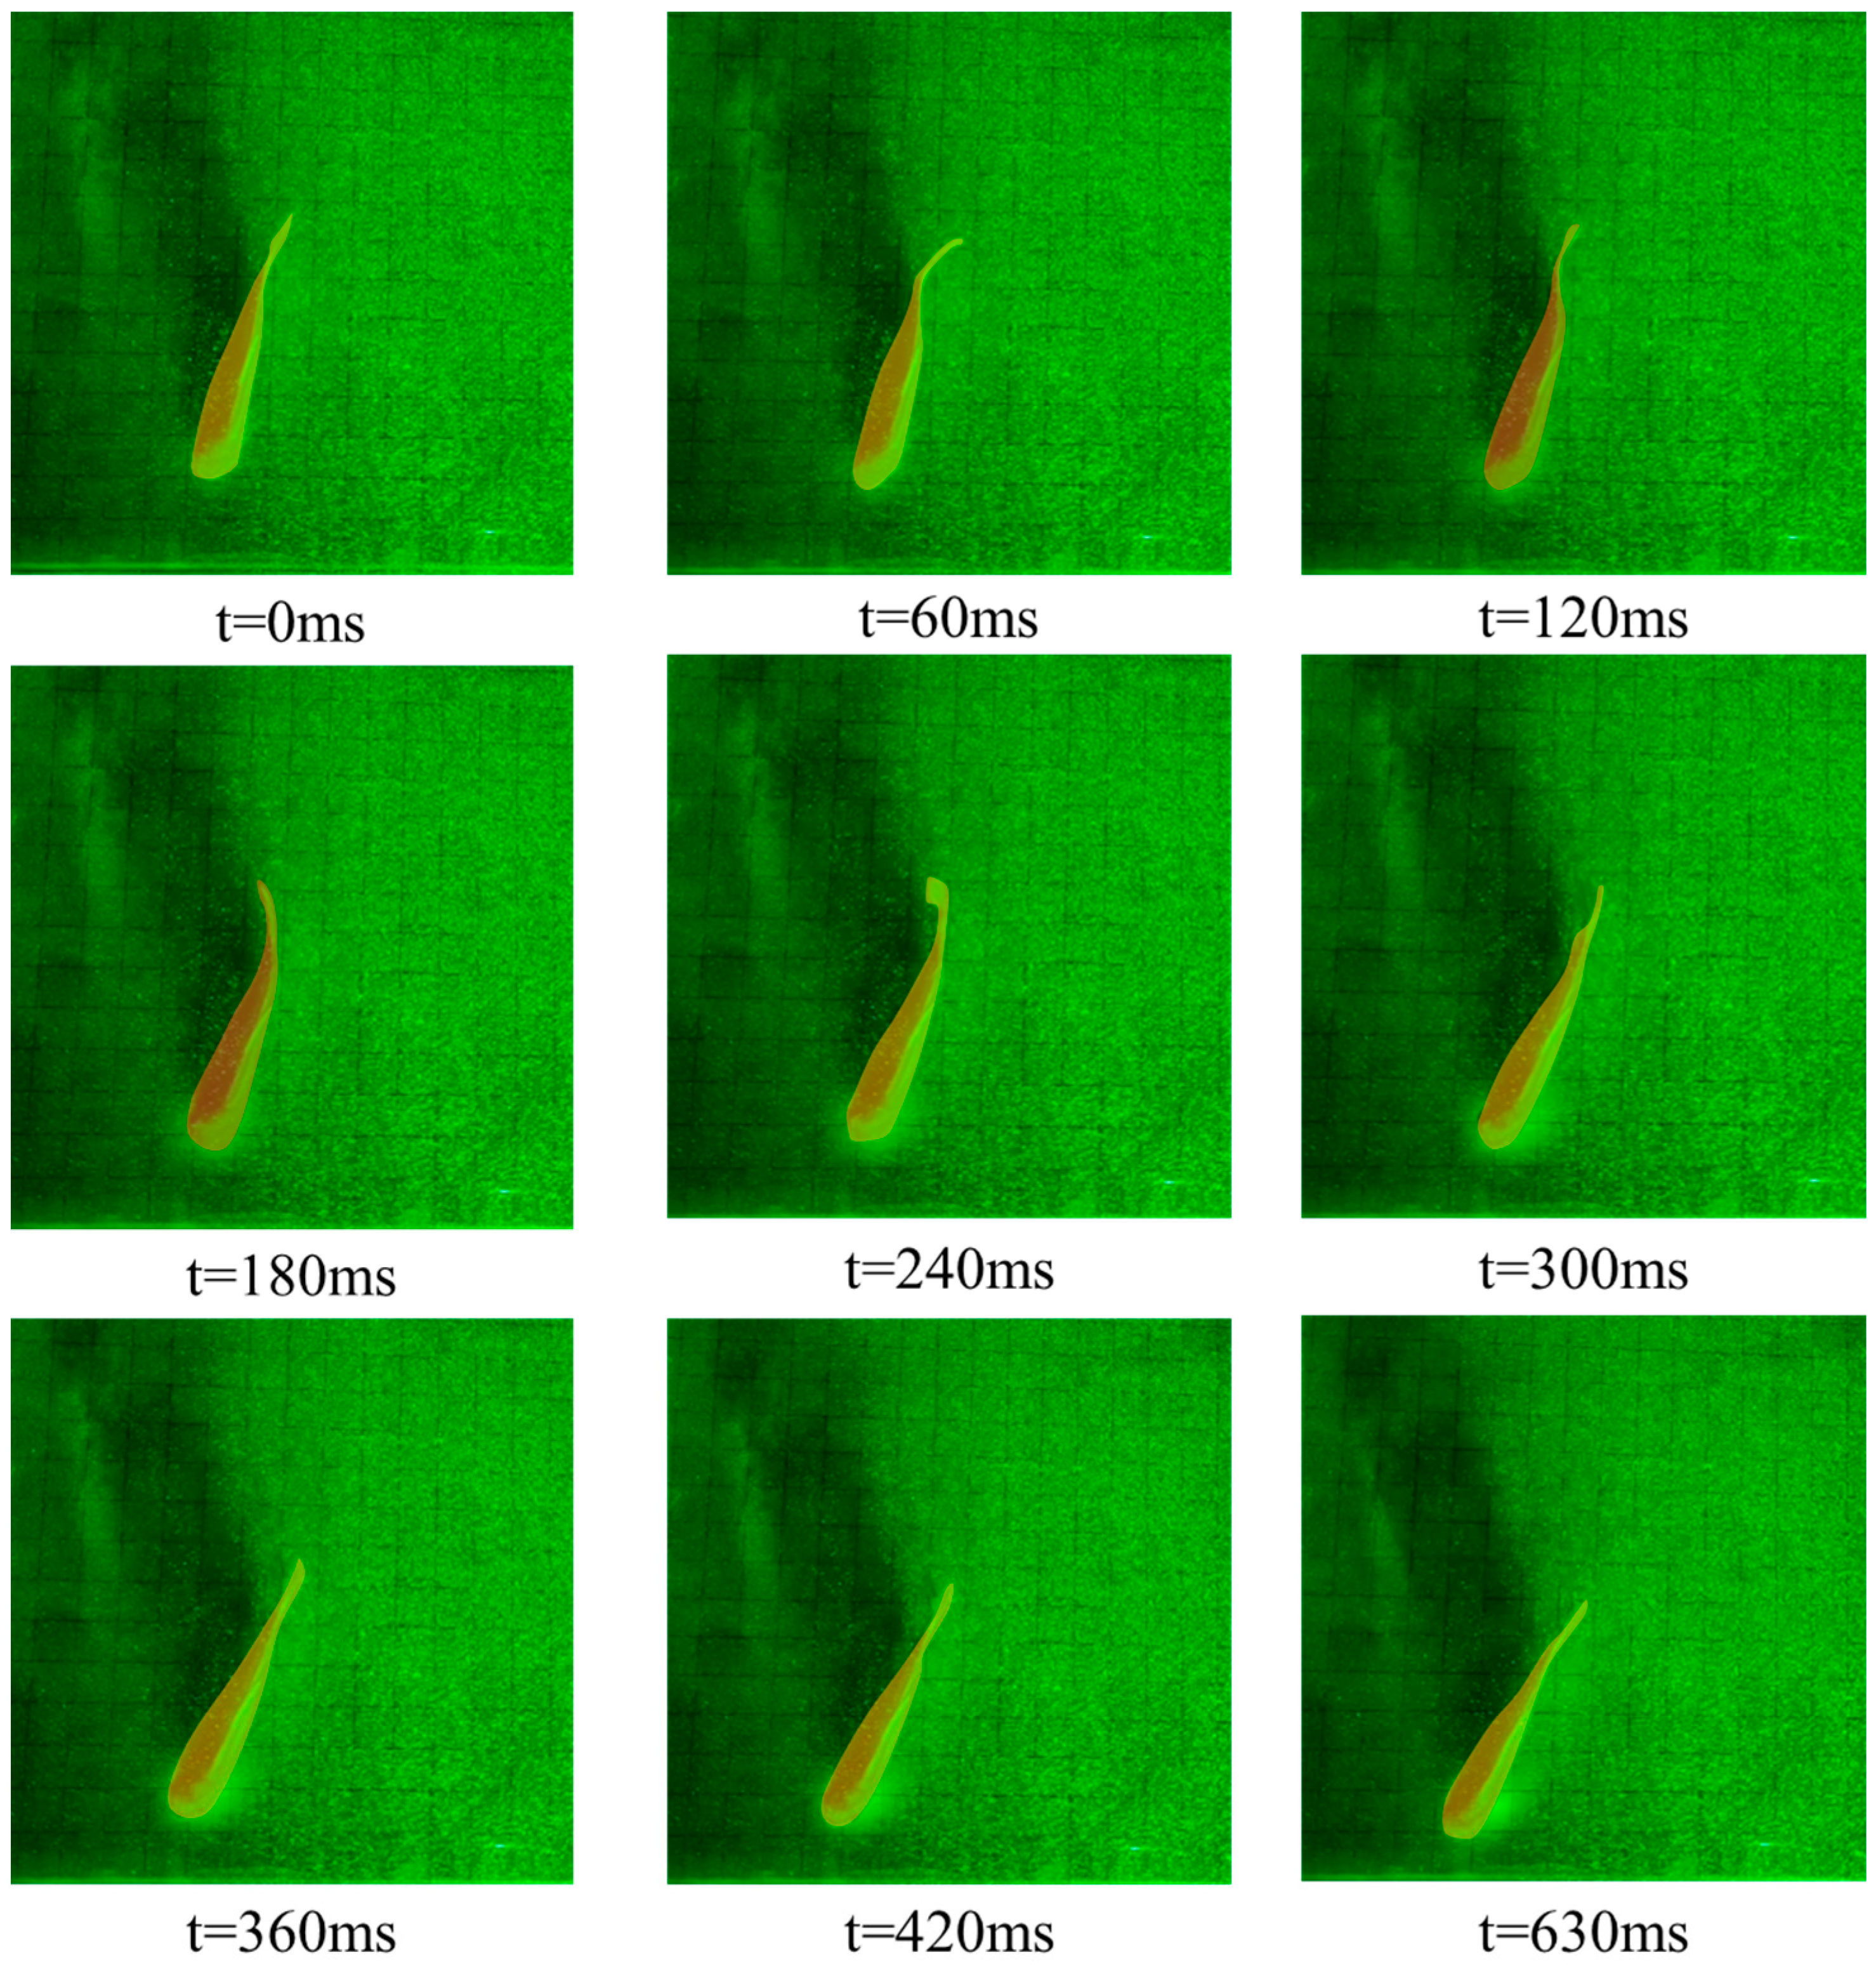
In this study, the burst-and-coast swimming mode, predominantly the half tail-beat (HT) pattern, was observed in juvenile goldfish under still-water conditions. This pattern involves a single tail beat during the burst phase. The sequence of burst-and-coast swimming for juvenile goldfish is depicted in Figure 8, illustrating that the swimming can be distinctly divided into two phases, namely the burst phase and the glide phase, with the body extending during the glide phase. A complete burst-and-coast swimming cycle lasted 630 ms, with the burst phase lasting 300 ms and the glide phase lasting 330 ms.
In the burst state of juvenile goldfish, the average velocity of the fish was measured at 0.0358 ± 0.0178 m/s. In the coast state of juvenile goldfish, the average velocity of the fish was measured at 0.0222 ± 0.0118 m/s. During the burst-and-coast swimming state, the lateral displacement was 0.0069 ± 0.0009 m, with a side displacement of 0.0137 ± 0.0009 m. And the head angle was 35.3°. The entire process can be categorized into two stages. In the first stage, which is shorter in duration, the fish’s body bends into an S-shape, with minimal deformation at the anterior part and a single rightward tail movement. In the second stage, which is longer, the fish’s body glides forward in a straight state. The Strouhal number during the burst phase is 0.59, indicating that the cost of swimming is higher for fish during the first phase. And the Reynolds number is 2.3 × 10⁴.

3.2. Analysis of Vorticity around the Tail under Different States

Vorticity is a fundamental descriptor of the dynamics of fish locomotion, with the calculation of vorticity changes within the flow field used to characterize the hydrodynamic changes associated with the tail fin oscillations of fish. Numerous scholars have successfully conducted experiments to capture the wake flow fields that occur behind fish tails as they swim. These wake flow fields are notable for displaying von Kármán vortex street, a phenomenon characterized by a sequence of vortices that are shed alternately from each side of the tail in a direction opposite to the usual flow pattern. The widespread belief among researchers is that fish deliberately harness these vortices to enhance their propulsive efficiency, allowing them to move through water with greater effectiveness and less energy expenditure. This suggests a sophisticated mechanism by which fish can optimize their swimming performance through the manipulation of fluid dynamics [44,45,46]. It is important to note that these eddies are not only utilized but are also generated by the fish themselves. The tail beat motion creates a series of vortices that the fish can exploit to enhance their forward movement. These self-generated eddies play a crucial role in the fish’s locomotion by influencing the flow dynamics around the body, which in turn, affects thrust production and efficiency. Consequently, the study of vortex structures and their evolution is of great importance. In this study, a particle image velocimetry (PIV) system was employed to measure the flow-field structures of juvenile goldfish under different swimming conditions.
(1)
Forward swimming condition
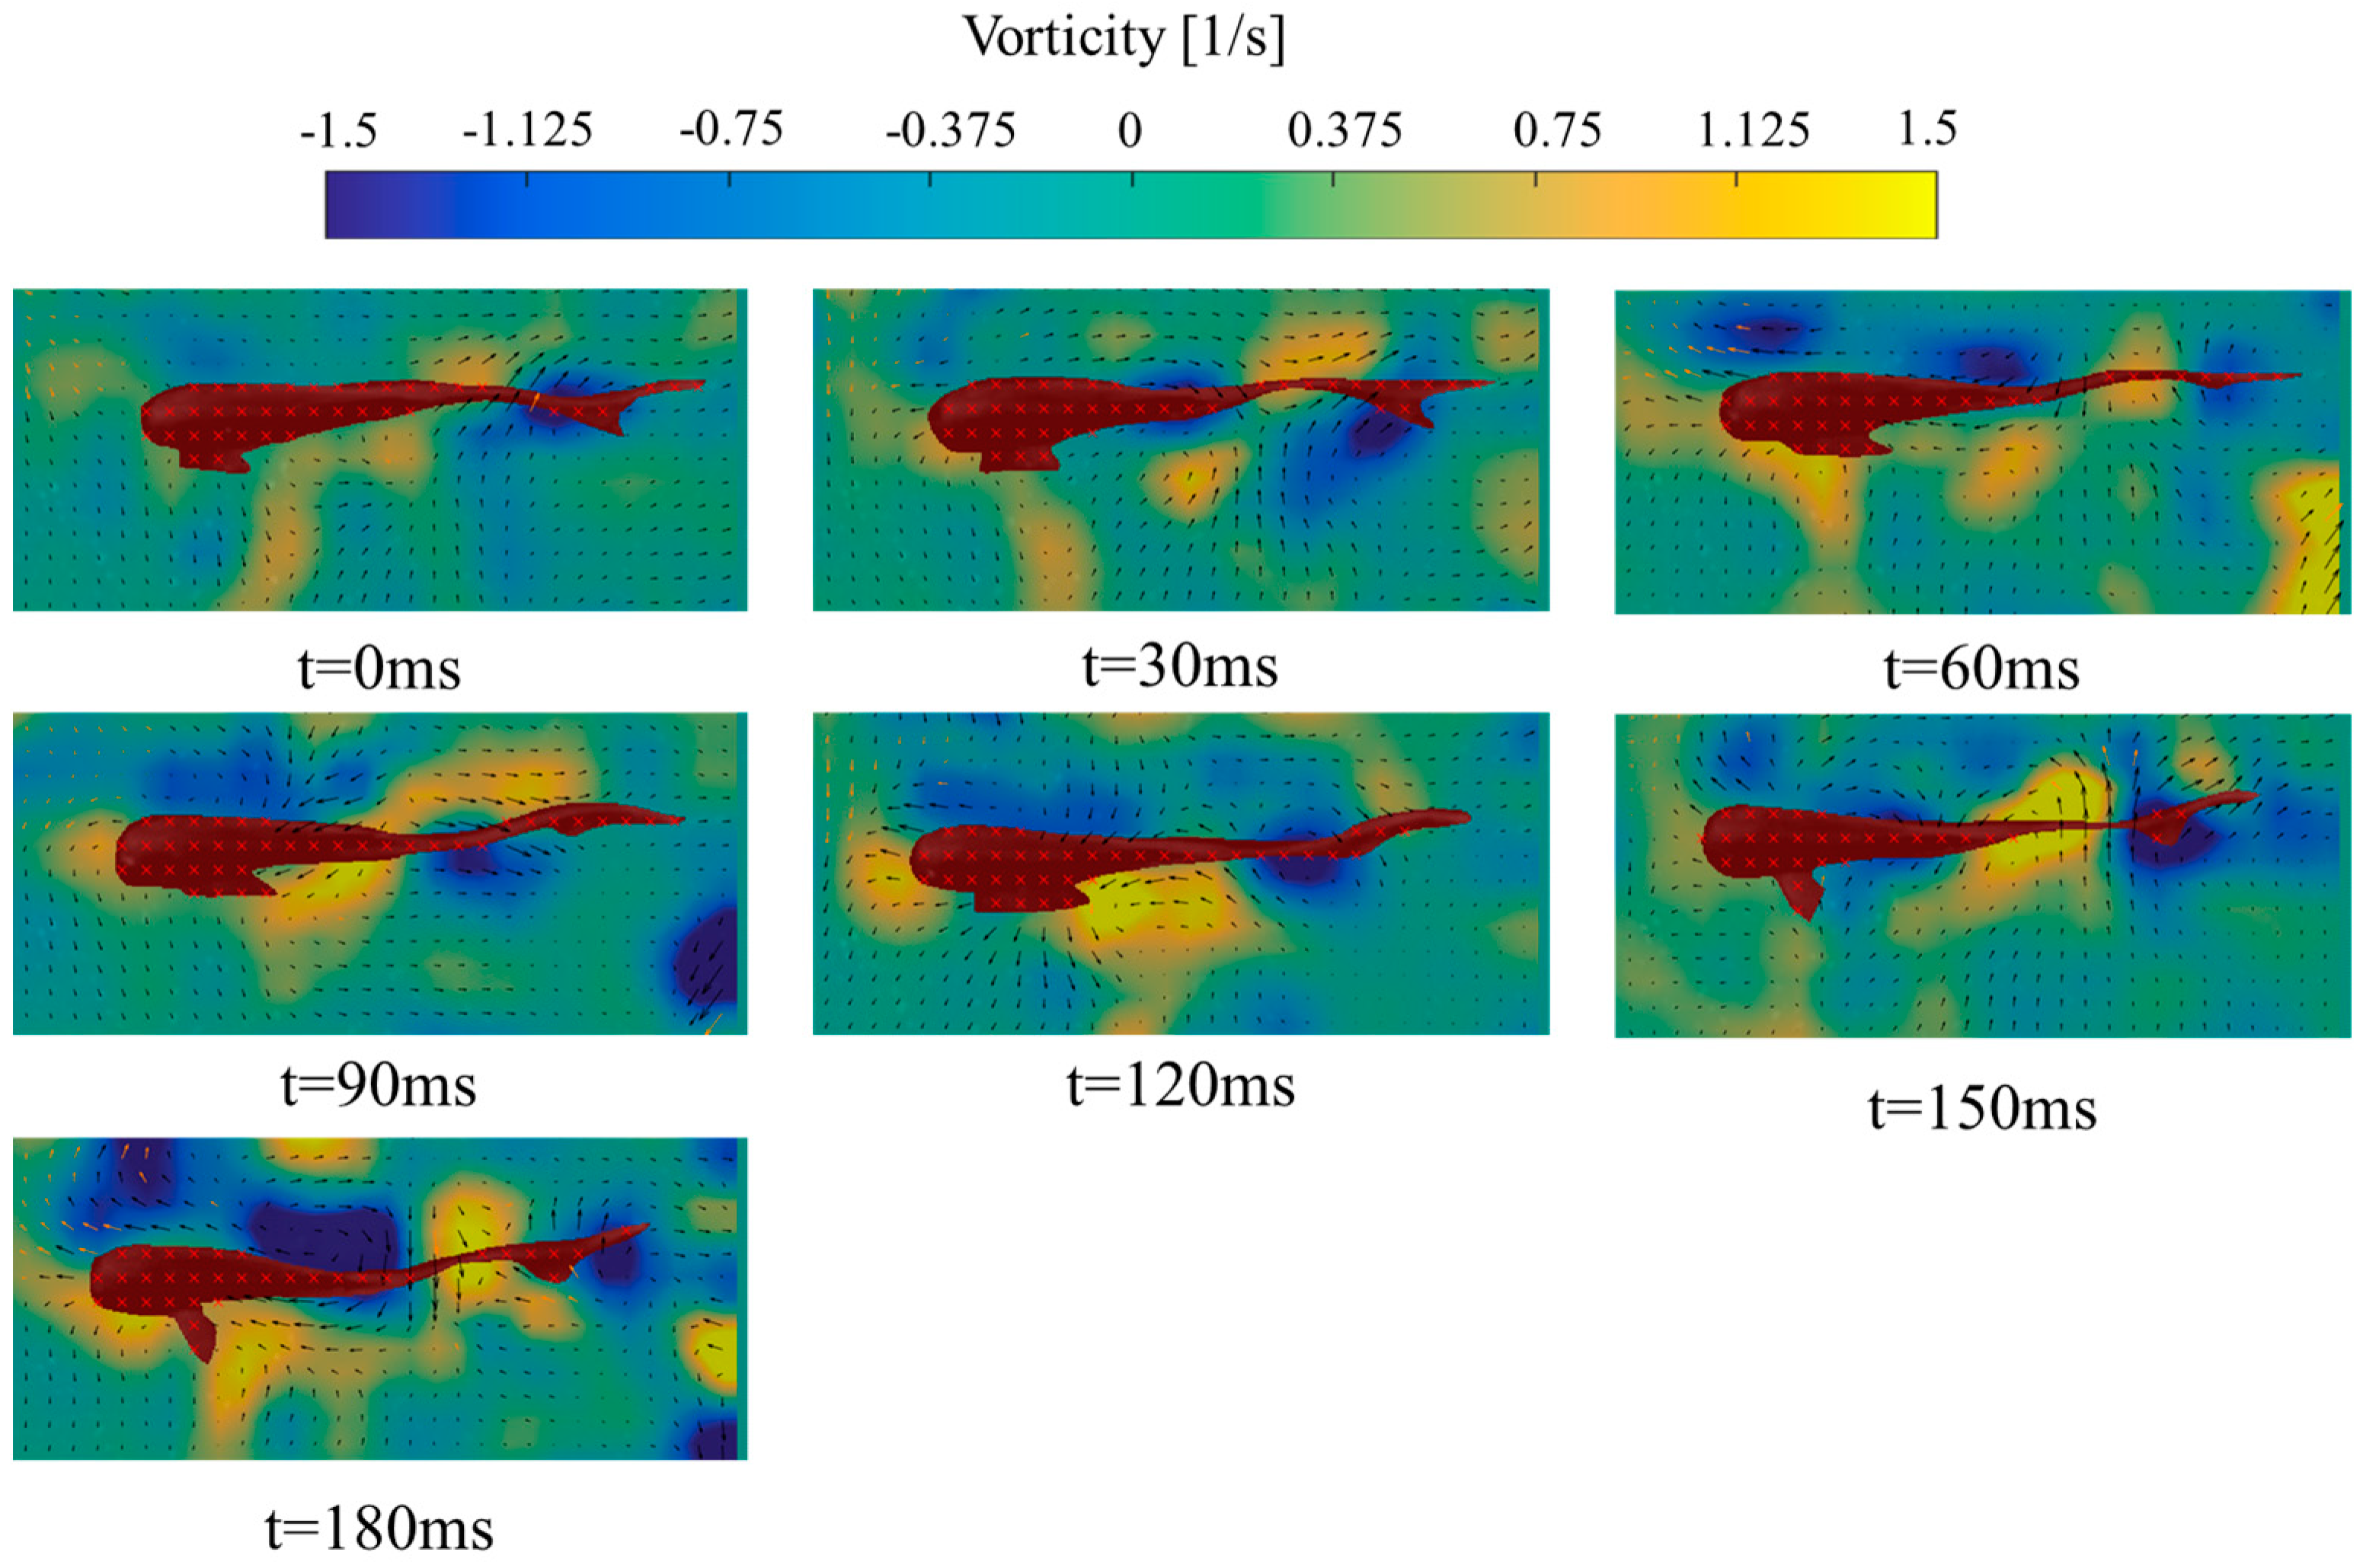
In the vorticity cloud map, the yellow color represents positive vorticity, while the blue color represents negative vorticity, with the arrow direction indicating the direction of the velocity vector. The measurement results indicate that, throughout the swimming process, the vorticity field around the juvenile goldfish exhibits a distinct regular pattern of change. As evident from Figure 9, on the left side of the fish’s body, a portion of positive vorticity is consistently concentrated, while negative vorticity is gathered on the right side. The tail movement of the fish results in the continuous generation of vortex rings in the wake, with alternating positive and negative vortices constantly shedding at the tail end and distributing on both sides of the tail. Many studies have shown that the visually identifiable vortex structures formed by fish tails typically are classified as a series of connected vortex rings intersecting the laser plane or two rows of isolated vortex rings. These vortex rings are visually represented in a two-dimensional plane as a series of alternating vortices distributed on both sides of the tail movement’s trajectory [47,48], which aligns with the observations from this experiment.
When the fish body begins to swing, positive vorticity can be observed starting from the head, with a vorticity value of 0.59 s 1 . Subsequently, the vorticity gradually sheds towards the tail. During this process, the area of vorticity increases, with the positive vorticity values ranging between 0.41 s 1 and 0.63 s 1 . Meanwhile, negative vorticity is generated on the right side of the fish head, amounting to −0.34 s 1 . Thereafter, the negative vorticity sheds towards the tail of the fish body. During this period, the negative vorticity values vary between −0.14 s 1 and −0.51 s 1 ;
(2)
Turning State
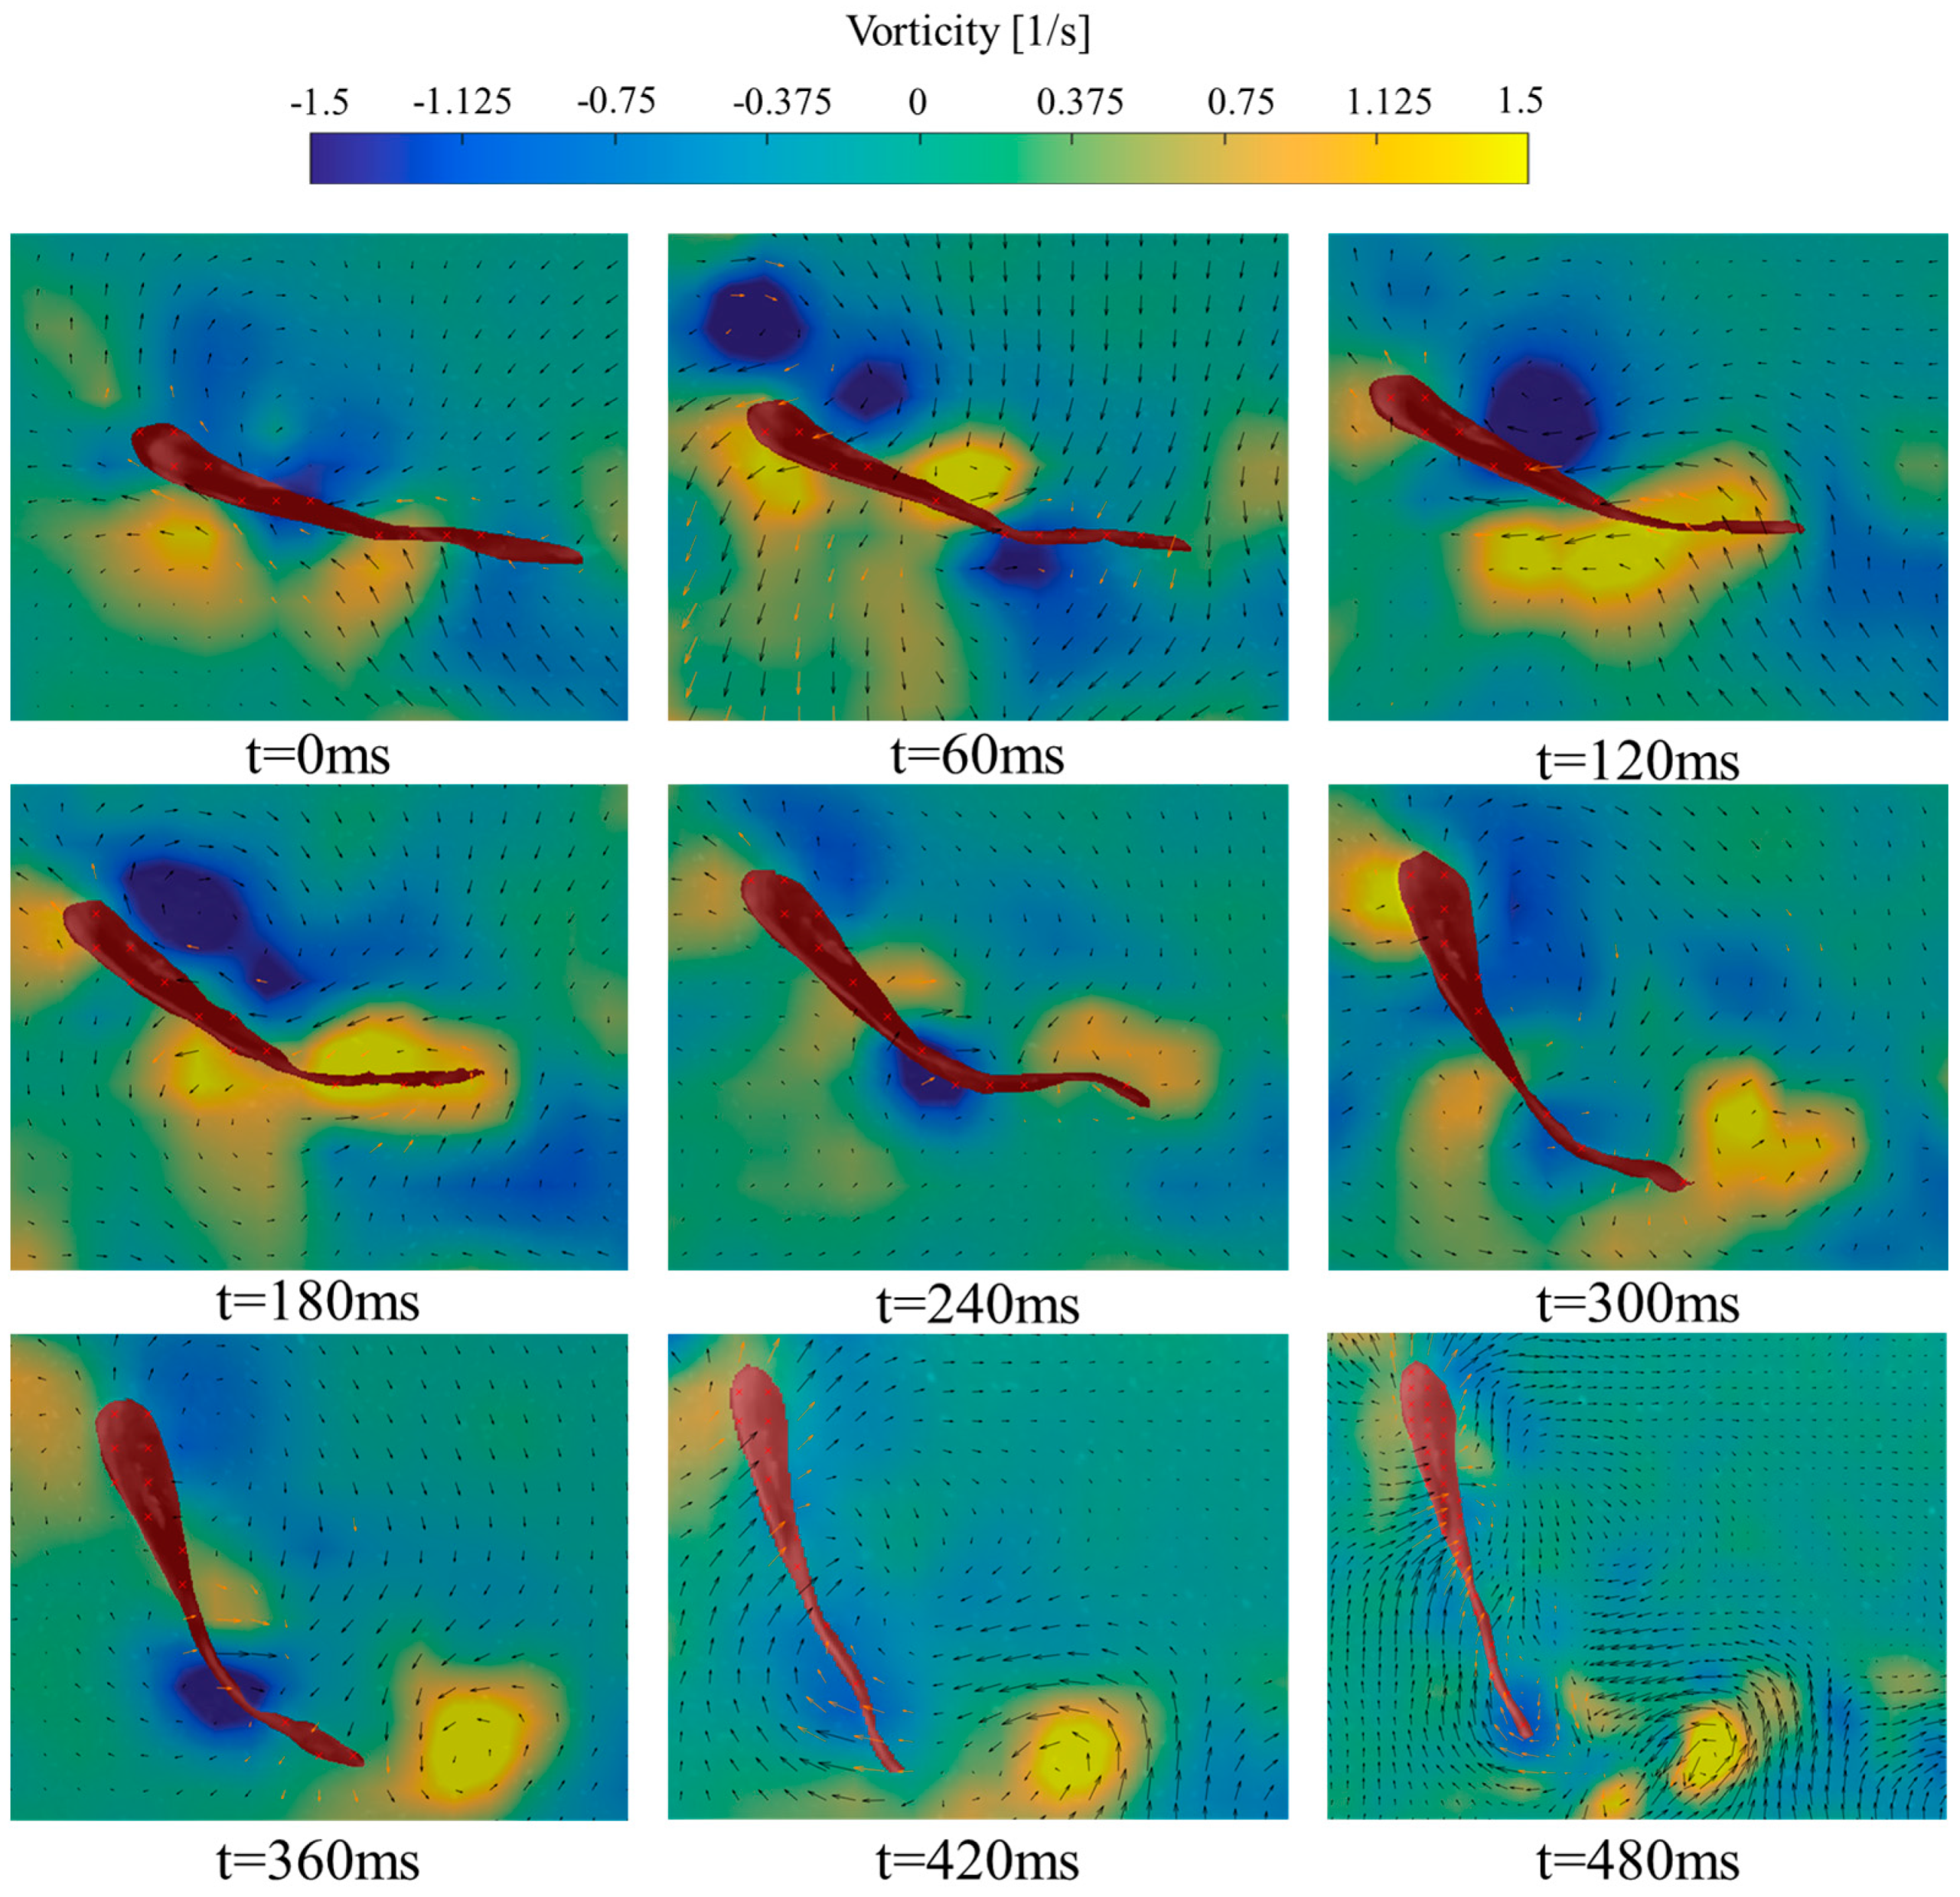
An analysis of the turning process of juvenile goldfish (Figure 10) reveals that the fish curves into a C-shape. During this maneuver, the turning side of the fish head is dominated by negative vorticity, while the opposite side is characterized by positive vorticity. As the C-shaped movement progresses towards a nearly straight state, the positive vorticity on the opposite side of the turning side of the fish head gradually increases. Throughout the turning process, the turning side predominantly exhibits negative vorticity, whereas the diagonal side shows positive vorticity, with these vortices alternating and shedding at the tail.
As the fish’s head begins to swing, negative vorticity starts to generate at the head, measuring −0.78 s 1 , while the positive vorticity reaches a value of 1.12 s 1 . At the peak of the turn, the vortices shed to the middle of the fish’s body, where the negative vorticity on the turning side of the body reaches −1.64 s 1 , and the positive vorticity on the turning side reaches 2.01 s 1 . As the vortices shed towards the tail, the negative vorticity is −0.71 s 1 , and the positive vorticity is 1.23 s 1 ;
(3)
Burst-and-coast State
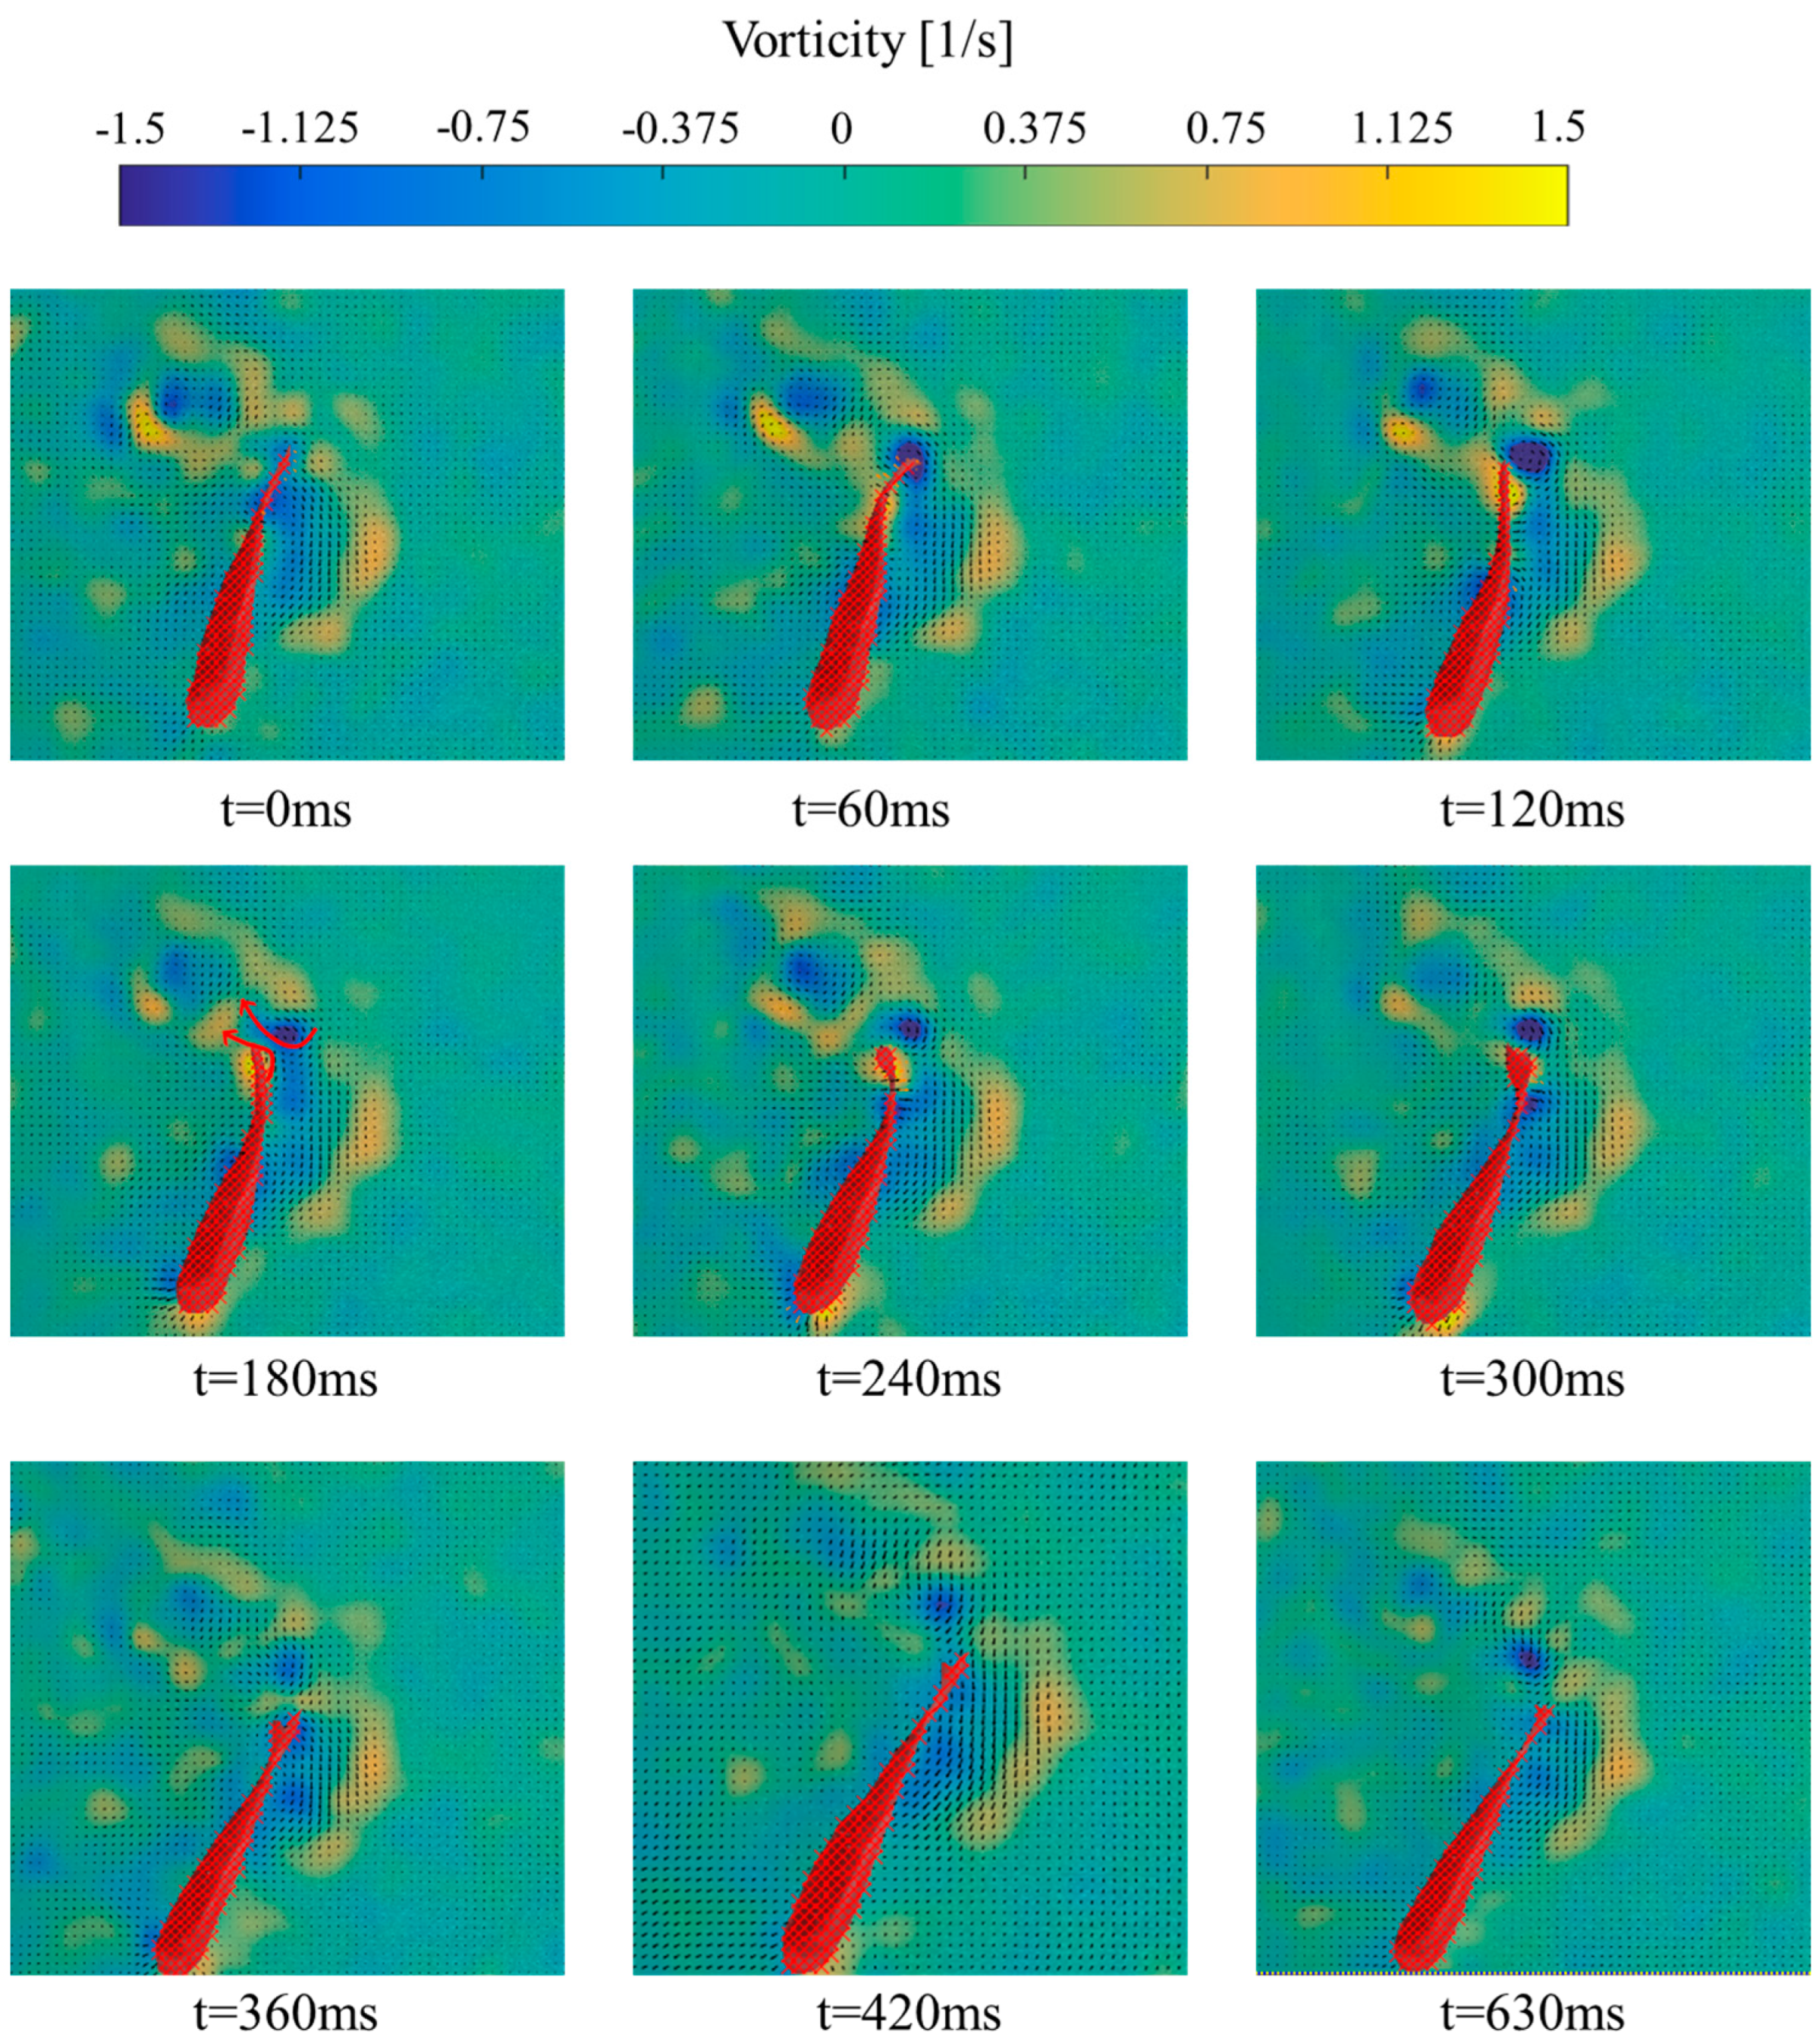
Figure 11 displays the vorticity contour around the juvenile goldfish during the burst-and-coast phase. In the first phase, designated as the single burst phase, an observation was made of a linear jet stream zone nestled within the flow field at the fish’s tail, appearing between each consecutive pair of vortices. Negative vorticity predominantly occurs on the right side of the tail, while positive vorticity mainly distributes on the left side. In the second stage, as the fish’s body returns to a straight position, vortex rings shed, and the shed vortices are located on the same side of the fish’s body.
In the first phase, the fish’s tail begins to swing, generating a positive vorticity on the right side of the body, measuring 0.58, while the negative vorticity on the left side of the body is −0.35 s 1 . When the swing reaches its maximum, the positive vorticity peaks at 1.64 s 1 , and it can be observed that the negative vorticity begins to shed, with a value of −1.08 s 1 at this point. In the second phase, the burst phase, the area of positive vorticity on the right side of the body increases, while the vorticity decreases to 0.68 s 1 and gradually dissipates to 0.23 s 1 . The negative vorticity decreases to −0.41 s 1 and finally dissipates to −0.19 s 1 .

3.3. Dynamic Characteristics under Different States

The swimming motion of fish is a consequence of the interaction between their bodies and the surrounding fluid, with the hydrodynamic forces acting on the swimming fish being primarily determined by the pressure gradient at the interface between the fluid and the fish’s body [49]. This interaction leads to the generation of complex axial forces on the fish’s body, which vary in both space and time. Both positive and negative pressures acting on the fish contribute to thrust and drag components. Consequently, there are four distinct types of forces acting on the fish, namely the thrust generated by positive pressure, the thrust generated by negative pressure, the drag generated by positive pressure, and the drag generated by negative pressure.
(1)
Forward Swimming Condition
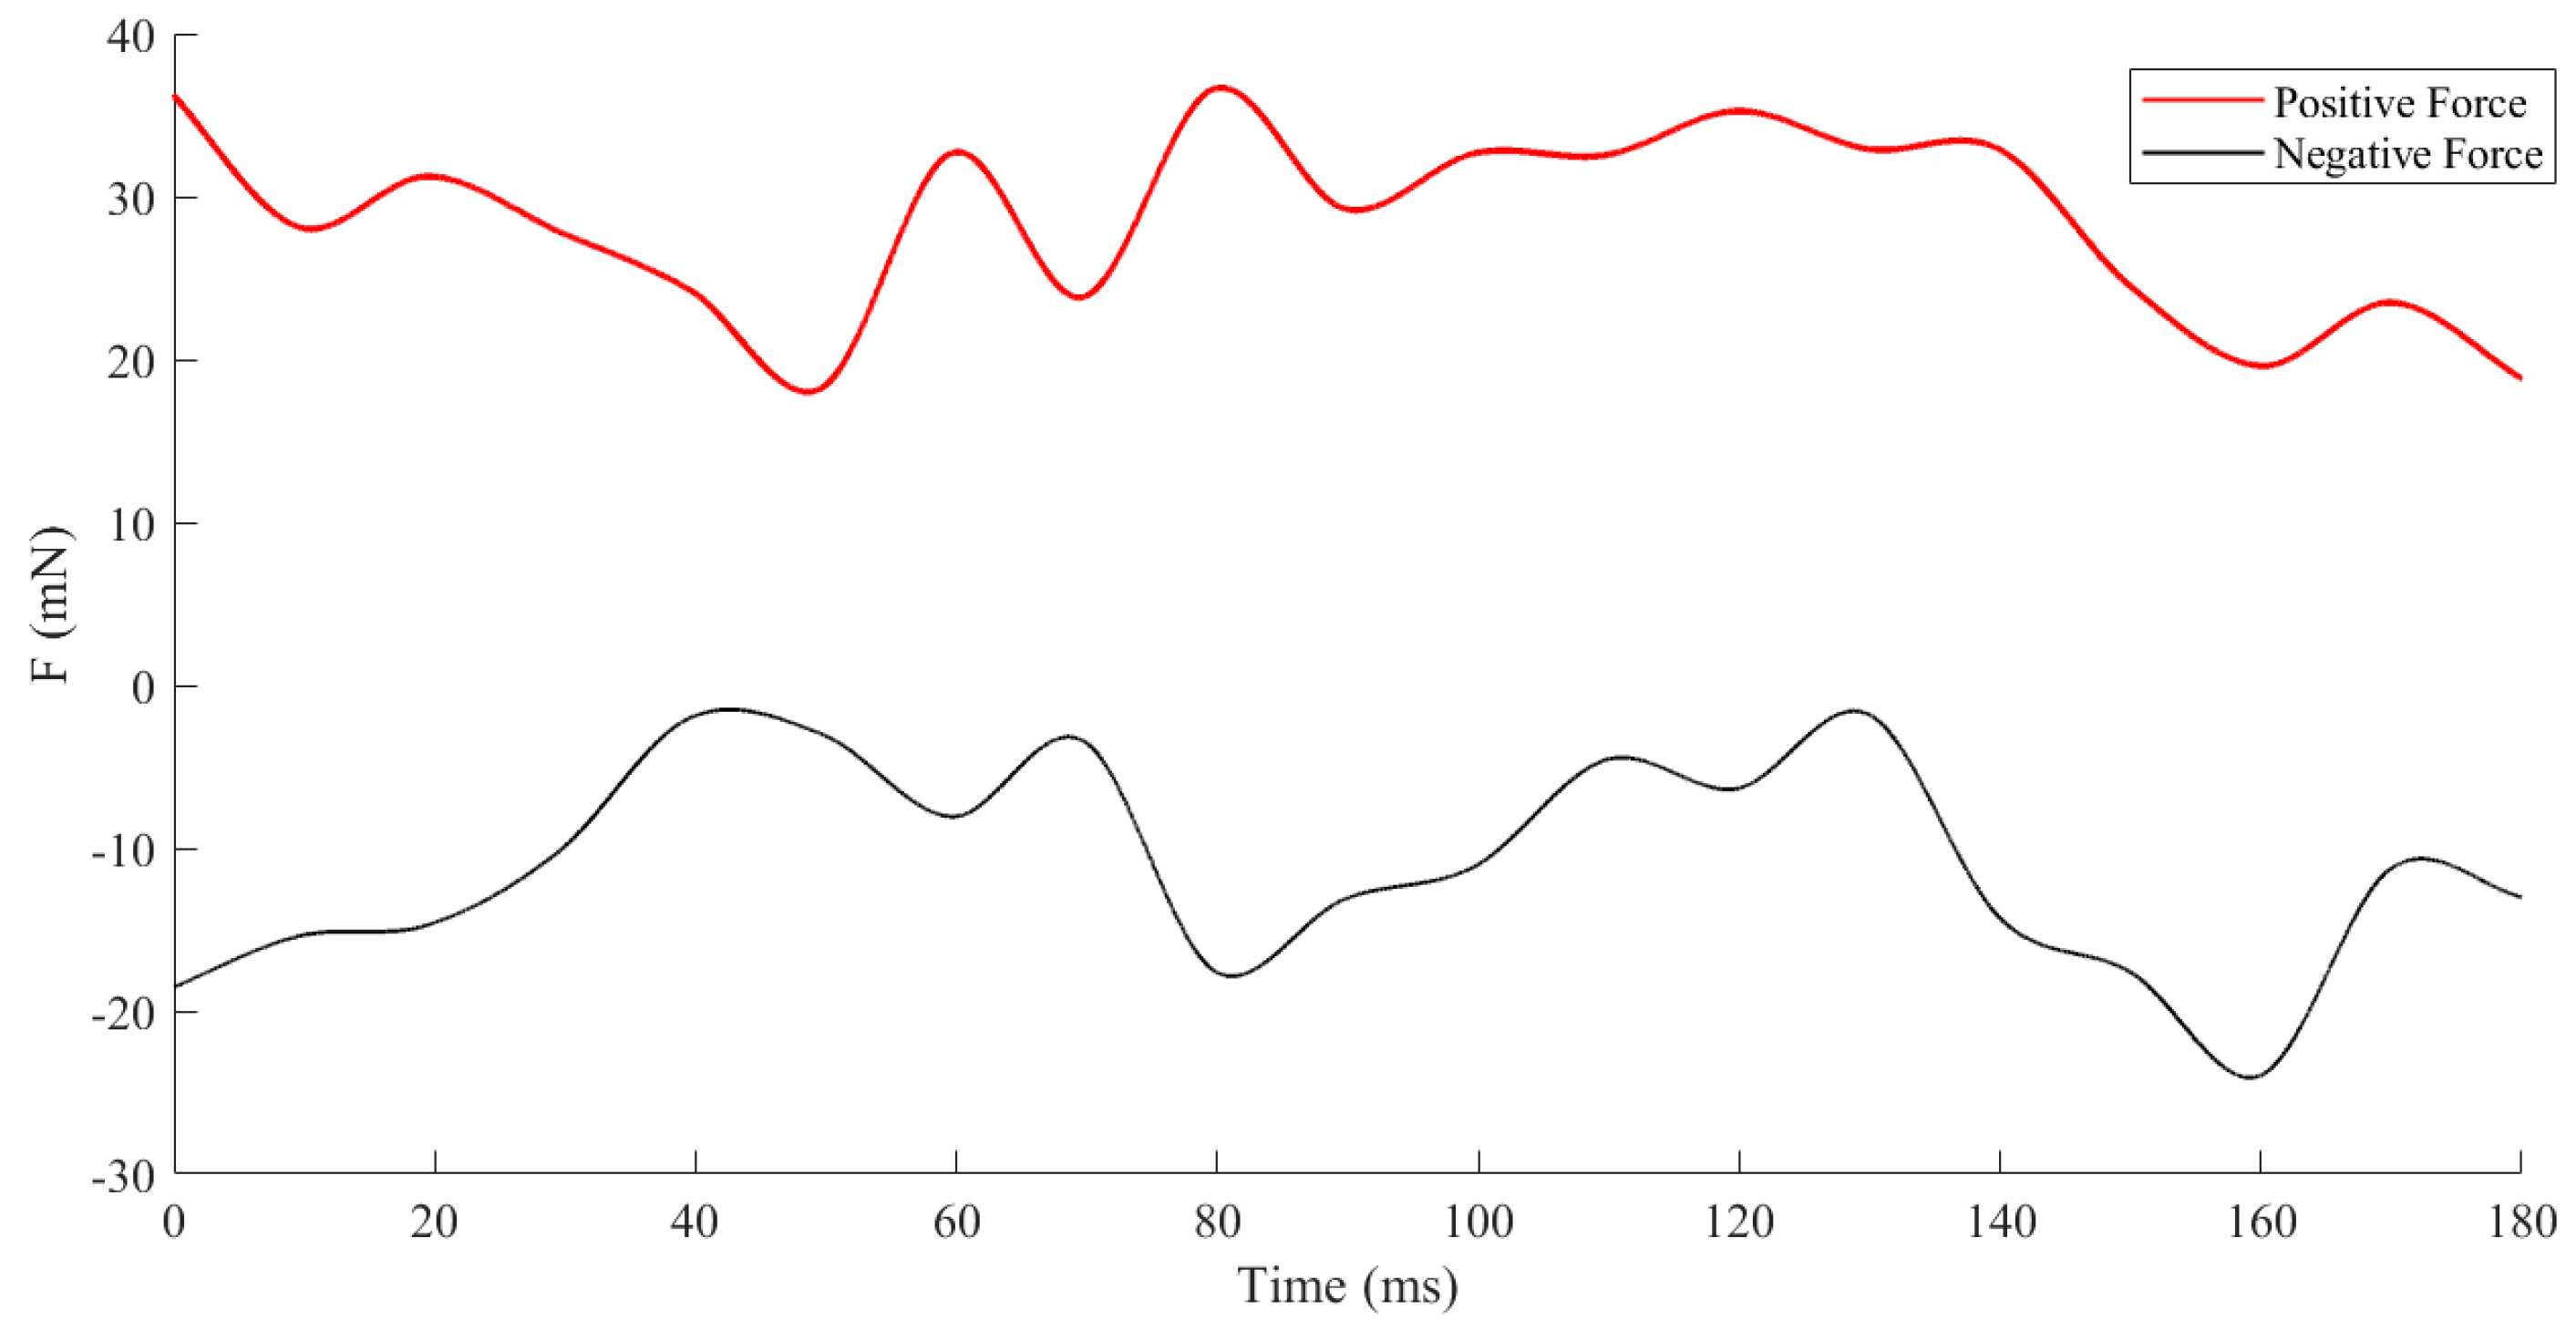
In the forward swimming state of juvenile goldfish, the magnitudes of positive and negative forces acting on the fish vary with time, as illustrated in Figure 12. It is evident from the graph that the changes in positive and negative forces during forward swimming are relatively small, with some periods showing a tendency towards stability. Throughout the locomotory cycle, the positive forces are slightly greater than the negative forces, with the distribution of positive forces ranging from 14.76 mN to 34.47 mN and negative forces from −26.55 mN to −8.27 mN. When combining the vorticity cloud map with the force diagram, a clear correlation between force and vorticity is observed, with the magnitude of the force being positively correlated with the vorticity. It is noteworthy that, at the initial moment, the force generated by juvenile goldfish is relatively high. This is attributed to the fact that, when a fish initiates swimming, it may use powerful tail beats to rapidly acquire forward speed, resulting in greater forces at the onset of movement. As the juvenile goldfish becomes accustomed to this swimming state, the forces decrease, indicating an energy-efficient swimming mode that is suitable for sustained locomotion over extended periods;
(2)
Turning State
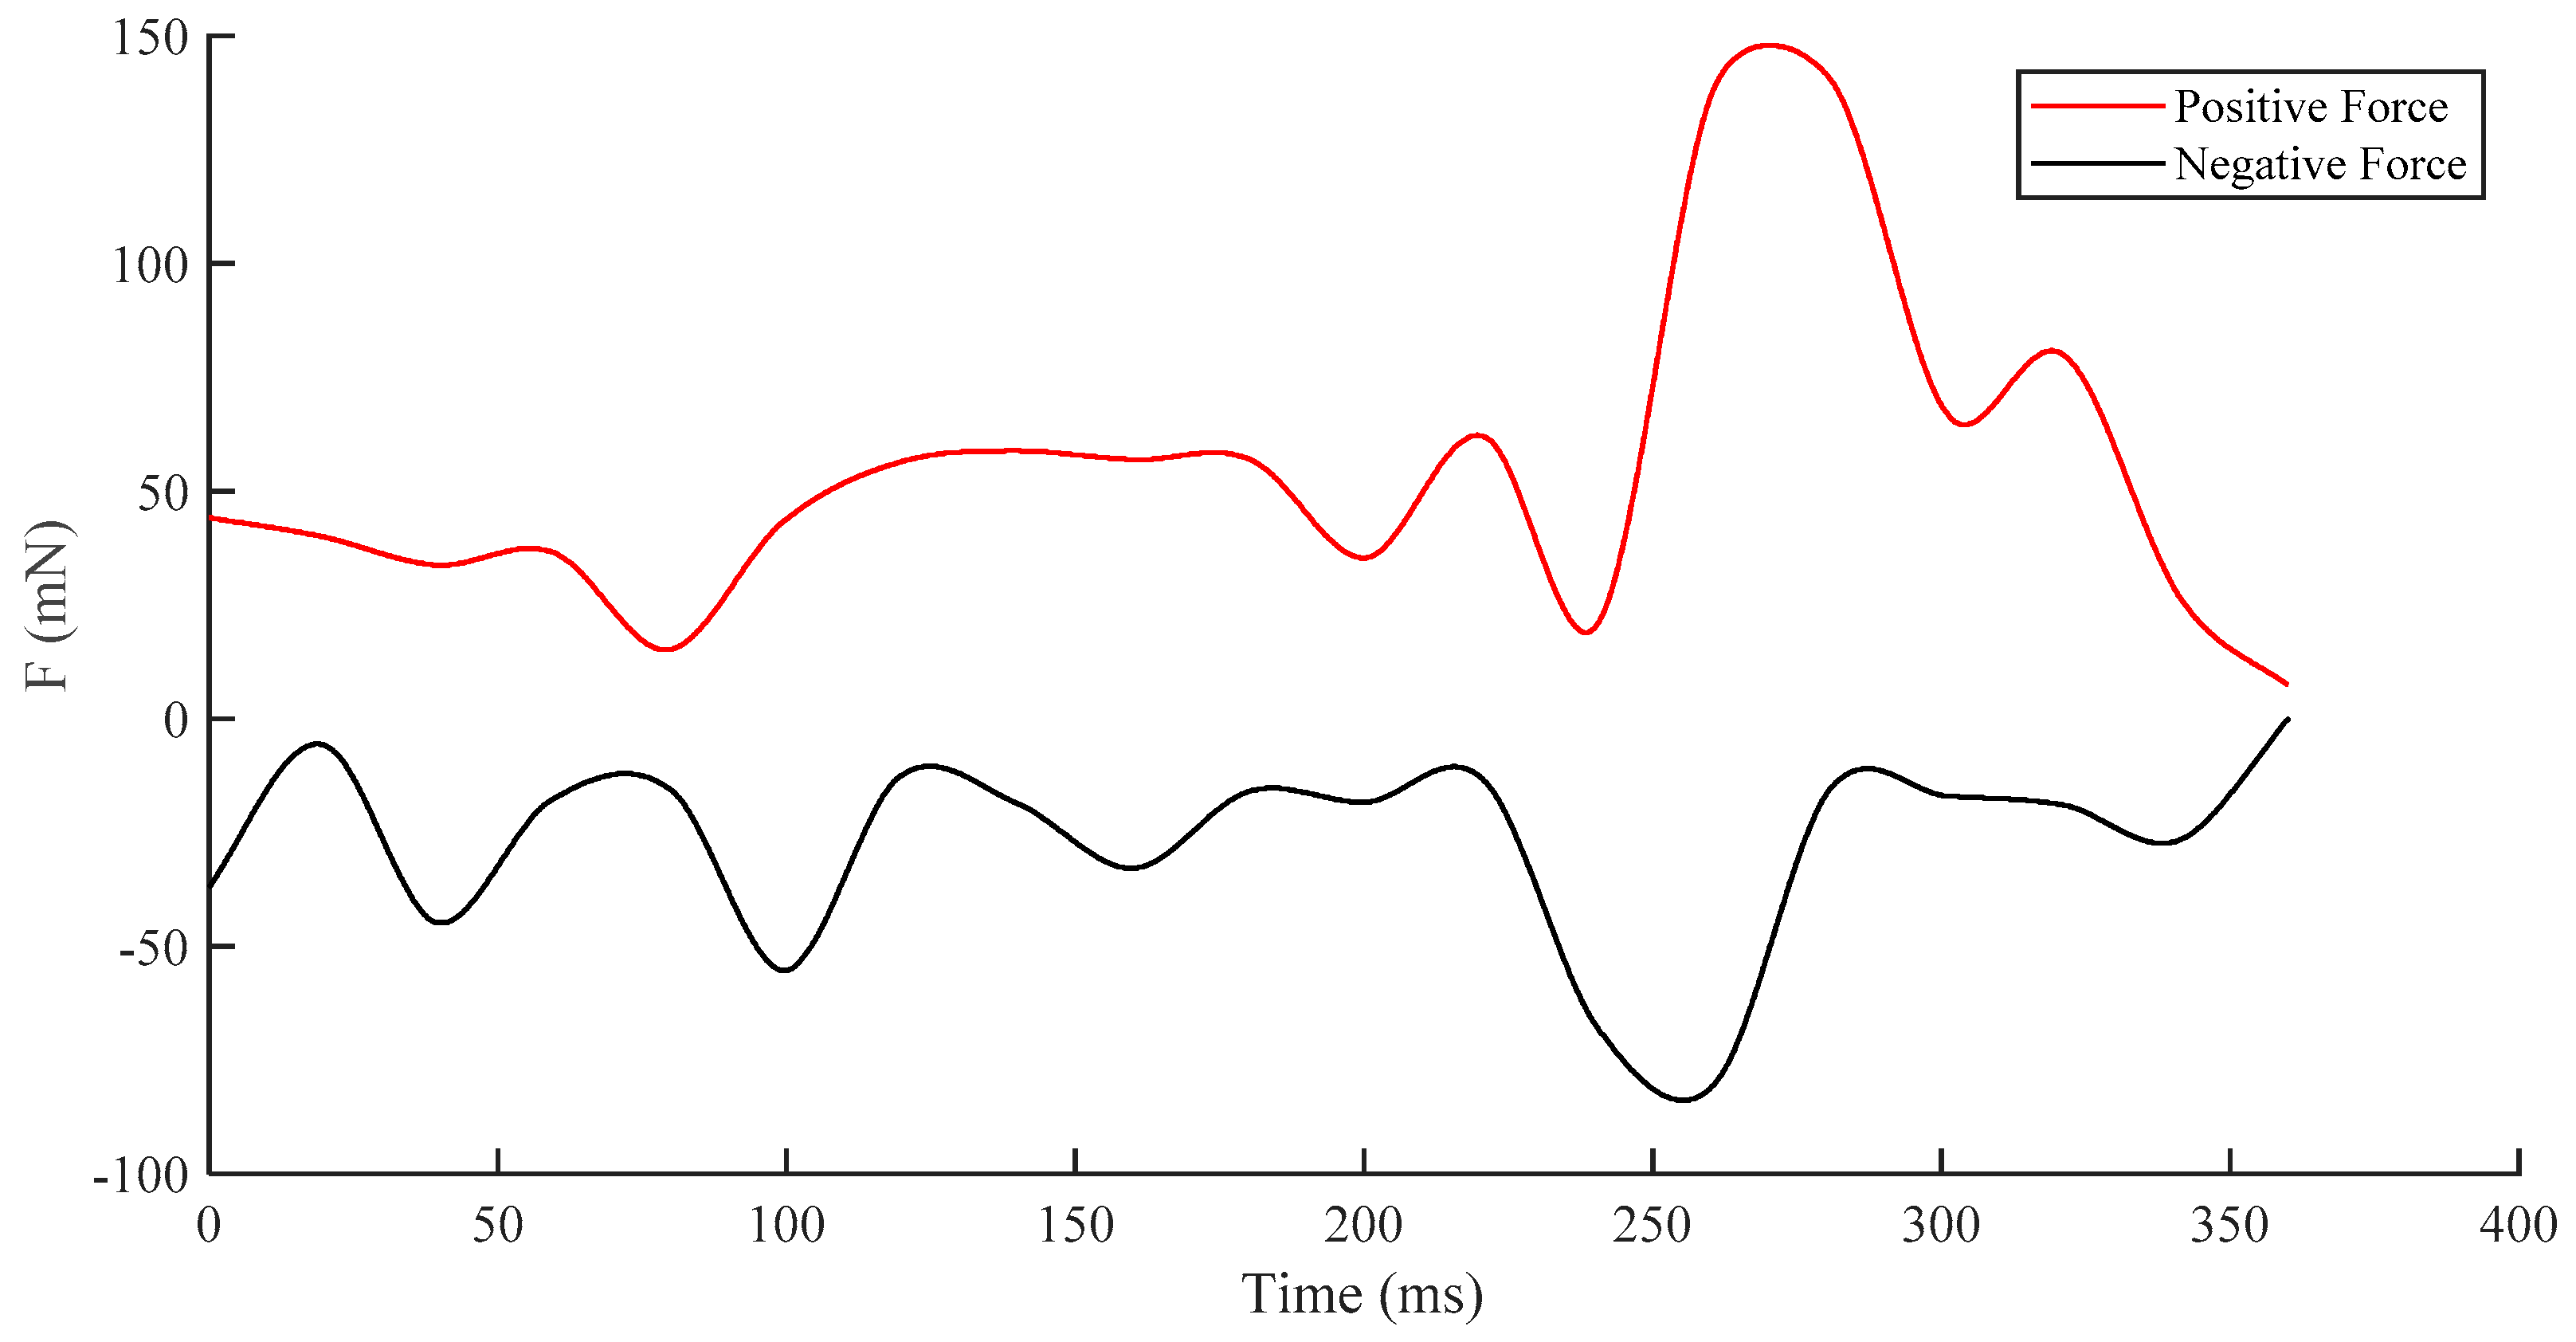
During the C-shaped turning maneuver of goldfish, as illustrated in Figure 13, the maximum positive force generated was 133.49 mN, with the minimum at 12.06 mN. Meanwhile, the maximum negative force was −83.85 mN, and the minimum at −10.15 mN. When combining the vorticity cloud map with the force diagram, a clear correlation between force and vorticity is observed, with the magnitude of the force being positively correlated with the vorticity. Higher vorticity values correspond to greater force generation. Throughout the turning process, the torque generated by the fish’s caudal fin was 0.0722 mN/m;
(3)
Burst-and-coast State
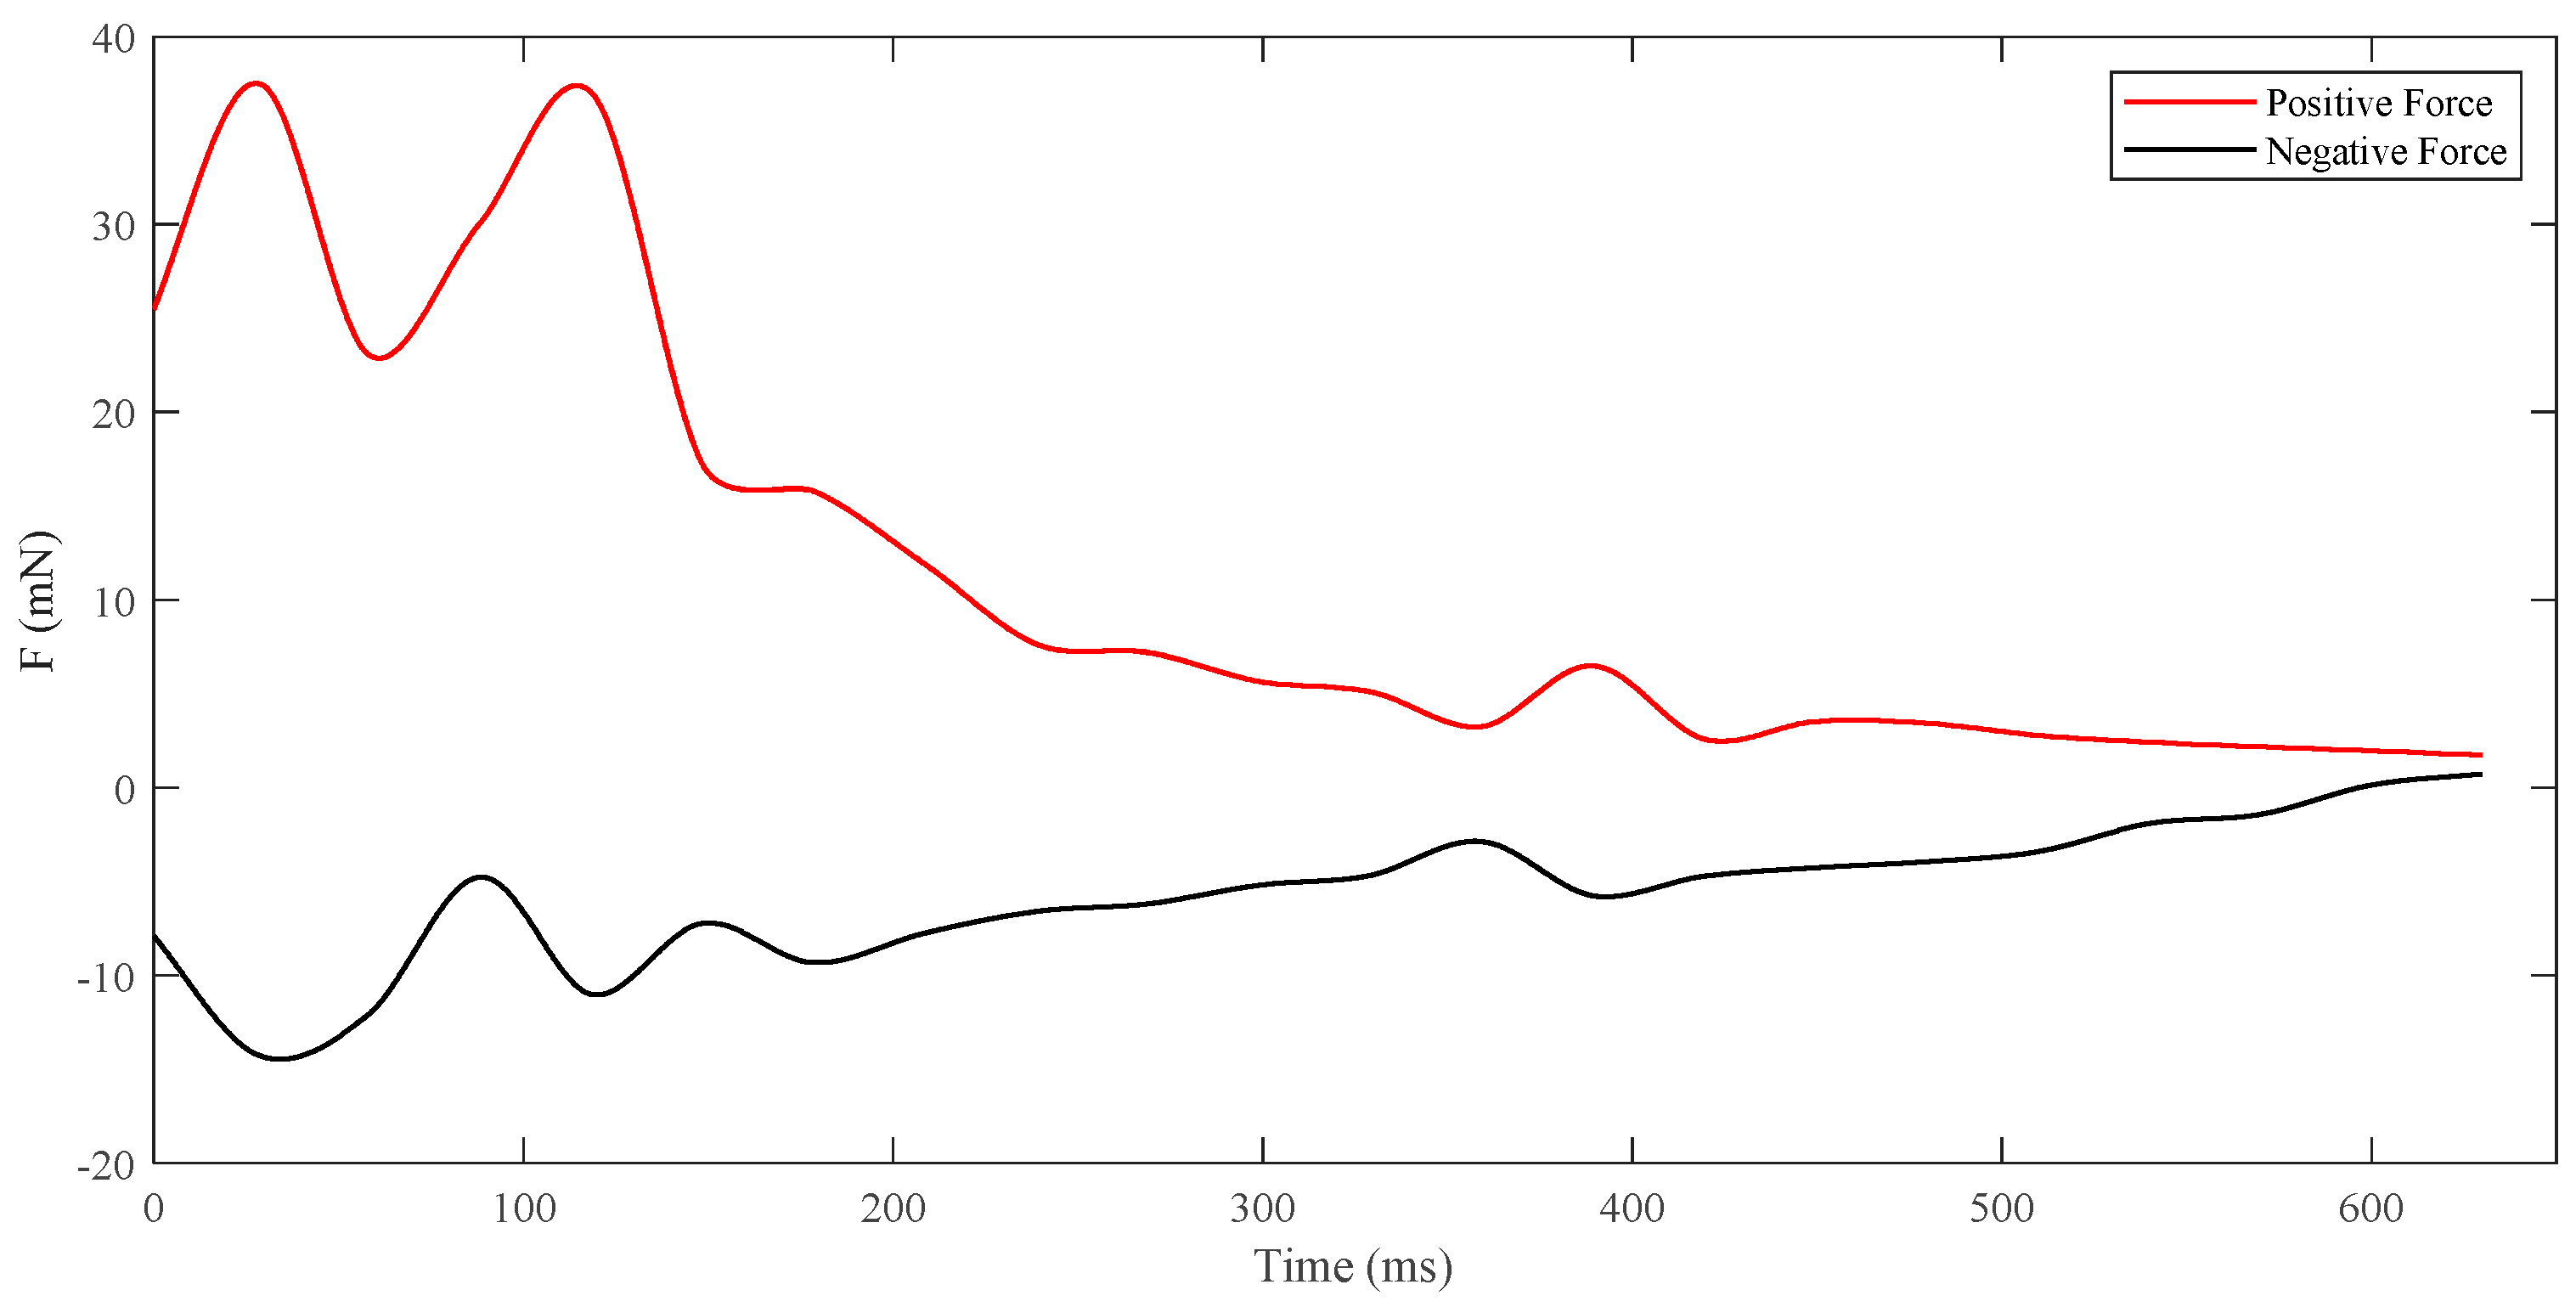
The burst-and-coast and glide swimming mode represents non-steady locomotion, which is characterized by distinctly non-steady changes in forces at different stages. It is an efficient form of movement, as depicted in Figure 14. In the first stage, the tail fin of the juvenile undergoes a rightward beat, leading to fluctuating fluid forces. The overall trend of positive and negative forces shows an initial increase followed by a decrease, with the positive forces being greater than the negative forces. In the second stage, as the juvenile ceases its tail movement and glides forward, the forces exerted on the fluid decrease, with the negative forces being greater than the positive forces, resulting in deceleration. Throughout the burst-and-coast and glide cycle, the maximum positive force was 37.90 mN, with a minimum of 3.70 mN, and the maximum negative force was −16.61 mN, with a minimum of −4.95 mN. The predominance of positive forces during the burst-and-coast phase indicates that the juvenile experiences a forward thrust during this process. The larger negative forces during the glide phase are due to the cessation of tail movement, which ceases to produce the forces necessary for locomotion, leading to deceleration. The variation in vorticity is proportional to the change in force, a principle that also applies to the burst-and-coast and glide swimming state of fish. The trend of force variation throughout the cycle aligns with the vorticity change trend observed in juvenile goldfish, suggesting that the same propulsion mode experiences a force variation pattern of initial increase followed by a decrease in the burst-and-coast and glide state.

4. Discussion

4.1. Comparison of Kinematics of Goldfish under Different States

This study utilized particle image velocimetry (PIV) to analyze the kinematic characteristics of three swimming modes (swimming, burst and coast and glide, and turning) in juvenile goldfish. The quantitative analysis of the kinematics during fish locomotion revealed that the C-shaped turning maneuver exhibited the highest speed, followed by forward swimming, and then burst-and-coast swimming. This indicates that C-shaped turning allows fish to perform rapid and agile movements, effectively evading predators. Forward swimming, which is the most common mode of locomotion for fish, is suited for longer distances, while burst-and-coast swimming is more appropriate for leisurely movement.
The velocity during the acceleration phase is a critical indicator of a fish’s ability to accelerate and glide. Videler [50] studied cod with a body length of 26 cm, finding that their acceleration phase velocity was 1.16 m/s. For goldfish with a body length of 5.85 cm, the initial velocity was 0.078 ± 0.032 m/s, and for juvenile goldfish with body lengths of 17.93 cm and 51.24 cm (juveniles), the initial velocities were 2.359 ± 0.434 m/s and 2.889 ± 0.457 m/s, respectively. These findings differ from our study, indicating that swimming abilities vary among fish of different body lengths and species [51]. The results suggest that there are significant differences in swimming abilities among fish of similar body lengths but different species. Additionally, fish exhibit transitions between different swimming modes. Yang [52] found that, after burst-and-coast swimming, fish often engage in turning movements. Observing the trajectory of fish in our study during burst-and-coast swimming, we also observed instances where fish transitioned into turning movements, which aligns with Yang’s findings. These insights provide a valuable contribution to understanding how fish optimize their swimming strategies in response to different ecological and functional demands. Zhang et al. [19] explored the mechanical characteristics of juvenile goldfish during straight, turning, and backward swimming. They identified a normal distribution of propulsion efficiency with respect to the tail vortex structure and the head angle, with smaller head angles and specific tail vortex structures favoring higher efficiency. Hanke’s study on goldfish adds to this understanding by showing that a 6 cm goldfish can generate a wake lateral diffusion exceeding 20 cm after 3 min of swimming, with the swimming direction correlating with the water flow [53]. These findings underscore the importance of tail vortex structure and head angle for propulsion efficiency and the complex hydrodynamic interactions involved in fish locomotion. Importantly, this study is the first to systematically quantify the transition dynamics between multiple swimming modes, providing novel insights into the mechanisms behind these transitions. This innovation in analyzing the transitions between swimming states in juvenile cyprinid fish fills a gap in previous studies that focused primarily on individual swimming modes without addressing the transitions.
This study introduces an innovative approach by systematically quantifying not just individual swimming modes, but also the transition mechanisms between different swimming states, a factor largely neglected in previous studies. This allows for a deeper understanding of the kinematic variations associated with different swimming behaviors and the energy efficiencies associated with these transitions.

4.2. Variation of Vorticity around the Tail of Juvenile Fish under Different States

This study analyzed the typical flow-field distribution characteristics of three swimming modes and found distinct similarities and differences in the flow-field structures of juvenile goldfish under each mode. In the cruising swimming mode, the fish’s body oscillations result in the formation of a pair of counter-rotating vortices distributed on both sides of the tail. Positive and negative pressure regions alternate along the middle of the fish’s body. In the burst-and-coast swimming mode, the swimming can be divided into a burst phase and a coast phase. During the burst phase, the counter-rotating vortices are formed on the same side of the fish’s body, with only a negative pressure region formed in the middle. In the glide phase, the distribution of vorticity and pressure does not show significant changes. Specifically, our results demonstrate that, during the burst phase, the vorticity on one side of the body intensifies, leading to a higher force production compared to the glide phase. In the turning swimming mode, a local jet forms at the concave area of the fish’s body, and a pair of vortices are formed on both sides of the jet. Additionally, a strong negative pressure region forms on the inside of the curve in the middle of the fish’s body, which gradually transitions from negative to positive as the turning progresses. This pattern is consistent with the findings of Zhang [54], who discovered that the wake flow field of goldfish during C-start maneuvers exhibits characteristics of a von Kármán vortex street, suggesting a complex interplay between fluid dynamics and fish movement control. However, the detailed temporal evolution of the vorticity field during the turning process, captured in our study using the vortex moment theorem, provides a more nuanced understanding of how pressure gradients evolve during rapid maneuvers. By employing this method, we were able to identify new aspects of tail vortex interactions and their impact on force production, offering a more detailed understanding of the hydrodynamic mechanisms at play during different swimming modes. Furthermore, the study by Eaton et al. [55] on the C-start of goldfish provides valuable insights into the dynamics of rapid turning maneuvers. They found that the C-start consists of two stages, namely a body-rotation phase (15–40 ms) and an axial acceleration phase, resulting in a turning trajectory ranging from 15° to 135°. This indicates that the C-start is not a fixed pattern but is controlled by independent circuits, including those not involving M-cells, which influence the initial turning angle and, thus, the escape trajectory.

4.3. Dynamic Characteristics of the Tail of Juvenile Fish under Different States

Building upon the vorticity analysis, a comparative hydrodynamic analysis of the three swimming states was conducted. The findings indicate that forward swimming is more suitable for sustained locomotion over extended periods for fish, while C-shaped turning is utilized for escape maneuvers. Burst-and-coast swimming, on the other hand, is associated with predatory behaviors. Furthermore, it was observed that the vorticity surrounding the juvenile fish’s tail fin is the primary source of the forces generated by the fish, with the forces produced by positive vorticity being greater than those by negative vorticity. Tytell [8] has also discovered that the magnitude of vorticity around a fish’s body is positively correlated with the propulsive force, where a larger vorticity corresponds to greater forces. This correlation is consistent with the present study’s findings and underscores the importance of body length in swimming dynamics. Zhang et al. [19] further observed that the force generated by body undulations increases with body length, with an average increase of 4 mN/cm for linear swimming and 12 mN/cm for turning maneuvers per unit of body length. These results highlight the significance of body length in force generation across different swimming modes and the implications for hydrodynamic efficiency. Our study extends these findings by focusing on the unique swimming characteristics of juvenile goldfish, a developmental stage that has received limited attention in previous research.
Additionally, this study systematically analyzes the tail’s role in multiple swimming modes using the vortex moment theorem, offering a more precise and holistic understanding of the transition between different swimming states. This comprehensive approach fills a critical gap in the literature by examining how tail dynamics adapt to different behaviors and swimming demands, providing insights that can inform the design of bio-inspired robotic systems. The enhanced understanding of the hydrodynamic efficiency of tail movements across different swimming modes can directly contribute to advancements in biomimetic technology, particularly in the development of robotic fish with improved propulsion systems.

5. Conclusions and Future Work

Based on the comprehensive analysis conducted, it is evident that the dynamic characteristics of the tail of a juvenile fish exhibit significant differences across various swimming states. Forward swimming is most conducive for sustained locomotion, while C-shaped turning enables effective evasion maneuvers. Conversely, burst-and-coast swimming patterns are typically associated with predatory behaviors. Notably, the vorticity surrounding the fish’s tail fin is the primary driver of the forces generated during swimming. This finding aligns with previous research, confirming that the vorticity magnitude positively correlates with the propulsive force. Therefore, the tail fin of juvenile fish plays a crucial role in determining swimming efficiency and performance across diverse behavioral contexts.
Our findings reveal that the tail beat motion of juvenile fish generates a series of vortices that the fish can exploit to enhance their forward movement. These self-generated eddies significantly influence the flow dynamics around the fish’s body, impacting thrust production and efficiency. The utilization of these eddies by the fish for locomotion highlights the complexity of their hydrodynamic interactions with their environment. The dynamic interplay between the fish’s body and the surrounding fluid introduces complexities that may affect the accuracy and interpretation of the PIV data. Future studies should aim to control and replicate these flow conditions more effectively to minimize their impact on the results. Additionally, the development of computational fluid dynamics (CFD) models can provide a valuable tool for simulating and predicting the effects of different flow conditions on fish locomotion, further enhancing our understanding of this complex phenomenon. Doi [56] obtained the swimming efficiencies of parallel swimming fish using CFD methods and conducted comparative analyses of swimming efficiencies at different adjacent distances. Cui [57] utilized CFD to analyze the impact of the waveform on the swimming efficiency and speed of carangiform fish, identifying an optimal traveling index for maximal performance. However, despite the advancements made, the application of CFD in fish locomotion research remains underexplored, particularly in juvenile fish and during the transitions between complex swimming modes, such as burst and coast or turning. Further CFD studies should be encouraged to capture the intricate variations in the flow fields and the pressure distribution around the fish’s body in these dynamic states, as well as to explore the effects of morphological changes, body flexibility, and different aquatic environments on fish swimming performance.
Swimming locomotion in fish not only encompasses the external mechanical characteristics of the body. It is also intricately linked to the internal neurological lateral line system and muscle tissues. Future research should integrate aspects of fish ethology, biomechanics, and physiology to comprehensively elucidate the essence of fish swimming. This understanding can provide valuable insights for the design of low-energy, high-efficiency underwater biomimetic robots and have a positive impact on the conservation of fish species. Additionally, the insights gained from this study can have practical implications for the design of fishways, which are structures built to enable fish to pass over or around barriers such as dams. Effective fishway design is critical for the conservation of fish species by providing a means for upstream migration, spawning, and the maintenance of genetic diversity.

Author Contributions

Conceptualization, Y.Z., D.J., and B.L.; methodology, X.K.; software, Y.Z., and D.J.; formal analysis, Y.Z. and X.H.; investigation, X.K., Y.Z., and X.H.; Resources, D.J., X.H., and X.C.; data curation, Y.Z.; writing—original draft preparation, X.H. and B.L.; writing—review and editing, Y.Z., X.C., and X.H.; visualization, Y.Z. and D.J. All authors have read and agreed to the published version of the manuscript.

Funding

This research was funded by the National Key Research and Development Program of China, grant number 2023YFD2401302, and the National Natural Science Foundation of China, grant number XTCX-KJ-2023-17.

Institutional Review Board Statement

The research presented in this manuscript has been conducted in accordance with the ethical standards and guidelines established by the Institutional Committee for Ethical Review of Shanghai Ocean University. (approval code: SHOU-DW-2024-104).

Informed Consent Statement

Not applicable.

Data Availability Statement

The data that support the findings of this study are available from the corresponding author upon reasonable request.

Acknowledgments

We thank the College of Marine Living Resource Sciences and Management of Shanghai Ocean University for their support of this study.

Conflicts of Interest

The authors declare no conflicts of interest. The funders had no role in the design of the study; in the collection, analyses, or interpretation of data; in the writing of the manuscript; or in the decision to publish the results.

References

  1. Deen, N.G.; Westerweel, J.; Delnoij, E. Two-Phase PIV in Bubbly Flows: Status and Trends. Chem. Eng. Technol. 2002, 25, 97–101. [Google Scholar] [CrossRef]
  2. Raffel, M.; Willert, C.; Kompenhans, J. Particle Image Velocimetry: A Practical Guide; Springer: Cham, Switzerland, 1998. [Google Scholar]
  3. Nauen, J.C.; Lauder, G.V. Quantification of the wake of rainbow trout (Oncorhynchus mykiss) using three-dimensional stereoscopic digital particle image velocimetry. J. Exp. Biol. 2002, 205, 3271–3279. [Google Scholar] [CrossRef] [PubMed]
  4. Weihs, D. A Hydrodynamical Analysis of Fish Turning Manoeuvres. Proc. R. Soc. B Biol. Sci. 1972, 182, 59–72. [Google Scholar]
  5. Wolfgang, M.J.; Anderson, J.M.; Grosenbaugh, M.A.; Yue, D.K.P.; Triantafyllou, M.S. Near-body flow dynamics in swimming fish. J. Exp. Biol. 1999, 202, 2303–2327. [Google Scholar] [CrossRef] [PubMed]
  6. Triantafyllou, M.S.; Triantafyllou, G.S.; Yue, D.K.P. Hydrodynamics of Fishlike Swimming. Annu. Rev. Fluid. Mech. 2000, 32, 33–53. [Google Scholar] [CrossRef]
  7. Lauder, G.; Lim, J.; Shelton, R.; Witt, C.; Anderson, E.; Tangorra, J. Robotic Models for Studying Undulatory Locomotion in Fishes. Mar. Technol. Soc. J. 2011, 45, 41–55. [Google Scholar] [CrossRef]
  8. Dickinson, M.H. Unsteady Mechanisms of Force Generation in Aquatic and Aerial Locomotion1. Am. Zool. 2015, 36, 537–554. [Google Scholar] [CrossRef]
  9. Piskur, P. Side Fins Performance in Biomimetic Unmanned Underwater Vehicle. Energies 2022, 15, 5783. [Google Scholar] [CrossRef]
  10. Tytell, E.D.; Lauder, G.V. The hydrodynamics of eel swimming: I. Wake structure. J. Exp. Biol. 2004, 207, 1825–1841. [Google Scholar] [CrossRef]
  11. Mwaffo, V.; Zhang, P.; Romero Cruz, S.; Porfiri, M. Zebrafish swimming in the flow: A particle image velocimetry study. PeerJ 2017, 5, e4041. [Google Scholar] [CrossRef]
  12. Lauder, G.V. Function of the Caudal Fin During Locomotion in Fishes: Kinematics, Flow Visualization, and Evolutionary Patterns1. Am. Zool. 2015, 40, 101–122. [Google Scholar] [CrossRef]
  13. Nauen, J.; Lauder, G. Hydrodynamics of caudal fin locomotion by chub mackerel, Scomber japonicus (Scombridae). J. Exp. Biol. 2002, 205, 1709–1724. [Google Scholar] [CrossRef] [PubMed]
  14. Tytell, E.D.; Lauder, G.V. Hydrodynamics of the escape response in bluegill sunfish, Lepomis macrochirus. J. Exp. Biol. 2008, 211, 3359–3369. [Google Scholar] [CrossRef] [PubMed]
  15. Lao, Y.J. Research on Flow Field Characteristics of Oscillating Caudal Finbased on DPIV Technology. Master’s Thesis, Jiangsu University of Science and Technology, Zhenjiang, China, 2009. [Google Scholar]
  16. Jing, J.; Li, S.; Lu, Y.X.; Yi, X.Z. The kinematic analysis of C-start in crucian carp (Carassius auratus). J. Exp. Mech. 2004, 19, 276–282. [Google Scholar]
  17. Wu, Y.F.; Jia, L.B.; Yi, X.Z. The kinematic analysis of S-start of Zebra danio (Danio rerio). J. Exp. Mech. 2007, 22, 519–526. [Google Scholar]
  18. Yu, Y.J.; Hu, X.; Shi, X.T.; Zhang, Y.N. Analysis on the pressure field characteristics of Schizopygopsis younghusbandi Regan tail swinging based on PIV. J. Exp. Mech. 2019, 34, 289–300. [Google Scholar]
  19. Zhang, Y.N.; Hu, X.; Yu, Y.J.; Hong, L. Study on mechanical characteristics of grass carp juveniles based on vortocity method. J. Exp. Mech. 2020, 35, 915–924. [Google Scholar]
  20. Chen, H.; Lan, C.A.; Yi, X.Z.; Xing, X.Z. Dynamic analysis on c-start swimming of fish-like robot. J. Harbin Ins. Techno. 2009, 41, 113–117. [Google Scholar]
  21. Hanke, W.; Bleckmann, H. The hydrodynamic trails of Lepomis gibbosus (Centrarchidae), Colomesus psittacus (Tetraodontidae) and Thysochromis ansorgii (Cichlidae) investigated with scanning particle image velocimetry. J. Exp. Biol. 2004, 207, 1585–1596. [Google Scholar] [CrossRef]
  22. Wieskotten, S.; Dehnhardt, G.; Mauck, B.; Miersch, L.; Hanke, W. Hydrodynamic determination of the moving direction of an artificial fin by a harbour seal (Phoca vitulina). J. Exp. Biol. 2010, 213, 2194–2200. [Google Scholar] [CrossRef]
  23. Shi, X.; Jin, Z.; Liu, Y.; Hu, X.; Tan, J.; Chen, Q.; Huang, Y.; Liu, D.; Wang, Y.; Gu, X. Can age-0 Silver Carp cross laboratory waterfalls by leaping? Limnologica 2018, 69, 67–71. [Google Scholar] [CrossRef]
  24. Kong, W.B. Application and Development of PlV. Shandong Chem. Ind. 2019, 48, 115+119. [Google Scholar] [CrossRef]
  25. Dring, R.P. Sizing Criteria for Laser Anemometry Particles. J. Fluids Eng. 1982, 104, 15–17. [Google Scholar] [CrossRef]
  26. Zhang, B.; Hu, X.; Yang, G.D.; Long, Z.Y.; Huang, H.L.; Shi, X.T. Hydrodynamics of juvenile grass carp (Ctenopharyngodon idellus) in steady swimming based on pressure field. J. Hydro Eng. 2021, 40, 79–88. [Google Scholar]
  27. Lucas, K.N.; Dabiri, J.O.; Lauder, G.V. A pressure-based force and torque prediction technique for the study of fish-like swimming. PLoS ONE 2017, 12, e0189225. [Google Scholar] [CrossRef]
  28. Thielicke, W.; Stamhuis, E.J. PIVlab—Towards User-friendly, Affordable and Accurate Digital Particle Image Velocimetry in MATLAB. J. Open Res. Softw. 2014, 2, 30. [Google Scholar] [CrossRef]
  29. Bastiaans, R.J.M. Cross-Correlation PIV: Theory, Implementation, and Accuracy. J. Vis. 1993, 6, 239–250. [Google Scholar]
  30. Cameron, S.M. PIV algorithms for open-channel turbulence research: Accuracy, resolution and limitations. J. Hydro-Environ. Res. 2011, 5, 247–262. [Google Scholar] [CrossRef]
  31. Noca, F.; Shiels, D.; Jeon, D. A Comparison of Methods for Evaluating Time-Dependent Fluid Dynamic Forces on Bodies, Using Only Velocity Fields and Their Derivatives. J. Fluid. Struct. 1999, 13, 551–578. [Google Scholar] [CrossRef]
  32. Cao, X.; Liu, J.; Jiang, N.; Chen, Q. Particle image velocimetry measurement of indoor airflow field: A review of the technologies and applications. Energy Build. 2014, 69, 367–380. [Google Scholar] [CrossRef]
  33. Scharnowski, S.; Kähler, C.J. Particle image velocimetry—Classical operating rules from today’s perspective. Opt. Lasers Eng. 2020, 135, 106185. [Google Scholar] [CrossRef]
  34. Scarano, F.; Riethmuller, M.L. Iterative multigrid approach in PIV image processing with discrete window offset. Exp. Fluids 1999, 26, 513–523. [Google Scholar] [CrossRef]
  35. Sfakiotakis, M.; Lane, D.M.; Davies, J.B.C. Review of fish swimming modes for aquatic locomotion. IEEE J. Oceanic Eng. 1999, 24, 237–252. [Google Scholar] [CrossRef]
  36. Lindsey, C.C. 1—Form, Function, and Locomotory Habits in Fish. In Fish Physiology; Hoar, W.S., Randall, D.J., Eds.; Academic Press: Cambridge, MA, USA, 1978; Volume 7, pp. 1–100. [Google Scholar]
  37. Dabiri, J.O.; Colin, S.P.; Katija, K.; Costello, J.H. A wake-based correlate of swimming performance and foraging behavior in seven co-occurring jellyfish species. J. Exp. Biol. 2010, 213, 1217–1225. [Google Scholar] [CrossRef] [PubMed]
  38. Yang, G.D.; Hu, X.; Zhang, B.; Long, Z.Y.; Zhang, Y.N.; Shi, X.T. Analysis of hydrodynamic characteristics of grass carpCtenopharyngodonidellus juveniles under free-swimming status basedon Particle lmage Velocimetry (PlV). J. Dalian. Ocean. Univ. 2021, 36, 833–841. [Google Scholar] [CrossRef]
  39. Fox, R.W.; Mcdonald, A.T.; Pritchard, P.J. Fox and McDonald’s Introduction to Fluid Mechanics; John Wiley & Sons: Hoboken, NJ, USA, 2011. [Google Scholar]
  40. Fontaine, E.; Lentink, D.; Kranenbarg, S.; Müller, U.K.; van Leeuwen, J.L.; Barr, A.H.; Burdick, J.W. Automated visual tracking for studying the ontogeny of zebrafish swimming. J. Exp. Biol. 2008, 211, 1305–1316. [Google Scholar] [CrossRef]
  41. Akanyeti, O.; Liao, J.C. A kinematic model of Kármán gaiting in rainbow trout. J. Exp. Biol. 2013, 216, 4666–4677. [Google Scholar] [CrossRef]
  42. Thandiackal, R.; Lauder, G.V. How zebrafish turn: Analysis of pressure force dynamics and mechanical work. J. Exp. Biol. 2020, 223, jeb223230. [Google Scholar] [CrossRef]
  43. Hawkins, O.H.; Ortega-Jiménez, V.M.; Sanford, C.P. Knifefish turning control and hydrodynamics during forward swimming. J. Exp. Biol. 2022, 225, jeb243498. [Google Scholar] [CrossRef]
  44. Liao, J.; Lauder, G.V. Function of The Heterocercal Tail In White Sturgeon: Flow Visualization During Steady Swimming And Vertical Maneuvering. J. Exp. Biol. 2000, 203, 3585–3594. [Google Scholar] [CrossRef]
  45. Drucker, E.G.; Lauder, G.V. Wake Dynamics and Fluid Forces of Turning Maneuvers in Sunfish. J. Exp. Biol. 2001, 204, 431–442. [Google Scholar] [CrossRef] [PubMed]
  46. Videler, J.J.; Müller, U.K.; Stamhuis, E.J. Aquatic vertebrate locomotion: Wakes from body waves. J. Exp. Biol. 1999, 202, 3423–3430. [Google Scholar] [CrossRef] [PubMed]
  47. Akanyeti, O.; Putney, J.; Yanagitsuru, Y.R.; Lauder, G.V.; Stewart, W.J.; Liao, J.C. Accelerating fishes increase propulsive efficiency by modulating vortex ring geometry. Proc. Natl. Acad. Sci. USA 2017, 114, 13828–13833. [Google Scholar] [CrossRef] [PubMed]
  48. Drucker, E.G.; Lauder, G.V. Experimental Hydrodynamics of Fish Locomotion: Functional Insights from Wake Visualization. Integr. Comp. Biol. 2002, 42, 243–257. [Google Scholar] [CrossRef] [PubMed]
  49. Tytell, E.D.; Hsu, C.-Y.; Williams, T.L.; Cohen, A.H.; Fauci, L.J. Interactions between internal forces, body stiffness, and fluid environment in a neuromechanical model of lamprey swimming. Proc. Natl. Acad. Sci. USA 2010, 107, 19832–19837. [Google Scholar] [CrossRef] [PubMed]
  50. Videler, J.J.; Hess, F. Fast Continuous Swimming of Two Pelagic Predators, Saithe (Pollachius Virens) and Mackerel (Scomber Scombrus): A Kinematic Analysis. J. Exp. Biol. 1984, 109, 209–228. [Google Scholar] [CrossRef]
  51. Yu, Y.J. Study on the Mechanical Characteristics of Juvenile Grass Carp Tail Swinging Based-on Particle Image Velocimetry Techology. Master’s Thesis, China Three Gorges University, Yichang, China, 2019. [Google Scholar]
  52. Yang, Y. Flow Physics of Freely Routine Swimming of Koi carp. Ph.D. Thesis, University of Science and Technology of China, Anhui, China, 2008. [Google Scholar]
  53. Hanke, W.; Brücker, C.; Bleckmann, H. The Ageing of the Low-Frequency Water Disturbances Caused by Swimming Goldfish and Its Possible Relevance to Prey Detection. J. Exp. Biol. 2000, 203, 1193–1200. [Google Scholar] [CrossRef]
  54. Zhang, R.Z.; Zhu, L.; Luo, X.W. Investigation of the Flow Around a C-start Swimming Goldfish Using PlV. J. Eng. Thermophys. 2019, 40, 2567–2573. [Google Scholar]
  55. Eaton, R.C.; DiDomenico, R.; Nissanov, J. Flexible body dynamics of the goldfish C-start: Implications for reticulospinal command mechanisms. J. Neurosci. Off. J. Soc. Neurosci. 1988, 8, 2758–2768. [Google Scholar] [CrossRef]
  56. Doi, K.; Takagi, T.; Mitsunaga, Y.; Torisawa, S. Hydrodynamical effect of parallelly swimming fish using computational fluid dynamics method. PLoS ONE 2021, 16, e0250837. [Google Scholar] [CrossRef]
  57. Cui, Z.; Gu, X.; Li, K.; Jiang, H. CFD Studies of the Effects of Waveform on Swimming Performance of Carangiform Fish. Appl. Sci. 2017, 7, 149. [Google Scholar] [CrossRef]
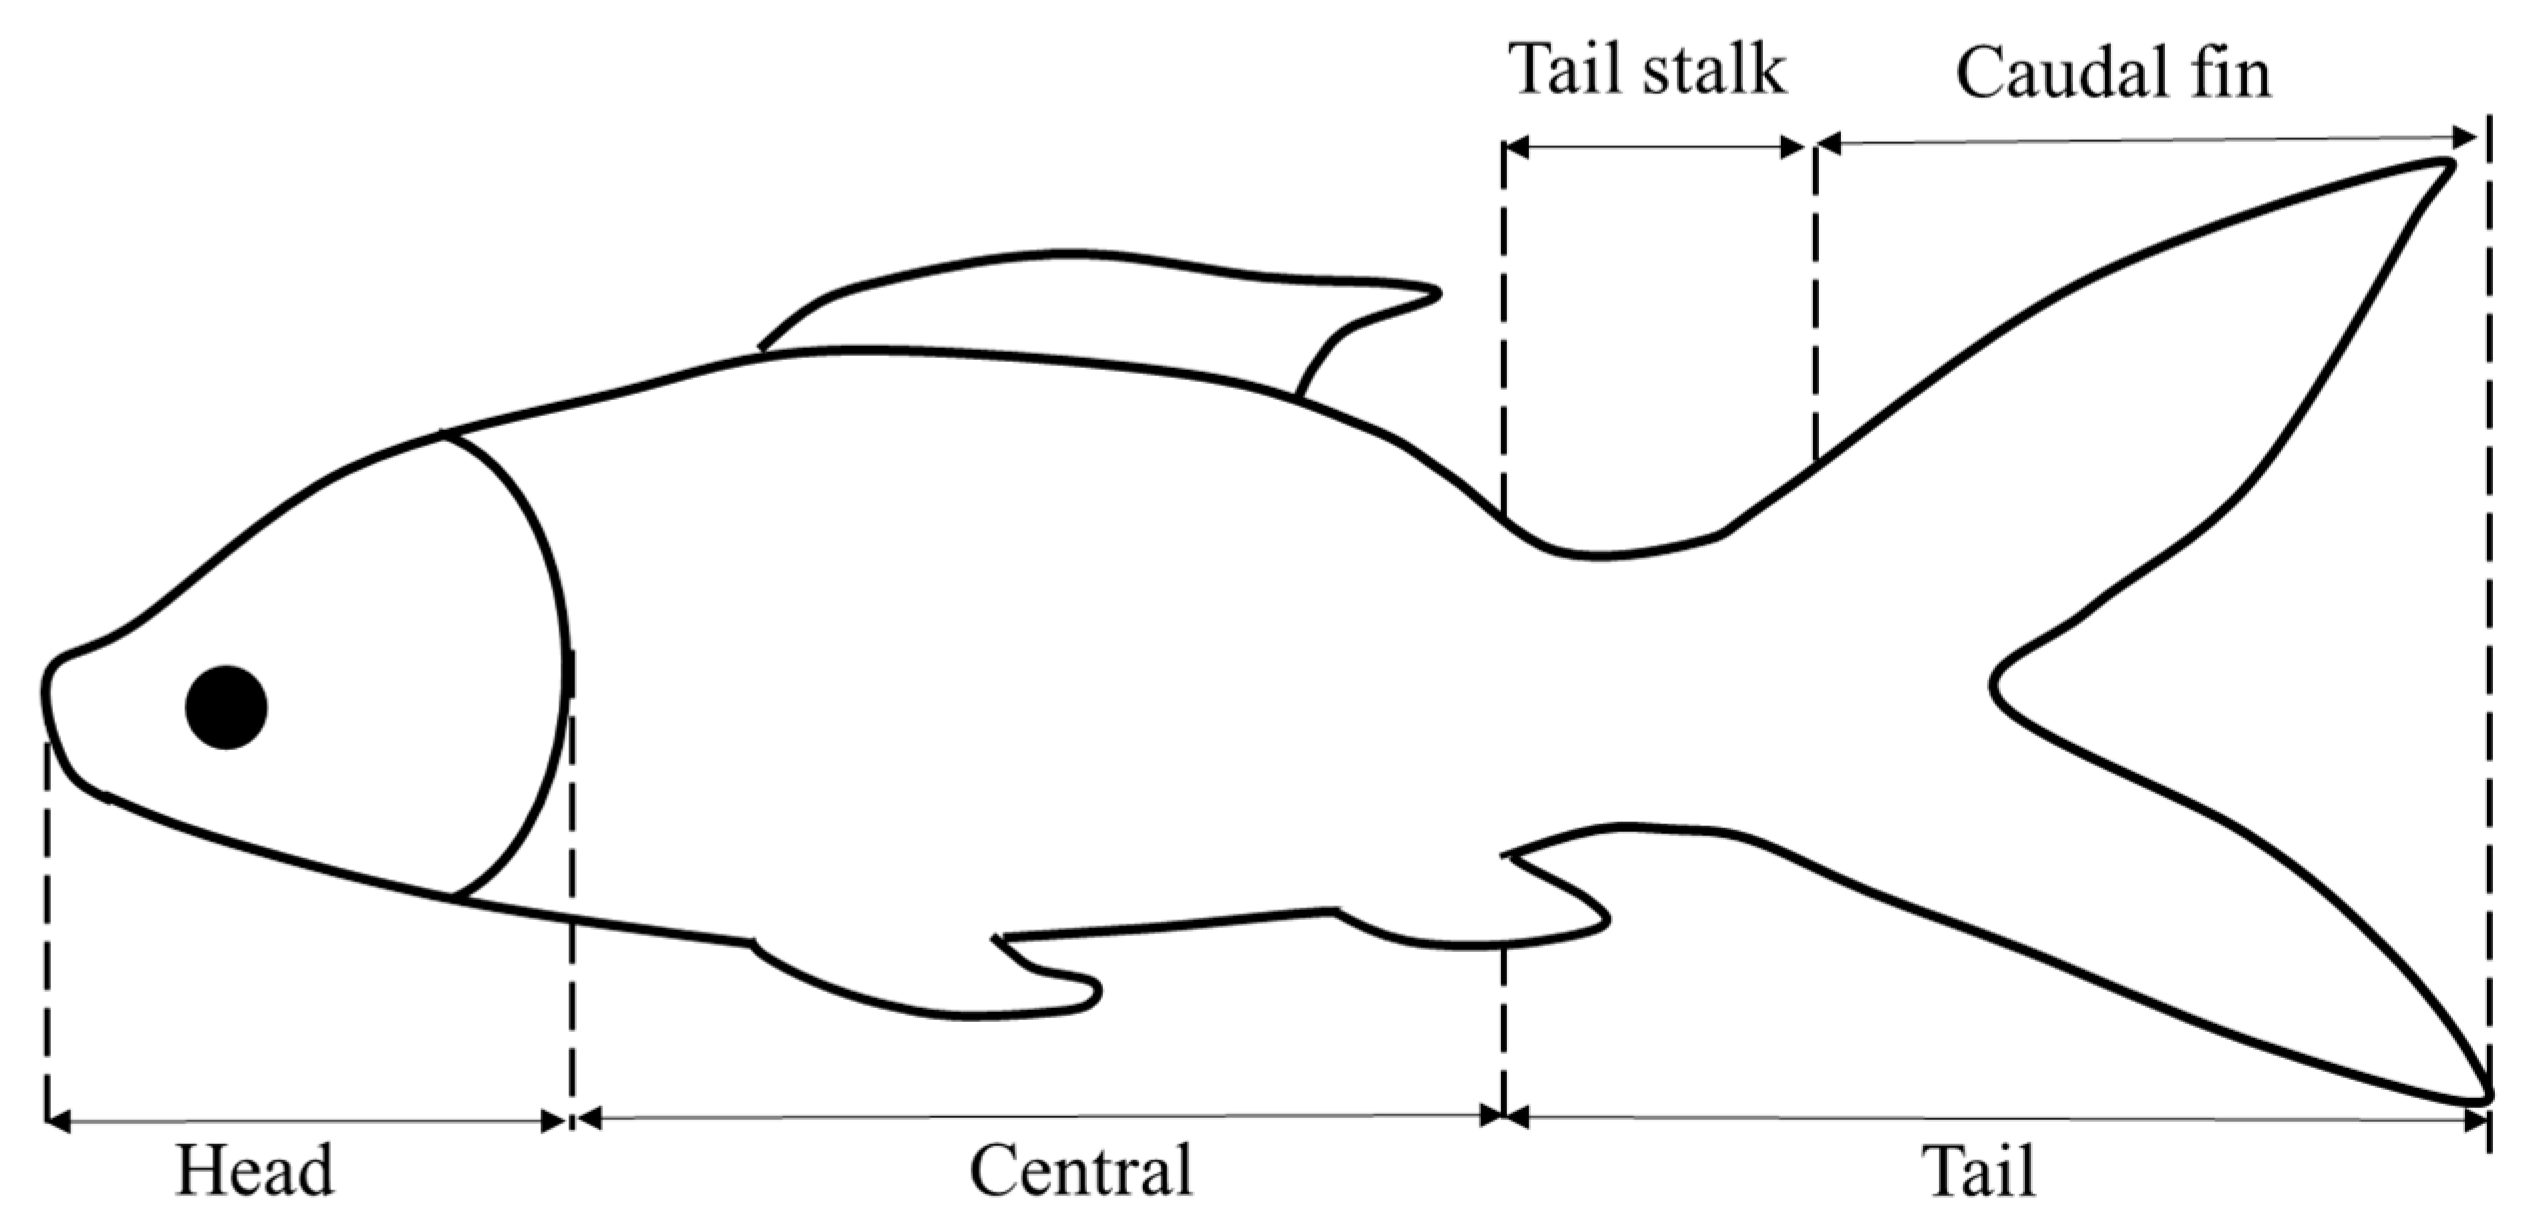
Figure 1. Fish body part division.
Fishes 09 00365 g001
Figure 2. Flow-field test PIV system. The green area in the image indicates the laser plane light source.
Fishes 09 00365 g002
Figure 3. Grid division on the swimming plane of goldfish.
Fishes 09 00365 g003
Figure 4. Fish body stress diagram. (The red dashed line represents the midline of the fish body).
Fishes 09 00365 g004
Figure 5. Fish turning angle and curvature. (A) Fish turning angle; (B) fish curvature coefficient.
Fishes 09 00365 g005
Figure 6. Sequence diagram of the forward movement state of a goldfish over one cycle.
Fishes 09 00365 g006
Figure 7. Sequence diagram of a goldfish’s turning movement over one cycle.
Fishes 09 00365 g007
Figure 8. Sequence diagram of a goldfish’s burst-and-coast over one cycle.
Fishes 09 00365 g008
Figure 9. Vorticity field of juvenile goldfish swimming in a straight line. The arrow in the picture represents the velocity vector.
Fishes 09 00365 g009
Figure 10. Vorticity field during turning swimming in juvenile goldfish. The arrow in the picture represents the velocity vector.
Fishes 09 00365 g010
Figure 11. Vorticity field of juvenile goldfish swimming with burst and coast (annotated at t = 180 ms to indicate the schematic of the jet stream.). The arrow in the picture represents the velocity vector.
Fishes 09 00365 g011
Figure 12. Time sequence diagram of the magnitude of forces acting on juvenile goldfish swimming in a straight line.
Fishes 09 00365 g012
Figure 13. Time sequence diagram of the magnitude of forces acting on juvenile goldfish swimming in a turning state.
Fishes 09 00365 g013
Figure 14. Time sequence diagram of the magnitude of forces acting on juvenile goldfish in the burst-and-coast state.
Fishes 09 00365 g014
Disclaimer/Publisher’s Note: The statements, opinions and data contained in all publications are solely those of the individual author(s) and contributor(s) and not of MDPI and/or the editor(s). MDPI and/or the editor(s) disclaim responsibility for any injury to people or property resulting from any ideas, methods, instructions or products referred to in the content.