Article

Carbon Deposition on Hematite (α-Fe2O3) Nanocubes by Annealing in the Air: Morphology Study with Grazing Incidence Small Angle X-ray Scattering (GISAXS)

Canadian Light Source, 44 Innovation Boulevard, Saskatoon, SK S7N 2V3, Canada
Condens. Matter 2020, 5(3), 54; https://doi.org/10.3390/condmat5030054
Submission received: 20 August 2020 / Revised: 10 September 2020 / Accepted: 16 September 2020 / Published: 17 September 2020

Abstract

:
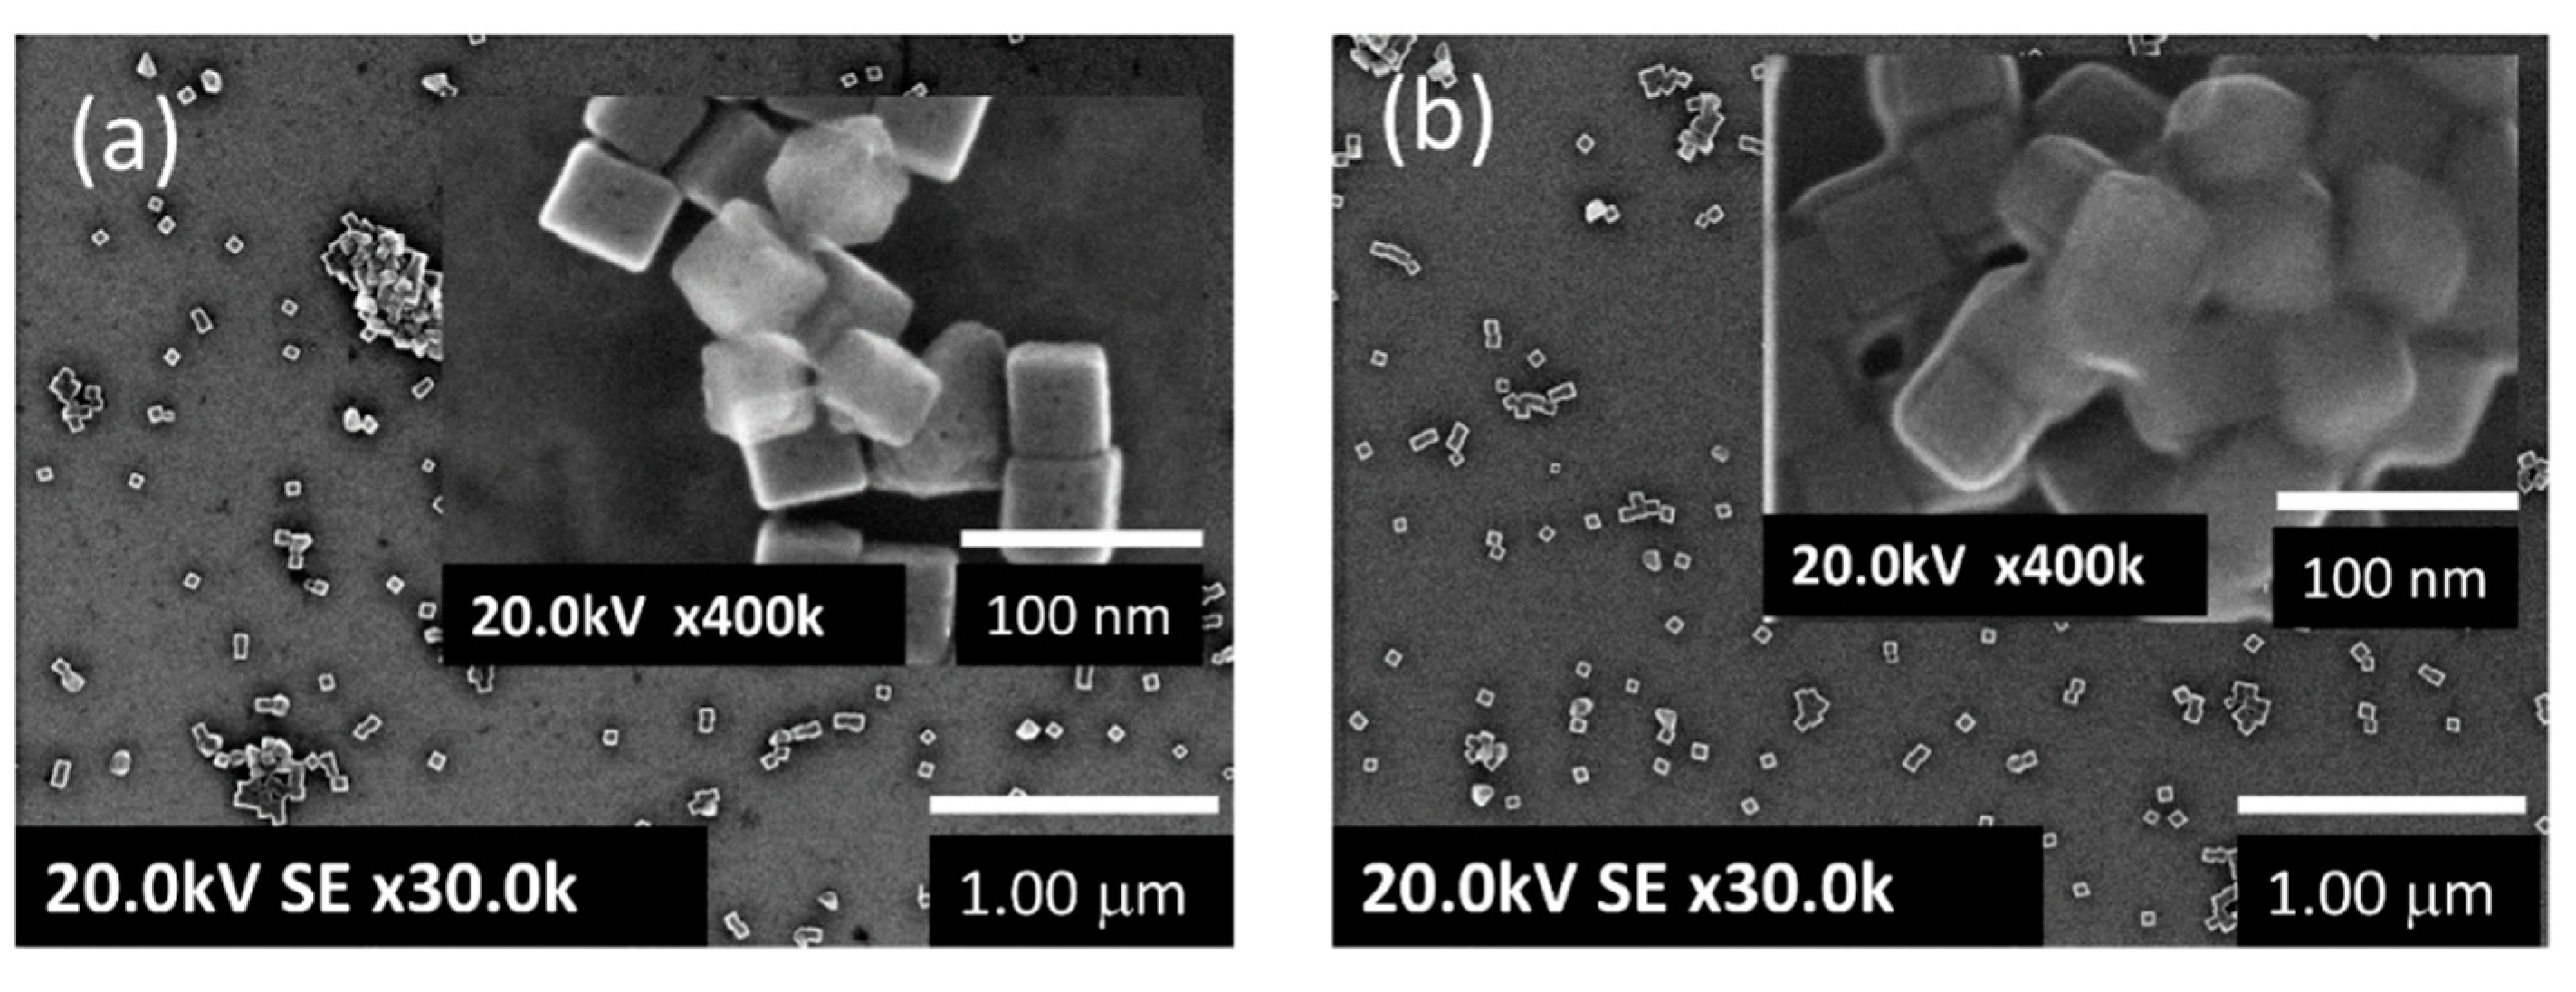
GISAXS has been used to study morphology change of α-Fe2O3 nanocubes after annealing processes. A submonolayer of the nanocubes was deposited on a Si(100) substrate. While an annealing at 400 °C in vacuum does not change a GISAXS pattern from as-prepared nanocubes submonolayer, subsequent annealing in air at the same temperature altered the GISAXS pattern significantly. SEM images showed that the air-annealed nanocubes were coated with thin layers which were identified as amorphous carbon layers based on Raman measurements. GISAXS simulations from morphologies of nanocube with 38 nm side-length and core-shell (nanocube-core and 7 nm thick carbon-shell) reproduced measured patterns from the vacuum- and the air-annealed nanocubes, respectively. The current study provides new approach for in-situ characterization of carbon deposition on a uniform shape nanoparticle through monitoring of deposited carbon thickness.

1. Introduction

Hematite (α-Fe2O3) is a strong candidate for photocatalytic applications because its band gap (2.1 eV) can give the maximum theoretical solar-to-hydrogen efficiency of ~15% and is corrosion-resistance to harsh oxidation conditions [1,2]. For photocatalytic applications good crystalline nanoparticles with sizes of a few tens of nanometers are preferred because light absorption and formation of a depletion layer require a thick hematite material [3]. For practical applications an as-prepared catalyst in a nanoparticle form undergoes thermal treatments for crystallization, structural transform and activation. Often the thermal treatment introduces morphology changes or agglomeration of nanoparticles and subsequently affects the catalysts’ performance. However, preserving the nanostructure could be essential to maintain a certain activity [4].
Numerous monodispersive uniform-shape hematite nanoparticles have been synthesized [5,6,7,8,9,10,11,12,13,14]. Monodispersive and uniform-shape nanoparticles provide a unique opportunity to study morphology changes of the nanoparticles during a chemical reaction. Subtle structural changes of these nanoparticles could be detected relatively easily because shape and size of nanoparticles prior to any reaction are well defined. Especially a pseudo-cubic hematite nanoparticle (hereafter called as nanocube) is enclosed by six crystallographically equivalent {01 1 ¯ 2} faces [15].
The performance of hematite in practical photocatalytic applications, for example contaminant removal [16], photo-Fenton reactions [17] and water oxidation [1], is far from the theoretical prediction [2]. Numerous limiting factors have been identified, for example poor conductivity [18], short hole diffusion length [19] and the existence of surface trap states [20]. Especially a passivation of the surface trap state through a surface layer coating enhanced photocatalytic performance [21,22]. There is a report that carbon coating of hematite nanoparticle also resulted in about a fourfold increase of photocurrent compared to that of bare hematite without carbon coating [23]. Similar carbon coatings were achieved by pyrolysis of dopamine [24], hydrothermal synthesis with dimethyl diallylammonium chloride additive [25], carbonization of the n-butane (fire treatment) [26]. However, the current study shows that it is possible to coat carbon on the hematite nanocube by annealing in air without using any agent at all.
It would be very useful to correlate the catalytic performance to the thickness of coated carbon on a specific crystallographic facet of a hematite nanoparticle. Grazing incidence X-ray small angle scattering (GISAXS) measurement has been a powerful tool to characterize the morphology and spatial distribution of nanoparticles deposited on a substrate [27,28]. If the effect from the spatial distribution is negligible, GISAXS intensities are proportional to the Fourier transform of the density distribution of the deposited nanoparticles. A monolayer film where the substrate is completely covered by nanocubes could have a spatial distribution effect. Thus, a submonolayer film where a large portion of the substrate is uncovered by the nanocube is necessary to neglect the spatial distribution effect. By using a submonolayer film of monodispersive hematite nanocubes we applied the GISAXS technique to characterize the carbon deposition on the {01 1 ¯ 2} faces of the hematite nanocubes by air annealing and its effect to particle morphology.

2. Results and Discussion

In a submonolayer of the nanocubes formed on a substrate, the nanocube would adsorb with its faces, not edge nor vertex, contacting with the substrate. Consequently, the top surfaces of all nanocubes are parallel to the substrate and their in-plane orientations are random [10,15]. GISAXS measurements were taken from submonolayer films of the as-prepared, annealed in vacuum and subsequently annealed in the air samples. GISAXS patterns from the as-prepared and the vacuum annealed films were very similar and GISAXS pattern from vacuum annealed film is shown in Figure 1.
Intensities I ( q ) in GISAXS image can be represented by following equations:
I ( q ) = | F | 2 S ( q )
F ( q ) = ρ ( r ) e x p ( i q · r ) d 3 r
where q , S ( q ) , and F ( q )   are momentum transfer, structure factor, and form factor of individual particle, respectively [27,28]. In the prepared submonolayer film, the distances between nanocubes are large enough so that the structural factor, S ( q ) , describing interference originating from the arrangement of nanocubes can be neglected. Then, GISAXS intensities are proportional to the form factor F ( q ) of a nanocube, which is the Fourier transform of the density distribution of the nanocube. If the density inside the nanocube is uniform, the size of the nanocube determines the GISAXS pattern. The GISAXS intensities were simulated with BornAgain: software for simulating and fitting GISAXS [29]. As shown in Figure 1 the observed pattern matches well with a GISAXS simulation based on the cube shape with average size of 38 nm and size distribution of ±3 nm. First, horizontal and vertical slicings were used to fit the measured intensities to simulation with nanocube size, Gaussian size distribution, incidence X-ray angle and background as fit parameters. Since there was no in-plane orientational alignment of nanocubes, GISAXS simulations obtained from nanocubes rotated with respect to surface normal direction, between −45° and 45°, were averaged for the fit. The best fit parameters were used to simulate GISAXS pattern.
The fit with slicings produced better match than fitting with whole pattern. The strong specular reflection along Y direction at X = 85 mm was not simulated properly, which in turn made it difficult to fit properly the whole pattern. The nanocube size can be estimated from intensity oscillations in vertical or horizontal slicings in Figure 1c,d which have periodicity of about 8 mm. The period divided by sample to detector distance of 2.35 m corresponds to momentum transfer q when it is multiplied by 2π/(X-ray wavelength). By using q = 2π/d the length of an object, d, can be obtained. With X-ray wavelength of 1.3808 Å, d = 1.3808 × 2350/8 = 406 Å = 40.6 nm which is close to the value obtained through the fit.
The GISAXS pattern changed dramatically after subsequent annealing in air (Figure 2). It is worth to note that the nanocubes were annealed in vacuum prior to the air annealing. Thus, any chemicals involved in the nanocube synthesis were removed before the air annealing process. The change in GISAXS pattern indicates modification of shape and/or density distribution.
Numerous nanoparticle morphologies enclosed by (104), (110) and (001) crystallographic faces in addition to the (012) can be formed under various water and oxygen partial pressure during nanoparticle formation [30]. Although there is possibility of morphology change from nanocube to other shape, annealing temperature 400 °C seems too low to induce morphology change. To check actual morphologies of nanocubes after vacuum and air annealing SEM (S5500, Hitachi, Tokyo, Japan) with secondary electron detection was used, as shown in Figure 3. Vacuum annealed nanocubes show clear cubic morphology. The SEM image showed that the air annealed nanocubes were encapsulated by a thin layer of a low-Z material.
The capping layer was identified as an amorphous carbon through Raman measurement as shown in Figure 4. It is well known through CO2 hydrogenation study that carbon deposition on hematite catalyst is a major reaction at a reaction temperature of 400 °C [31]. The sharp strong peak at 520.7 cm−1 and a broad peak in the range of 930–1030 cm−1 are from the silicon substrate [32]. The peak around 2330 cm−1 is from nitrogen molecules in the air [33]. Raman peaks from hematite agree well with literature values [34,35]. The weak and broad peaks around 2610 and 2900 cm−1 are from hematite [35]. The broad peak around 1550 cm−1 is typical G-peak of disordered carbon [36] and D-peak (around 1350 cm−1) might be buried under strong hematite peak at 1310 cm−1 (G and D labels refer graphite and defect/disorder, respectively). As disorder increases the carbon D-peak intensity increases [36] and higher order peaks of D-peak get weaker too. Hence, the absence (or very weak) of the second order bands around 2500–3500 cm−1 indicates that the capping layer is in an amorphous carbon form [37].
Based on the Raman measurement, the GISAXS pattern from the air annealed nanocube was simulated with a core-shell particle shape comprising a hematite nanocube core and a carbon shell. The carbon shell was added as a box shape over the hematite nanocube core. It was reported that reduction of hematite coated with carbon film started above 650 °C [38]. No density change in the hematite core is expected through reduction by deposited carbon with annealing at 400 °C. Hence, the size of the nanocube core was kept the same as that of the vacuum-annealed nanocube during the air annealed GISAXS simulation. The nanocube core might firmly contact the silicon substrate through vacuum annealing but a thin carbon layer can penetrate to the interface between the nanocube and substrate. The carbon layer at the interface might not have uniform thickness. For example, one bottom edge of nanocube has thicker carbon layer than the other edges. This non-even thickness will cause a tilting of core-shell as shown in the left inset in Figure 2c. The tilting of the core-shell structure cannot be handled properly with the BornAgain program. Hence, the tilted and azimuthally averaged core-shell structure was approximated with a truncated sphere shape shown at the right inset in Figure 2c. Although the approximation is crude, the existence of round edges in the truncated sphere reproduced main features of GISAXS pattern from the annealed nanocubes. Simulation of GISAXS without the tilting resulted in a poor match with the measured pattern. Average thickness of carbon shell of 7 nm with size distribution of ±3 nm reproduced the GISAXS pattern relatively well.
As the air annealing was performed after vacuum annealing, carbon deposition through the air annealing indicates that clean hematite nanocube surfaces interact with CO2 in the air and extract carbon as amorphous form. This might be related to Fe vacancies on the nanocube surface and atomically rough surface after vacuum annealing [15]. It would be interesting to extend the current approach to CO2 hydrogenation [39]. Since the average thickness of deposited carbon can be extracted from the GISAXS pattern, it will be possible to perform in-situ measurements to monitor carbon thickness as a function of annealing time/temperature. Post-deposition of carbon over mono-dispersive uniform shape hematite nanoparticles through air annealing could provide an opportunity to study facet-dependent photocatalytic reactions. Morphology changes by reduction of hematite to magnetite through annealing at a high temperature with deposited carbon could be studied with an anomalous GISAXS method [40].
In summary, GISAXS, SEM, and Raman spectroscopy have been used to characterize the morphology changes of hematite nanocubes resulted from vacuum and air annealing. GISAXS measurements indicated that the nanocube morphology with side length of 38 nm was intact after annealing at 400 °C in vacuum. After air-annealing at 400 °C for 30 min nanocubes were coated with thin layers which were identified as amorphous carbon based on Raman measurements. The thickness of carbon layer was determined as 7 nm from GISAXS simulation. Current study can be extended to in-situ characterization of carbon deposition as function of annealing time or temperature through GISAXS measurement.

3. Materials and Methods

3.1. Synthesis α-Fe2O3 Nanocubes

Hematite nanocubes were prepared according to the method described in [6]. Briefly, 0.721 g of Fe(NO3)3·9H2O and 1.071 g of poly(N-vinyl-2-pyrrolidone (PVP, Mw = 29,000) were dissolved in 64.3 mL of N,N-dimethyformamide (DMF), then placed in a Teflon-lined stainless stain autoclave of 125 mL volume. The sealed vessel was put into an oven and heated at 180 °C for 30 h, and then cooled to room temperature naturally. The red precipitates were collected by centrifuging, washing with deionized water four times and drying in air at room temperature. α-Fe2O3 colloids were prepared by suspending this α-Fe2O3 powder in 50 mL anhydrous toluene and ultrasonicating under nitrogen for 1 h.

3.2. Fabrication of Submonolayers of α-Fe2O3 Nanocube

A submonolayer of an α-Fe2O3 nanocube was fabricated following the procedure reported in [10] after slight modification (shown in Figure 5). Silicon substrates with size of 5 mm × 10 mm × 0.5 mm were cleaned by annealing at 700 °C for 3 h under O2 flow and cooled down to room temperature while maintaining the O2 flow. The substrates were then immersed in deionized water at 90 °C for 1 h, rinsed with dilute HCl and H2O, and then blown-dry with N2. The substrates were submerged into a solution of 4 mL hexamethylene diisocyanate (HDI) in 40 mL anhydrous toluene at 60 °C under nitrogen for 24 h and rinsed with anhydrous toluene to remove unbound HDI from surface. Finally the substrates were immerged into the colloids of α-Fe2O3 and heated at 60 °C for 24 h. These substrates were rinsed with methanol and dried under vacuum at 60 °C for 2 h.

3.3. GISAXS Measurements

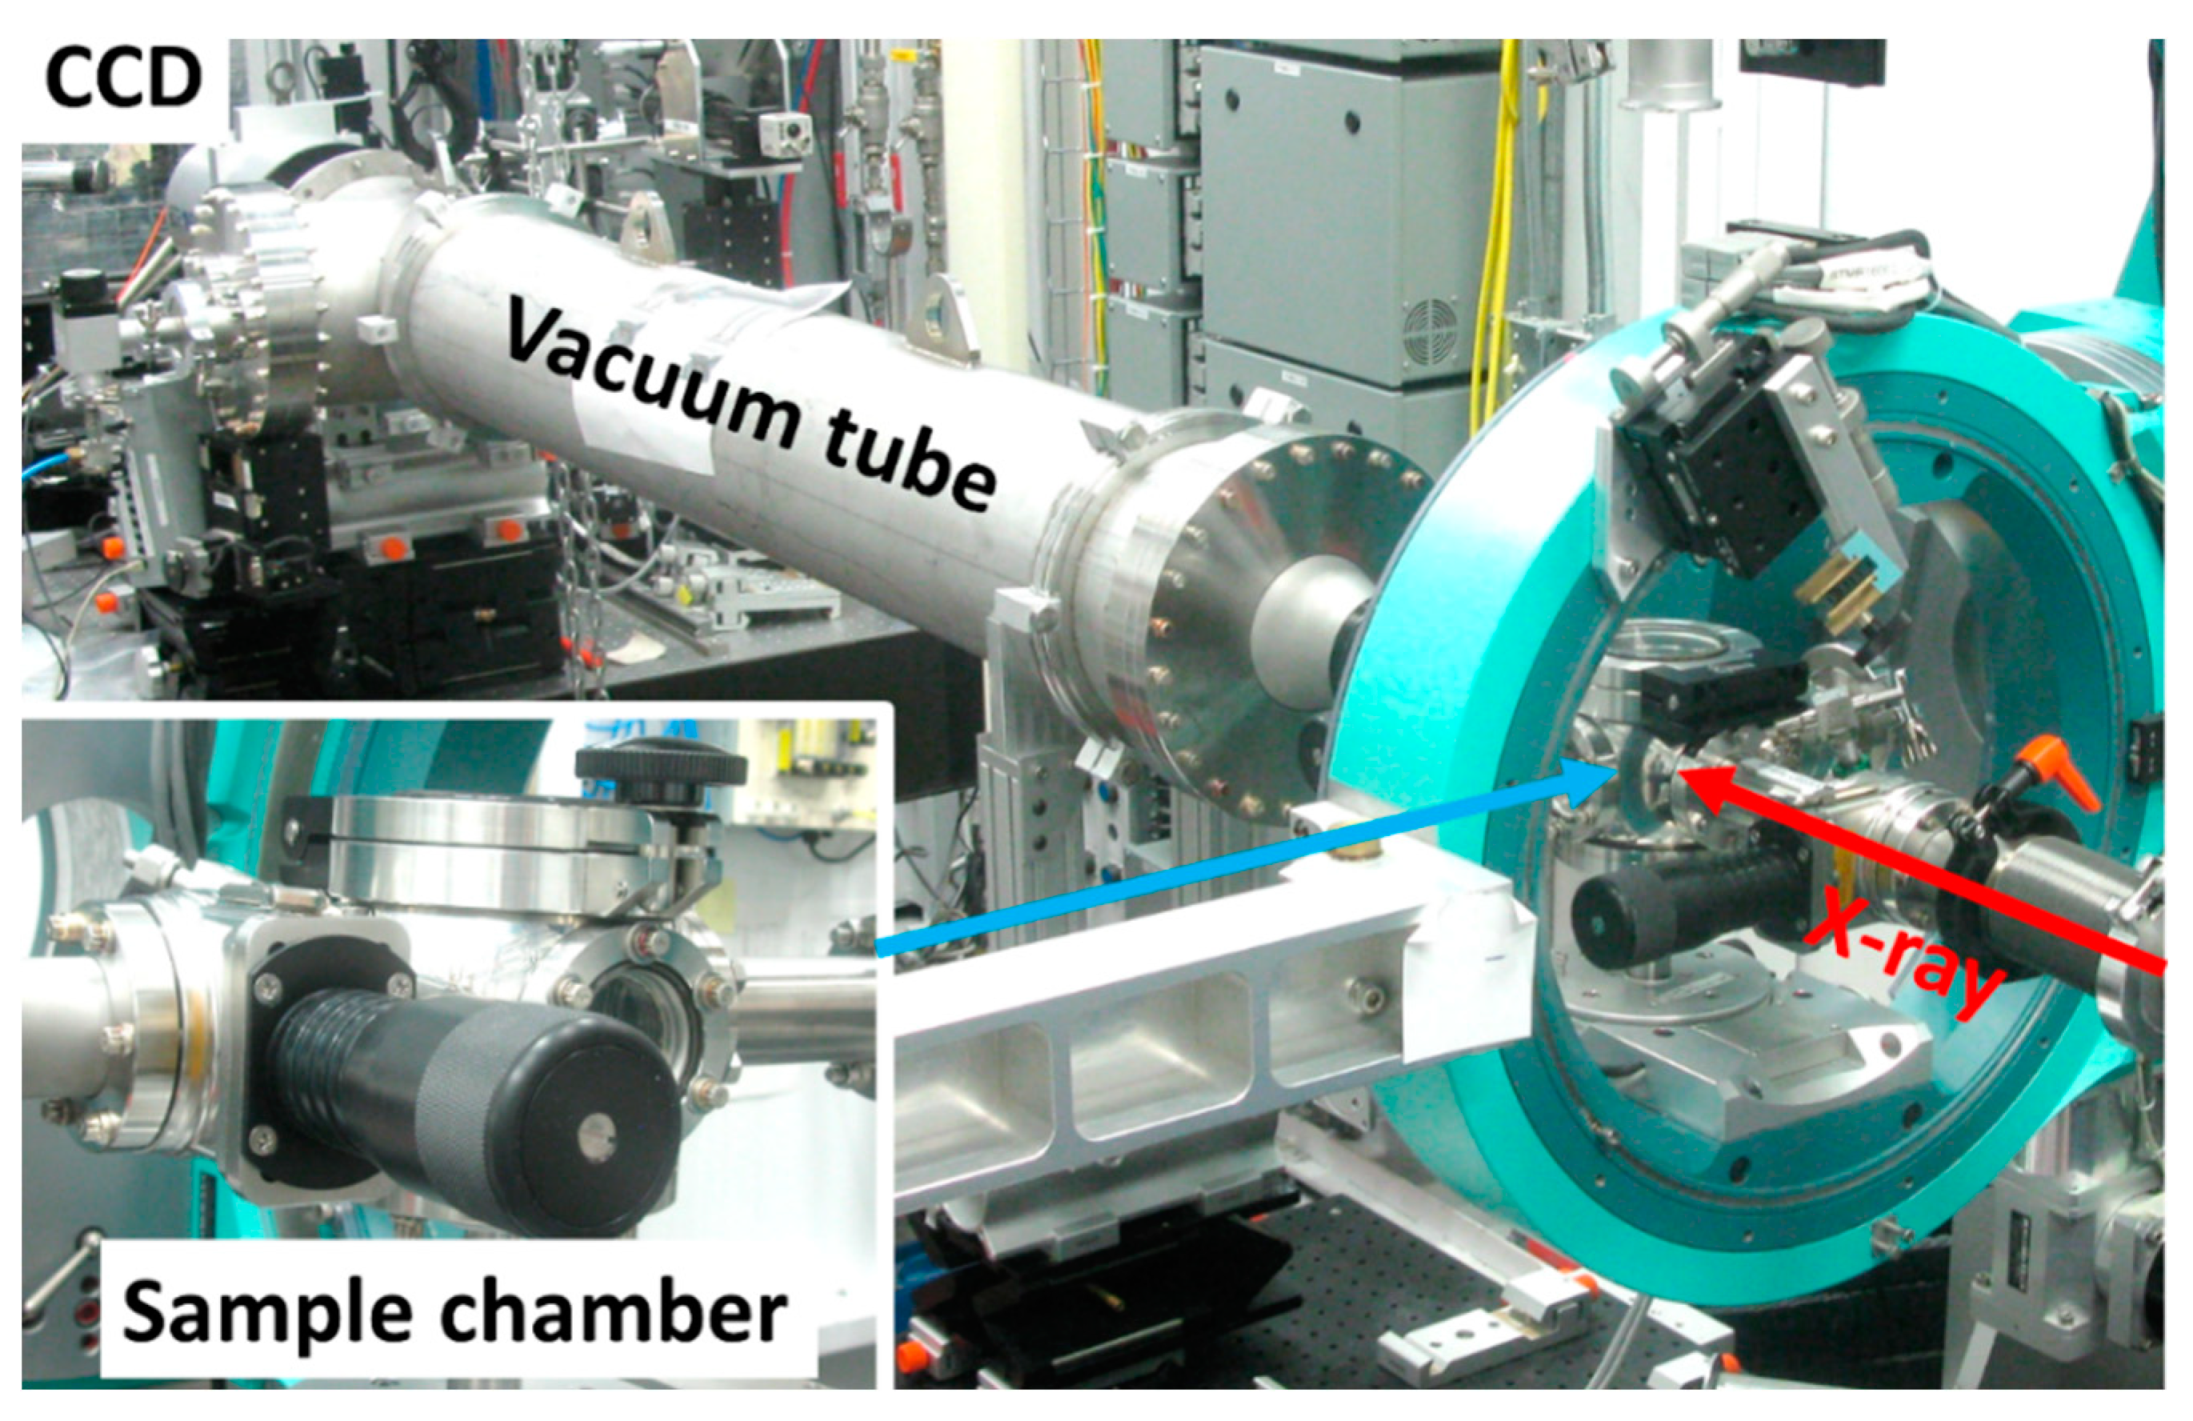
The GISAXS measurements (using the setup shown in Figure 6) were performed at the Hard X-ray MicroAnalysis (HXMA) beamline in the Canadian Light Source. The substrate was mounted inside a small UHV chamber equipped with graphite heater embedded in pyritic boron nitride. Inside of the chamber was pumped to 1 × 10⁻⁶ torr during a vacuum annealing. GISAXS measurements were performed with 8979 eV incident X-ray energy and CCD X-ray detector with 165 mm × 165 mm active areas (SX165, Rayonix, Evanston, IL, USA) was placed 2.35 m downstream from the sample. Direct X-ray hit CCD detector at coordinates of 85.0 mm and 82.3 mm horizontal and vertical directions respectively. Between the sample and CCD detector a vacuum tube connected to the small UHV chamber was placed to minimize air scattering. The vacuum tube was directly connected to the sample chamber through a gate valve with a Kapton window. The gate valve was closed during the annealing processes. For an air annealing treatment, nanocubes were vacuum-annealed at 400 °C (1 × 10⁻⁵ Torr) for 30 min and subsequently the air was leaked into the chamber while maintaining the substrate temperature at 400 °C for 30 min. The GISAXS patterns were collected with sample at the annealing temperature.

3.4. Raman Measurement

Raman spectra were measured with a SR500i spectrograph (Andor, Belfast, Northern Ireland, UK) equipped with a Newton CCD camera and a cobalt 532 nm laser with 400 mW power was used as excitation source. The laser was near normal incidence to the wafer sample and back scattered signal was conveyed to spectrometer through a fiber optic cable. Focusing of incident laser and collection of back-reflected Raman signal from sample were performed with a 50× long working distance lens (Motic, Kowloon, Hong Kong, China).

Funding

This research received no external funding.

Acknowledgments

The research described in this paper was performed at the Canadian Light Source, a national research facility of the University of Saskatchewan, which is supported by the Canada Foundation for Innovation (CFI), the Natural Sciences and Engineering Research Council (NSERC), the National Research Council (NRC), the Canadian Institutes of Health Research (CIHR), the Government of Saskatchewan, and the University of Saskatchewan.

Conflicts of Interest

The author declares no conflict of interest.

References

  1. Young, K.M.H.; Klahr, B.M.; Zandi, O.; Hamann, T.W. Photocatalytic water oxidation with hematite electrodes. Catal. Sci. Technol. 2013, 3, 1660–1671. [Google Scholar] [CrossRef]
  2. Sivula, K.; Le Formal, F.; Grätzel, M. Solar Water Splitting: Progress Using Hematite (α-Fe2O3) Photoelectrodes. ChemSusChem 2011, 4, 432–449. [Google Scholar] [CrossRef] [PubMed]
  3. Itoh, K.; Bockris, J.O.M. Stacked thin-film photoelectrode using iron oxide. J. Appl. Phys. 1984, 56, 874–876. [Google Scholar] [CrossRef]
  4. Kim, J.Y.; Youn, D.H.; Kim, J.H.; Kim, H.G.; Lee, J.S. Nanostructure-Preserved Hematite Thin Film for Efficient Solar Water Splitting. ACS Appl. Mater. Interfaces 2015, 7, 14123–14129. [Google Scholar] [CrossRef] [PubMed]
  5. Cao, H.; Wang, G.; Zhang, L.; Liang, Y.; Zhang, S.; Zhang, X. Shape and Magnetic Properties of Single-Crystalline Hematite (α-Fe2O3) Nanocrystals. ChemPhysChem 2006, 7, 1897–1901. [Google Scholar] [CrossRef] [PubMed]
  6. Zheng, Y.; Cheng, Y.; Wang, Y.; Bao, F.; Zhou, L.; Wei, X.; Zhang, Y.; Zheng, Q. Quasicubic α-Fe2O3 Nanoparticles with Excellent Catalytic Performance. J. Phys. Chem. B 2006, 110, 3093–3097. [Google Scholar] [CrossRef]
  7. Zhifa, P.; Minhua, C.; Jing, Y.; Kunlin, H.; Changwen, H. Controlled synthesis and growth mechanism of hematite nanorhombohedra, nanorods and nanocubes. Nanotechnology 2006, 17, 799–804. [Google Scholar] [CrossRef]
  8. Cao, H.; Wang, G.; Warner, J.H.; Watt, A.A.R. Amino-acid-assisted synthesis and size-dependent magnetic behaviors of hematite nanocubes. Appl. Phys. Lett. 2008, 92, 013110. [Google Scholar] [CrossRef]
  9. Hu, X.; Yu, J.C. Continuous Aspect-Ratio Tuning and Fine Shape Control of Monodisperse α-Fe2O3 Nanocrystals by a Programmed Microwave–Hydrothermal Method. Adv. Funct. Mater. 2008, 18, 880–887. [Google Scholar] [CrossRef]
  10. Fu, X.; Bei, F.; Wang, X.; Yang, X.; Lu, L. Surface-enhanced Raman scattering of 4-mercaptopyridine on sub-monolayers of α-Fe2O3 nanocrystals (sphere, spindle, cube). J. Raman Specrosc. 2009, 40, 1290–1295. [Google Scholar] [CrossRef]
  11. Chen, L.; Yang, X.; Chen, J.; Liu, J.; Wu, H.; Zhan, H.; Liang, C.; Wu, M. Continuous Shape- and Spectroscopy-Tuning of Hematite Nanocrystals. Inorg. Chem. 2010, 49, 8411–8420. [Google Scholar] [CrossRef]
  12. Lu, F.; Wu, Q.; Yang, X.; Chen, L.; Cai, J.; Liang, C.; Wu, M.; Shen, P. Comparative investigation of the performances of hematite nanoplates and nanograins in lithium-ion batteries. PCCP 2013, 15, 9768–9774. [Google Scholar] [CrossRef]
  13. Ouyang, J.; Pei, J.; Kuang, Q.; Xie, Z.; Zheng, L. Supersaturation-Controlled Shape Evolution of α-Fe2O3 Nanocrystals and Their Facet-Dependent Catalytic and Sensing Properties. ACS Appl. Mater. Interfaces 2014, 6, 12505–12514. [Google Scholar] [CrossRef]
  14. Abdul Rashid, N.M.; Haw, C.; Chiu, W.; Khanis, N.H.; Rohaizad, A.; Khiew, P.; Abdul Rahman, S. Structural- and optical-properties analysis of single crystalline hematite (α-Fe2O3) nanocubes prepared by one-pot hydrothermal approach. CrystEngComm 2016, 18, 4720–4732. [Google Scholar] [CrossRef]
  15. Kim, C.-Y. Atomic structure of hematite (α-Fe2O3) nanocube surface; synchrotron X-ray diffraction study. Nano-Struct. Nano-Objects 2020, 23, 100497. [Google Scholar] [CrossRef]
  16. Huang, X.; Hou, X.; Zhang, X.; Rosso, K.M.; Zhang, L. Facet-dependent contaminant removal properties of hematite nanocrystals and their environmental implications. Environ. Sci. Nano 2018, 5, 1790–1806. [Google Scholar] [CrossRef]
  17. Wang, X.; Wang, J.; Cui, Z.; Wang, S.; Cao, M. Facet effect of α-Fe2O3 crystals on photocatalytic performance in the photo-Fenton reaction. RSC Adv. 2014, 4, 34387–34394. [Google Scholar] [CrossRef]
  18. Morin, F.J. Electrical Properties of a-Fe2O3 and a-Fe2O3 Containing Titanium. Phys. Rev. 1951, 83, 1005–1010. [Google Scholar] [CrossRef]
  19. Sivula, K.; Zboril, R.; Le Formal, F.; Robert, R.; Weidenkaff, A.; Tucek, J.; Frydrych, J.; Grätzel, M. Photoelectrochemical Water Splitting with Mesoporous Hematite Prepared by a Solution-Based Colloidal Approach. J. Am. Chem. Soc. 2010, 132, 7436–7444. [Google Scholar] [CrossRef]
  20. Klahr, B.; Gimenez, S.; Fabregat-Santiago, F.; Hamann, T.; Bisquert, J. Water Oxidation at Hematite Photoelectrodes: The Role of Surface States. J. Am. Chem. Soc. 2012, 134, 4294–4302. [Google Scholar] [CrossRef] [Green Version]
  21. Le Formal, F.; Tétreault, N.; Cornuz, M.; Moehl, T.; Grätzel, M.; Sivula, K. Passivating surface states on water splitting hematite photoanodes with alumina overlayers. Chem. Sci. 2011, 2, 737–743. [Google Scholar] [CrossRef]
  22. Le Formal, F.; Sivula, K.; Grätzel, M. The Transient Photocurrent and Photovoltage Behavior of a Hematite Photoanode under Working Conditions and the Influence of Surface Treatments. J. Phys. Chem. C 2012, 116, 26707–26720. [Google Scholar] [CrossRef]
  23. Deng, J.; Lv, X.; Gao, J.; Pu, A.; Li, M.; Sun, X.; Zhong, J. Facile synthesis of carbon-coated hematite nanostructures for solar water splitting. Energy Environ. Sci. 2013, 6, 1965–1970. [Google Scholar] [CrossRef]
  24. Hu, X.; Han, S.; Zhu, Y. Facet-controlled synthesis of polyhedral hematite/carbon composites with enhanced photoactivity. Appl. Surf. Sci. 2018, 443, 227–235. [Google Scholar] [CrossRef]
  25. Yan, Y.; Tang, H.; Li, J.; Wu, F.; Wu, T.; Wang, R.; Liu, D.; Pan, M.; Xie, Z.; Qu, D. Self-assembly synthesis of a unique stable cocoon-like hematite @C nanoparticle and its application in lithium ion batteries. J. Colloid Interface Sci. 2017, 495, 157–167. [Google Scholar] [CrossRef]
  26. Li, Y.; Chen, H. Facile fire treatment of nanostructured hematite with an enhanced photoelectrochemical water splitting performance. J. Mater. Chem. A 2016, 4, 14974–14977. [Google Scholar] [CrossRef]
  27. Levine, J.R.; Cohen, J.B.; Chung, Y.W.; Georgopoulos, P. Grazing-incidence small-angle X-ray scattering: New tool for studying thin film growth. J. Appl. Crystallogr. 1989, 22, 528–532. [Google Scholar] [CrossRef]
  28. Rauscher, M.; Salditt, T.; Spohn, H. Small-angle x-ray scattering under grazing incidence: The cross section in the distorted-wave Born approximation. Phys. Rev. B 1995, 52, 16855–16863. [Google Scholar] [CrossRef]
  29. Pospelov, G.; Van Herck, W.; Burle, J.; Carmona Loaiza, J.M.; Durniak, C.; Fisher, J.M.; Ganeva, M.; Yurov, D.; Wuttke, J. BornAgain: Software for simulating and fitting grazing-incidence small-angle scattering. J. Appl. Crystallogr. 2020, 53, 262–276. [Google Scholar] [CrossRef] [Green Version]
  30. Guo, H.; Xu, H.; Barnard, A.S. Can hematite nanoparticles be an environmental indicator? Energy Environ. Sci. 2013, 6, 561–569. [Google Scholar] [CrossRef]
  31. Riedel, T.; Schaub, G.; Jun, K.-W.; Lee, K.-W. Kinetics of CO2 Hydrogenation on a K-Promoted Fe Catalyst. Ind. Eng. Chem. Res. 2001, 40, 1355–1363. [Google Scholar] [CrossRef]
  32. Temple, P.A.; Hathaway, C.E. Multiphonon Raman Spectrum of Silicon. Phys. Rev. B 1973, 7, 3685–3697. [Google Scholar] [CrossRef]
  33. Hyatt, H.A.; Cherlow, J.M.; Fenner, W.R.; Porto, S.P.S. Cross section for the Raman effect in molecular nitrogen gas. J. Opt. Soc. Am. 1973, 63, 1604–1606. [Google Scholar] [CrossRef]
  34. de Faria, D.L.A.; Venâncio Silva, S.; de Oliveira, M.T. Raman microspectroscopy of some iron oxides and oxyhydroxides. J. Raman Spectrosc. 1997, 28, 873–878. [Google Scholar] [CrossRef]
  35. Marshall, C.P.; Marshall, A.O. Hematite and carbonaceous materials in geological samples: A cautionary tale. Spectrochim. Acta Part A Mol. Biomol. Spectrosc. 2011, 80, 133–137. [Google Scholar] [CrossRef]
  36. Ferrari, A.C.; Robertson, J. Interpretation of Raman spectra of disordered and amorphous carbon. Phys. Rev. B 2000, 61, 14095–14107. [Google Scholar] [CrossRef] [Green Version]
  37. Jorio, A. Raman Spectroscopy in Graphene-Based Systems: Prototypes for Nanoscience and Nanometrology. ISRN Nanotechnol. 2012, 2012, 234216. [Google Scholar] [CrossRef] [Green Version]
  38. Kashiwaya, Y.; Yamaguchi, Y.; Kinoshita, H.; Ishii, K. In Situ Observation of Reduction Behavior of Hematite with Solid Carbon and Crystallographic Orientation between Hematite and Magnetite. ISIJ Int. 2007, 47, 226–233. [Google Scholar] [CrossRef] [Green Version]
  39. Saeidi, S.; Amin, N.A.S.; Rahimpour, M.R. Hydrogenation of CO2 to value-added products—A review and potential future developments. J. CO2 Util. 2014, 5, 66–81. [Google Scholar] [CrossRef]
  40. Andreazza, P.; Khelfane, H.; Lyon, O.; Andreazza-Vignolle, C.; Ramos, A.Y.; Samah, M. Trends in anomalous small-angle X-ray scattering in grazing incidence for supported nanoalloyed and core-shell metallic nanoparticles. Eur. Phys. J. Spec. Top. 2012, 208, 231–244. [Google Scholar] [CrossRef] [Green Version]
Figure 1. (a) GISAXS patterns taken from nanocube submonolayer annealed in vacuum, (b) simulated pattern, comparison between measurements and simulations along (c) horizontal and (d) vertical slices. X and Y represent spatial locations in the CCD detector. Arrows in (a) indicate positions where slices of (c,d) were taken.
Condensedmatter 05 00054 g001
Figure 2. (a) GISAXS patterns taken from nanocube submonolayer annealed in the air at 400 °C, (b) simulated pattern, comparison between measurement and simulation along (c) horizontal and (d) vertical slices. X and Y represent spatial locations in the CCD detector. Arrows in (a) indicate positions where slices of (c,d) were taken. Insets in (c) represents nanocube core-shells with tilting (left) and truncated sphere core-shell model used for the simulation (right).
Condensedmatter 05 00054 g002
Figure 3. (a) SEM images from vacuum annealed and (b) air-annealed nanocubes. Insets show images with bigger magnification (10×).
Condensedmatter 05 00054 g003
Figure 4. Raman spectrum measured from the air annealed nanocube submonolayer. The sharp strong peak at 520.7 cm−1 and broad peak at 930–1030 cm−1 marked by filled circle are from silicon substrate. The * marks carbon G band.
Condensedmatter 05 00054 g004
Figure 5. Flow scheme of α-Fe2O3 nanocube submonolayer sample preparation.
Condensedmatter 05 00054 g005
Figure 6. Grazing incident small angle X-ray scattering (GISAXS) setup.
Condensedmatter 05 00054 g006