Abstract
We present an innovative X-ray spectroscopy system to address the complex study of the X-ray emissions arising from laser–target interactions, where the emissions occur within extremely brief intervals from femtoseconds to nanoseconds. Our system combines a Gas Electron Multiplier (GEM) detector with a silicon-based Timepix3 (TPX3) detector. These detectors work in tandem, allowing for a spectroscopic radiation analysis along the same line of sight. With an active area of 10 × 10 cm, the GEM detector allows for 1D measurements for X-ray energies (2–50 keV) by utilizing the full 10 cm gas depth. The high-energy part of the radiation beam exits through a downstream side window of the GEM without being absorbed in the gas volume. Positioned side-on at the GEM detector’s exit, the TPX3 detector, equipped with a pixelated sensor (55 µm × 55 µm; active area 14 mm × 14 mm), uses its full 14 mm silicon sensor to detect hard X-rays (50–500 keV) and gamma rays (0.5–10 MeV). We demonstrate the correct operation of the entire detection system and provide a detailed description of the Timepix3 detector’s calibration procedure, highlighting the suitability of the combined system to work in laser plasma facilities.
1. Introduction
X-ray emission measurements offer profound insights into plasma behavior in both spatial and temporal contexts. Historically, the use of a pinhole camera constructed with a Gas Electron Multiplier (GEM) detector has proven to be an invaluable technology for characterizing plasma. This approach, employing 2D direct imaging through photon counting, enables the investigation of various aspects of fusion magnetized plasmas in an experiment with Tokamak machines. It allows for the examination of impurity dynamics within the core, the reconstruction of magnetic configurations, the localization of heating effects, and the study of phenomena like magnetohydrodynamic (MHD) instabilities, energy and particle transport, and much more [1,2,3,4,5]. The GEM detector utilized in this technique is distinguished by its exceptional attributes, including high sensitivity, a broad dynamic range, high temporal resolution, energy resolution, significant resistance to electromagnetic disturbances, and resilience in the presence of neutron and gamma background radiation [6]. However, the need to monitor X-rays produced as a result of laser–target interaction has necessitated the use of the GEM detector, using a different strategy. In this case, the nearly simultaneous emission of X-rays makes it impossible to distinguish individual photons in laser-produced plasmas, thus transitioning into the so-called multi-photon regime. The concept involves quantifying the charge released across the complete gas volume of the GEM camera. This is achieved by deploying it in a configuration we term the “side-on” setup. This configuration uses the enhanced capabilities of the novel front-end electronics to measure both the charge and the arrival time of each detected photon. The utilization of the GEM detector in this configuration presents several advantages over other detectors used in laser-produced plasma (LPP), such as X-ray CCDs, which have limited spatial resolution, or the BremsStrahlung Cannon (BSC) [7,8,9]. The GEM, although operating in a more confined energy range (soft X-rays), offers real-time information working with single shot. Against the BSC, which is based on a series of high-atomic-number sandwiches interspersed with image plates, functions as a passive detector. A conceptually similar detector to the GEM side-on configuration is the GEMpix detector, which integrates GEM’s gas detector technology with a QUAD Timepix ASIC for readout [10,11]. However, in the case of the GEMpix detector, since it performs a 2D imaging of the X-rays emitted from the plasma, the experiments have involved placing aluminum filters with varying thicknesses in front of the detector to measure X-ray fluxes as a function of energy. This approach has employed a limited number of absorbers. In contrast, the GEM side-on configuration offers the unique advantage of accommodating up to 64 absorbers, corresponding to the number of pads at its disposal. This configuration allows for the measurement of the absorption profile for soft X-rays in the energy range 2–50 keV. By coupling this GEM camera with the solid-state Timepix3 (TPX3) detector, developed by the Medipix Collaboration [12], the energy range for detectable photons can be extended into the hard X-ray and gamma ray domains.
This paper describes both detectors, outlines the calibration procedure employed for the TPX3, and illustrates and demonstrates the proper functionality of the integrated system, including some results obtained during experimental campaigns conducted at the Intense Laser Irradiation Laboratory (ILIL) of the CNR-INO Institute in Pisa.
2. The GEM and Timepix3 Detectors’ Features
2.1. The GEM Detector
The GEM detector was conceptualized in the late 1990s, and was initially intended for use in particle physics. However, its versatility has led to its application in various other fields of physics, including plasma physics. Constructed from a thin Kapton foil, merely 50 m in thickness, this detector is metal-clad on both sides and hosts a dense array of bi-conical holes. These holes exhibit an external diameter of 70 m and an internal diameter of 50 m, spaced at intervals of 140 m. Each hole operates as an electron multiplication channel, facilitating this multiplication by applying potentials on either side of the foil [13]. For enhanced performance and a reduced probability of discharge, multiple GEM foils are often assembled, resulting in substantial gains, typically around ∼10 on a single stage. Our GEM detector employs three identical GEMs, covering a 10 × 10 cm active area. The region between the cathode and the first GEM foil is 12 mm thick and contains an Ar/CO mixture (70/30%). It features a side entrance and exit windows, measuring 6 × 80 mm. The PCB anode is divided into four lines, each comprising 64 pads, with each pad measuring 1.5 × 20 mm.
Figure 1 illustrates the operational principle of a Triple GEM detector. Ionization electrons generated in the drift gap between the cathode and the first GEM foil are accelerated by electric fields across the three GEM foils, undergoing multiplication. Upon passing through the final GEM foil, they drift to the anode in the induction gap, generating an induced current signal on the pads (charge collection stage). Notably, the signal on the anode is exclusively generated by the electron collection process, without contributions from slow positive ions. This enhances speed response and minimizes space charge-related issues [13]. The readout can be performed using strips, pads, or pixels of various shapes and sizes. Gas detection technology renders the chamber highly selective to soft X-rays, while the active gain imparts exceptional sensitivity. Among the features of the GEM detector operating in the photon-counting mode and single-photon regime, it is essential to highlight its outstanding optical flexibility and tunable time resolution, ranging from milliseconds to microseconds.
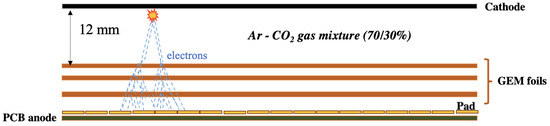
Figure 1.
Scheme of the functioning of a Triple GEM detector.
A New Paradigm for Photon Detection: X, Y, ToT, ToA Measurements
A new era started with the development of new front-end electronics based on the GEMINI ASIC chip performed by the CNR-ISTP Institute, the University of Milano-Bicocca and the INFN Institute [14].
The primary advantage of the GEMINI chip lies in its ability to measure, working in the single-photon regime, in addition to the position (X,Y), as well as the charge and, consequently, the energy released by each detected photon, utilizing the Time-over-Threshold (ToT) variable and its Time-of-Arrival (ToA) with a high degree of accuracy, typically within a few nanoseconds.
Consequently, each pixel effectively operates as an individual spectrometer, exemplified by the ToT distributions (right panel) within the depicted GEM matrix (left panel) of Figure 2, which is a 2D image of the soft X-ray emissivity of the fusion plasma from the EAST Tokamak. Subsequently, using the calibration curve reported in Figure 3, the ToT data are translated into charge, and from there, into energy. In the same figure, the function used to fit the experimental data, which takes into account the non-linear behavior at low charge values, is also displayed:
where the quantities a, b, c, d, and t are the output parameters from the fit.
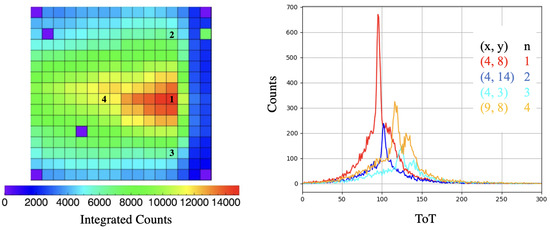
Figure 2.
ToT distributions for the single pads (right panel) within the depicted GEM matrix (left panel).
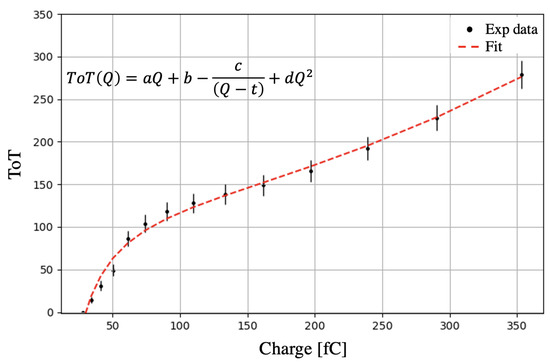
Figure 3.
Calibration curve to convert the ToT information in charge.
Moreover, this system boasts an additional feature that allows for post-processing adjustments in both spatial and temporal resolutions. The detector can operate in various acquisition modes, including framing, fast time, and time and space binned. In the frame mode, raw data acquisition occurs at millisecond timescales, while fast time mode offers an enhanced time resolution at the sub-microsecond level, albeit with a diminished spatial resolution. The time and space binned mode, on the other hand, operates at intermediate time and space resolutions, providing researchers with a versatile toolkit to satisfy specific requirements.
2.2. The Timepix3 Detector
The Timepix3 (TPX3) detectors feature a semiconductor diode equipped with a pixelated surface, enabling the precise determination of the energy deposited in each pixel. The TPX3 detector’s active sensor can be constructed using various semiconductor materials, including silicon (Si), cadmium telluride (CdTe), diamond, and more [15]. The choice of material depends on the specific requirements of the experiment, and the sensor can be manufactured with different thicknesses. In our experimental setup, we utilized a silicon TPX3 detector with an active area measuring 14 × 14 mm and a thickness of 1000 m. The pixels measure 55 × 55 m and are arranged in a matrix of 256 × 256. These detectors allow for the identification of the type of ionizing particle that interacts with them through a detailed morphological analysis of the tracked path of the detected particle. In the left panel of Figure 4, it is possible to see the corresponding tracks identified as soft X- or hard X-rays; in the center panel, those coming from electrons or gamma; and in the right panel, the tracks refer to the heavy particle as , proton, etc.
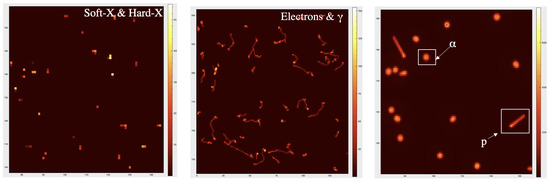
Figure 4.
Example of particle identification performed using the silicon TPX3 detector, where it is possible to appreciate the different morphology of the tracks released by soft X- and hard X-rays, electron and gamma rays, , proton or heavy particle, respectively.
Additionally, the TPX3 detector is capable of simultaneously acquiring both the released energy (Time-over-Threshold—ToT) and the Time-of-Arrival (ToA) of each incident particle with a time resolution of 1.56 ns [16,17].
3. Setup of the Combined Spectroscopic System
The approach employed to use the GEM detectors in the laser plasma experiments is illustrated in Figure 5.
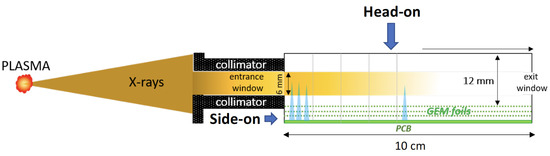
Figure 5.
GEM detector approach working in multi-photon regime in a laser plasma experiment.
The GEM detector, unlike that which is usually conducted to perform a 2D direct imaging of the plasma in the Tokamak machine, is placed in the side-on configuration: X-ray photons emitted by the plasma enter through the side window of the GEM chamber and release their energy within the 10 cm gas volume. Depending on their energy, they will either be fully absorbed or, if more energetic, pass through the exit window. It is precisely from the measurement of the charge absorption profile that we can deduce the soft X-ray emission spectrum.
The functioning of the detector in this configuration was tested at the ILIL facility of the CNR-INO Institute of Pisa.
The laser employed is a Ti:Sa CPA (Chirped Pulse Amplification) laser system, capable of reaching a power of 240 TW and generating ultrashort pulses of 30 fs. In Figure 6, a scheme of the octagonal interaction chamber of about 1.5 m in diameter is reported. Particularly for laser plasma experiments, where the goal is to capture a wide range of parameters for comparison with simulations, the strategic placement of detectors becomes crucial. For the validation of the operation of the combined system, the GEM detector was positioned in air, just outside of the interaction chamber, in front of a port on the same side as the incident laser beam interacted with the target consisting of a titanium plate.
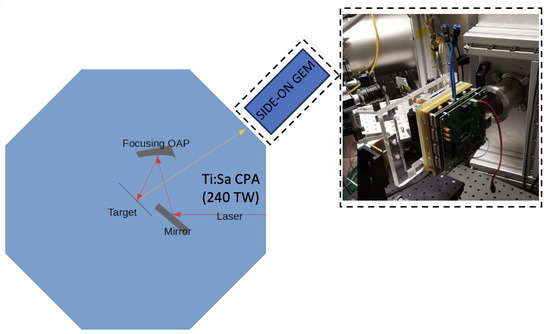
Figure 6.
Interaction chamber of the ILIL laboratory of the CNR-INO Institute of Pisa, where the Ti:Sa CPA laser hits a titanium target. The position of the GEM camera is visible, together with a picture of the bare detector, to better highlight the side-on configuration, fully assembled with the double-FPGA acquisition board and the new front-end electronics.
In this arrangement, the detector was well-placed to capture X-ray radiation that passed through a mylar port window of 23 m in thickness. It must be outlined that, at the moment, the GEM detector is equipped with a kapton window not suitable to directly interface the vacuum chamber. Then, the exploited position is a good compromise to reduce air absorption compatibly with the overall dimensions of the aluminum case, with walls of 2 mm thickness, in which both the detectors are enclosed for shielding from the electromagnetic disturbances. In the future, a dedicated vacuum window will be realized in order to directly mount the detector on the port.
Installing of the Timepix3 detector enables the detection of radiation that is unobserved by the GEM camera, providing enhanced sensitivity to a broader range of emitted radiation (until 10 MeV).
The comprehensive scheme of the integrated spectroscopic system, based on a picture of the experimental setup, is reported in Figure 7.
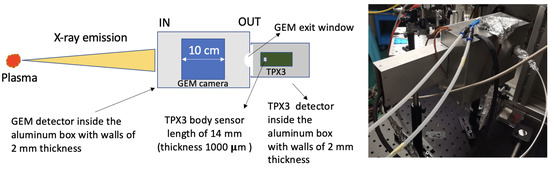
Figure 7.
Scheme of the combined spectroscopic system: the X-rays emitted by the plasma enter the GEM’s side window, and they are absorbed, or they cross the camera and arrive to the TPX3 detector from the GEM exit window, where they are detected and analyzed morphologically.
In future experiments, a multi-placement of the detectors at different lengths and angles will be tested.
The proper functioning of the overall system will be shown in the next section, where we report the measured soft X-ray absorption profiles measured using the GEM detector and the results of the measured radiation using the TPX3 detector.
4. Results
4.1. Soft X-ray Absorption Profile Detected Using the Side-on GEM Camera
In this section, we present the absorption profiles acquired by the side-on GEM detector resulted from the multi-photon interactions of a single-laser pulse focused on a 5 m thick titanium target. Our methodology is versatile and can be employed with various types of targets. It is not exclusively designed for the investigation of plasma resulting from the interaction between a laser and a titanium target. The analysis is centered explicitly on one row of the available detector pads, necessitating a 0.9 mm pinhole on the GEM camera’s entrance window. On the left side of Figure 8, we illustrate the recorded charge in each pad until the complete absorption of the soft X-rays in the gas volume is achieved. On the right side, we present the corresponding 1D profile, together with the simulated lines representing Maxwellian curves, at different temperatures.
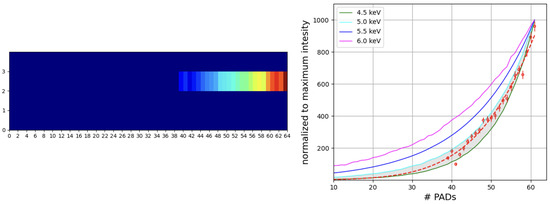
Figure 8.
Released charge in each pad (left panel); corresponding 1D absorption profile and simulated lines representing Maxwellian curves at different temperatures (right panel).
The expected spectrum comprises a continuum of Bremsstrahlung emission together with the characteristic K XRF line. We conducted the simulation of the absorption profile using the FLUKA Monte Carlo simulation package [18]. The use of this approach demonstrated the capability to differentiate between distinct Maxwellian temperatures in the generated plasma.
4.2. Silicon TPX3 Calibration Procedure and Hard X-ray Detection Results
Typically, the calibration process involves the utilization of X-ray fluorescence sources. However, considering our specific interest in measuring potentially generated gamma photons, we evaluated the detector’s response using established gamma emission sources: Ba, Cd, Co, and Cs. These gamma sources are widely recognized and employed in gamma spectroscopy for their known energy spectra and intensities, making them ideal candidates for calibrating our detector. We exclusively utilize the X-ray emissions originating from a Fe source to provide a reference point for describing the non-linear part of the TPX3 calibration curve. Our approach is conventional although applied to the detector positioned in a side-on configuration. The utilization of known laboratory gamma sources is motivated by the necessity to convert ToT information into energy and, more significantly, to investigate the morphology and characteristics of tracks generated by hard X-ray and gamma photons. The calibration was executed using a simple experimental configuration, as depicted in Figure 9. In this setup, the gamma (or X-ray) source is precisely aligned with the entrance window of the side-on detector, which is enclosed within the same aluminum housing used during the data taking at the ILIL laboratory of Pisa. This arrangement ensures that gamma photons emitted by the sources directly interact with the detector, providing a controlled and reproducible calibration environment.
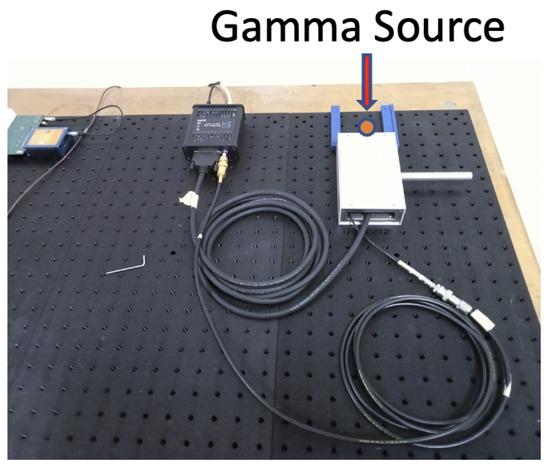
Figure 9.
The calibration setup adopted where the gamma source is aligned with the entrance window of the side-on detector, which is enclosed within the same aluminum housing used during the data taking at ILIL laboratory of Pisa.
The morphological analysis of the detected tracks was performed by using several key parameters, including the ToT value (ToT), the cluster size (CS), the cluster height (CH), the linearity (LIN), and the roundness (RND). The cluster size represents the count of pixels constituting a cluster, while the cumulative ToT values of these pixels present the ToT value. The cluster height is ascribed to the maximum ToT value within a cluster. The linearity (LIN) parameter is calculated using the following formula:
where line_pixels denotes the sum of pixels whose distance to the line, passing through the most distant pixels, is less than or equal to 1.0.
Further, the roundness is defined as:
with CS corresponding to the cluster size and D determined by the most distant pixels within a cluster.
Each histogram reported in Figure 10 refers to a distinct calibration source starting with an X-ray emission of 5.9 keV from the Fe source. Particularly, the Ba source exhibits two distinct gamma emission peaks at 80 keV and 356 keV. They appear clearly separated during the data acquisition, so we distinguished the two different contributions at the analysis stage. The energy spectrum of these sources spans from 81 keV to 662 keV, corresponding to the gamma rays emitted by Cs.
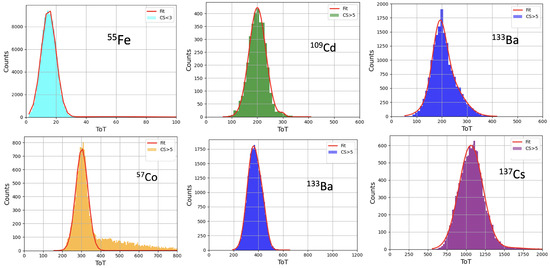
Figure 10.
Selected X-rays and gamma emission peaks of the calibration sources: Fe, Ba, Cd, Co, and Cs covering the energy range from 81 keV to 662 keV. The Ba source exhibits two distinct gamma emission peaks at 81 keV and 356 keV.
The analysis of the detected tracks involved applying a selection criterion based on their morphological characteristics. Given our focus on gamma rays search, we mandated a minimum cluster size (CS) of 5. For the identification of X-ray photons of low energy (5.9 keV), our selection was constrained to smaller cluster sizes, with a maximum composition of two clusters. Additionally, we imposed a roundness criterion within the range of 60% to 90%. This selection was based on the nearly point-like shape of the resulting tracks. As an example of the performed analysis, in Figure 11, the roundness, the linearity behavior, and the ToT distribution as a function of the cluster height in case of the employment of the Cd source are shown. Thus, to select the gamma emission peak in the case of the Cd (88 keV), the events with a cluster height lower than 90, a roundness value exceeding 70% (as these tracks are less elongated), and a linearity value surpassing 90% are saved. The same criteria are also applied to the lower-energy peak observed in the Ba source (81 keV).
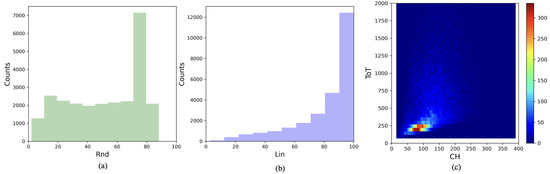
Figure 11.
Roundness (a), linearity behavior (b), and ToT distribution as a function of the cluster height (c) in the case of using of the Cd source are shown.
The rise in gamma photon energy is reflected in the observable characteristics of the resulting tracks, as anticipated. Specifically, photons with an energy level of 122 keV, originating from the Co source, exhibit a cluster height exceeding 90, a roundness falling within the range of 40% to 70%, and a linearity surpassing 75%.
More stringent requirements are imposed on the emission peaks originating from the Ba (356 keV) and Cs (662 keV) sources. In the case of Ba, the cluster size needed to exceed 7 and the cluster height falls within the 100–170 range. Roundness is restricted to values below 70%, with a constraint on the linearity exceeding 80%.
For the higher-energy peak produced by Cs, selection cuts involve a cluster size greater than 17, with a minimum cluster height of 100. These detected tracks exhibit a narrower profile, as reflected by the roundness ranging from 20% to 40%, and appear rather curved with a linearity less than 80%.
Each resulting distribution is fitted with the sum of two Gaussian functions in order to construct the calibration curve of the detector. The fit results are summarized in Table 1, while the calibration curve is visible in the Figure 12, where the reported error bars represent a 2 uncertainty.

Table 1.
Fit results of each gamma emission peak of the calibration sources.
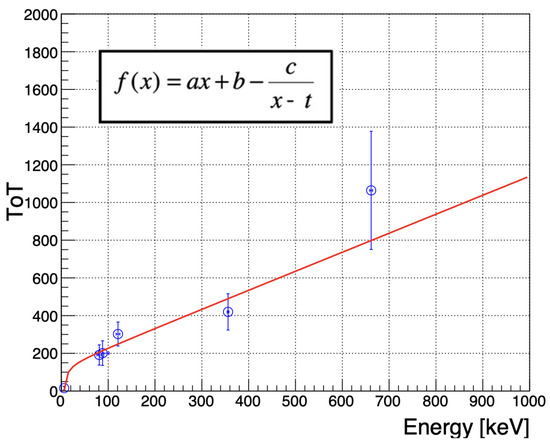
Figure 12.
The calibration curve of the TPX3 (the fit function is also displayed). The error bars in the plot represent a 2 uncertainty.
The detector’s response was evaluated by utilizing the provided calibration curve. To minimize interference from lower-energy radiation during data collection at the ILIL laboratory, a 2 mm thick copper layer was introduced between the GEM camera and TPX3 detector. Photons with energies below 40 keV were effectively screened out, as evidenced by the transmission coefficient’s behavior as a function of the energy, as depicted in Figure 13. A zoomed-in view, including energies up to 100 keV, is also presented in Figure 13.
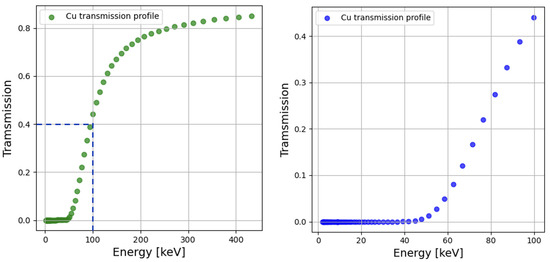
Figure 13.
Transmission coefficient as a function of the energy for copper of 2 mm thickness (left panel); in the zoomed-in view, it is possible to see the behavior until 100 keV (right panel) [19].
The distribution of Time-over-Threshold (ToT) values is examined, and the outcomes are presented in Figure 14. In red, in the left panel, it is possible to observe the distribution without any cut applied; in violet, in the right panel, the result with only the cluster size cut (>5) is reported, while the green one represents the distribution that satisfies the additional requirement of linearity exceeding 80%.
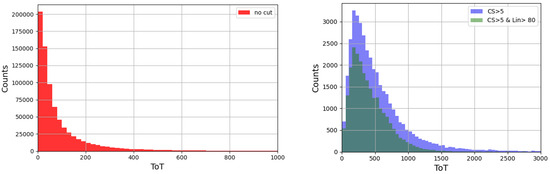
Figure 14.
The distribution of Time-over-Threshold (ToT) values is reported. Left panel: Distribution without any cut applied. Right panel: Distribution with only the cluster size cut (>5) is reported in violet, while the green represents the distribution with the additional request on the linearity exceeding 80%.
Similarly to the calibration sources studied, we analyzed roundness, linearity, and ToT as a function of both cluster size and cluster height, which are concisely summarized in Figure 15. Subsequently, we applied the findings from the analysis of track morphology and features, resulting from the photons emitted from laboratory gamma sources to explore potential associations with the experimental observations obtained at the ILIL facility.
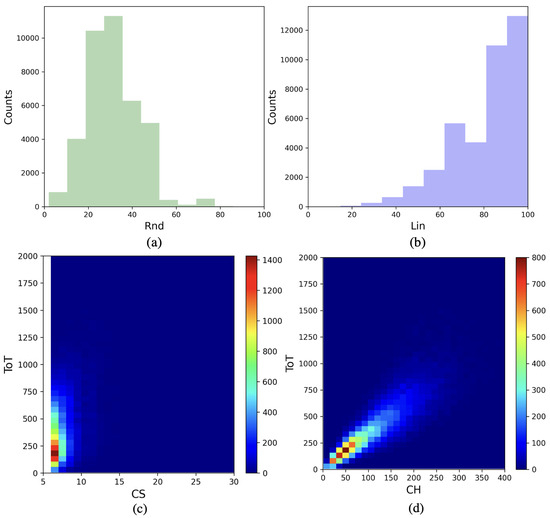
Figure 15.
Analysis results on the roundness (a), the linearity (b), and the ToT as a function of both the cluster size (c) and the cluster height (d) in the case of applying a 2 mm copper filter between the GEM camera and the TPX3 detector.
In Figure 16, two distinct distributions have been identified.
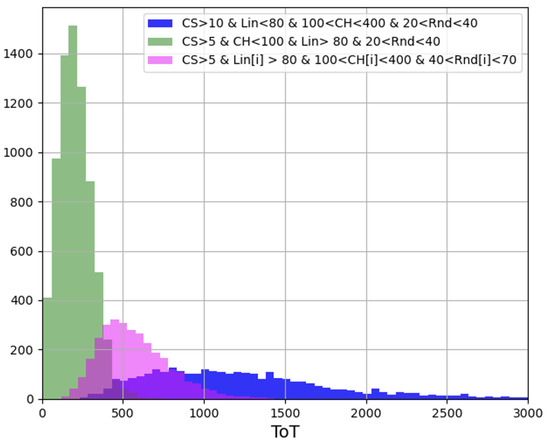
Figure 16.
Distributions identified by taking into account the morphological analysis of the tracks studied during the calibration process.
The green peak is selected based on specific conditions: tracks with high linearity (>80%), a cluster height value lower than 100, and roundness falling within the range of 20–40%. The purple peak, on the other hand, is characterized by tracks with a cluster height between 100 and 400, alongside a less spherical appearance, with roundness values between 40% and 70%.
These observed distributions have been subjected to further analysis through fitting, utilizing a combination of double Gaussian functions. Following the calibration curve depicted in Figure 12, these distributions correspond to energy values of 54 keV (174 ToT value) and 265 keV (397 ToT value), respectively. Consequently, the first distribution is reasonably compatible with the tail of the thermal spectrum measured using the GEM detector. Furthermore, there is an additional contribution of higher energy, although its statistical significance is limited. This contribution is associated with clusters of larger size (>10), linearity values lower than 80%, and roundness values ranging from 20% to 40% (blue distribution in Figure 16).
5. Discussion
The application of GEM cameras in the head-on configuration within Tokamak machines like NSTX, FTU, EAST, or KSTAR has long been recognized as an invaluable technology for conducting 2D plasma soft X-ray imaging or tomography in the field of plasma physics. Initially, this was achieved by utilizing the detector operating in photon-counting mode. However, a new era began with the development of advanced front-end electronics, enabling the measurement of photon energy and also the precise determination of each photon’s arrival time, making each pixel of the detector capable of acting as a single spectrometer. While this configuration is well-suited for single-photon applications, it requires reevaluation for use in scenarios like laser plasma experiments, where high-intensity X-ray emissions occur in very concentrated bursts. To address this challenge, a new approach was adopted, consisting of the use of the detector in what we refer as the side-on configuration, which allows us to perform the measurement of the X-rays absorption profile by taking advantage of the capability of the front-end electronics to measure the released charge in the detector, with the unique advantage of accommodating up to 64 absorbers, corresponding to the number of pads at its disposal. In this side-on configuration, we can effectively measure the absorption profile for soft X-rays within the energy range of 2–50 keV. A further element of novelty is given by the coupling of this GEM camera with the solid-state Timepix3 (TPX3) detector, which allows us to extend the energy range for detectable photons into the hard X-ray and gamma ray domains. This system significantly enhances spectroscopic capabilities within the regime of multi-photon emissions. The presented experimental results demonstrate the successful detection of soft X-rays using the GEM detector and, simultaneously, the proper functioning of the TPX3 detector has been proven. It allowed, in fact, for the identification of radiation emitted by the plasma, resulting from the laser–target interaction, specifically identifying hard X-rays and particularly two populations of about 50 keV and 270 keV, respectively. The former is likely attributable to the high-energy tail of the thermal spectrum previously measured using the GEM camera. However, the TPX3 can also work in the side-on configuration and multi-photon regime to also detect the gamma rays, as was made previously in the occasion of the VEGA-2 experimental campaign, where gamma photons of 3 MeV have been identified [20].
Furthermore, it is noteworthy that both GEM and Timepix3 detectors exhibit robust performance even in the presence of elevated background radiation. They can effectively operate under neutron flux levels on the order of 10 n/s·cm. To monitor such challenging radiation environments, a CVD diamond TPX3 detector can also be effectively employed.
Author Contributions
Conceptualization, D.P.; methodology, D.P., G.C. (Gerardo Claps), F.C. and V.D.L.; software, V.D.L.; validation, V.D.L.; formal analysis, V.D.L. and G.C. (Gerardo Claps); investigation, V.D.L., G.C. (Gerardo Claps), F.C.; resources, D.P., L.A.G. and P.K.; data curation, V.D.L.; writing—original draft preparation, V.D.L.; writing—review and editing, V.D.L., G.C. (Gerardo Claps), F.C., D.P. and A.T.; visualization, V.D.L.; supervision, D.P.; project administration, D.P. and G.C. (Gabriele Cristoforetti). All authors have read and agreed to the published version of the manuscript.
Funding
This research received no external funding.
Data Availability Statement
Data will be made available on reasonable request to the authors.
Acknowledgments
We thank the personnel at the ILIL laboratory of the CNR-INO of Pisa for the availability and the support in preparation of the setup.
Conflicts of Interest
The authors declare no conflict of interest.
References
- Källne, E.; Källne, J. X-ray spectroscopy in fusion research. Phys. Scr. 1987, T17, 152–165. [Google Scholar] [CrossRef]
- Murtas, F. Applications of triple GEM detectors beyond particle and nuclear physics. J. Instrum. 2014, 9, C01058. [Google Scholar] [CrossRef]
- Mazon, D.; Jardin, A.; Malard, P.; Chernyshova, M.; Coston, C.; Malard, P.; O’Mullane, M.; Czarski, T.; Malinowski, K.; Faisse, F.; et al. SXR measurement and W transport survey using GEM tomographic system on WEST. J. Instrum. 2017, 12, C11034. [Google Scholar] [CrossRef]
- Chen, K.; Xu, L.; Hu, L.; Duan, Y.; Li, X.; Yuan, Y.; Mao, S.; Sheng, X.; Zhao, J. 2-D soft X-ray arrays in the EAST. Rev. Sci. Instrum. 2016, 87, 063504. [Google Scholar] [CrossRef] [PubMed]
- Erzhong, L.; Chen, Y.; Qu, H.; Zhou, T.; Chen, F.; Zhang, L.; Wang, H.; Duan, Y.; Liu, H.; Shen, B.; et al. Progress of a gas-electron-multiplier based camera (GEM) in investigated EAST macroscopic instabilities. Plasma Phys. Control. Fusion 2023, 65, 055014. [Google Scholar]
- Esposito, B.; Murtas, F.; Villari, R.; Angelone, M.; Marocco, D.; Pillon, M.; Puddu, S. Design of a GEM-based detector for the measurement of fast neutrons. Nucl. Instrum. Methods Phys. Res. Sect. A 2010, 617, 155–157. [Google Scholar] [CrossRef]
- Chen, C.D.; King, J.A.; Key, M.H.; Akli, K.U.; Beg, F.N.; Chen, H.; Freeman, R.R.; Link, A.; Mackinnon, A.J.; MacPhee, A.G.; et al. A Bremsstrahlung spectrometer using—Edge and differential filters with image plate dosimeters. Rev. Sci. Instrum. 2008, 79, 10E305. [Google Scholar] [CrossRef] [PubMed]
- Pacella, D.; Claps, G.; De Angelis, R.; Murtas, F. An hybrid detector GEM-ASIC for 2-D soft X-ray imaging for laser produced plasma and pulsed sources. J. Instrum. 2016, 11, C03022. [Google Scholar] [CrossRef]
- Hannasch, A.; Laso Garcia, A.; LaBerge, M.; Zgadzaj, R.; Köhler, A.; Couperus Cabadağ, J.P.; Zarini, O.; Kurz, T.; Ferrari, A.; Molodtsova, M.; et al. Compact spectroscopy of keV to MeV X-rays from a laser wakefield accelerator. Nat.-Sci. Rep. 2021, 11, 14368. [Google Scholar] [CrossRef] [PubMed]
- Claps, G.; Pacella, D.; Murtas, F.; Jakubowska, K.; Boutoux, G.; Burgy, F.; Ducret, J.E.; Batani, D. The gempix detector as new soft X-rays diagnostic tool for laser produced plasmas. Rev. Sci. Instrum. 2016, 87, 103505. [Google Scholar] [CrossRef] [PubMed]
- Murtas, F. The GEMPix detector. Rad. Meas. 2020, 138, 106421. [Google Scholar] [CrossRef]
- A Family of Pixel Detector Read-Out Chips for Particle Imaging and Detection Developed by the Medipix Collaborations. Available online: https://medipix.web.cern.ch/medipix/ (accessed on 1 October 2023).
- Sauli, F. The gas electron multiplier (GEM): Operating principles and applications. Nucl. Instrum. Methods Phys. Res. Sect. A 2016, 85, 2–24. [Google Scholar] [CrossRef]
- Pezzotta, A.; Corradi, G.; Croci, G.; De Matteis, M.; Murtas, F.; Gorini, G.; Baschirotto, A. GEMINI: A triple-GEM detector read-out mixed-signal ASIC in 180 nm CMOS. In Proceedings of the 2015 IEEE International Symposium on Circuits and Systems (ISCAS), Lisbon, Portugal, 24–27 May 2015; pp. 1718–1721. [Google Scholar]
- Burian, P.; Broulím, P.; Jára, M.; Georgieva, V.; Bergmannb, B. Katherine: Ethernet Embedded Readout Interface for Timepix3. J. Instrum. 2017, 12, C11001. [Google Scholar] [CrossRef]
- Jakubek, J. Precise energy calibration of pixel detector working in time-over-threshold mode. Nucl. Instrum. Methods Phys. Res. Sect. A 2011, 633, S262–S266. [Google Scholar] [CrossRef]
- Poikela, T.; Plosila, J.; Westerlund, T.; Campbell, M.; De Gaspari, M.; Llopart, X.; Gromov, V.; Kluit, R.; Van Beuzekom, M.; Zappon, F.; et al. Timepix3: A 65K channel hybrid pixel readout chip with simultaneous ToA/ToT and sparse readout. J. Instrum. 2014, 9, C05013. [Google Scholar] [CrossRef]
- FLUKA Monte Carlo Simulation Package. Available online: https://fluka.cern (accessed on 1 October 2023).
- X-ray from Factor, Attenuation, and Scattering Tables. Available online: https://physics.nist.gov/PhysRefData/FFast/html/form.html (accessed on 1 October 2023).
- Claps, G.; Cordella, F.; Murtas, F.; Pacella, D. Timepix3 detector and Geant4-based simulations for gamma energy detection in Laser Produced Plasmas. J. Instrum. 2019, 14, P09005. [Google Scholar] [CrossRef]
Disclaimer/Publisher’s Note: The statements, opinions and data contained in all publications are solely those of the individual author(s) and contributor(s) and not of MDPI and/or the editor(s). MDPI and/or the editor(s) disclaim responsibility for any injury to people or property resulting from any ideas, methods, instructions or products referred to in the content. |
© 2023 by the authors. Licensee MDPI, Basel, Switzerland. This article is an open access article distributed under the terms and conditions of the Creative Commons Attribution (CC BY) license (https://creativecommons.org/licenses/by/4.0/).