
Fast Location of Table Grapes Picking Point Based on Infrared Tube


Abstract
:1. Introduction
2. Materials and Methods
2.1. Image Collection
2.2. Recognition and Segmentation of Table Grapes in Two-Dimensional Space
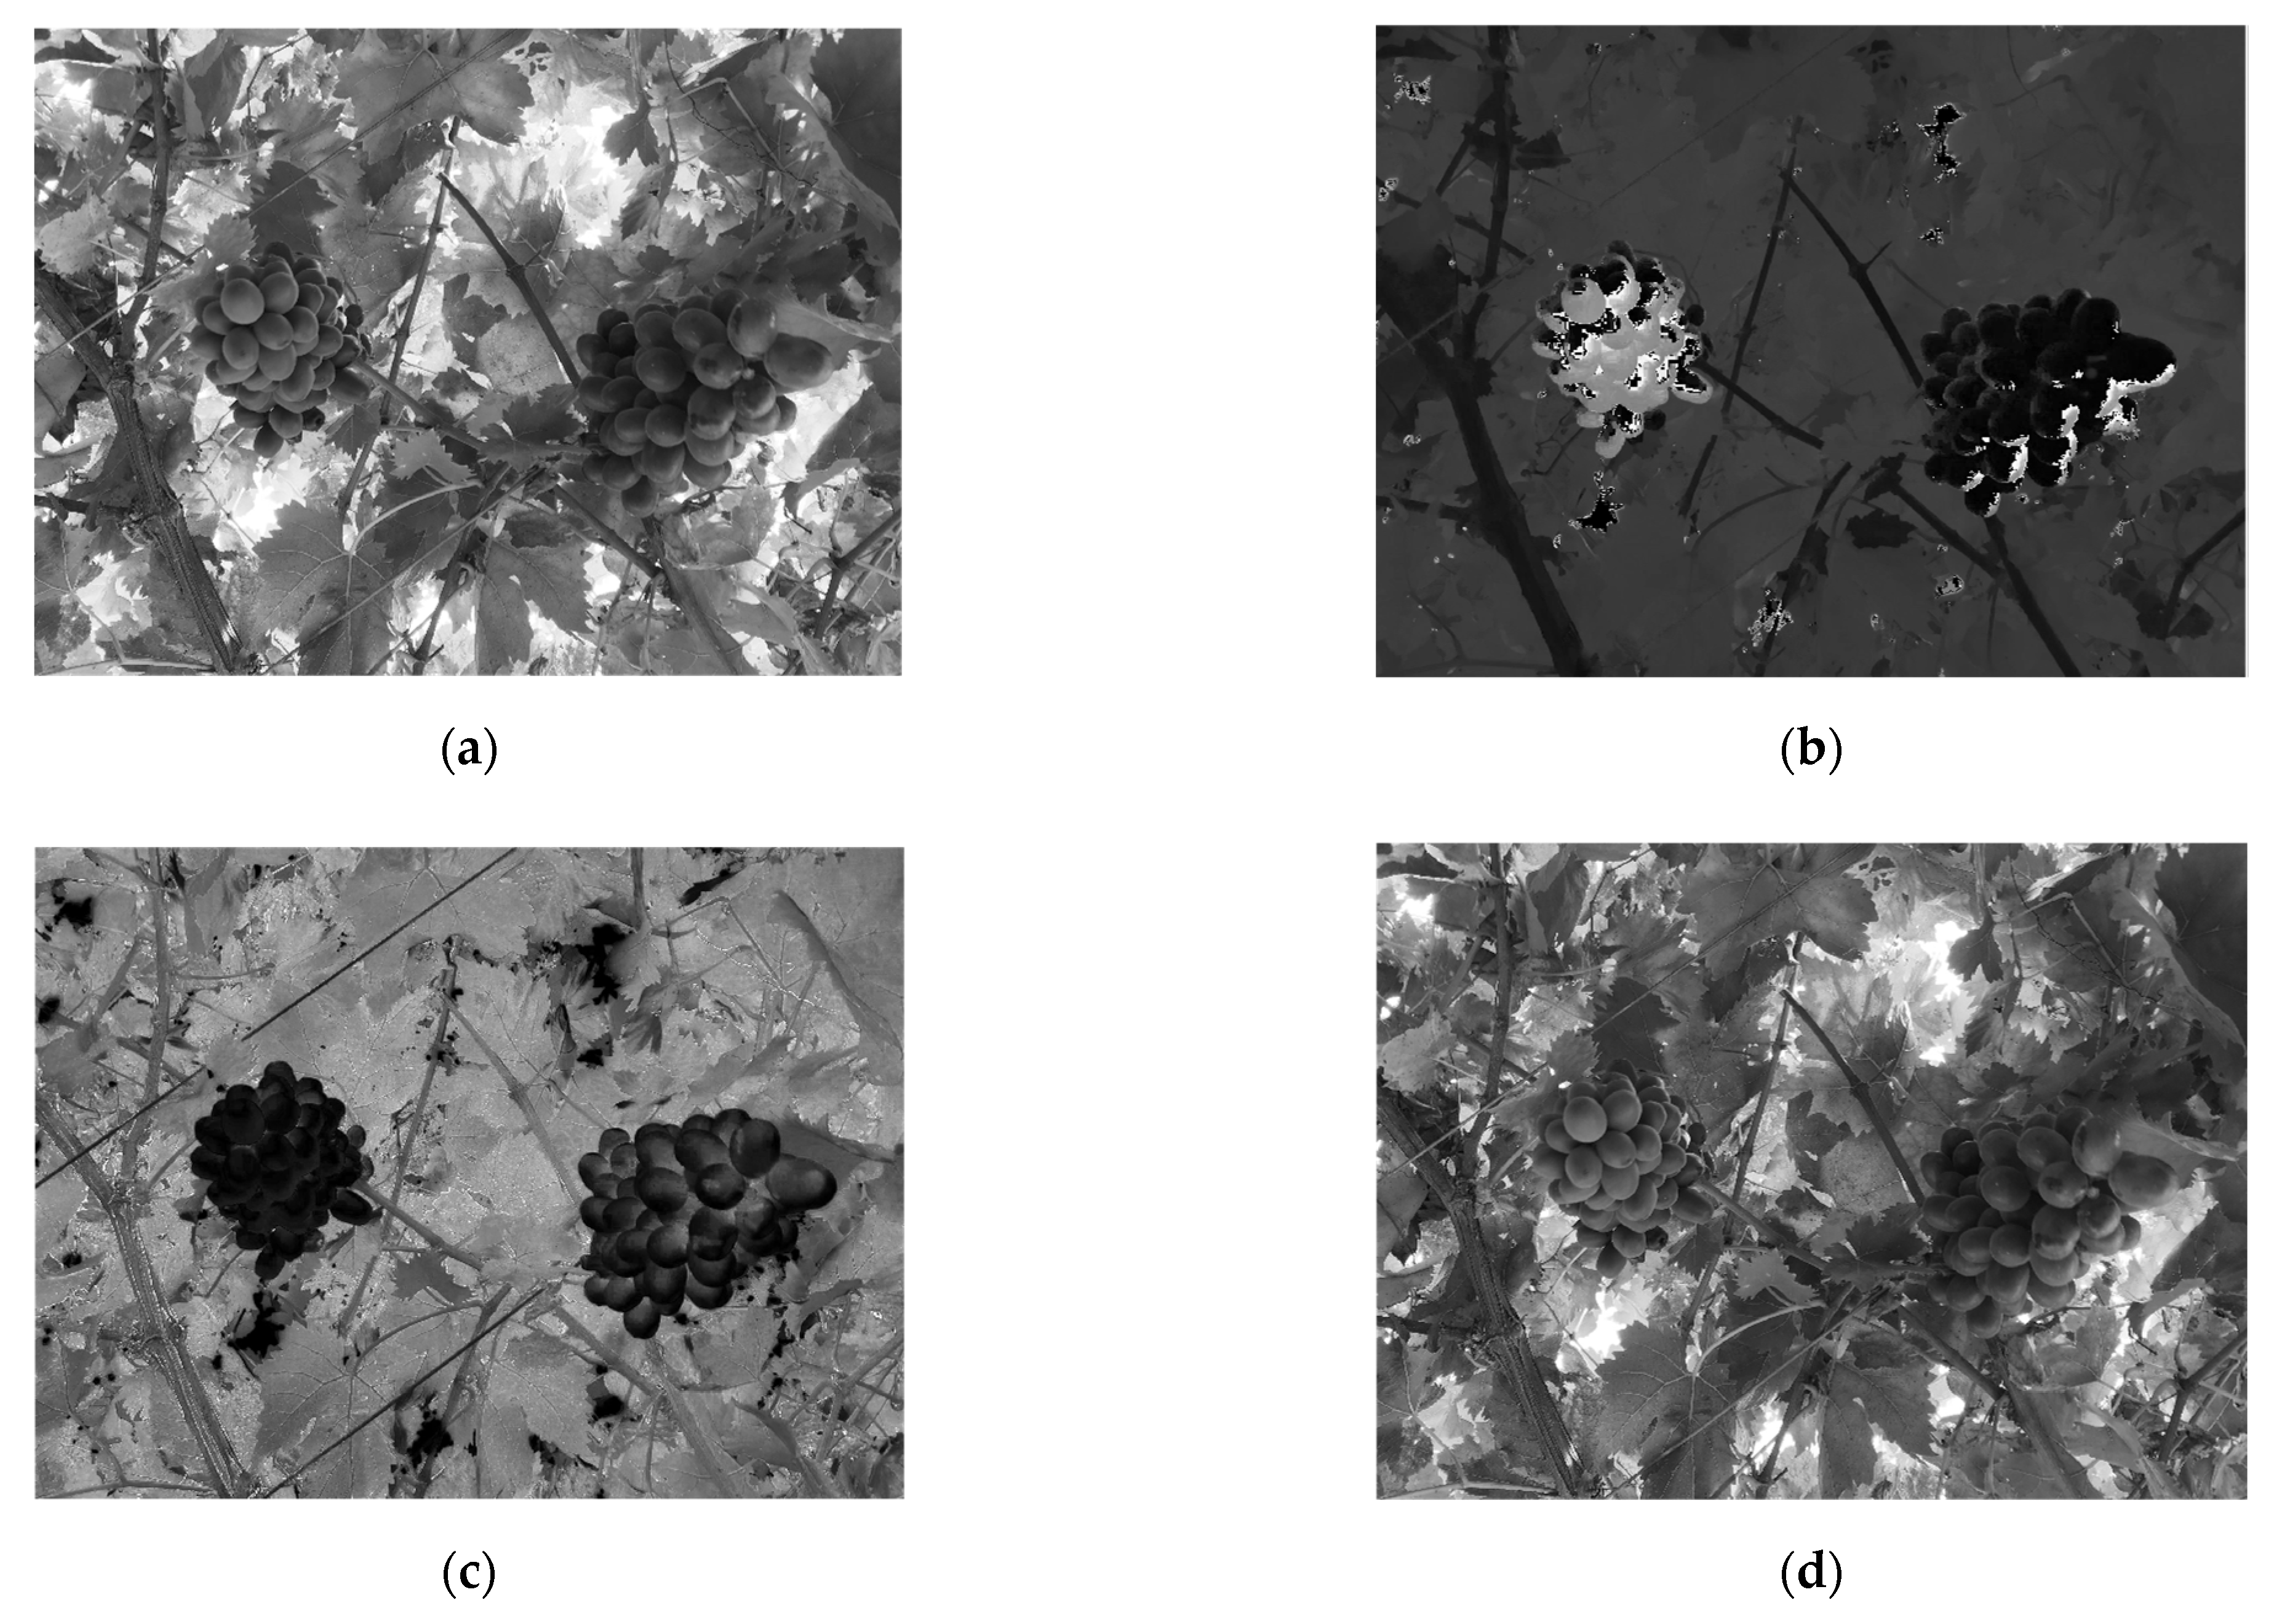
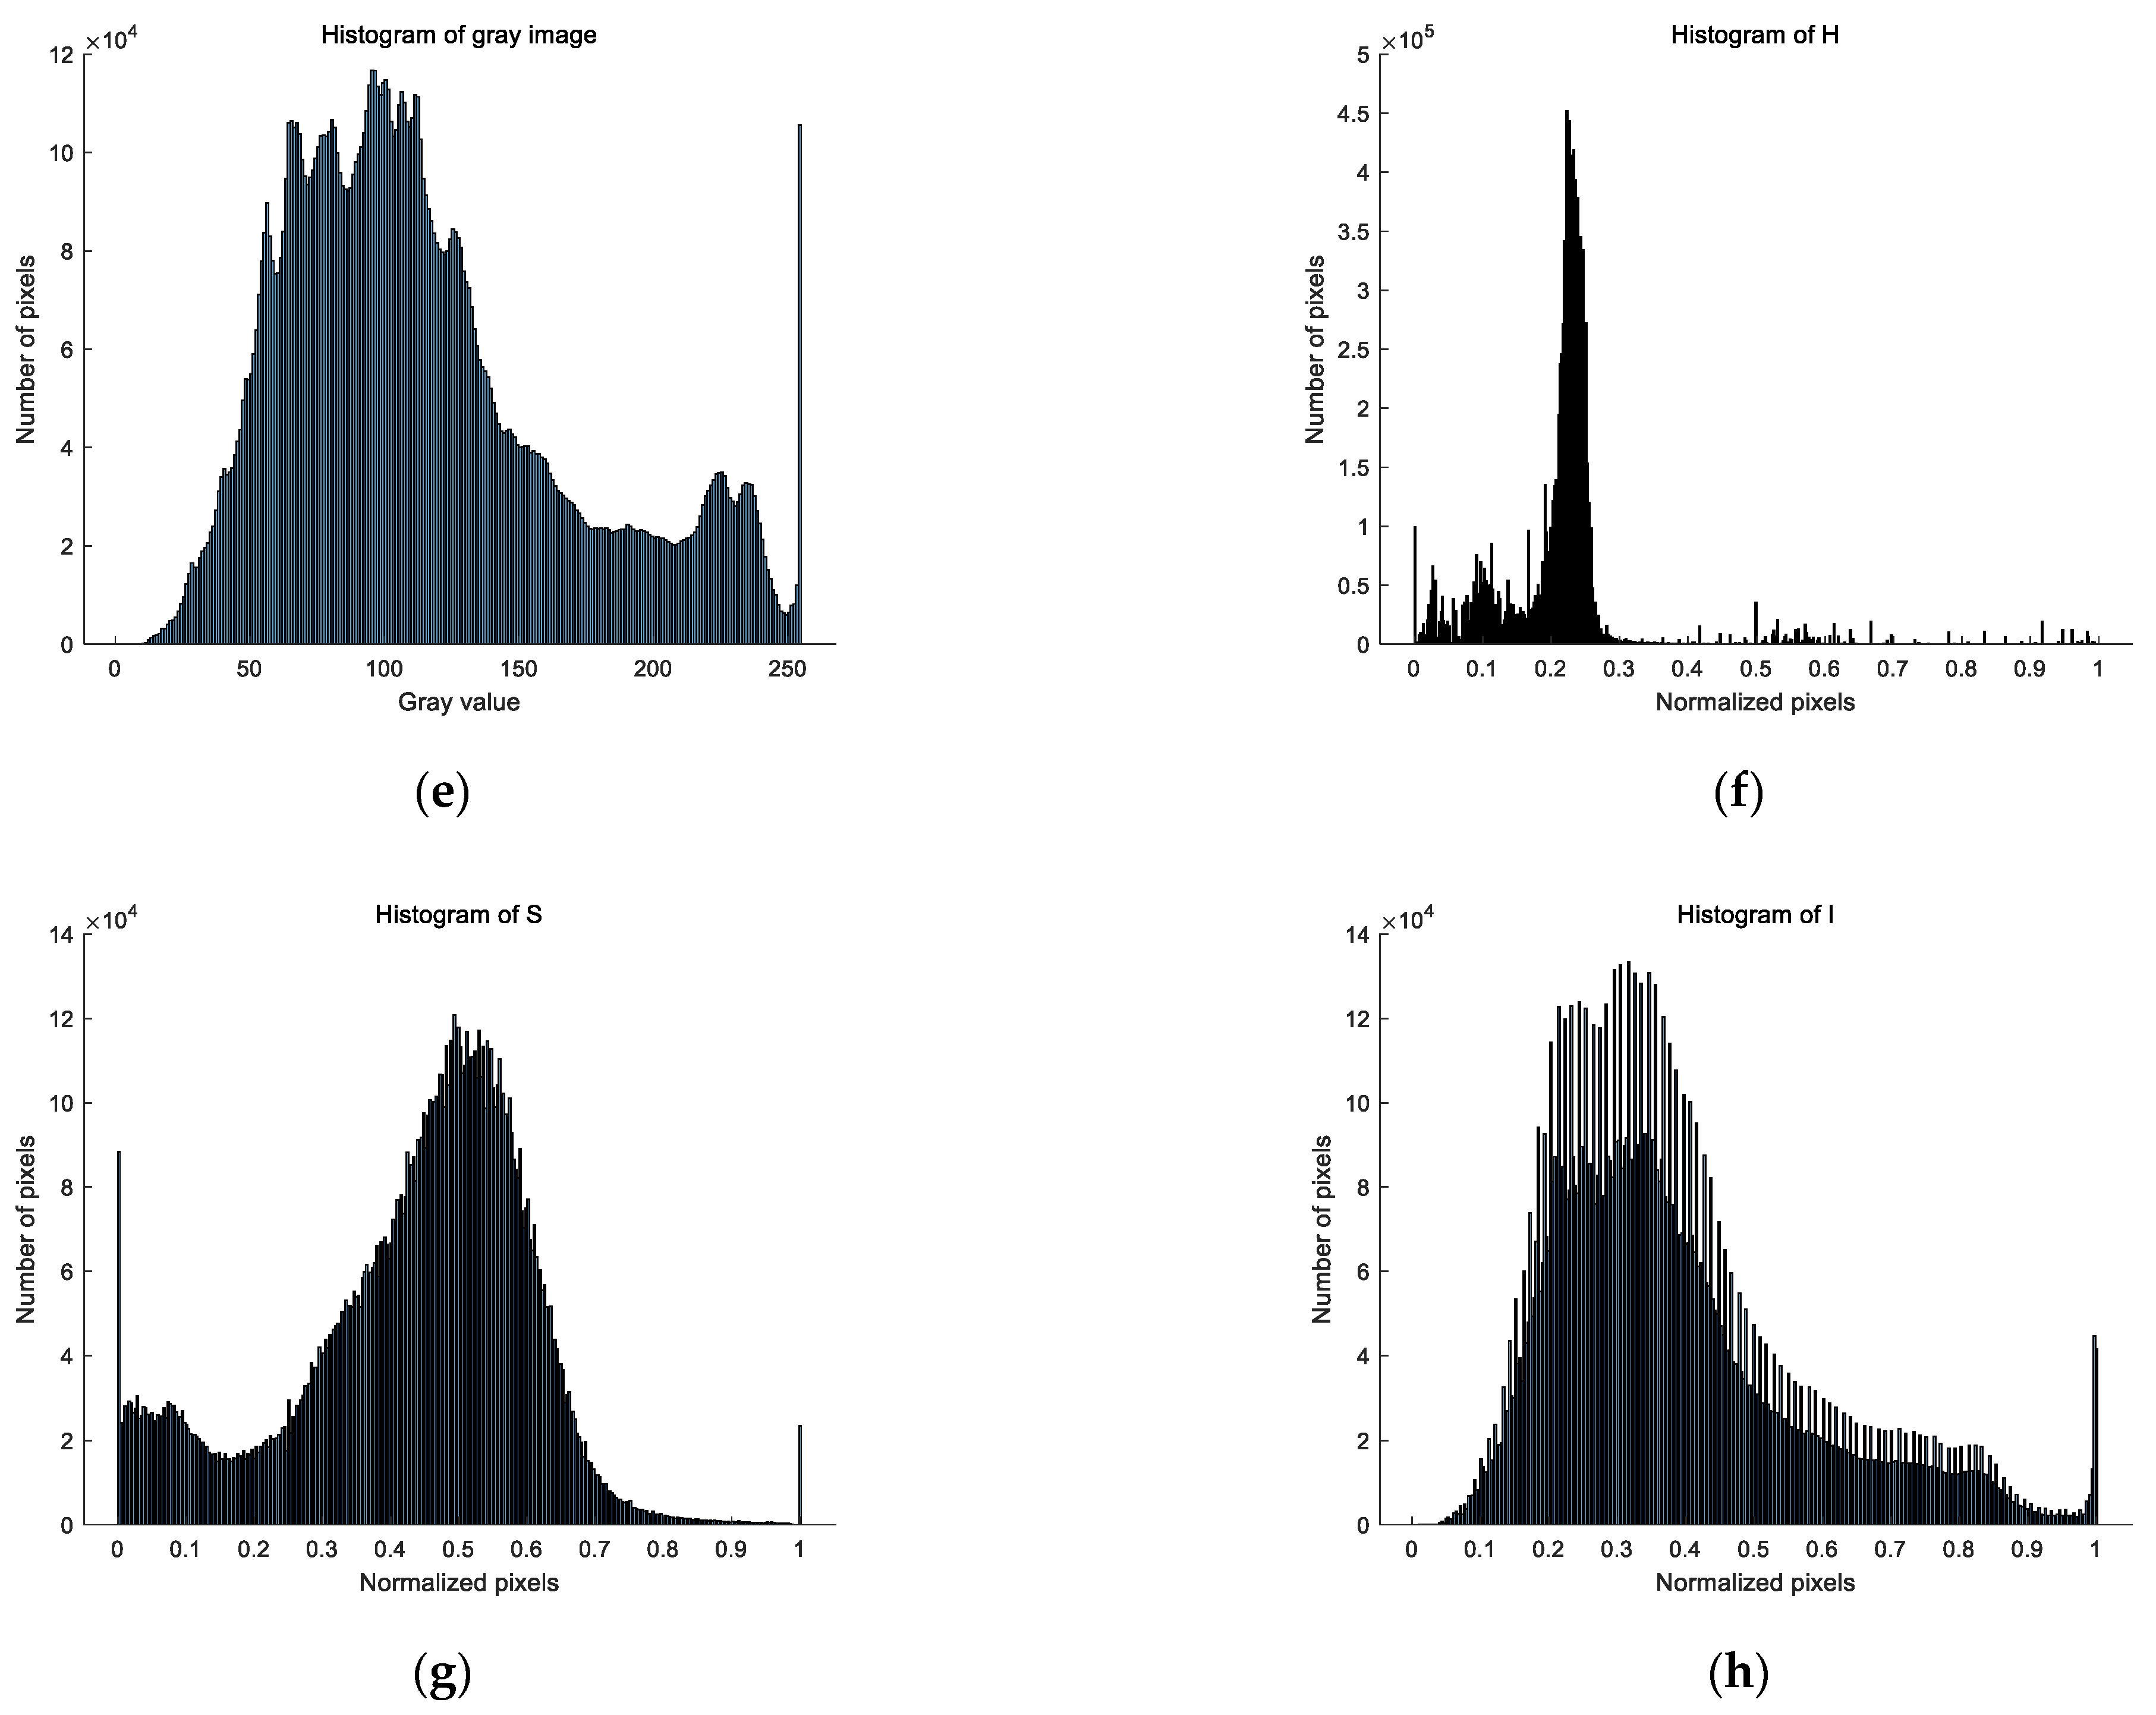
2.3. Image Preprocessing
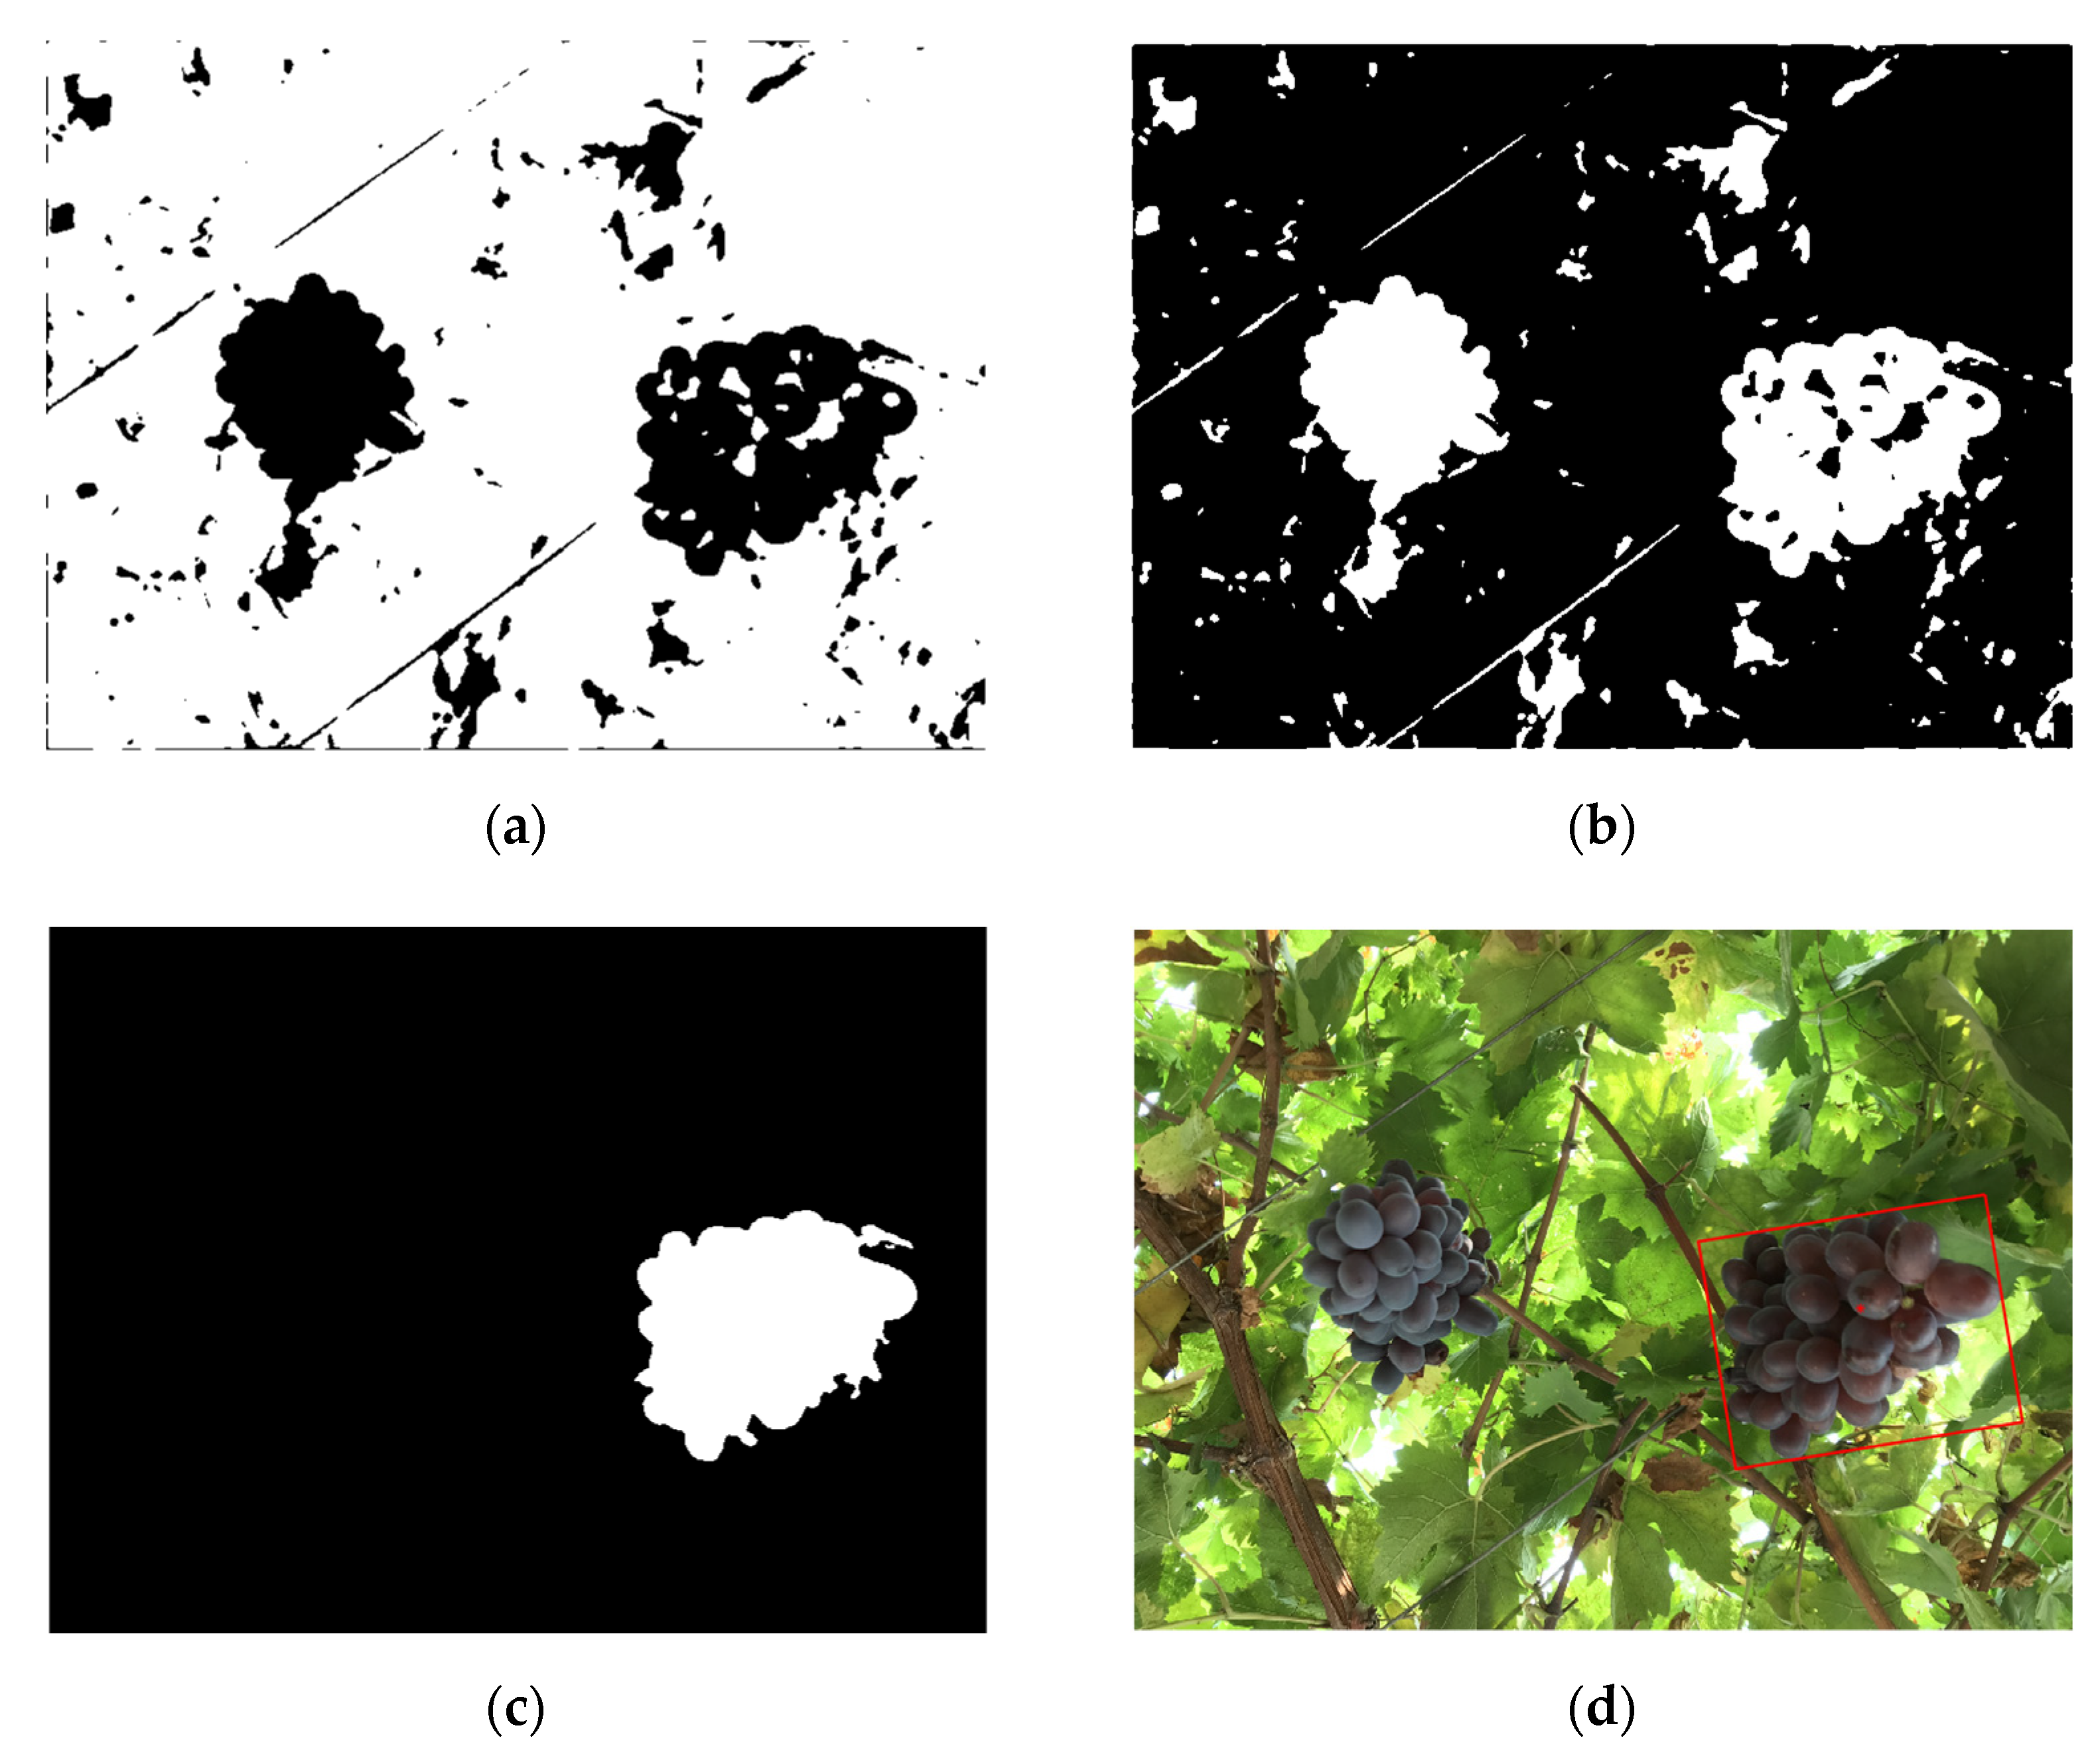
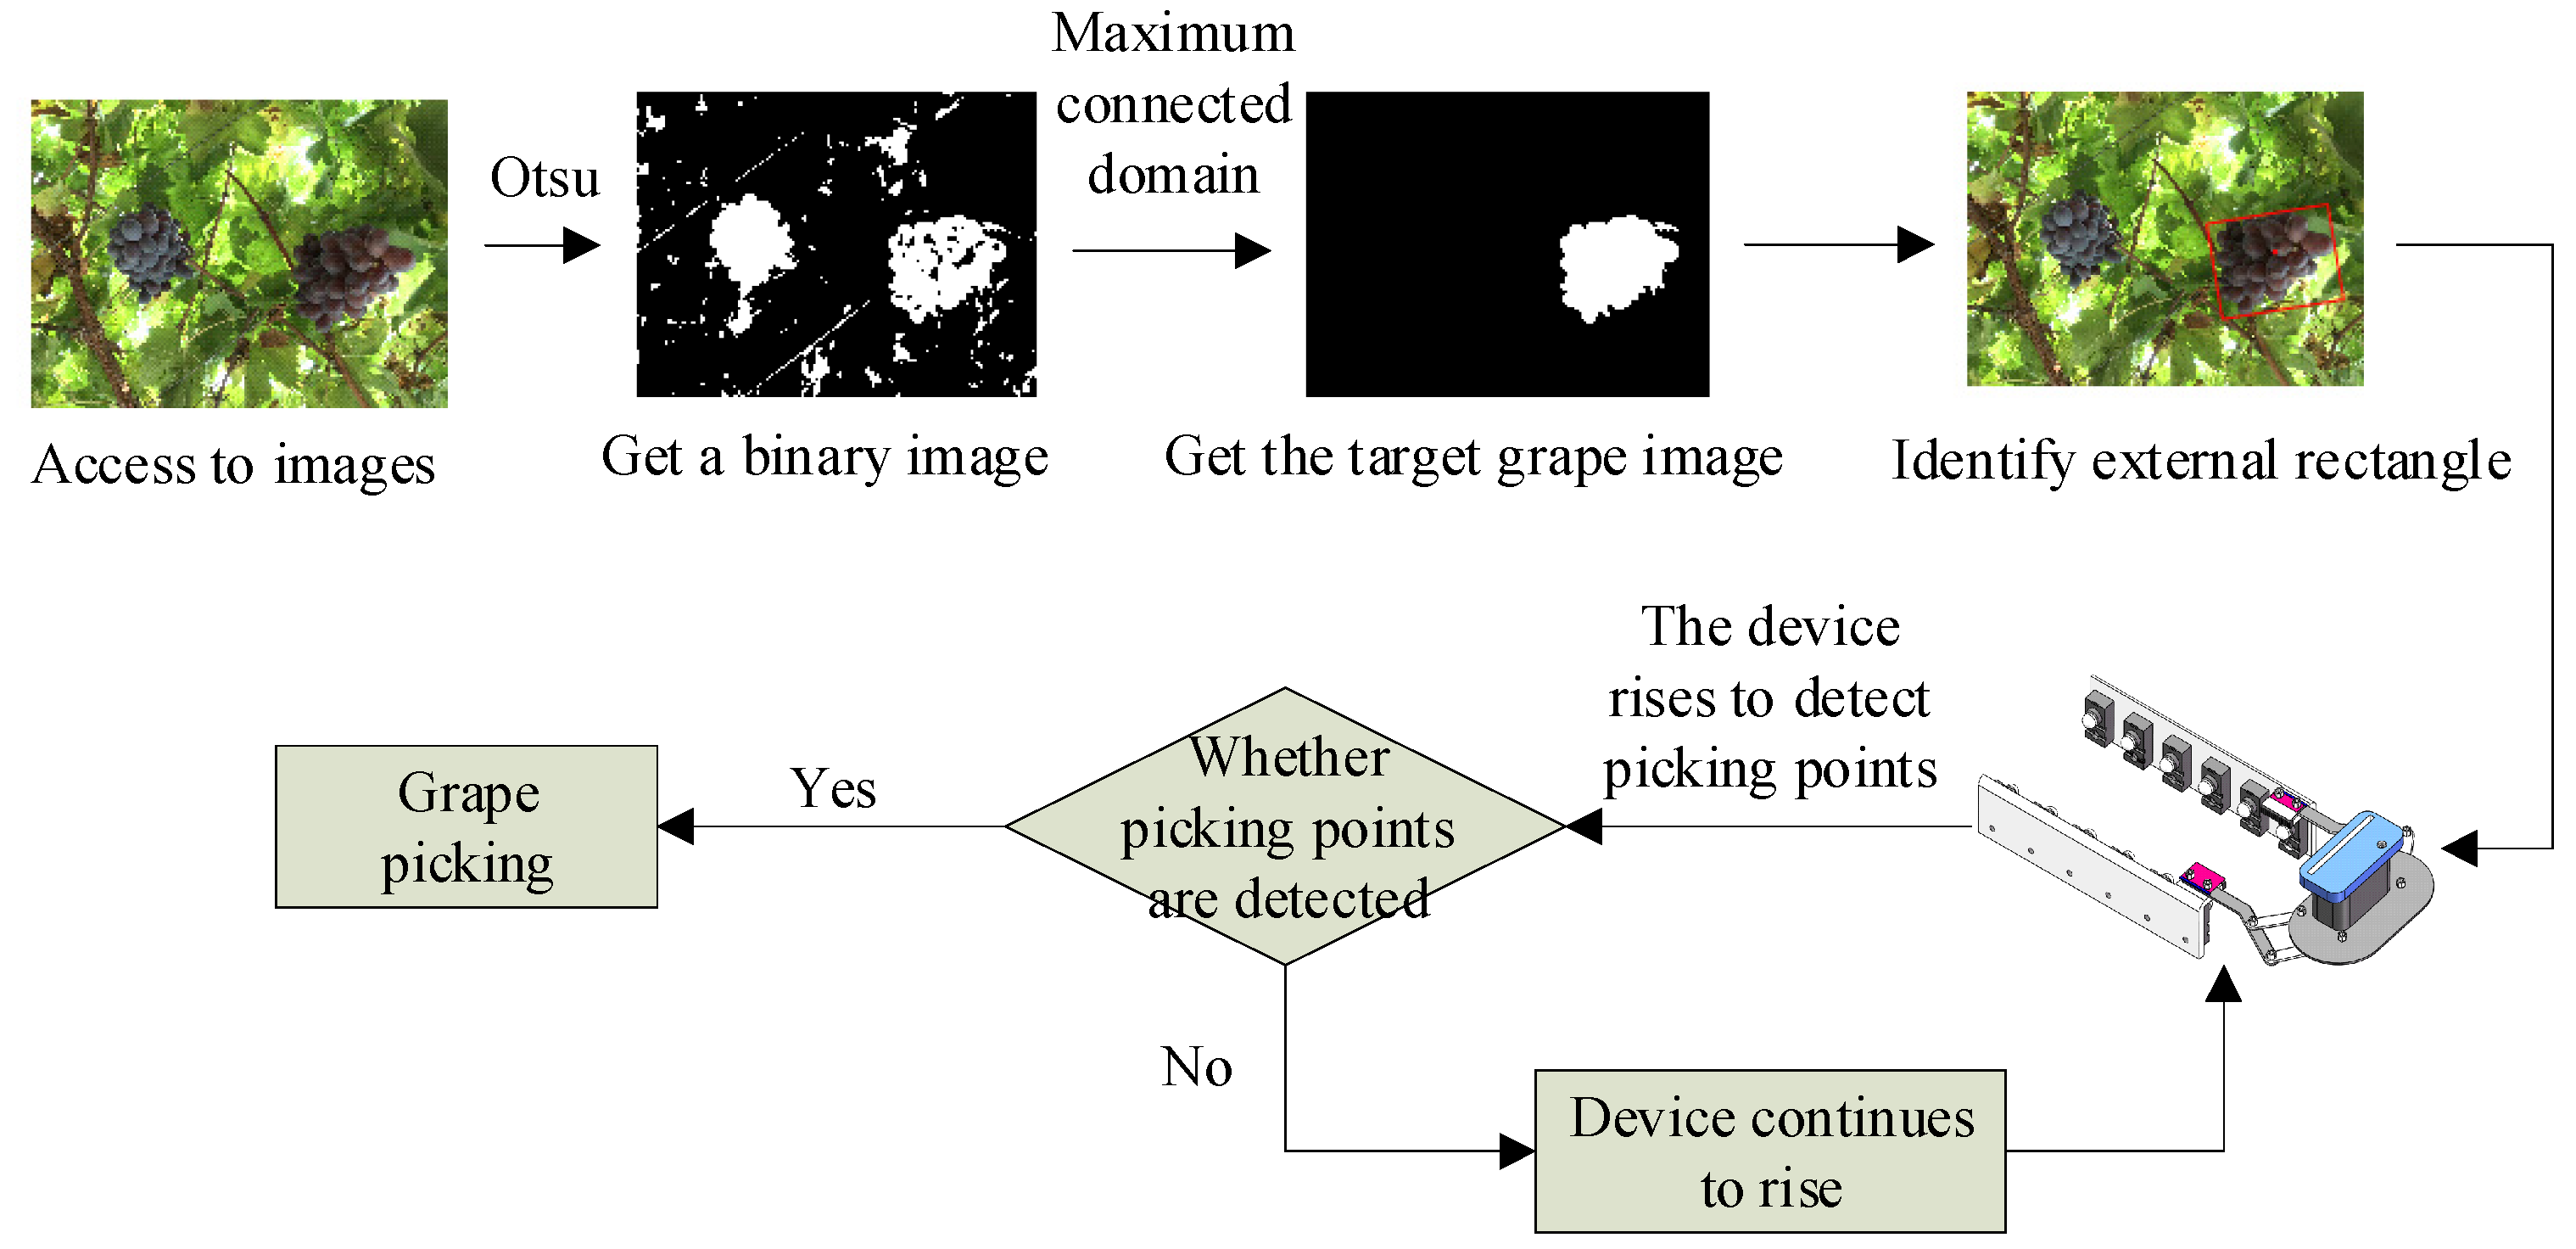
2.4. Recognition and Segmentation of Table Grapes Based on Otsu
3. Results
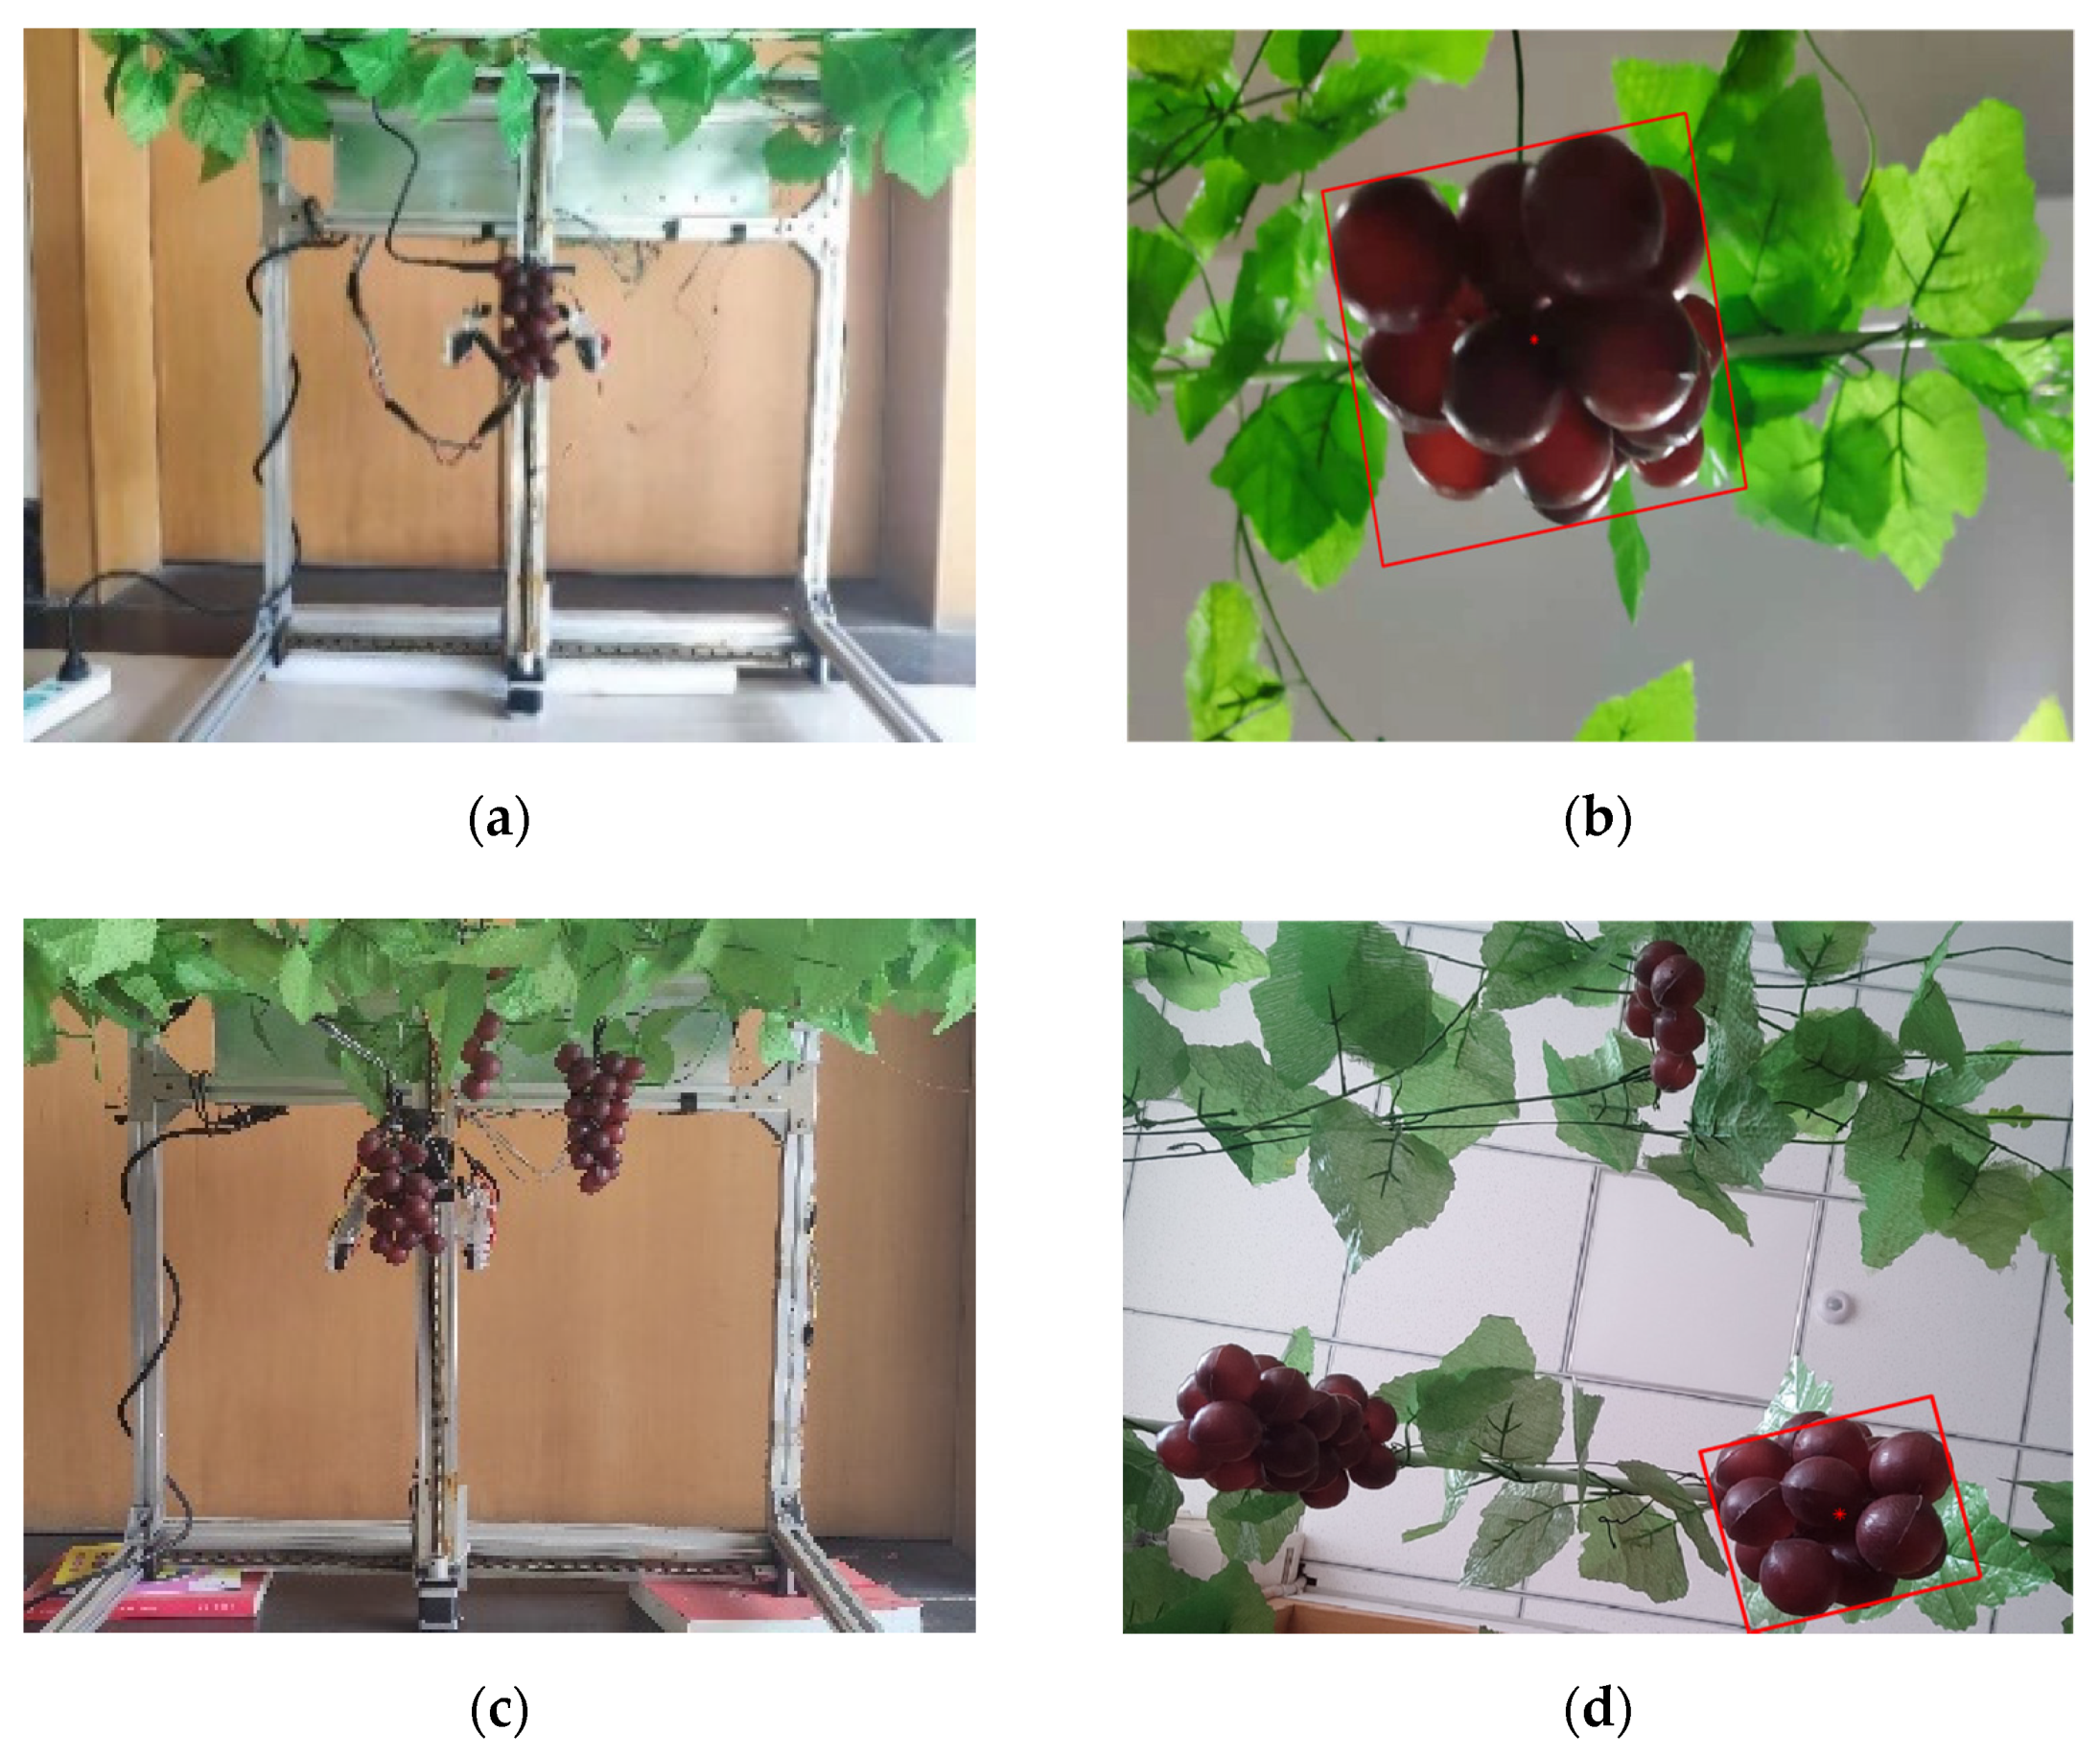
3.1. Design of Detecting Device for Table Grape Picking Point
3.2. Selection of Infrared Tube
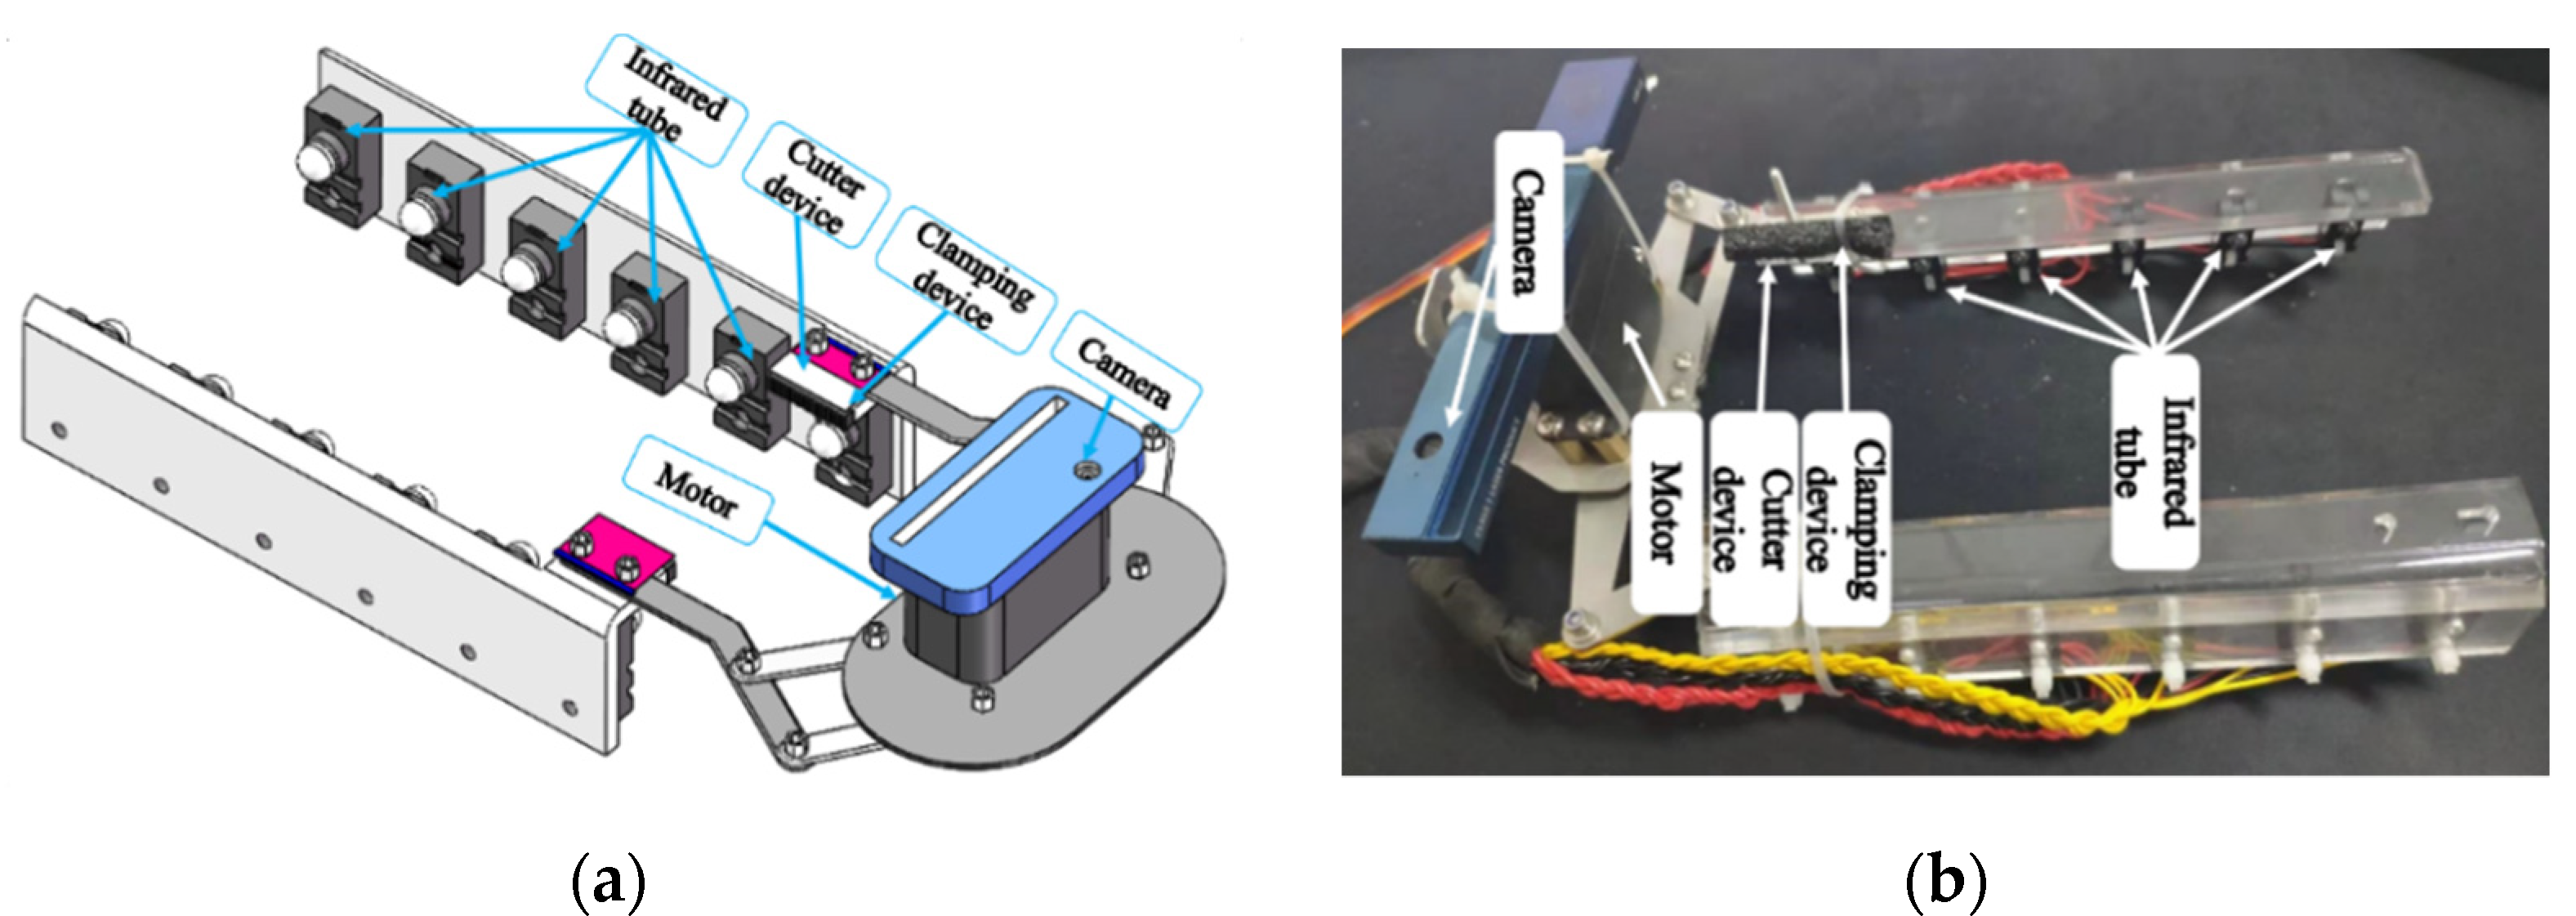
3.3. Structural Design of Picking Point Detection Device
3.4. Location Strategy of Table Grape Picking Point
4. Discussion
5. Conclusions
Author Contributions
Funding
Conflicts of Interest
References
- Wang, Y.-H.; Zhao, P.-K.; Bian, D.-L. Study on the application of fruit-picking system based on computer vision. J. Agric. Mech. Res. 2018, 40, 200–203. [Google Scholar]
- Zhou, H.; Du, Z.-L.; Wu, Z.-Y.; Song, C.; Guo, N.; Lin, Y.-N. Application progress of machine vision technology in the field of modern agricultural equipment. J. Chin. Agric. Mech. 2017, 38, 86–92. [Google Scholar]
- Federica, C.; Susanna, S.; Dennis, J.-M.; Eugenio, C. Comprehension rates of safety pictorials affixed to agricultural machinery among Pennsylvania rural population. Saf. Sci. 2018, 103, 162–171. [Google Scholar]
- Luo, X.-W.; Liao, J.; Zou, X.-J.; Zhang, Z.-G.; Zhou, Z.-Y.; Zang, Y.; Hu, L. Enhancing agricultural mechanization level through information technology. Trans. Chin. Soc. Agric. Eng. 2016, 32, 1–14. [Google Scholar]
- David, T.; Kenneth, G.C.; Pamela, A.M.; Rosamond, N.; Stephen, P. Agricultural sustainability and intensive production practices. Nature 2002, 418, 671–677. [Google Scholar]
- Gongal, A.; Amatya, S.; Karkee, M.; Zhang, Q.; Lewis, K. Sensors and systems for fruit detection and localization: A review. Comput. Electron. Agric. 2015, 116, 8–19. [Google Scholar] [CrossRef]
- Wang, N.; Zhang, N.-Q.; Wang, M.-H. Wireless sensors in agriculture and food industry-Recent development and future perspective. Comput. Electron. Agric. 2005, 50, 1–14. [Google Scholar] [CrossRef]
- Zhu, F.-W.; Yu, F.-H.; Zou, L.-N.; Yue, S.-D. Research status quo and future perspective of agricultural robots. Agric. Eng. 2013, 3, 10–13. [Google Scholar]
- Scarfe, A.-J. Development of an Autonomous Kiwifruit Harvester. Ph.D. Thesis, Massey University, Manawatu, New Zealand, 2012. [Google Scholar]
- Peng, H.-X.; Zou, X.-J.; Guo, A.-X.; Xiong, J.-T.; Chen, Y. Color model analysis and recognition for parts of citrus based on Exploratory Data Analysis. Trans. Chin. Soc. Agric. Mach. 2013, 44, 253–259. [Google Scholar]
- Liu, P.; Zhu, Y.-J.; Zhang, T.-X.; Hou, J.-L. Algorithm for recognition and image segmentation of overlapping grape cluster in natural environment. Trans. Chin. Soc. Agric. Eng. 2020, 36, 161–169. [Google Scholar]
- Luo, L.-F.; Zou, X.-J.; Wang, C.-L.; Chen, X.; Yang, Z.-S.; Situ, M.-W. Recognition method for two overlapping and adjacent grape clusters based on image contour analysis. Trans. Chin. Soc. Agric. Mach. 2017, 48, 15–22. [Google Scholar]
- Xiong, J.-T.; He, Z.-L.; Tang, L.-Y.; Lin, R.; Liu, Z. Visual localization of disturbed grape picking point in non-structural environment. Trans. Chin. Soc. Agric. Mach. 2017, 48, 29–33. [Google Scholar]
- Lei, W.-X.; Lu, J. Visual positioning method for picking point of grape picking robot. J. Jiangsu Agric. Sci. 2020, 36, 1015–1021. [Google Scholar]
- Ning, Z.-T.; Luo, L.-F.; Liao, J.-X.; Wen, H.-J.; Wei, H.-L.; Lu, Q.-H. Recognition and the optimal picking point location of grape stems based on deep learning. Trans. Chin. Soc. Agric. Eng. 2021, 37, 222–229. [Google Scholar]
- Liang, C.-X.; Xiong, J.-T.; Zheng, Z.-H.; Zhuo, Z.; Li, Z.-H.; Chen, S.-M.; Yang, Z.-G. A visual detection method for nighttime litchi fruits and fruiting stems. Comput. Electron. Agric. 2020, 169, 105192. [Google Scholar] [CrossRef]
- Luo, L.-F.; Zou, X.-J.; Ye, M.; Yang, Z.-S.; Zhang, C.; Zhu, N.; Wang, C.-L. Calculation and location of bounding volume of grape for undamaged fruit picking based on binocular stereo vision. Trans. Chin. Soc. Agric. Eng. 2016, 32, 41–47. [Google Scholar]
- Xiang, R. Recognition and Localization for Tomatoes under Open Enviroments Based on Binocular Stereo Vision. Ph.D. Thesis, Zhejiang University, Hangzhou, China, 2013. [Google Scholar]
- Cao, J.-J. Research on Computer Vision System of Agaricus Bisporus Harvesting Robot Based on Deep Learning. Ph.D. Thesis, Zhejiang University, Hangzhou, China, 2021. [Google Scholar]
- Monta, M.; Kondo, N.; Ting, K.-C. End-effectors for tomato harvesting robot. Artif. Intell. Rev. 1998, 12, 11–25. [Google Scholar] [CrossRef]
- Duan, H.-Y.; Li, S.-J.; Yang, H. Design and Clamping Experiment of End Effector for Picking String Tomato. J. Agric. Mech. Res. 2021, 43, 5. [Google Scholar]
- Lu, J.; Liang, X.-F. Design and Motion Simulation of Tomato Fruit Picking End Actuator. J. Agric. Mech. Res. 2020, 42, 88–93. [Google Scholar]
- Weu, B.; He, J.-Y.; Shi, Y.; Jiang, G.-L.; Zang, X.-Y.; Ma, Y. Design and Experiment of Underactuated End-effector for Citrus Picking. Trans. Chin. Soc. Agric. Mach. 2021, 52, 120–128. [Google Scholar]
- Zhang, X.-W.; Ge, Y.; Chen, F.; Yu, P.-F. Design of Three-Finger Pull-Out Safflower Picking End Effector. Mach. Des. Manuf. 2022, 371, 145–149. [Google Scholar]
- Gao, W.; Wang, Z.-H.; Zhao, X.-B.; Sun, F.-M. Robust and efficient cotton contamination detection method based on HSI space. Acta Autom. Sin. 2008, 34, 729–735. [Google Scholar] [CrossRef]
- Zhou, K.; Xie, S.-Y.; Liu, J. Design and implementation of seeder based on infrared emitting diode. J. Agric. Mech. Res. 2014, 36, 151–154. [Google Scholar]


| Types of Algorithms | Mean Running Time/s | Recognition Success Rate | The Test Results |
|---|---|---|---|
| The method proposed in this paper | 0.59 s | 87% |  |
| chromatic aberration method (1.1 × G − B) | 0.60 s | 76% | 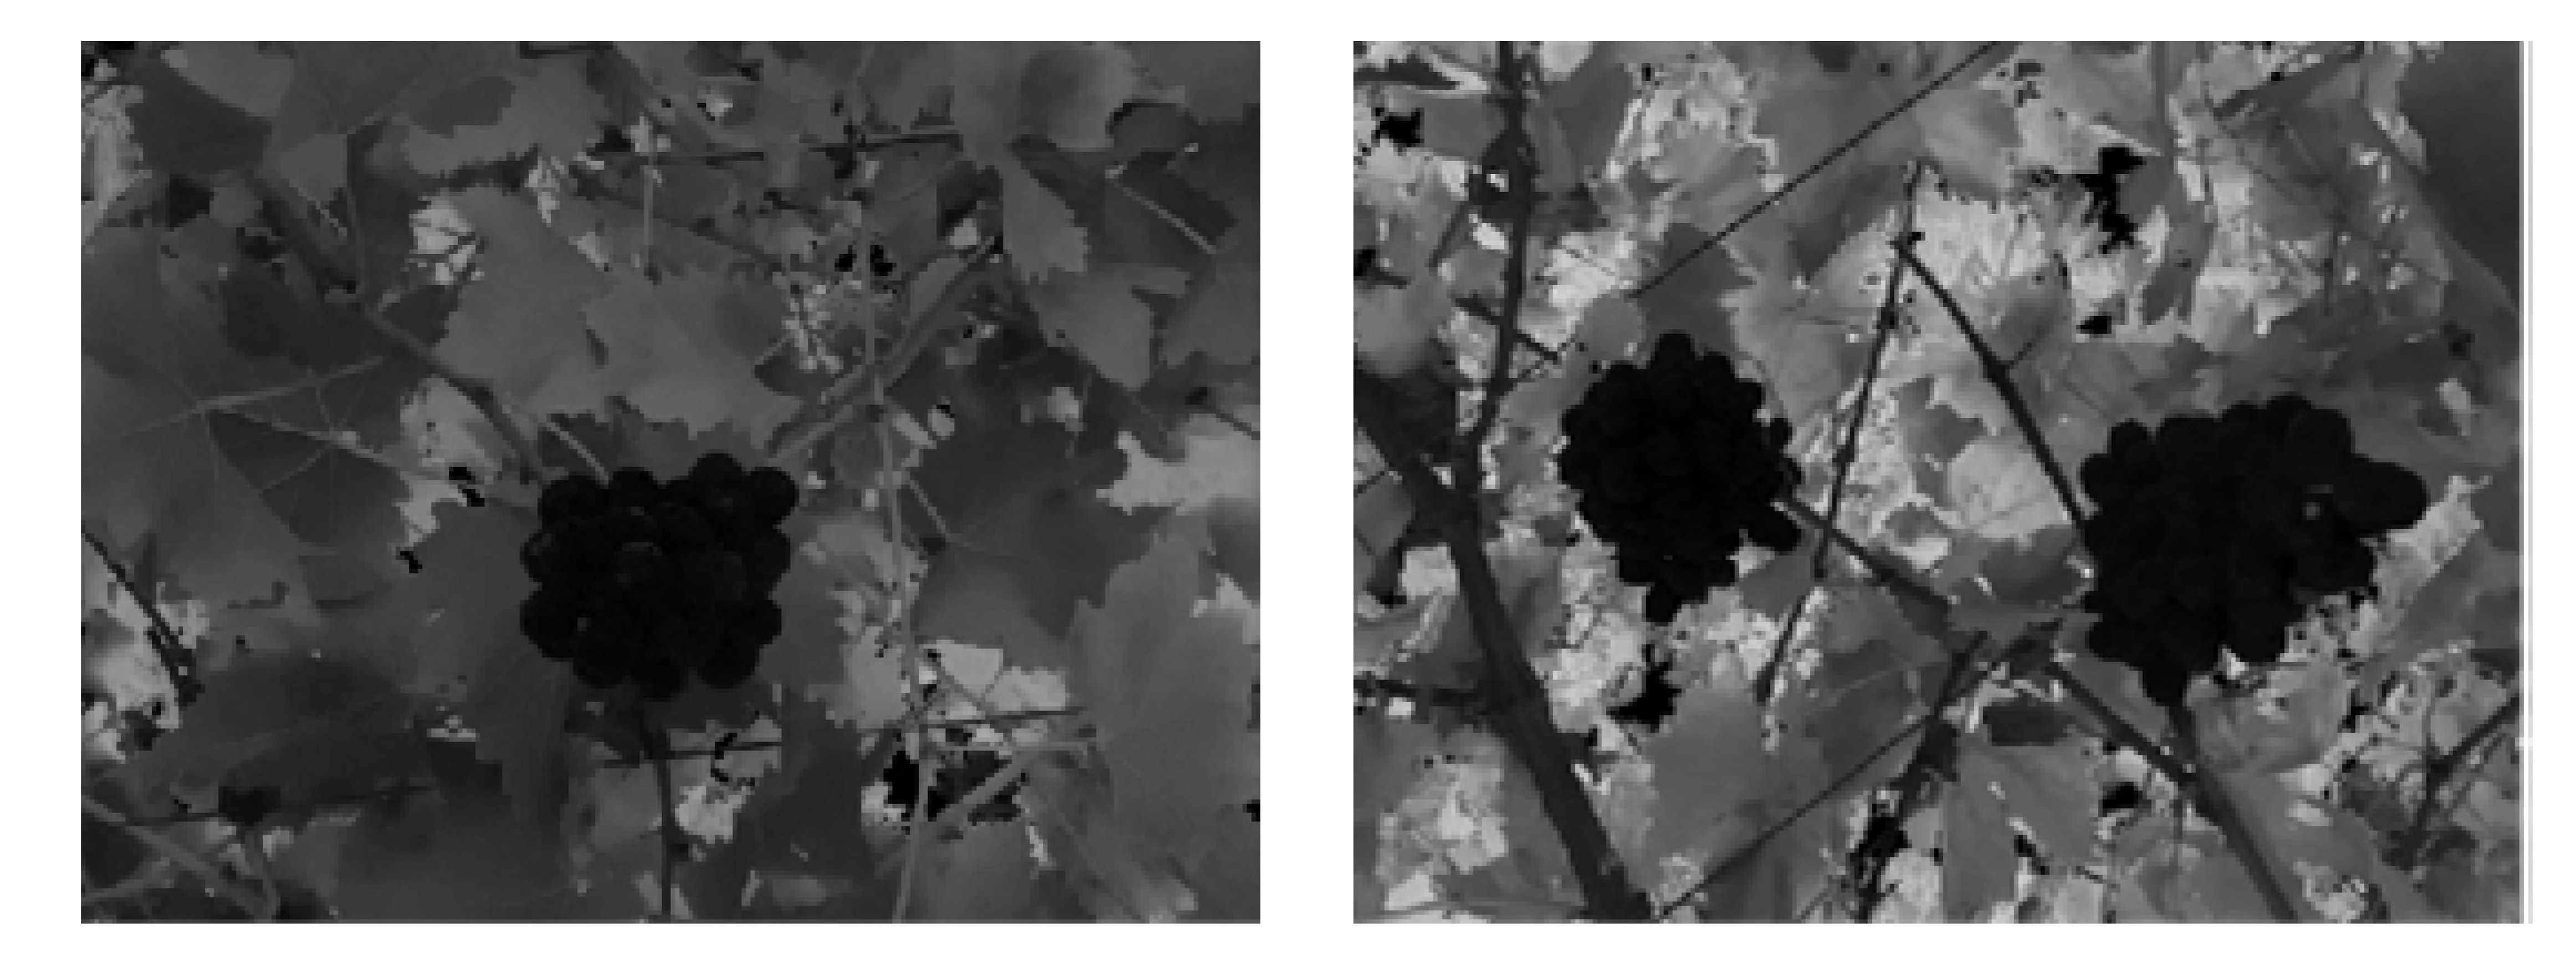 |
| K-means | 3.20 s | 90% |  |
| Name | Length |
|---|---|
| 160 mm | |
| 80 mm | |
| 5.5 mm | |
| 9.8 mm | |
| 4.3 mm |
| Num. | Running Time | Locating Results |
|---|---|---|
| 1 | 0.61 s | Succeed |
| 2 | 0.53 s | Succeed |
| 3 | 0.63 s | Succeed |
| 4 | 0.65 s | Succeed |
| 5 | 0.51 s | Succeed |
| 6 | 0.62 s | Succeed |
| 7 | 0.56 s | Succeed |
| 8 | 0.59 s | Succeed |
| 9 | 0.35 s | Failed |
| 10 | 0.61 s | Succeed |
Publisher’s Note: MDPI stays neutral with regard to jurisdictional claims in published maps and institutional affiliations. |
© 2022 by the authors. Licensee MDPI, Basel, Switzerland. This article is an open access article distributed under the terms and conditions of the Creative Commons Attribution (CC BY) license (https://creativecommons.org/licenses/by/4.0/).
Share and Cite
Zhu, Y.; Zhang, T.; Liu, L.; Liu, P.; Li, X. Fast Location of Table Grapes Picking Point Based on Infrared Tube. Inventions 2022, 7, 27. https://doi.org/10.3390/inventions7010027
Zhu Y, Zhang T, Liu L, Liu P, Li X. Fast Location of Table Grapes Picking Point Based on Infrared Tube. Inventions. 2022; 7(1):27. https://doi.org/10.3390/inventions7010027
Chicago/Turabian StyleZhu, Yanjun, Tongxun Zhang, Lipeng Liu, Ping Liu, and Xiang Li. 2022. "Fast Location of Table Grapes Picking Point Based on Infrared Tube" Inventions 7, no. 1: 27. https://doi.org/10.3390/inventions7010027