Article

Pressure Capacity Assessment of L-PBF-Produced Microchannel Heat Exchangers

School of Intelligent Manufacturing Ecosystem, XJTLU Entrepreneur College (Taicang), Xi’an Jiaotong-Liverpool University, Suzhou 215000, China
*
Author to whom correspondence should be addressed.
These authors contributed equally to this work.
Inventions 2024, 9(5), 97; https://doi.org/10.3390/inventions9050097
Submission received: 14 July 2024 / Revised: 30 August 2024 / Accepted: 3 September 2024 / Published: 6 September 2024

Abstract

:
Laser powder bed fusion (L-PBF) manufacturing technology is an emerging field of research that focuses on evaluating constraints in printed products. This study highlights the importance of considering various factors, such as mechanical properties and support structures, during the design phase, particularly in the context of microchannel heat exchangers where all limiting factors are critical. This paper presents a methodology for analyzing channel pressure limitations and examines the impact of pipe porosity on the loss of mechanical properties. A combination of simulation experiments and pressure capacity tests is used to elucidate the pressure distribution characteristics of microchannel flat tubes and their true pressure capacity. This study also explores potential methods for improving the performance of L-PBF-printed microchannel flat tubes. The results and the development of the experimental setup are summarized.

1. Introduction

Motivation, Aims, and Objective

The key advantage of L-PBF lies in its ability to produce components with complex internal channels and fine features, allowing for enhanced surface area-to-volume ratios and more efficient heat exchange. Precise control over material deposition facilitates the optimization of channel dimensions and shapes, improving thermal performance. This flexibility allows for rapid prototyping and iterative testing, enabling engineers to quickly produce and evaluate multiple design variations, accelerating development and leading to innovative heat exchanger solutions. L-PBF technique introduces a novel approach to constructing microchannel heat exchangers (MCHX) for air conditioners. MCHX is highly versatile and can be applied across a wide range of industries due to its superior thermal performance and compact design. In the automotive industry, MCHXs are used in vehicle radiators, intercoolers, and air conditioning systems to improve cooling efficiency and reduce fuel consumption. In the aerospace sector, their lightweight and efficient heat transfer capabilities are crucial for thermal management in aircraft and spacecraft, where space and weight constraints are critical. The heating, ventilation, and air conditioning industry also benefits from MCHXs, as they enhance the energy efficiency of heating and cooling systems in residential, commercial, and industrial buildings [1,2]. In the electronics industry, MCHXs dissipate heat from high-performance computing systems and power electronics, ensuring reliable operation and extending the lifespan of components. Additionally, MCHXs are utilized in renewable energy systems, such as solar thermal collectors and geothermal heat pumps, to maximize energy capture and utilization. Their ability to handle high pressures and temperatures makes them suitable for use in chemical processing and refrigeration industries as well. If L-PBF-printed MCHXs are well developed, they could significantly advance all these industries by enabling the production of highly efficient, customized heat exchangers with complex geometries that are not feasible with traditional manufacturing methods. This would lead to improved thermal management solutions, increased energy efficiency, and enhanced performance across various applications, driving innovation and growth in multiple sectors. However, L-PBF faces several constraints and limitations in this area. For example, structures printed using L-PBF often exhibit significant defects that affect their mechanical properties and deformation behavior [3]. Specifically, L-PBF-fabricated structures tend to have higher porosity levels compared to those produced by traditional manufacturing methods [4,5]. This increased porosity can negatively impact the mechanical properties of the printed objects, resulting in reduced structural integrity [6]. The porosity within the printed structures, which is a common defect arising from the L-PBF process, can make the material less dense and more porous than traditionally manufactured components. This can affect the material’s strength and its ability to withstand pressure without leaking. When utilizing ordinary MCHX, it is imperative to assess the pressure capacity of the channels before considering any enhancement treatments. Conducting burst tests is a fundamental process for ensuring compliance with safety standards. Burst or blasting experiments are commonly used to measure the pressure capacity of traditionally manufactured MCHX, particularly in high-pressure applications such as refrigeration systems, where the refrigerant undergoes phase changes and may subject the channels to extremely high-pressure conditions [7,8]. Thorough testing of the pressure capacity of these microchannels is essential because failure due to inadequate pressure tolerance could result in catastrophic consequences. However, performing these experiments on L-PBF-printed MCHXs may not be suitable due to equipment limitations and the variable properties of the materials involved. Currently, there are limited experimental methodologies available for evaluating the pressure capacity of L-PBF-printed MCHXs.
Considering the potential defects associated with L-PBF-produced MCHXs, conducting burst tests may not always be necessary. Instead, prioritizing the development of reliable leakage measurement techniques could prove more beneficial. This approach would enable the accurate identification and evaluation of leakages, leading to more targeted and effective solutions for ensuring the integrity of MCHXs. Consequently, developing a straightforward experimental method to measure the pressure capacity of L-PBF-printed MCHXs is crucial. This would facilitate a comprehensive understanding of their performance and ensure that they meet the required standards for their intended applications.

2. Literature Review

2.1. Introduction to MCHX

The multi-port extrusion tube, also referred to as the Acer microchannel aluminum flat tube or microchannel tube, is a highly refined product known for its beneficial properties. These properties include low energy consumption, high performance, minimal space, and weight requirements, and excellent resistance to corrosion and pressure [9]. Moreover, the microchannel tube offers high recycling value, reduced pressure drops, and quiet operation with a low refrigerant fill requirement. In addition to these performance benefits, an all-aluminum brazed heat exchanger using the microchannel tube also shows enhanced corrosion resistance. This type of heat exchanger, featuring microchannels, is referred to as MCHX. Microchannel tubes are primarily used in applications such as condensers, evaporators, and heater cores. Figure 1 illustrates a simple appearance of this MCHX, highlighting its height, length, and width. The key components shown include the header, plate tube with microchannels, and louvered fin.

2.2. Introduction to L-PBF

L-PBF represents a sophisticated additive manufacturing technique that employs high-power lasers to selectively melt and fuse powdered materials in a layer-by-layer manner, enabling the creation of intricate and high-precision components. The L-PBF process is notable for its capability to produce parts with complex geometries that are often challenging to achieve in conventional manufacturing. Typically, designers must consider the limitations of mass production, leading to the need to simplify or break down intricate designs into smaller, more manageable components [10,11,12,13]. However, L-PBF overcomes these constraints, allowing for the direct manufacturing of complex, intricate shapes as a single unit. L-PBF is predominantly used for metals and alloys, making it especially valuable in sectors such as aerospace, medical devices, and mass and heat transfer, where there is a significant demand for customized, lightweight, and high-strength components.
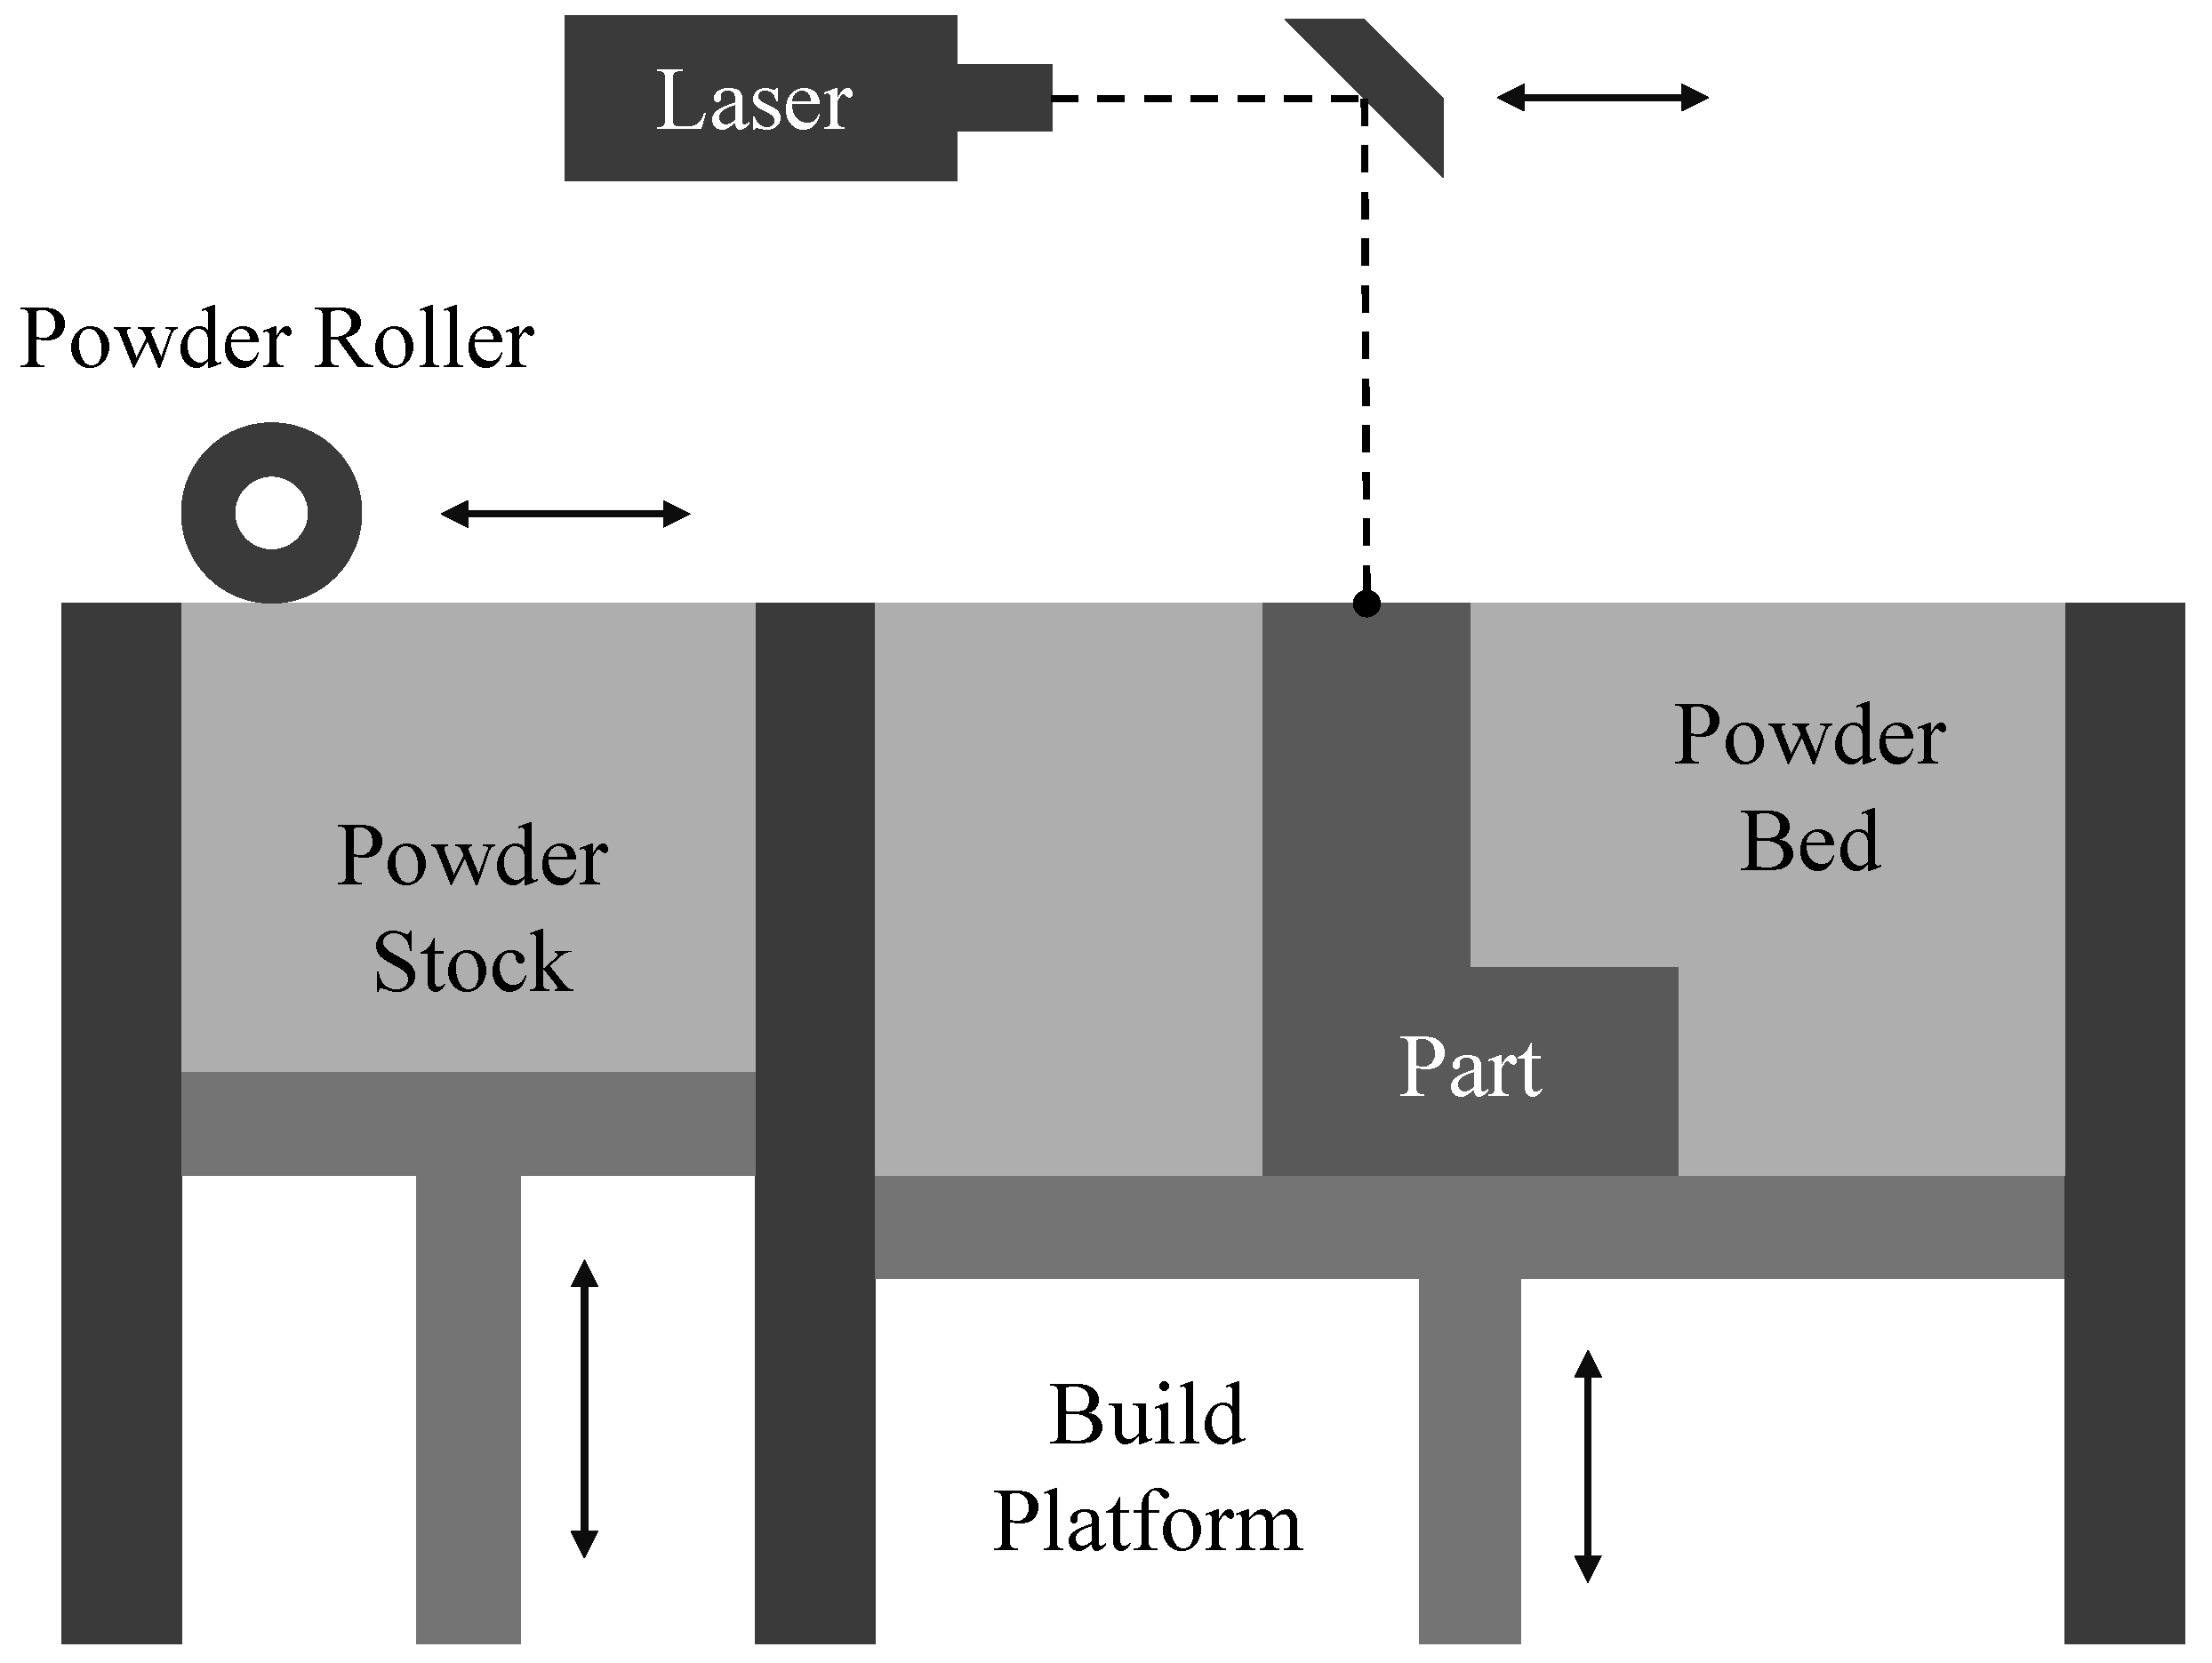
L-PBF techniques, including those utilizing lasers or electron beams, melt and fuse powder materials to fabricate parts. In all L-PBF methods, a device such as a roller or a blade spreads the powder over previous layers. Fresh powder is supplied from a hopper or reservoir adjacent to the build platform. Figure 2 illustrates a basic working principle of L-PBF. In the L-PBF process, a thin layer of material, typically around 0.1 mm thick, is initially spread over the build platform. A laser then fuses the first layer or cross-section of the model. Following this, a new layer of powder is spread over the previous one using a roller. The laser continues to fuse subsequent layers or cross-sections, building the model layer by layer. This process repeats until the entire model is completed. Throughout the procedure, loose, infused powder remains in place around the model, which is later removed during post-processing to reveal the finished product.

2.3. Introduction to Powder Material AlSi10Mg Properties

Parts made with L-PBF often have reduced structural integrity, making it crucial to evaluate material properties for applications like MCHX. Factors such as orientation, platform temperature, post-process heating, and designation affect metal tensile stress. Zhang’s experiment on tensile stress revealed that the printing direction significantly influences material properties [14]. Table 1 shows device settings and test results. The tensile strength of approximately 509 MPa is lower than that of forged samples, likely due to microscopic defects and non-uniform shapes in L-PBF parts, which also exhibit an elastic modulus of about 73 GPa, half that of forged samples. Kempen’s research highlights that the orientation of samples can affect the outcomes of uni-axial tensile tests [15]. According to Kempen’s findings, achieving the theoretical bulk density of 2.68 g/cm3 for the material poses significant challenges. Although certain adjustments can allow an approximation of  99.8 %  of this theoretical density, the tensile strength of AlSi10Mg alloy produced via L-PBF is generally lower compared to that of cast products.
The mechanical properties of structures produced using L-PBF techniques are often lower compared to those fabricated through traditional methods [16]. This reduction in mechanical performance is closely linked to the printing settings and various critical parameters, such as laser power, scanning speed, and material composition. Given these dependencies, it is crucial to develop an effective evaluation method for assessing the mechanical properties of L-PBF-printed parts. Such a method will help ensure that the printed components meet the required standards for their intended applications, providing a comprehensive understanding of their structural integrity and performance capabilities. The presence of porosity in L-PBF-printed MCHX can adversely affect their mechanical properties and diminish their heat transfer efficiency [17]. In additive manufacturing, porosity appears in specific shapes, each associated with different mechanisms inherent to the additive process used. The formation of porosity in L-PBF is primarily influenced by process parameters [18]. Porosity reduces the load-bearing area, thereby serving as a potential initiation point for cracks. Nevertheless, minor porosity levels in L-PBF, even approaching  1 % , do not substantially compromise the static strength of components [19]. However, this increased porosity can lead to reduced pressure capacity and a heightened risk of leakage within the tube channels. Given that MCHXs in air conditioners require high-pressure capacities [20], it is essential to accurately assess both the maximum pressure capacity and the incidence of any leakage events to ensure their reliability and performance.

3. Experiment Design and Methodology

3.1. Experiment Workflow

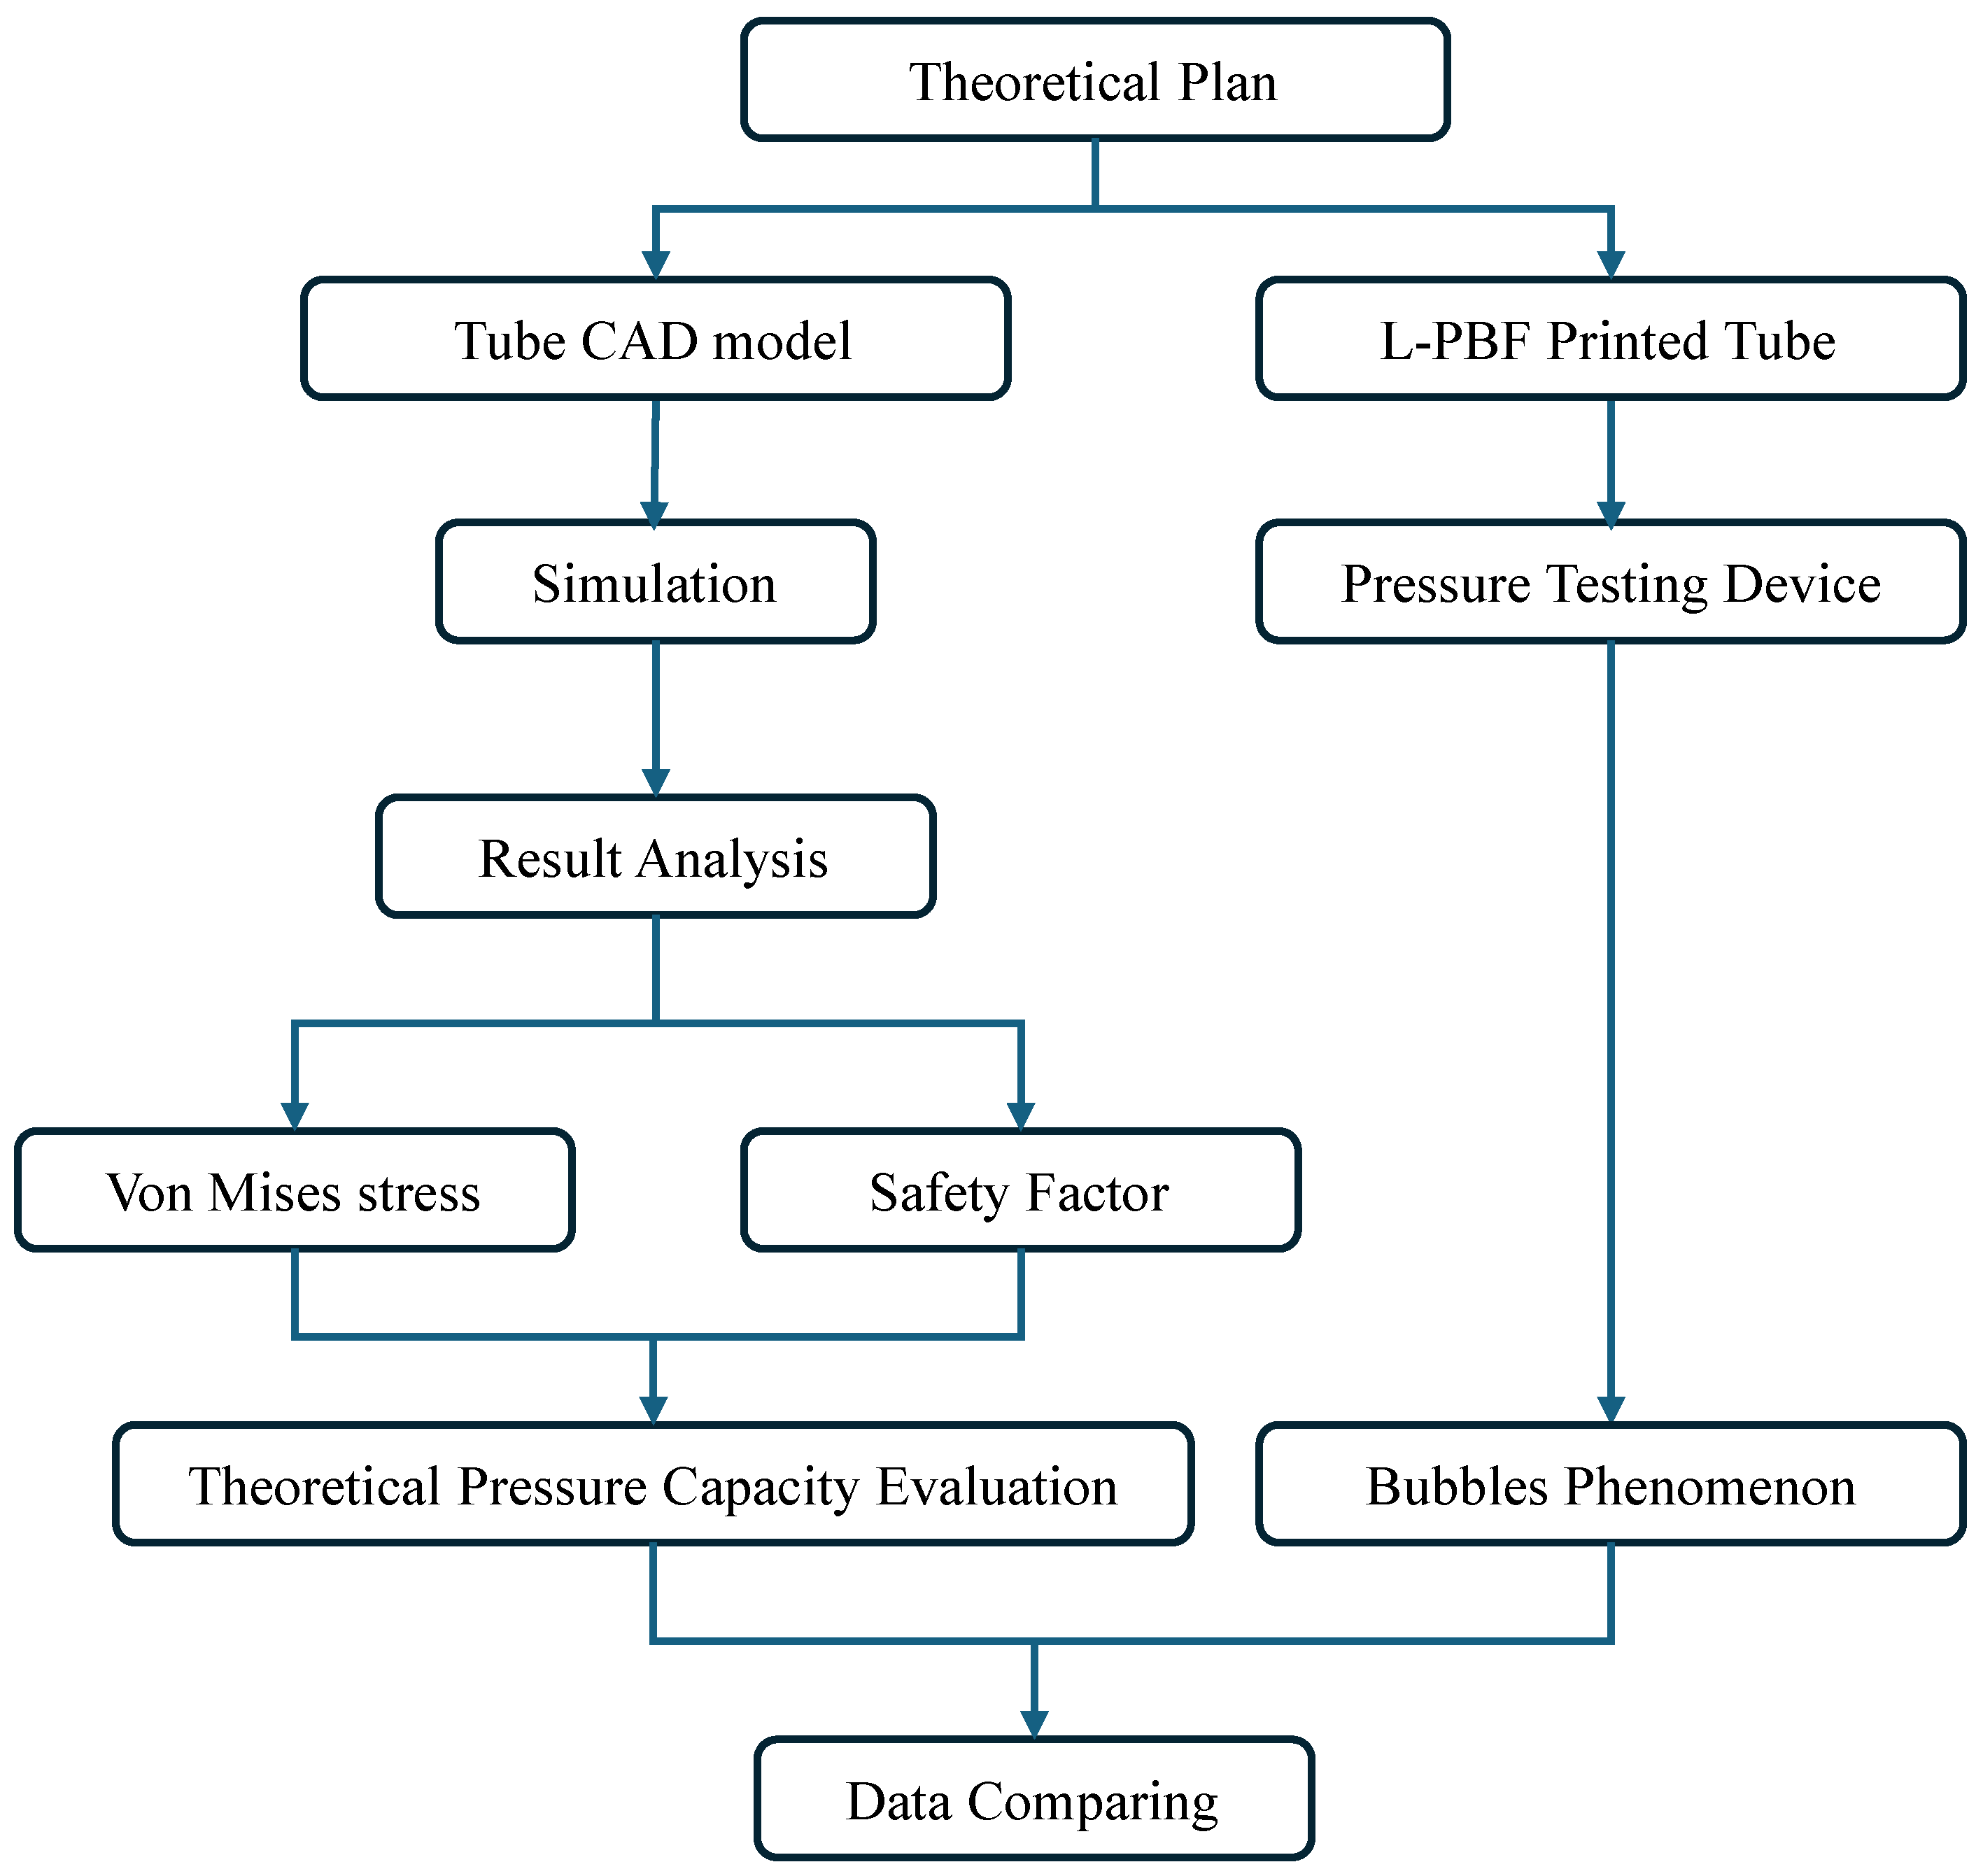
The primary objective of this experiment is to investigate the detrimental effects of porosity on the pressure capacity of L-PBF-printed tubes and to identify the factors influencing this capacity. The experiment is structured around a theoretical framework comprising two main components: the ‘Tube CAD Model’ for simulation, and the ‘L-PBF-printed Tube’ for pressure testing. This study focuses on L-PBF-printed tubes with varying levels of porosity, assessing their structural integrity under pressure to discern how porosity influences their pressure capacity. This investigation employs both simulation software and a designed pressure testing device. The simulation phase involves creating detailed tube models using software tools to predict values such as The “von Mises stress” and “Safety Factor”, which are critical for estimating the theoretical pressure capacity of the tubes. The “von Mises stress” represents the combined effect of normal and shear stresses, while the “Safety Factor” compares the material’s yield strength to the applied stress, providing a safety margin. The pressure testing device applies controlled pressure to the tubes, observing their structural response. The formation of bubbles indicates potential leakage and structural failure. This empirical testing validates the simulation results, offering a comprehensive understanding of the tubes’ pressure capacity. The evaluation of theoretical pressure capacity involves comparing simulation results with experimental observations from the pressure testing device. By analyzing the bubble phenomenon, this study correlates theoretical predictions with actual tube performance under pressure. This integrated approach enhances comprehension of L-PBF-printed tubes’ overall pressure capacity and the impact of porosity on their structural integrity. The simulation of the CAD model aims to identify potential failure areas within the tube’s internal structure under pressure conditions, while pressure testing of L-PBF-printed tubes serves as an initial experimental method to validate anticipated structural weaknesses and assess improvements in enhancing pressure capacity. Figure 3 illustrates the workflow of the entire experimental plan.
The simulation experiments and pressure capacity tests are designed to complement each other, providing a comprehensive understanding of the tube’s behavior under pressure. The simulation experiments offer detailed insights into the pressure distribution within the channels and help predict the specific locations where structural failure is likely to occur. On the other hand, the pressure capacity tests validate these predictions by revealing where failures manifest in reality, such as the appearance of bubbles on the upper and lower surfaces of the tube. The primary aim of the experiment was to investigate the pressure capacity constraints of the L-PBF-printed tube. The simulation was conducted to complement the empirical testing by providing insights into the potential failure mechanisms and structural behavior under pressure, without addressing heat transfer performance. Nitrogen was chosen as the pressurization agent, as the focus was solely on evaluating pressure capacity, making the use of a refrigerant unnecessary.

3.2. Simulation to Reflect the Pressure Capacity in Microchannel Tube

Before designing devices and equipment to evaluate the pressure capacity of L-PBF-printed microchannels, it is crucial to understand the theoretical pressure values, potential pressure distribution, and the factors influencing pressure capacity. This foundational knowledge provides a benchmark for experimental evaluations and ensures accuracy in simulating real-world conditions. Understanding pressure distribution helps identify stress concentrations and potential failure points, informing the design of effective testing protocols. Additionally, recognizing the influence of wall thickness and material properties will be considered here, as these factors significantly impact the microchannels’ performance under pressure. A thorough comprehension of these aspects enables the development of precise and reliable evaluation methods, ultimately ensuring the production of robust and dependable MCHX.
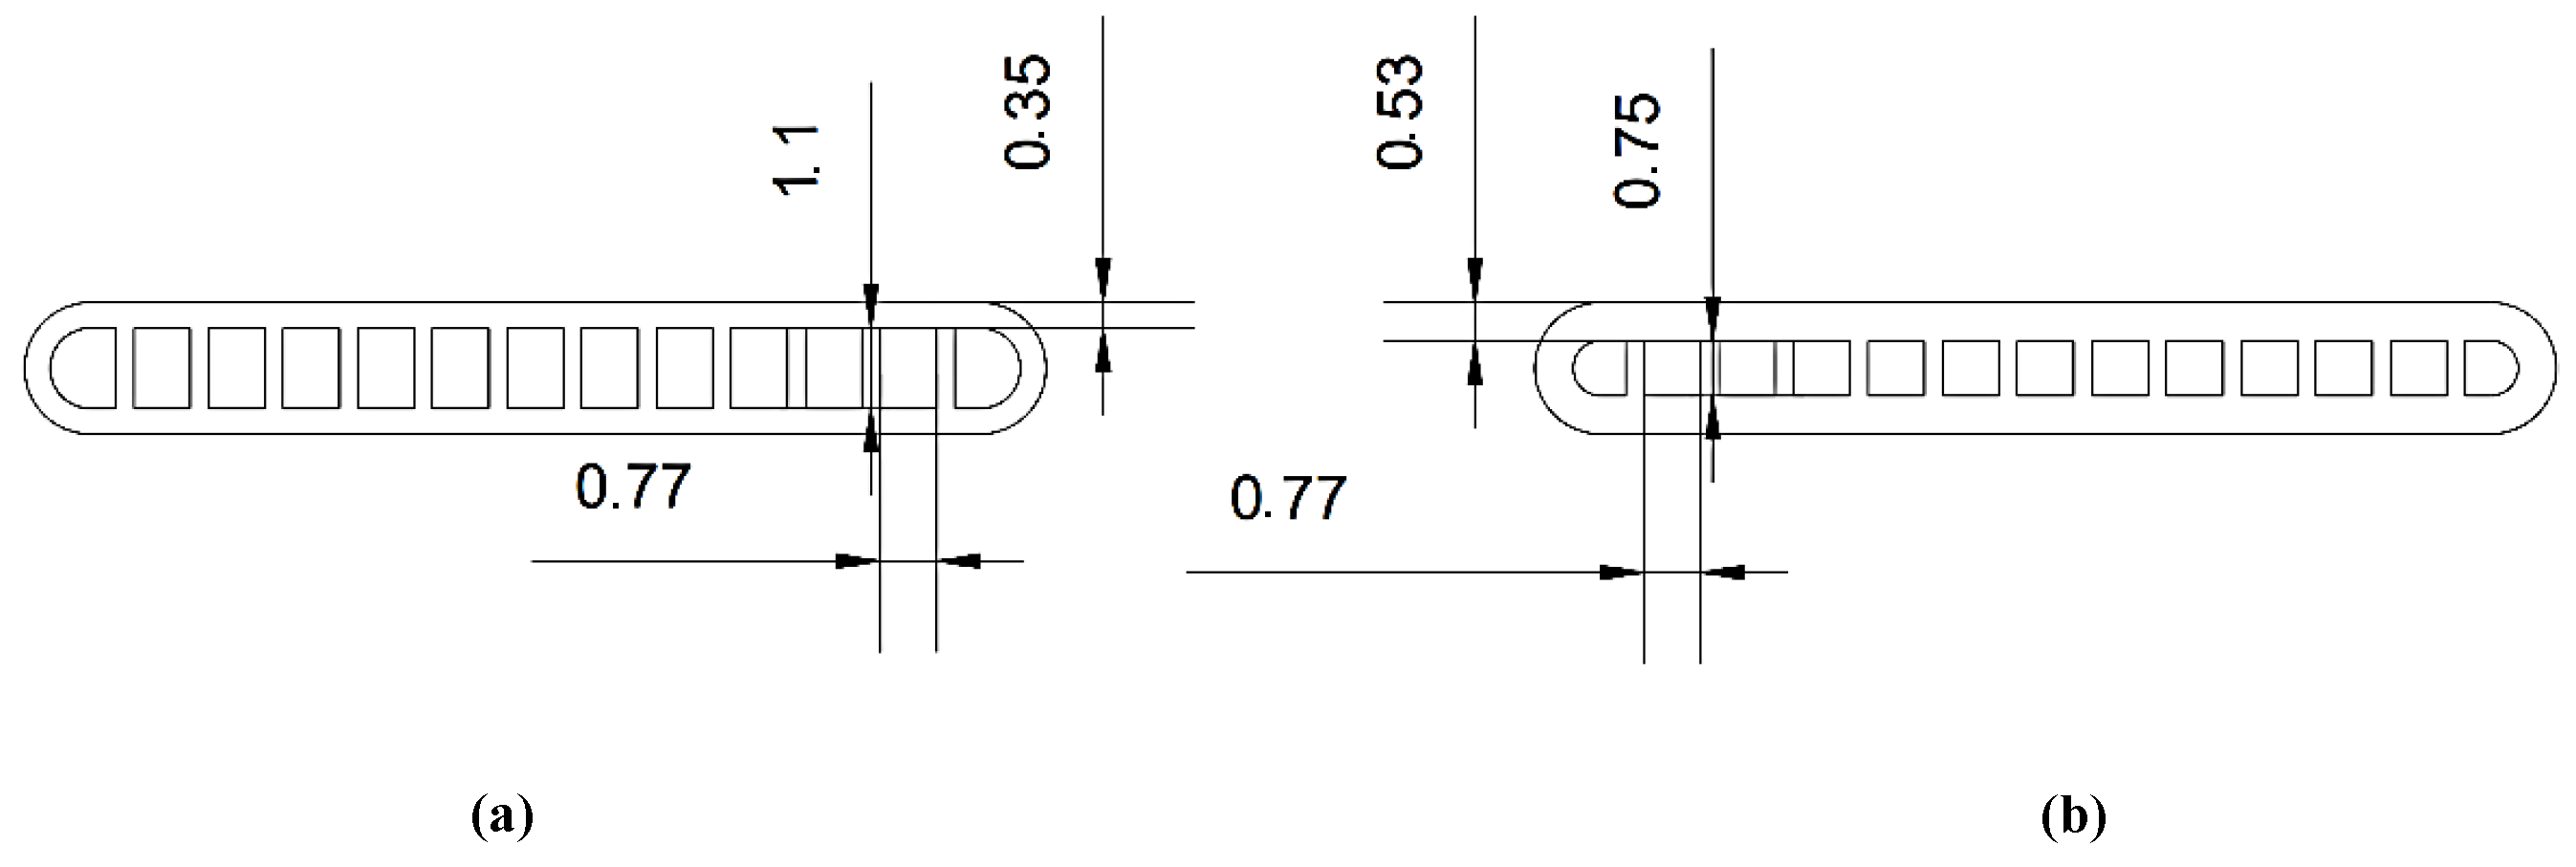
In the planned experiment, three microchannel tubes were selected for analysis: two through CAD modeling for simulation purposes and one for actual pressure capacity testing. The first tube, referred to as 1.0×, is an AlSi10Mg microchannel tube with a wall thickness of 0.35 mm. The second, labeled 1.5×, is also an AlSi10Mg tube but with an increased wall thickness of 0.53 mm. The third tube is a 1.0× aluminum microchannel tube, identical in structure to the 1.0× AlSi10Mg tube but composed of a different material. To better visualize the external appearance and internal structure of each tube, a three-quarter section view has been proposed in Figure 4. The detailed engineering specifications and cross-sectional information for each tube are illustrated in Figure 5.
To build a theoretical foundation for the experiment, research was conducted on the simulation process for the pressurized leakage detection experiment. Autodesk Inventor will be used for finite element analysis to understand the pressure distribution within the pipeline and determine the safety coefficients. The material properties of AlSi10Mg, necessary for setting the simulation parameters, are detailed in Table 2 [21,22,23]. AlSi10Mg has a thermal conductivity of 163 W/m·K, a specific heat of 0.730 J/g·°C, and a thermal expansion coefficient of 21.800 µm/m·°C. The material also exhibits a Young’s modulus of 54.500 GPa, a Poisson’s ratio of 0.25, and a shear modulus of 20.960 MPa, with a density of 2.640 g/cm3. Its yield strength is 102.100 MPa, and its tensile strength is 296.000 MPa.
Before commencing the simulation, it is necessary to establish specific preparatory settings. The dimensions of the tube, especially its length, should correspond to those of the experimental test sample to ensure consistency. It is important to note that simulation outcomes may not entirely reflect actual results due to inherent modeling limitations. Autodesk Inventor’s stress simulation interface is optimized for solid structures, which may impact accuracy. Nonetheless, it is capable of effectively illustrating pressure distribution and stress characteristics on the pipe’s surface, offering valuable insights.
Safe Stress = Yield Strength Safety Factor
In Equation (1):
  • Safe stress is the maximum allowable stress that ensures the component will perform reliably under expected loads.
  • Yield strength is the stress at which the material begins to yield or deform elastically.
  • Safety factor is a multiplier used to provide a margin of safety, typically greater than 1, to account for uncertainties and variability in the material and loading conditions.
The von Mises stress and safety factors serve as key references to represent the tube’s performance in the simulation, ensuring alignment with the experimental scheme. The “safe stress” for AlSi10Mg or any structural component is derived from its yield strength by applying a safety factor [24,25], as outlined in Equation (1). Safe stress is a calculated value used in engineering to ensure that a material or structural component can withstand the applied loads without failure. It is determined by dividing the yield strength of the material by a safety factor. The yield strength is the stress at which a material begins to deform elastically and is no longer able to return to its original shape. The safety factor is a dimensionless number that provides a margin of safety to account for uncertainties in the material properties, loading conditions, and potential imperfections in the material or design.
Geometric discontinuities such as sharp bends or holes can cause stress concentrations, leading to localized increases in stress. The von Mises stress calculation, shown in Equation (2), combines principal stresses from all three orthogonal axes, providing a scalar value that represents the combined effect of normal and shear stresses. The von Mises stress,  σ v m , is a theoretical construct used in engineering to predict the yielding of materials under complex loading conditions. It is especially useful in the field of structural and mechanical engineering because it helps determine whether a given material will yield (begin to deform elastically) under a given set of stresses. This method can indicate elevated stress levels beyond those directly applied. Here,  σ 1 σ 2 , and  σ 3  denote the principal stresses.
σ v m = ( σ 1 σ 2 ) 2 + ( σ 2 σ 3 ) 2 + ( σ 3 σ 1 ) 2 2
In Equation (2):
  • σ v m  is the von Mises stress.
  • σ 1 σ 2 , and  σ 3  are the principal stresses
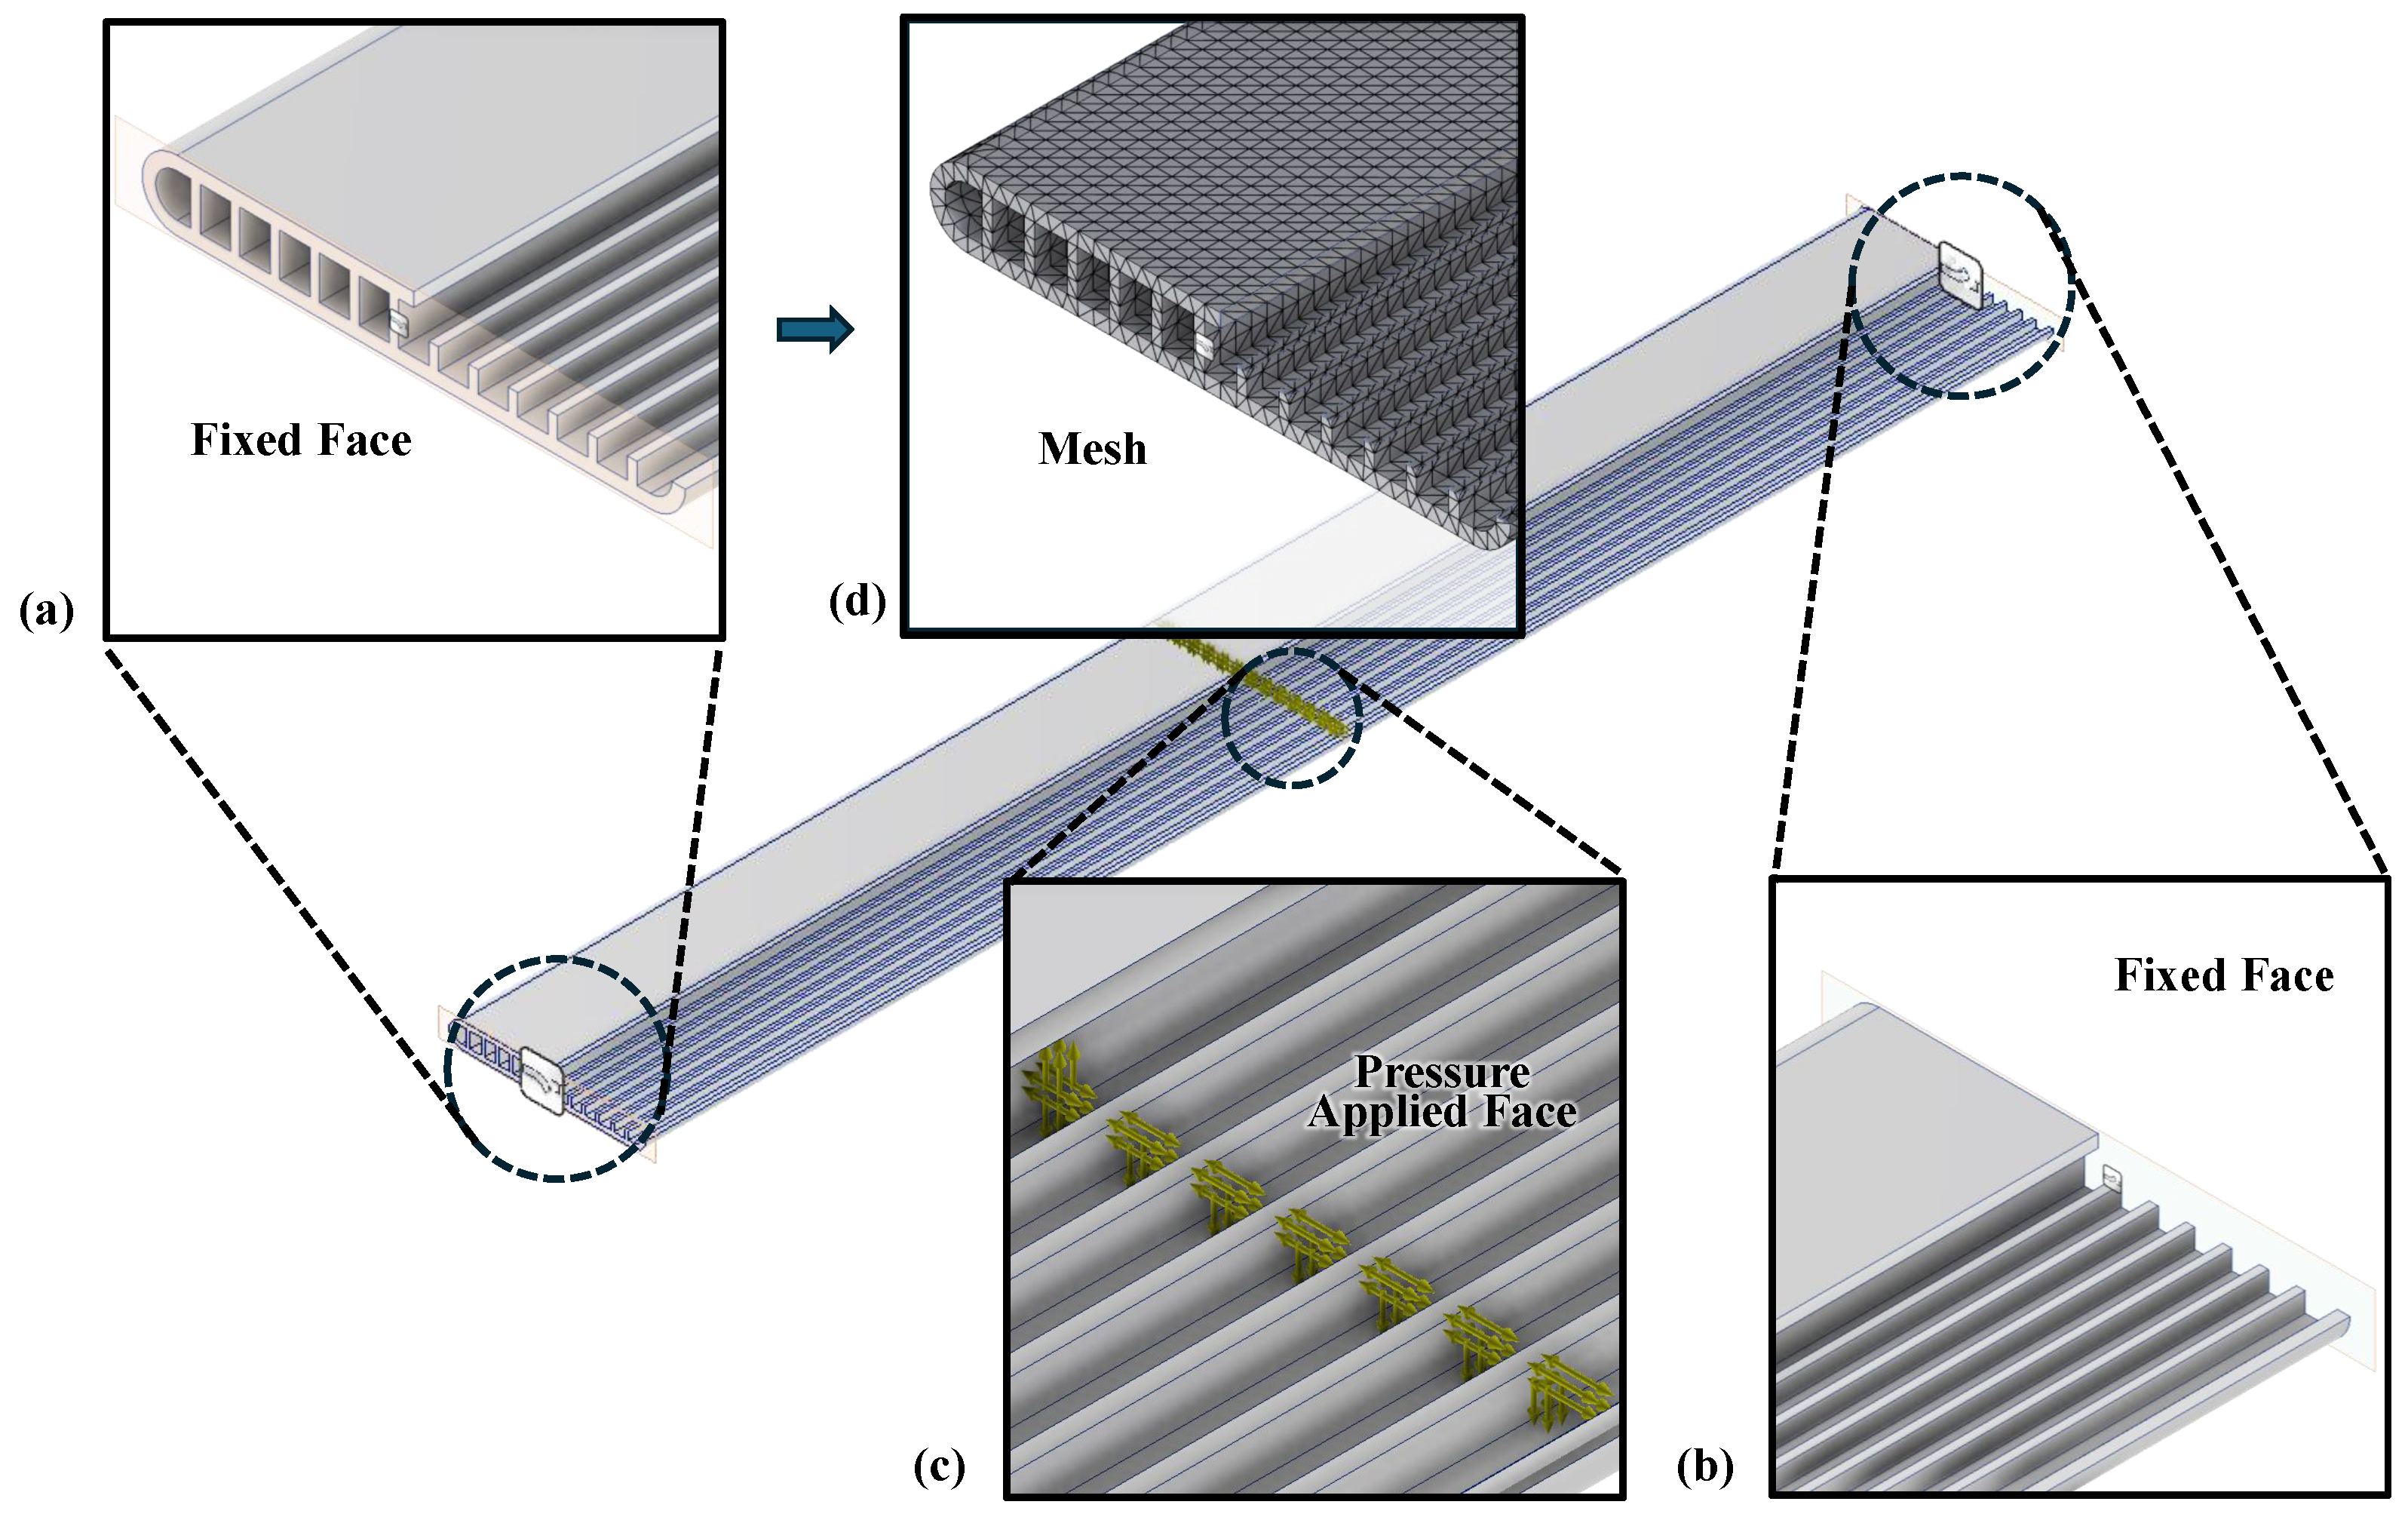
Uniformly applied pressure may not produce a uniform stress state within the material, often resulting in elevated von Mises stresses. Complex loading conditions, such as bending and torsional stresses, significantly contribute to this phenomenon. Additionally, material inhomogeneities, such as anisotropy or internal voids, and specific boundary conditions during testing can further increase stress readings [26,27]. Detailed computational analysis, such as finite element analysis, is crucial for visualizing these stress distributions, optimizing design, and ensuring both safety and functionality. The boundary conditions for each simulation test were standardized across all cases. Both end faces of the tubes were fixed, while a specified pressure was applied uniformly to the channel surfaces to replicate high-pressure conditions. The mesh settings were configured with an average element size and a minimum element size of 0.01 mm, a grading factor of 1.5, and a maximum turn angle of 60 degrees. The final mesh consisted of 214,572 elements. The details of the simulation boundary conditions are illustrated in Figure 6. The simulation was conducted using Autodesk Inventor.

3.3. Simulation Result

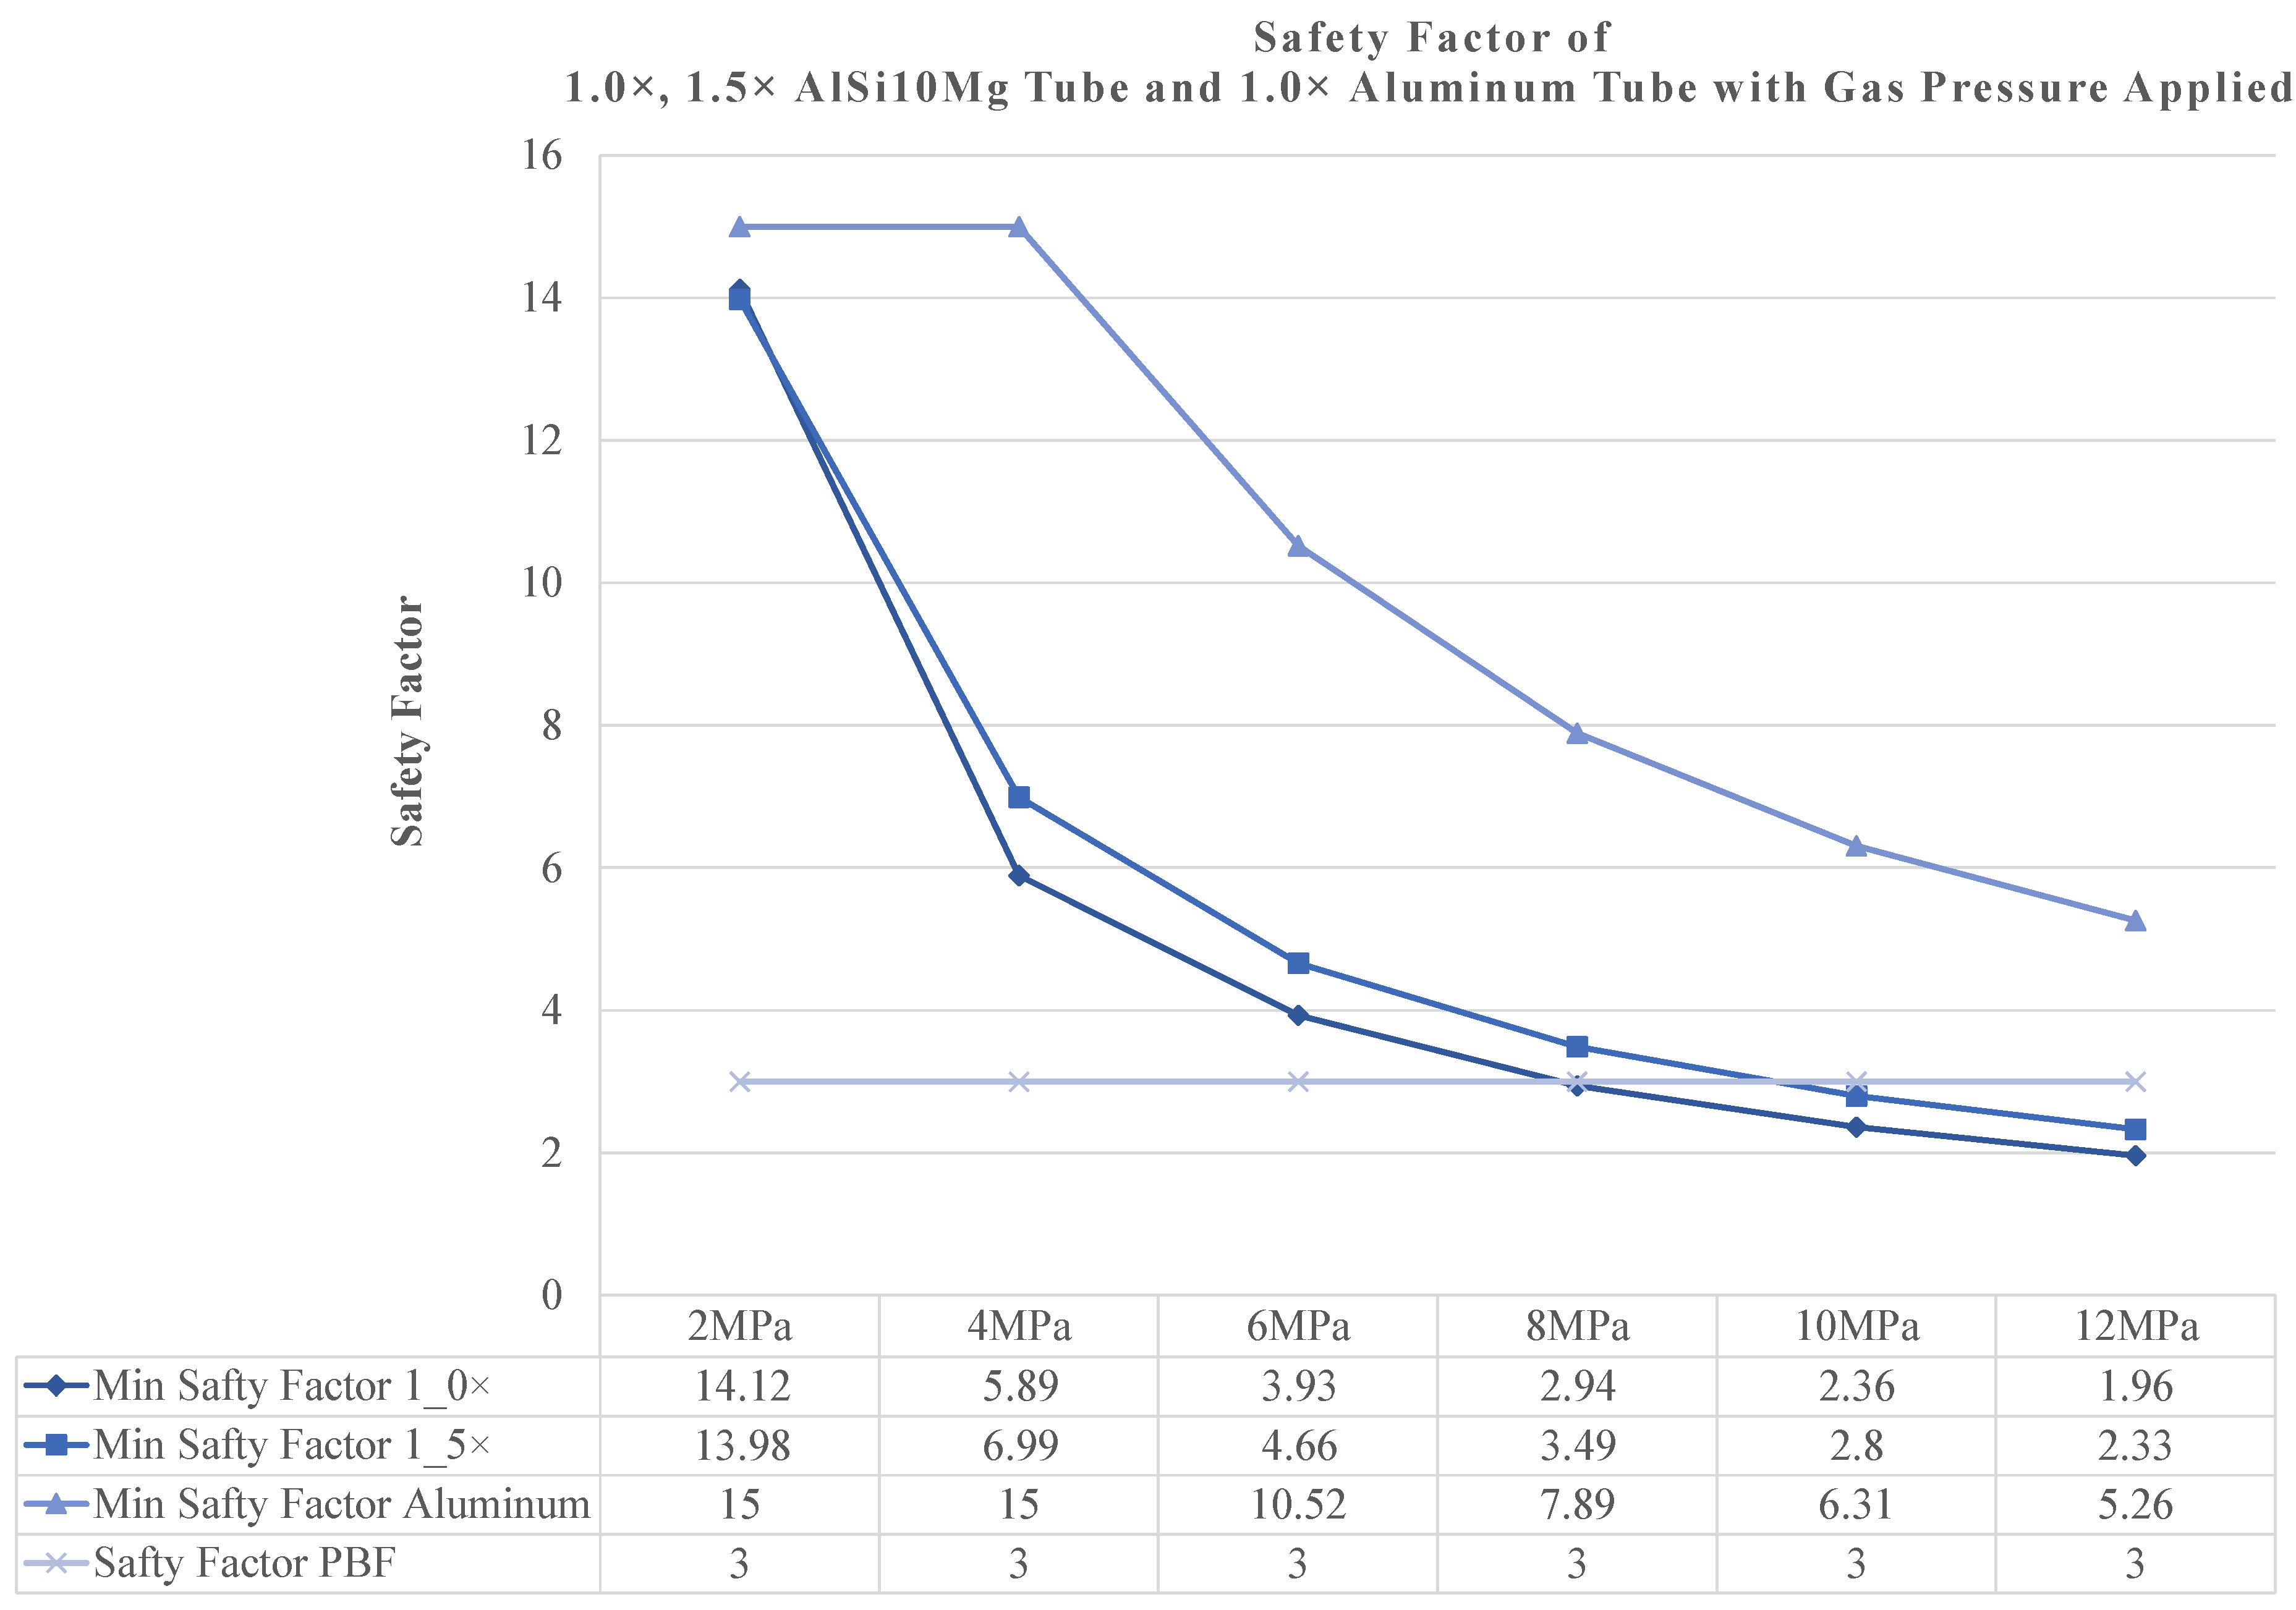
Figure 7 and Figure 8 illustrate the simulation results for von Mises stress and safety factors of three tubes (the 1.0× tube, 1.5× tube, and 1.0× aluminum tube) subjected to pressures ranging from 2 MPa to 12 MPa. For the 1.0× tube, the maximum von Mises stress increases linearly, exceeding the 40 MPa safety threshold above 6 MPa, with the minimum safety factor decreasing from 14.12 at 2 MPa to 1.96 at 12 MPa. This reduction indicates a shrinking safety margin and a higher risk of failure at elevated pressures. The intersection of the calculated safety factor with the constant safety line around 4 MPa signifies a critical transition point, beyond which the actual safety factor falls below the threshold of 3. For many applications, especially when dealing with materials that may have variability or when there is some uncertainty in the loading conditions, a safety factor of 3 is often considered a prudent choice [28].
The 1.5× tube exhibits a similar pattern, with maximum stress rising from 8.65 MPa at 2 MPa to 51.93 MPa at 12 MPa, surpassing the safety threshold above 4 MPa, and the minimum safety factor dropping from 13.98 to 2.33. Conversely, preliminary experimental evaluations showed a significant divergence in the performance of the 1.0× tube from the simulated outcomes. Initial testing revealed that the 1.0× tube began leaking at a constant pressure of 1 MPa, whereas simulations did not predict leakage until pressures between 8 MPa and 10 MPa. This discrepancy highlights the challenges in accurately replicating real-world behaviors in simulations, emphasizing the need to calibrate simulation models based on empirical data to improve predictive accuracy and reliability.
The 1.0× aluminum tube demonstrates better performance, with maximum stress increasing from 8.716 MPa at 2 MPa to 52.29 MPa at 12 MPa, remaining below the 91.67 MPa safety level, and the minimum safety factor decreasing from 15 to 5.26. The comprehensive simulation, extending up to a pressure of 12 MPa, allows for a thorough analysis of mechanical properties under varying conditions, enhancing the understanding of material behavior and structural integrity under increased loads. These results suggest that the aluminum tube has a superior safety margin and a lower risk of damage compared to the AlSi10Mg printed tubes under similar pressure conditions.
Although the simulation results indicate that L-PBF-printed products have poorer mechanical properties compared to aluminum tubes, it is important to recognize that these simulations assume the product is virtually free of porosity. This means that the actually printed tubes, which are likely to contain some level of porosity, may exhibit even poorer properties in terms of von Mises stress and safety factors. Consequently, the real-world performance of L-PBF-printed tubes could be significantly compromised, further emphasizing the need for empirical testing and model calibration to accurately reflect the material’s true behavior under operational conditions.
According to Figure 9 and Figure 10, larger pressure distribution areas are predominantly found on the inner walls of the tubes. Additionally, the outer surface of the tubes also shows notable pressure distribution, although to a lesser extent than the inner walls. When comparing the tubes, the 1.5× wall thickness tube exhibits a better pressure-holding capacity, as indicated by a more uniform and lower stress distribution compared to the 1.0× tube. This suggests that increasing the wall thickness enhances the tube’s ability to withstand higher pressures. In contrast, the 1.0× wall thickness tube shows a more fragile structure overall, as evidenced by the higher von Mises stresses. The 1.0× aluminum tube demonstrates superior performance, with maximum stress levels significantly below the safety threshold, indicating a more stable and reliable structure. This tube also exhibits similar pressure distribution characteristics to the L-PBF-printed tubes but with better pressure-holding effects. Moreover, the distribution of the safety factor similarly shows that the 1.0× wall thickness tubes exhibit a more fragile structure overall. However, the 1.5× wall thickness tubes, despite being made from the same material, exhibit a more stable state. Regardless of the wall thickness, the 1.0× aluminum tube is structurally more stable and reliable compared to the L-PBF-printed tubes.
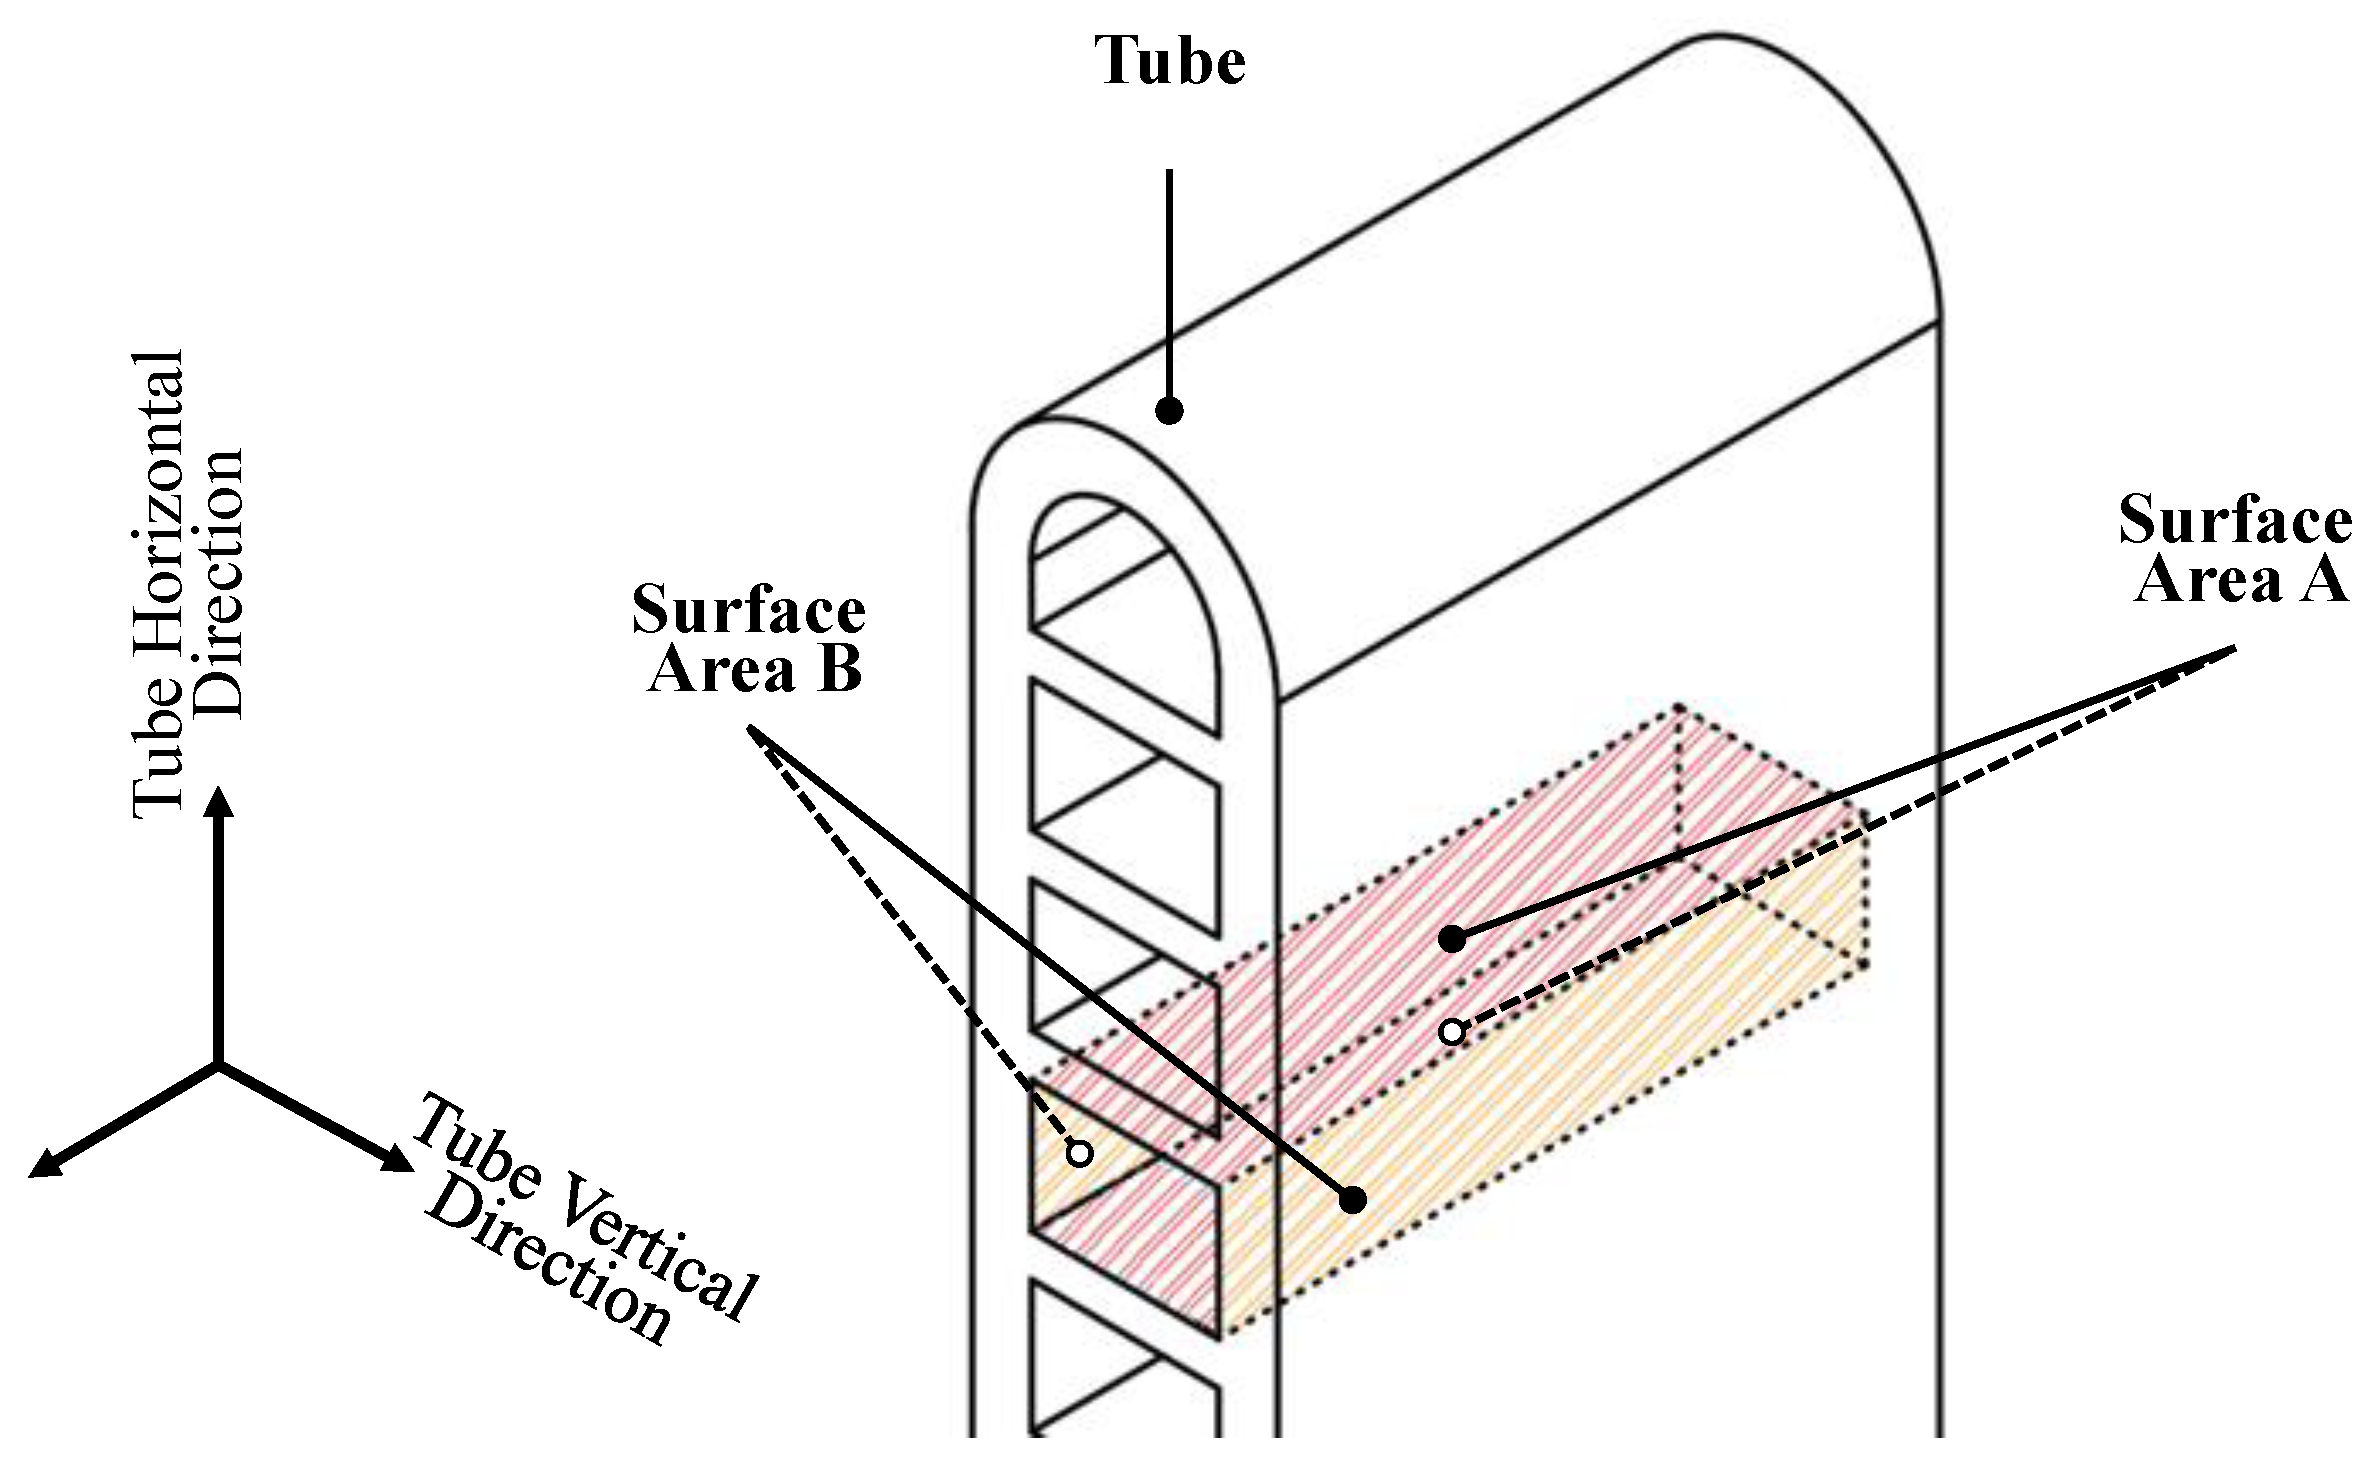
To systematically classify the tube surface area, Figure 11 presents the division of the inner tube surface into two distinct parts. The surfaces oriented perpendicular to the vertical axis are highlighted in orange and designated as ‘Surface Area B’, while those perpendicular to the horizontal axis are highlighted in red and labeled ‘Surface Area A’. Comprehensive analysis of the von Mises stress and safety factor from the simulation results indicates that ‘Surface Area A’ exhibits relatively poor mechanical properties, particularly in the case of the 1.0 AlSi10Mg tube. The simulation further provides insights into the structural integrity of the tube, revealing that failure may initiate in ‘Surface Area B’ as the applied pressure increases. The heterogeneous distribution of von Mises stress may largely depend on the characteristics of the channel geometry, thus also leading to a lower safety factor. This observation could potentially explain the origin of the bubble formation discussed in the subsequent chapter. The simulation experiments effectively illustrate the pressure distribution characteristics within the tube channels, demonstrating that variations in wall thickness and material composition can significantly enhance the mechanical performance of the tubes. The presence of porosity, inherent in the L-PBF manufacturing process, appears to exacerbate the tube’s susceptibility to structural failure, particularly in regions where von Mises stress is concentrated. This stress concentration likely contributes to the air leakage phenomena observed, which will be explored in detail in the following section.

4. Pressure Capacity Testing Experiment

4.1. Experiment Device Preparation

To secure the L-PBF-printed tube for testing and apply specific air pressure, a pressure testing unit (PTD) is placed inside an acrylic tank (AT). Two end caps are used to ensure an airtight seal. One end cap includes an optional pressure gauge for monitoring, while the other is connected to a nitrogen supply to introduce the pressure. The experiment involves two types of L-PBF-printed tubes with identical width and thickness but differing wall thicknesses. The objective is to determine the impact of porosity on structural integrity by identifying the pressure at which leakage begins, indicating structural failure. Figure 12 depicts the experimental setup. Nitrogen is used as the pressurization agent to simulate the dynamic pressure environment of gaseous refrigerants within microchannels. The setup, including the tube, is placed within an acrylic tank, which is then filled with water to a level above the tube to facilitate the observation of air leakage under pressure. The experiment evaluates the structural integrity of L-PBF-printed microchannel under varying pressures. A gradient pressure test is conducted, starting at 1 MPa for 10 min. If no changes occur, the pressure is increased by 0.2 MPa increments until 2 MPa. Photographic documentation at each increment will monitor bubble formation, indicating the pressure point of leakage and quantifying the sample’s pressure endurance. The setup features a barometric system equipped with a pressure gauge and a variable pressure regulator to ensure precise pressure control. High-definition video recording equipment is used to document the external conditions of the tube, capturing periodic photographs for time-series analysis of any leakage. The experimental device captured by the camera is shown in Figure A1, while the details of the L-PBF printer and its printing parameters are illustrated in Figure A2.

4.2. Experiment Method of Bubbles Phenomenon

To enhance the analysis of observed phenomena and their causes, the bubble formations documented in the three experiments have been categorized into four distinct types as illustrated in Figure 13. These categories are defined as follows: ‘nearly no bubbles’, ‘micro and attached bubbles’, ‘micro and small bubbles’, and ‘numerous and violent’. This classification allows for a systematic review of the data and facilitates a clearer understanding of the underlying dynamics at each stage of the experiment. The observed phenomena captured by the camera are displayed in Figure A3. The primary objective of this experiment is to investigate the impact of wall thickness on the pressure capacity of L-PBF-printed tubes. By visualizing the phenomenon of bubble leakage, the ability of these tubes to withstand specific pressure conditions can be evaluated. The experiment involves incrementally increasing the internal pressure of the tubes and observing the formation of bubbles as an indicator of leakage. This visual method provides a practical means of assessing the structural integrity and pressure-bearing capacity of tubes with varying wall thicknesses. The critical pressure points at which structural failure occurs will be identified, offering valuable insights into the performance and reliability of L-PBF-printed tubes under different pressure conditions. This approach enhances the understanding of the relationship between wall thickness and pressure capacity, contributing to the development of more robust and reliable L-PBF-printed components.
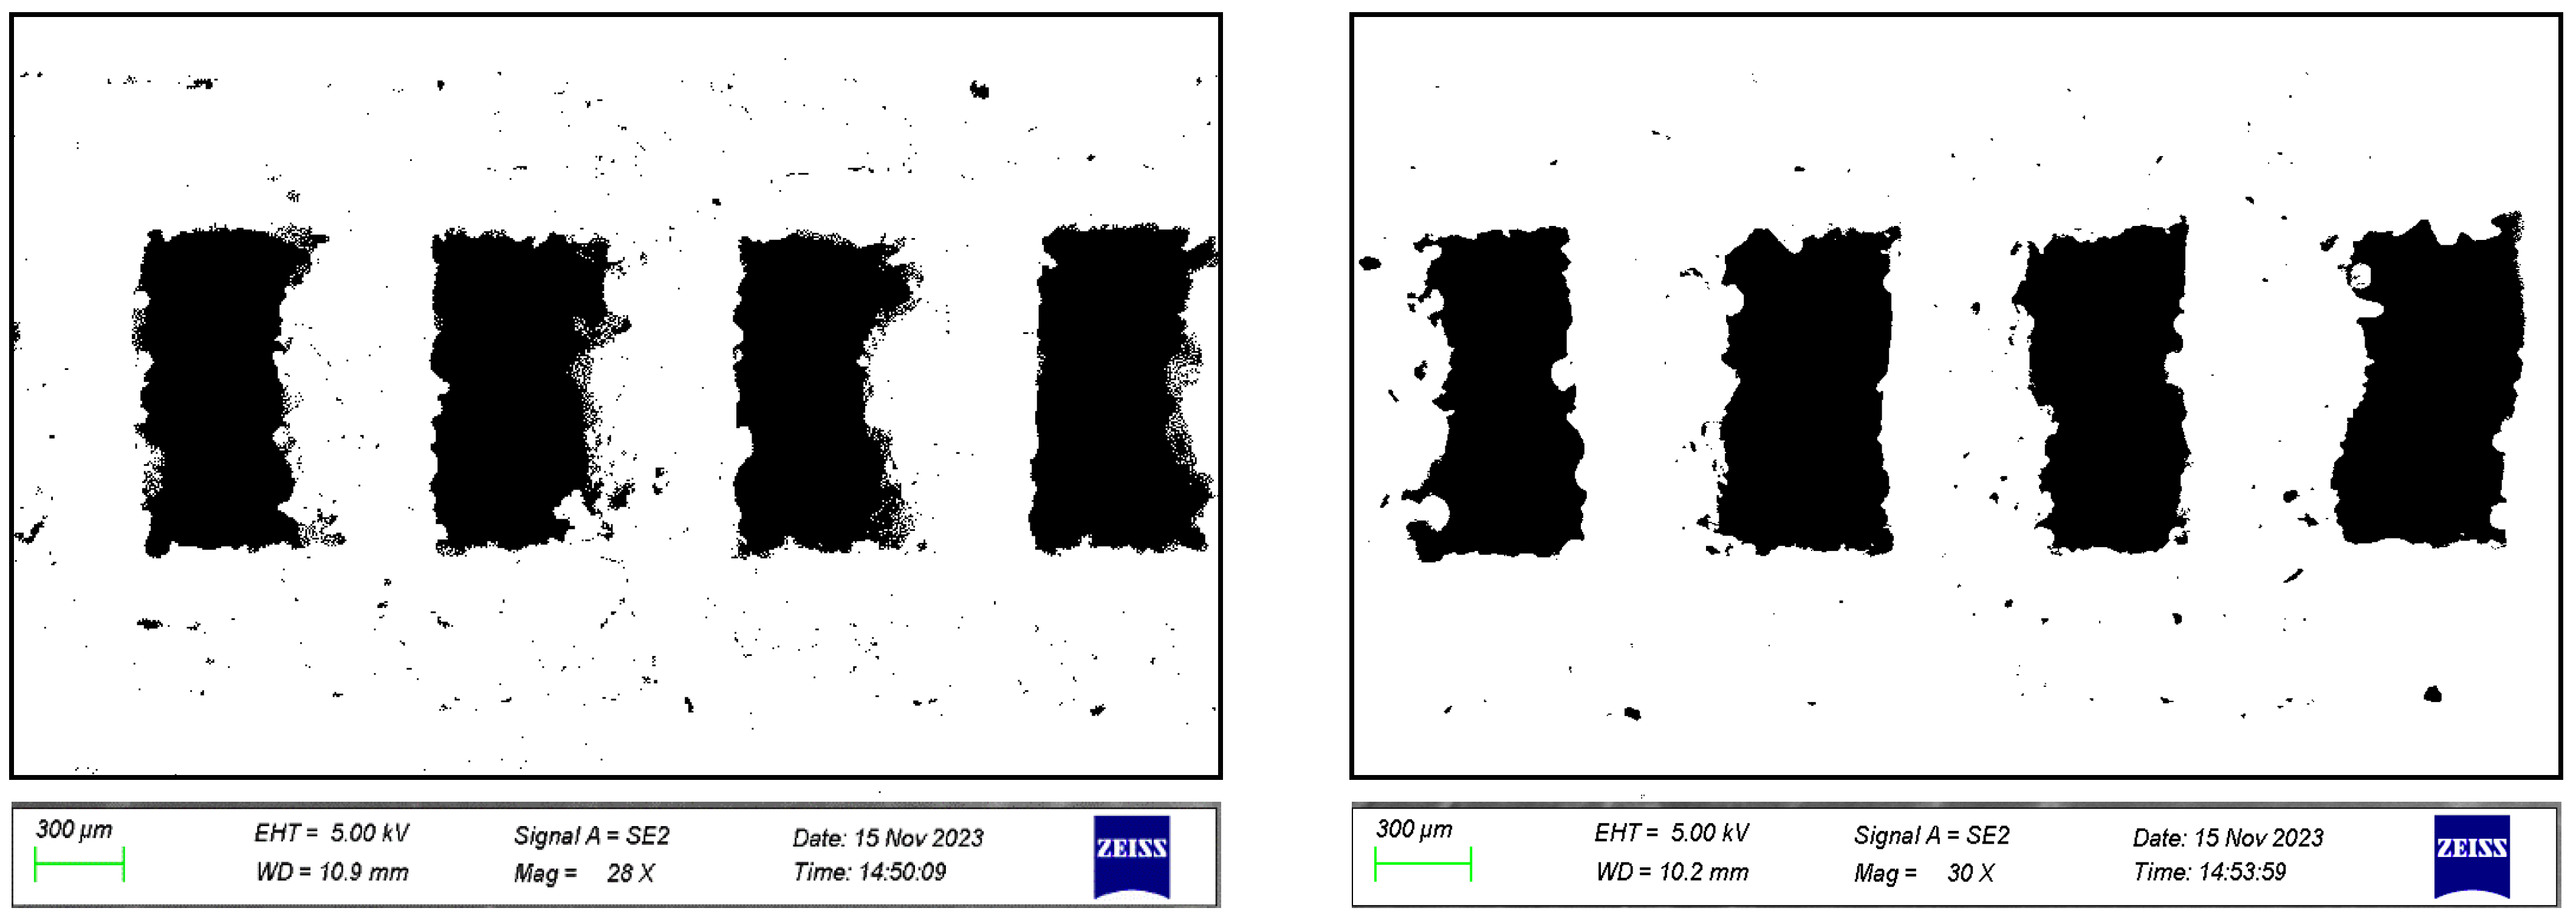
Porosity and void formation within the fabricated microstructure are critical factors affecting the integrity and mechanical properties of components produced via L-PBF. Figure 14 illustrates the spatial distribution of these voids, which appear as darkened spots or gaps within the solid matrix. These discontinuities often result from suboptimal melting or consolidation of powder particles during the PBF process. Contributing factors may include inconsistent energy input from the laser, variations in powder layer thickness, or thermal gradients leading to uneven solidification rates. The morphology and distribution of these porosities significantly influence the mechanical performance of the material, as they can act as stress concentrators and initiation points for crack propagation under load. Additionally, porosity is a direct cause of leakage and bubble formation during pressurization tests. The presence of voids and gaps creates pathways for gas to escape, resulting in the observed leakage and bubble phenomena. These porosity holes also weaken the structural integrity of the tube, making it more susceptible to failure under gas pressure.

4.3. Tube Pressure Capacity Testing Experiment Result

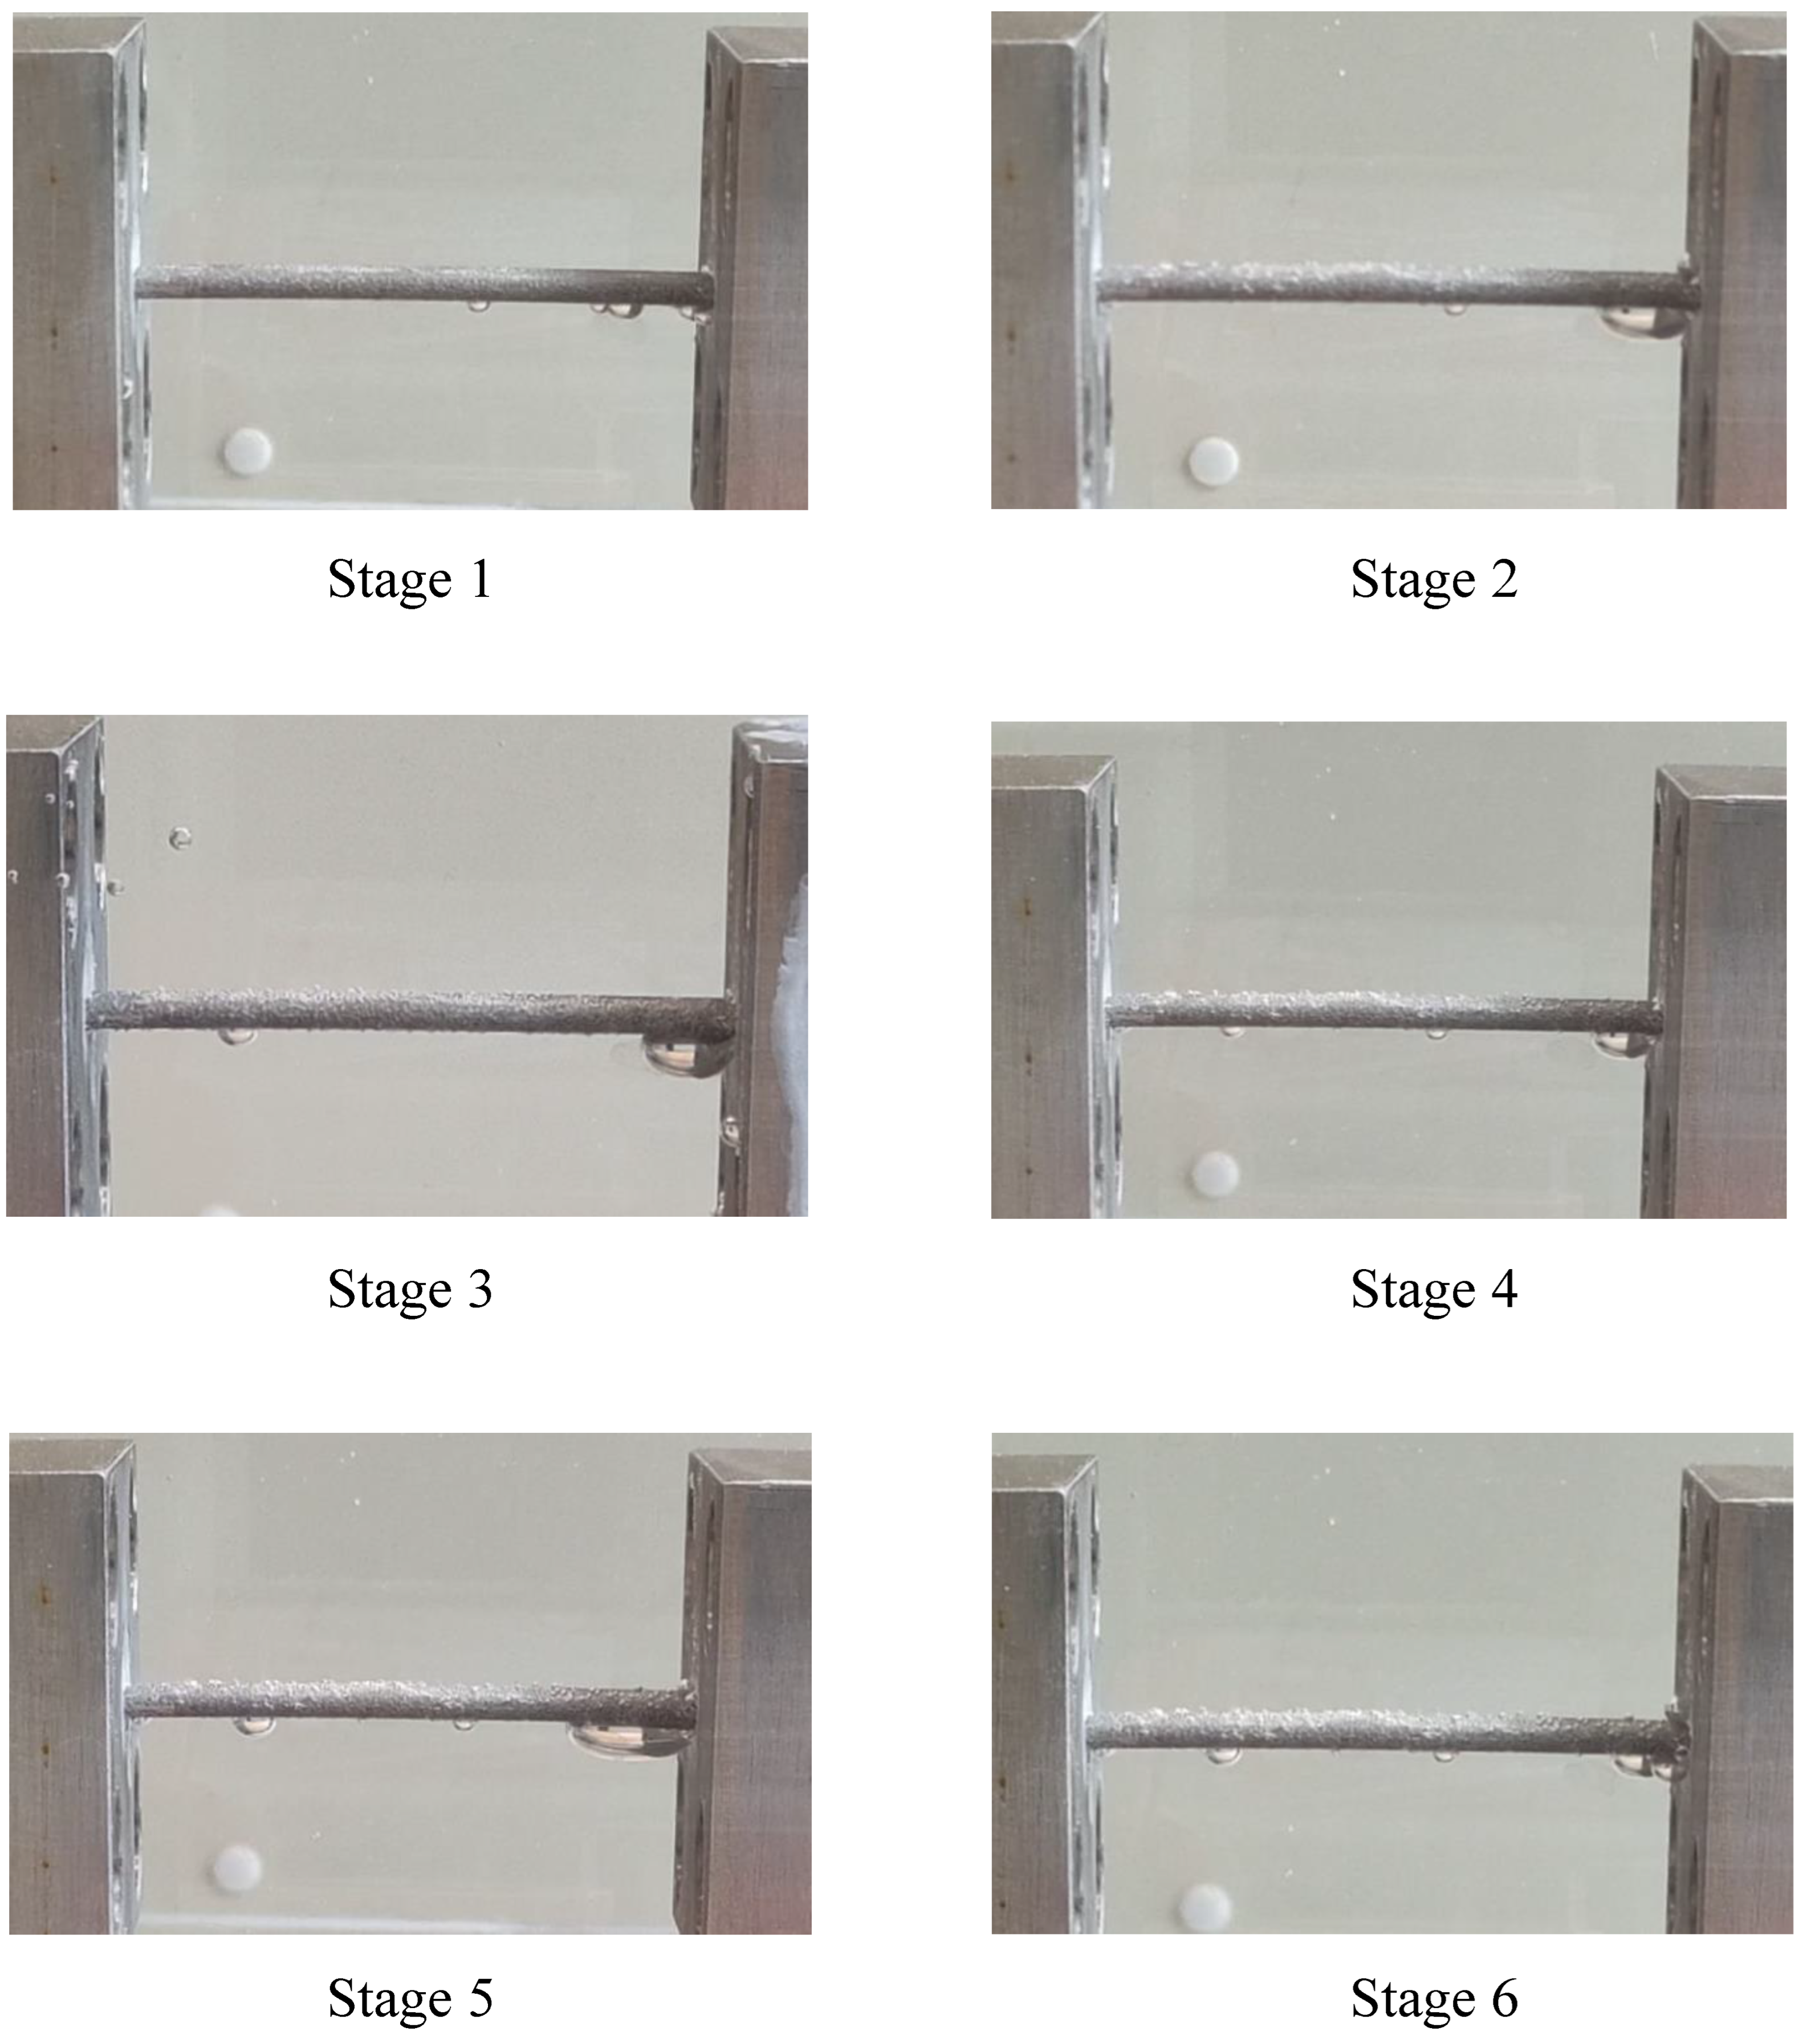
Experiment 1 evaluates the pressure capacity of a tube with a 1.0× wall thickness for 1 h, recording the pressure every 10 min. Beginning at 1.0 MPa, the pressure is incrementally increased by 0.2 MPa at each interval. Table 3 illustrates the pressure capacity assessment of a tube with a 1.0× wall thickness for 1 h, starting at 1.0 MPa and increasing by 0.2 MPa every 10 min. At 1.0 MPa, leakage was observed at 34 s, with numerous violent bubbles on the upper surface and larger bubbles forming on the lower surface. At 1.2 MPa, the leakage patterns remained consistent. At 1.4 MPa, the rate of bubble overflow increased. At 1.6 MPa, no significant changes were detected. At 1.8 MPa, new leakage areas emerged, indicating potential structural weaknesses, and a significant increase in bubble overflow was noted, highlighting progressive structural degradation under sustained high pressure. The various stages of the 1.0× L-PBF tube bubble phenomena are illustrated in Figure A4.
For the 1.5× tube, experiment 2 involved incremental pressure increases with observations at 10-min intervals, as shown in Table 4. At 1.0 MPa, minimal bubble activity was observed. At 1.2 MPa, small bubbles adhered to the surface, with a few detaching after 10 min. At 1.4 MPa, small bubbles began to slowly emerge after 20 min. At 1.6 MPa, the emission rate of small bubbles increased. At 1.8 MPa and 2.0 MPa, the leakage patterns remained consistent, but the formation and release rate of small bubbles accelerated. This progression highlights the tube’s response to increasing pressure, emphasizing changes in bubble activity and potential structural weaknesses. The various stages of the 1.5× L-PBF tube bubble phenomena are illustrated in Figure A5.
To establish a benchmark and minimize non-essential influences, an aluminum tube was selected for comparison in Experiment 3. The conditions were identical to those in the previous two experiments, with the process lasting one hour and pressures recorded every 10 min. Starting at an initial pressure of 1.0 MPa, the pressure was increased by 0.2 MPa at regular intervals, as shown in Table 5. For the flat tube, negligible bubble activity was observed at 1.0 MPa during the first 10 min. Minimal bubble activity continued at 1.2 MPa. From 1.4 MPa to 1.8 MPa, the tube remained stable with no significant changes. At 2.0 MPa, small bubbles appeared, likely due to dissolved air in the water rather than a defect in the tube. This pattern indicates consistent stability across increasing pressure stages, with minimal bubble activity suggesting robust structural integrity. The various stages of the 1.0× aluminium tube bubble phenomena are illustrated in Figure A6.

4.4. Tube Pressure Capacity Testing Experiment Result Evaluation

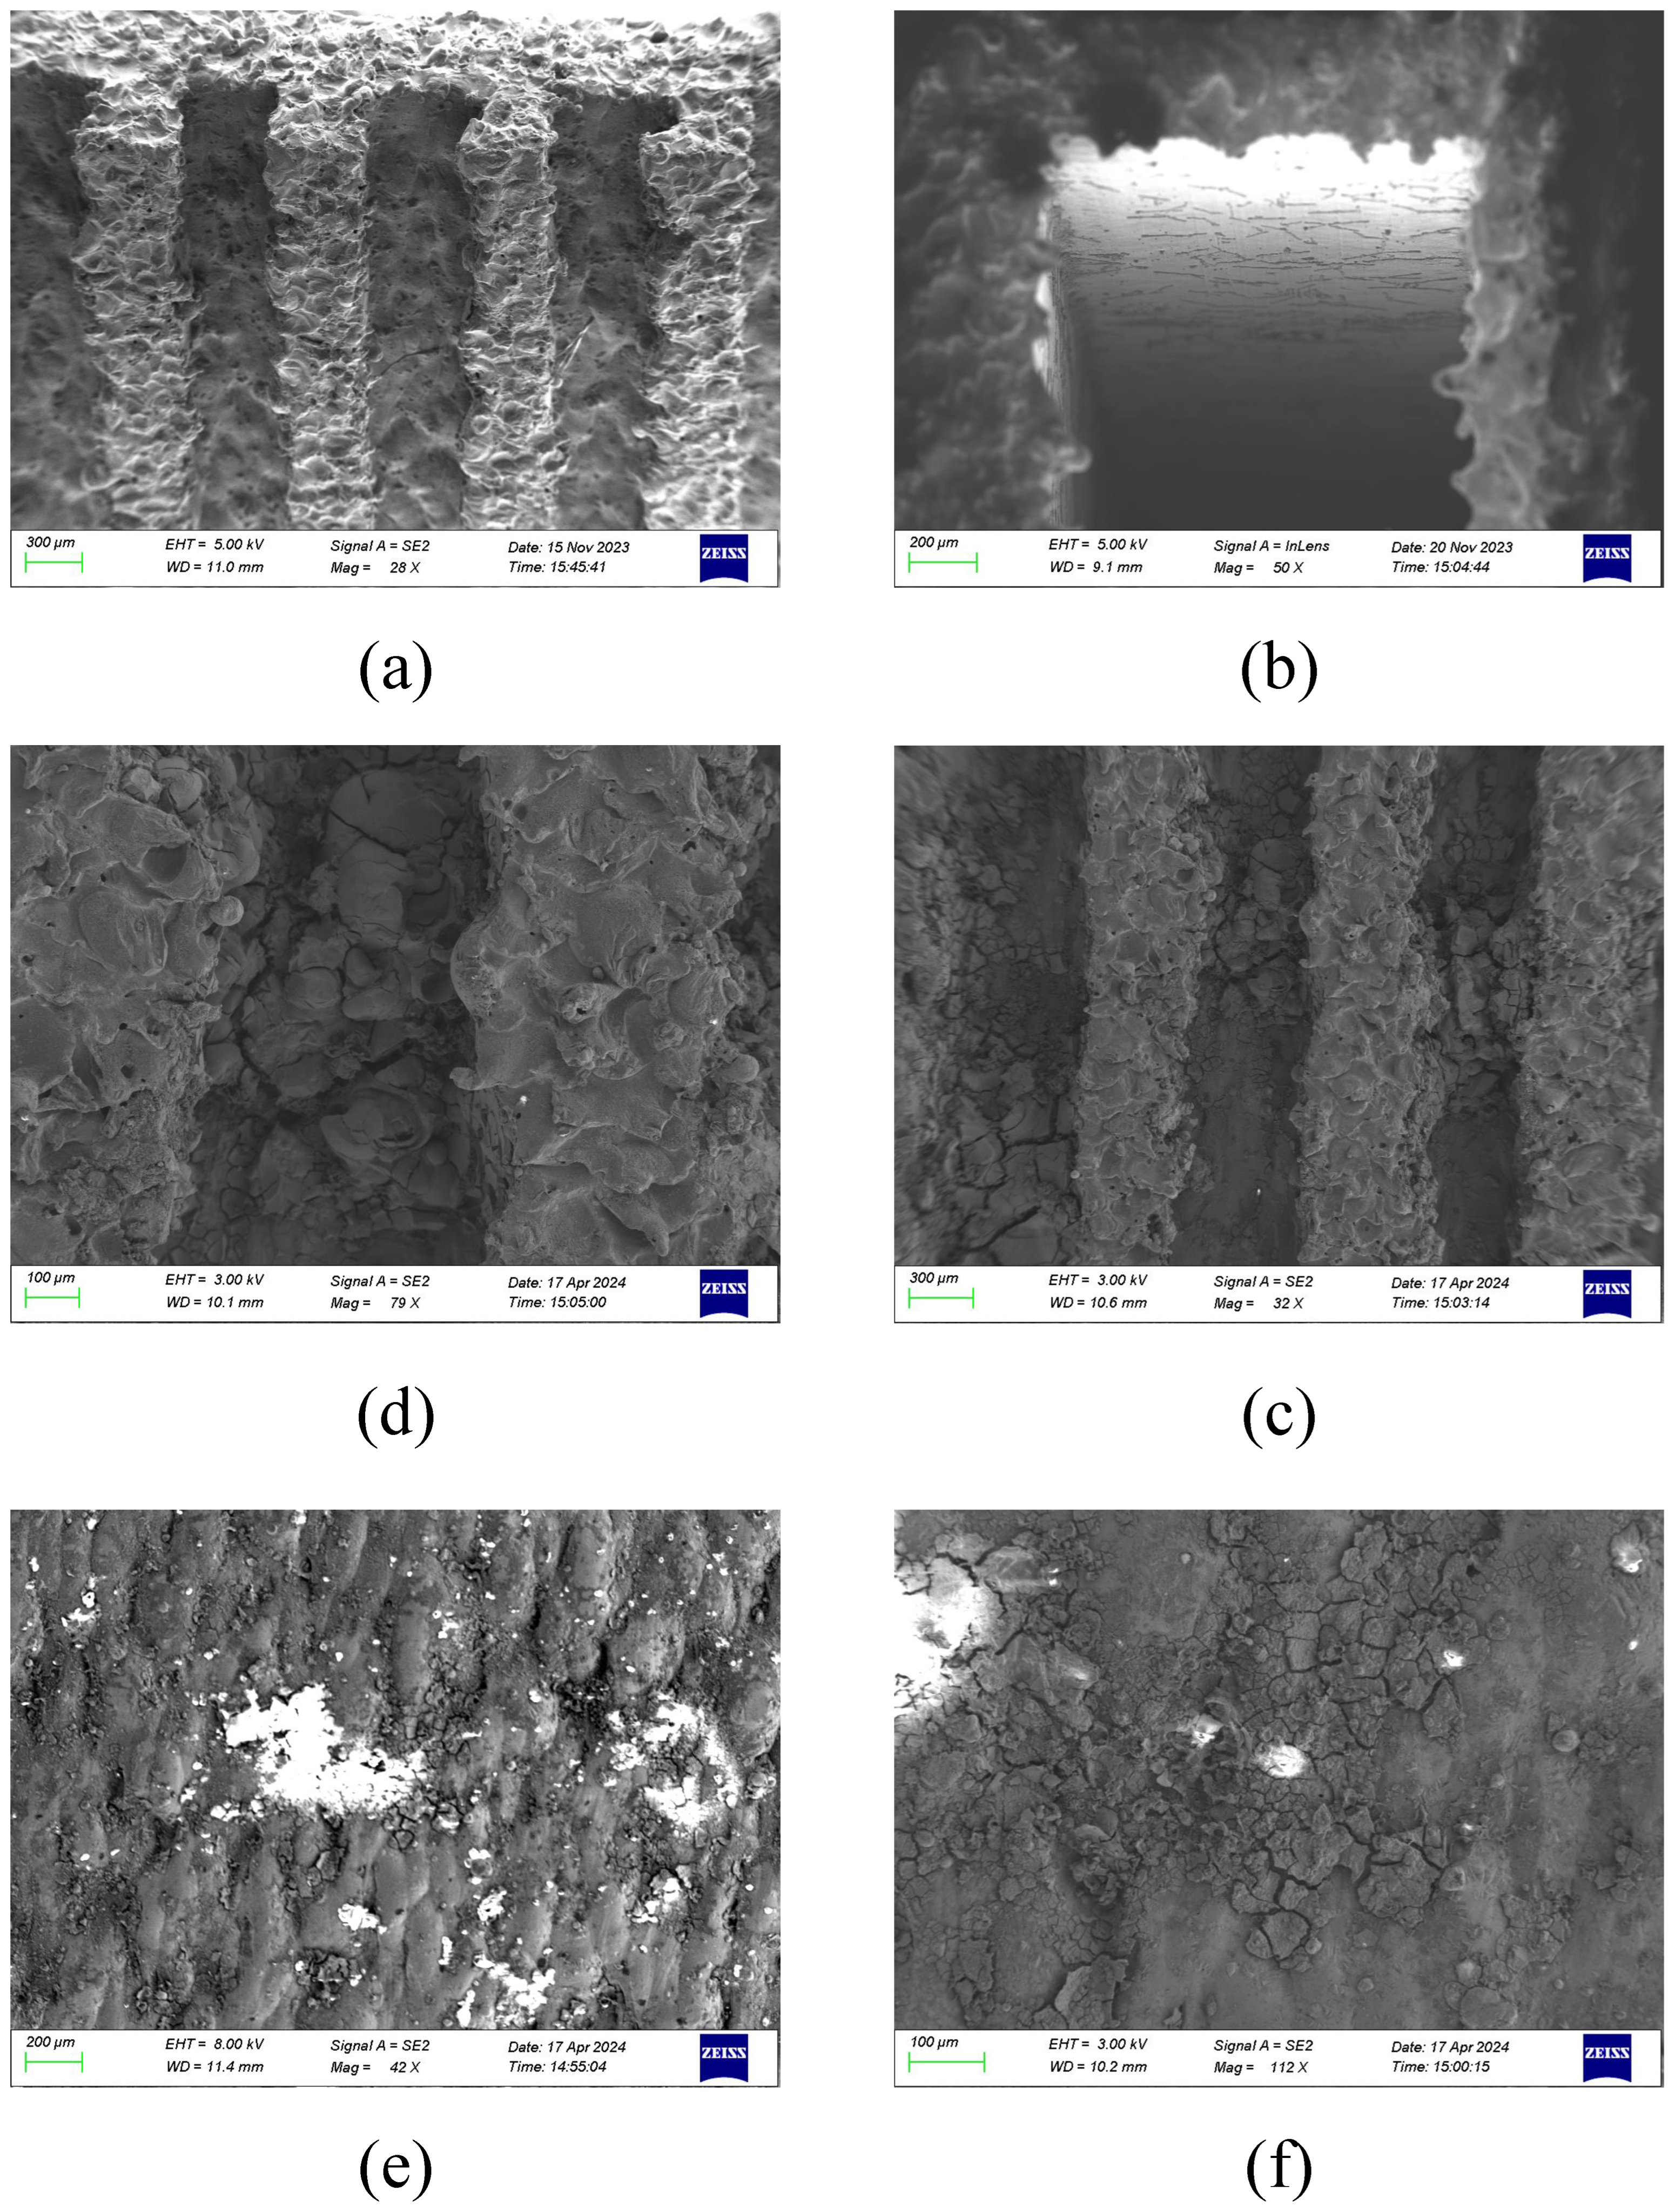
Figure 15 presents SEM images of the tube channels, illustrating that machined parts generally withstand greater pressures due to higher density, while L-PBF parts suffer from high porosity, compromising their pressure resistance. The cracks in the 1.0× tube facilitated gas leakage, with segments clumping and dislodging. The comprehensive results from this experimental study highlight porosity as the predominant factor influencing the pressure resistance capabilities of microchannels fabricated via L-PBF printing. Porosity negatively impacts the mechanical properties of materials, significantly reducing the structural integrity of PBF-printed components. This reduction in material properties is especially concerning for applications requiring high-pressure endurance. Several factors contribute to porosity development in L-PBF processes, including particle size distribution, energy input, scanning strategy, and atmospheric control during printing. Each of these elements can affect the density and mechanical strength of the final product. Empirical observations from this study reveal that increasing the wall thickness of the microchannel tubes significantly enhances their ability to withstand pressurization. This is evidenced by the comparative analysis of the 1.5× tube versus the 1.0× tube. Although the 1.5× tube exhibited minor air leakage in certain areas, its overall performance in pressurization tests was superior to that of the thinner-walled 1.0× tube. This improvement underscores the critical role of wall thickness in mitigating the adverse effects of porosity and enhancing the functional reliability of L-PBF-printed microchannels under pressure.

5. Discussion

This experiment provides a preliminary method to evaluate the approximate pressure capacity of L-PBF-printed tubes. However, some limitations and inaccuracies need to be addressed. The current approach requires further refinement and modification to achieve more precise and reliable results. The experiment was conducted with a limited number of specimens, and the variability in material properties and manufacturing parameters was not fully accounted for. Future studies should involve a larger sample size to better understand the statistical significance of the findings. Additionally, a more comprehensive consideration of parameters such as laser power, scanning speed, layer thickness, and powder quality is essential to gain a deeper insight into their effects on porosity and pressure capacity. Despite these limitations, the experiment offers a straightforward and practical way to understand the impact of porosity on pressure capacity. The visualization of bubble formation and leakage provides valuable information on the structural integrity of the tubes. While further improvements are necessary, this method lays the groundwork for future research and development, highlighting the critical role of porosity in determining the mechanical performance of L-PBF-printed components. This initial study, though limited to optimizing, serves as a stepping stone toward optimizing the structural integrity of L-PBF-printed tubes and enhancing their applicability in high-pressure environments.
From the overall experiment plan, the relationship between leakage detection, pressure distribution, and safety coefficient analysis is integral to understanding the structural integrity of the microchannel tubes under pressurized conditions. The simulation process models the pressure distribution within the tube channels, identifying areas where stress concentrations are highest, which are more prone to structural failure and can manifest as leaks during physical pressure tests. This analysis helps predict potential failure points, allowing for targeted examination during the leakage detection experiment. The safety coefficient, or safety factor, measures the margin between the material’s strength and the applied stress, evaluating the tube’s ability to withstand internal pressures without failing. A lower safety factor in certain areas suggests a higher likelihood of failure under pressure, correlating with the leakage points observed in experiments. The theoretical foundation mentioned refers to using simulation to establish baseline expectations for tube performance under pressure, identifying weak points where leakage is likely to occur, guiding experimental design, and ensuring that observed leaks correspond to predicted failure areas. These simulations provide critical insights into how pressure distribution affects structural integrity, directly informing the leakage detection experiment and allowing for a comprehensive understanding of the tube’s performance under pressurized conditions.

6. Conclusions

The purpose of this study is to help understand the pressure distribution characteristics inside the tubes through simulation software while investigating the Pressure capacity and failure phenomena of L-PBF-printed microchannel tubes. Three sets of experiments were conducted to compare the pressure capacity of flat tubes under different structural and material conditions and potential ways to improve the pressure capacity of L-PBF-printed microchannel tubes. The experiments utilized nitrogen as the pressurization agent, simulating the dynamic pressure environment typical of gaseous refrigerants in microchannels. The experimental setup included a barometric system with a pressure gauge and a variable pressure regulator to ensure precise modulation of pressure, accurately reflecting operational conditions. One of the key innovations in this research was the development and use of a novel experimental method and equipment to simulate and analyze the pressure conditions in L-PBF-printed tubes, providing a robust framework for understanding the effects of porosity on pressure capacity. In addition to the empirical experiments, simulation experiments played a critical role in this study. Through computational modeling, the simulations provided detailed insights into the distribution of stress and strain within the tube channels under various pressure conditions. By applying the von Mises stress criterion and analyzing safety factors, the simulation experiments allowed for the identification of potential failure points and regions of high-stress concentration within the tube structure. This predictive capability is invaluable, as it enables the anticipation of structural weaknesses before physical testing, thus informing more effective design modifications and enhancing the overall reliability of the manufactured components. This study also explored the material properties of the AlSi10Mg alloy commonly used in these processes and found that printing parameters significantly influence the mechanical behavior of this alloy, underscoring the necessity of controlling these parameters to mitigate inherent weaknesses such as porosity, which leads to reduced structural integrity and performance under pressure. A notable innovation was the identification of strategies such as increasing wall thickness as a potential method for enhancing the pressure-bearing capacity of PBF flat tubes, significantly improving the tubes’ ability to withstand high pressures by increasing the material volume to absorb and distribute stress more effectively. The research provided clear definitions of four phenomena observed in pressure-bearing failure: negligible bubble activity, minimal bubble activity, increased bubble emission rate, and new leakage areas. These detailed observations are critical for developing more precise methods to quantify and understand the impact of porosity on structural integrity. The findings from this study contribute substantially to the field of additive manufacturing, providing valuable insights and practical guidelines for designing and producing more reliable and efficient MCHX, paving the way for research aimed at overcoming the current limitations of PBF technology and enhancing its applicability in demanding industrial applications.

Author Contributions

J.A.: conceptualization, methodology, writing—review and editing, writing—original draft preparation; L.G.: Experiment assistant and device support; Y.Z. and T.L.: investigation, resources, software; J.Z. and K.Z.: technical instructor; L.H.: supervision, funding acquisition; Y.C.: project administration, supervision. All authors have read and agreed to the published version of the manuscript.

Funding

This work was supported by the Research Development Fund (RDF-21-02-019) and the School Research Priorities Seed Funding (SRPSF-2023-05).

Data Availability Statement

The authors do not intend to share the data associated with this study. Data sharing is not applicable due to privacy and ethical considerations.

Acknowledgments

This work was supported by the XJTLU Research Development Fund (RDF-21-02-019). We would like to express our gratitude for this funding support, which has been instrumental in carrying out this research.

Conflicts of Interest

The funders had no role in the design of the study; in the collection, analyses, or interpretation of data; in the writing of the manuscript; or in the decision to publish the results.

Abbreviations

The following abbreviations are used in this manuscript:
L-PBFlaser powder bed fusion
MCHXmicrochannel heat exchanger
PTDpressure testing device
ATacrylic tank
MPamegapascal
SEMscanning electron microscope

Appendix A

Figure A1. The real testing equipment is showcased, following the same setup method as outlined in the proposed experimental plan.
Inventions 09 00097 g0a1
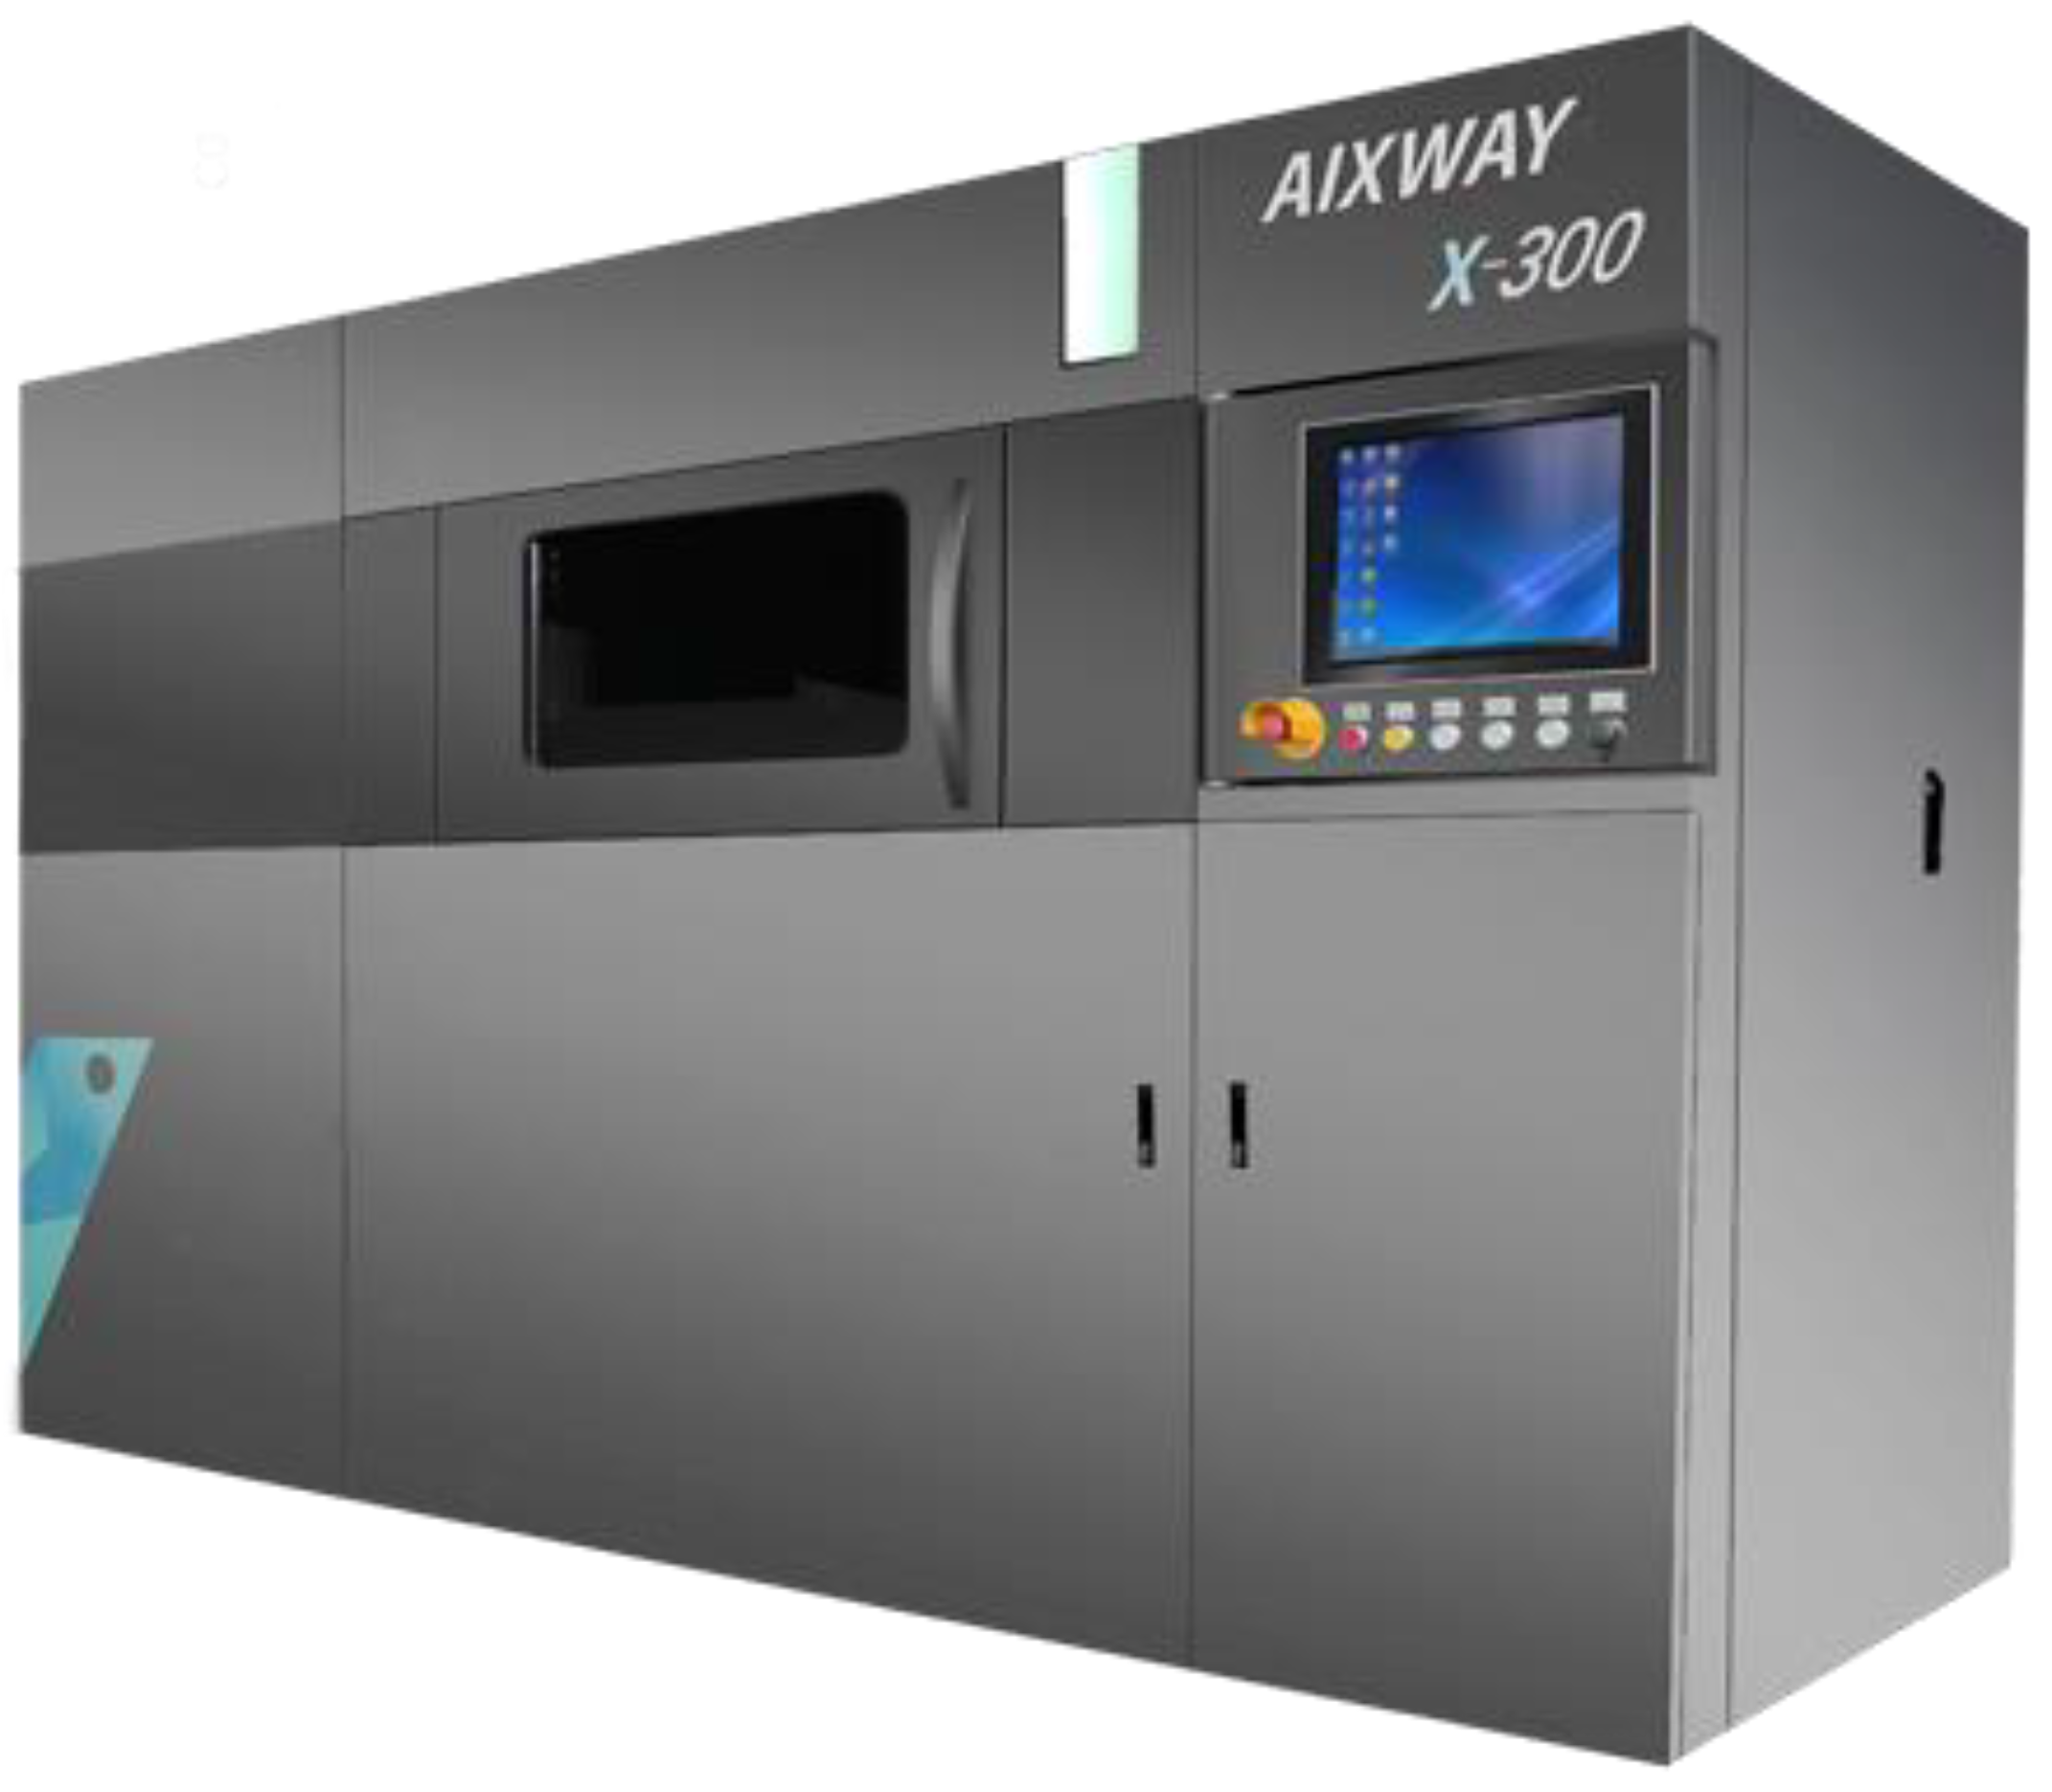
Figure A2. Depiction of the Aixway 300 L-PBF machine. The experiment employed the Aixway X-300 system, which has a molding capacity of 300 mm × 300 mm × 450 mm and a forming space of 300 mm × 300 mm × 400 mm. The powder had a particle size distribution of 10–40  μ m with D50 at 35–45  μ m and D90 at 55–65  μ m. Argon was utilized as the protective gas, with an ambient temperature maintained between 15 and 35 °C. D50 and D90 mean that fifty percent and ninety percent of the powder are in sizes smaller than this one. The system’s print layer thickness ranged from 20 to 120  μ m, with scanning parameters set at a layer thickness of 50  μ m, a scanning distance of 0.08 mm, and a scanning speed of 400 mm/s. Additionally, a 2 × 500 W YB-Fiber Laser with a spot size of ≥70  μ m was used, capable of reaching a scanning speed of 10 m/s. The preheat temperature was set at 200 °C/600 °C, and the typical surface roughness achieved was ≥3.2  μ m, with a resolution of ≥80  μ m. The overall equipment dimensions were 3000 mm × 1500 mm × 2300 mm, with a weight of approximately 2000 Kg; it required a power supply of ≥10 KW, operating on three-phase electricity at 380 V ± 10%, 50 Hz, and single-phase electricity at AC220V ± 10%, 50Hz. The outlook of the applied machine is illustrated in Figure A2.
Inventions 09 00097 g0a2
Figure A3. Bubble status of the real experiment process: (a) ‘nearly no bubbles’: the pressure is too low to compromise the tube’s structural integrity, possibly due to dissolved air or micro-perforations in the tube; (b) ‘micro and attached bubbles’: larger bubbles are present and adhere to the tube surface along with persistent microbubbles; (c) ‘micro and small bubbles’: some microbubbles grow into small bubbles that primarily remain attached to the tube surface, with clusters forming underneath; and (d) ‘numerous and violent’: a rapid increase in both the number and detachment rate of bubbles, with significant clustering observed on the lower surface.
Inventions 09 00097 g0a3

Appendix B

Figure A4. Six stages are referenced in Table 3, for the 1.0× tube pressure Performance-Experiment 1. Images were captured using a ‘GoPro HERO 12 Black’. The GoPro HERO12 Black is manufactured by GoPro, Inc., a company based in San Mateo, California, United States.
Inventions 09 00097 g0a4
Figure A5. Six stages are referenced in Table 4, for the 1.5× tube pressure Performance-Experiment 2. Images were captured using a ‘GoPro HERO 12 Black’.
Inventions 09 00097 g0a5
Figure A6. Six stages are referenced in Table 5, for the 1.0× Al tube pressure Performance-Experiment 3. Images were captured using a ‘GoPro HERO 12 Black’.
Inventions 09 00097 g0a6

References

  1. Hussain, A.R.J.; Alahyari, A.A.; Eastman, S.A.; Thibaud-Erkey, C.; Johnston, S.; Sobkowicz, M.J. Review of polymers for heat exchanger applications: Factors concerning thermal conductivity. Appl. Therm. Eng. 2017, 113, 1118–1127. [Google Scholar] [CrossRef]
  2. Zahir, M.Z.; Ahmed, A.; Akhtar, K.; Mehmood, A. Microchannel Heat Exchanger (MCHX) for Waste Heat Recovery Using Water and Organic Fluid. J. Appl. Emerg. Sci. 2023, 13, 67–75. [Google Scholar]
  3. Lei, H.; Li, C.; Meng, J.; Zhou, H.; Liu, Y.; Zhang, X.; Wang, P.; Fang, D. Evaluation of compressive properties of SLM-fabricated multi-layer lattice structures by experimental test and μ-CT-based finite element analysis. Mater. Des. 2019, 169, 107685. [Google Scholar] [CrossRef]
  4. Du Plessis, A. Porosity in laser powder bed fusion. In Fundamentals of Laser Powder Bed Fusion of Metals; Elsevier: Amsterdam, The Netherlands, 2021; pp. 155–178. [Google Scholar]
  5. Morano, C.; Pagnotta, L. Additive manufactured parts produced by selective laser sintering technology: Porosity formation mechanisms. J. Polym. Eng. 2023, 43, 537–555. [Google Scholar] [CrossRef]
  6. Stránský, O.; Beránek, L.; Pathak, S.; Kaufman, J.; Böhm, M.; Kopeček, J.; Holešovský, F.; Petrášek, Š.; Hlavňková, L.; Soukup, Z. Porosity and microstructure of L-PBF printed AlSi10Mg thin tubes in laser shock peening. J. Mater. Res. Technol. 2023, 27, 1683–1695. [Google Scholar] [CrossRef]
  7. Kleinschmit, N.N. A Shock Tube Technique for Blast Wave Simulation and Studies of Flow Structure Interactions in Shock Tube Blast Experiments. Master’s Thesis, University of Nebraska-Lincoln, Lincoln, NE, USA, 2011. [Google Scholar]
  8. Kumar, R.; Nedungadi, A. Using gas-driven shock tubes to produce blast wave signatures. Front. Neurol. 2020, 11, 90. [Google Scholar] [CrossRef] [PubMed]
  9. Zou, J.; Hirokawa, T.; An, J.; Huang, L.; Camm, J. Recent advances in the applications of machine learning methods for heat exchanger modeling—A review. Front. Energy Res. 2023, 11, 1294531. [Google Scholar] [CrossRef]
  10. Chmielewska, A.; Wysocki, B.; Kwaśniak, P.; Kruszewski, M.J.; Michalski, B.; Zielińska, A.; Adamczyk-Cieślak, B.; Krawczyńska, A.; Buhagiar, J.; Święszkowski, W. Heat treatment of NiTi alloys fabricated using laser powder bed fusion (LPBF) from elementally blended powders. Materials 2022, 15, 3304. [Google Scholar] [CrossRef] [PubMed]
  11. Khairallah, S.A.; Anderson, A.T.; Rubenchik, A.; King, W.E. Laser powder-bed fusion additive manufacturing: Physics of complex melt flow and formation mechanisms of pores, spatter, and denudation zones. Acta Mater. 2016, 108, 36–45. [Google Scholar] [CrossRef]
  12. Ceccanti, F.; Giorgetti, A.; Arcidiacono, G.; Citti, P. Laser powder bed fusion: A review on the design constraints. In Proceedings of the IOP Conference Series: Materials Science and Engineering; IOP Publishing: Bristol, UK, 2021; Volume 1038, p. 012065. [Google Scholar]
  13. Singh, R.; Gupta, A.; Tripathi, O.; Srivastava, S.; Singh, B.; Awasthi, A.; Rajput, S.K.; Sonia, P.; Singhal, P.; Saxena, K.K. Powder bed fusion process in additive manufacturing: An overview. Mater. Today Proc. 2020, 26, 3058–3070. [Google Scholar] [CrossRef]
  14. Zhang, J.; Li, B. The Influence of Laser Powder Bed Fusion (L-PBF) Process Parameters on 3D-Printed Quality and Stress–Strain Behavior of High-Entropy Alloy (HEA) Rod-Lattices. Metals 2022, 12, 2109. [Google Scholar] [CrossRef]
  15. Kempen, K.; Thijs, L.; Van Humbeeck, J.; Kruth, J.-P. Mechanical properties of AlSi10Mg produced by selective laser melting. Phys. Procedia 2012, 39, 439–446. [Google Scholar] [CrossRef]
  16. Wu, Z.; Narra, S.P.; Rollett, A. Exploring the fabrication limits of thin-wall structures in a laser powder bed fusion process. Int. J. Adv. Manuf. Technol. 2020, 110, 191–207. [Google Scholar] [CrossRef]
  17. Rastan, H.; Abdi, A.; Hamawandi, B.; Ignatowicz, M.; Meyer, J.P.; Palm, B. Heat transfer study of enhanced additively manufactured minichannel heat exchangers. Int. J. Heat Mass Transf. 2020, 161, 120271. [Google Scholar] [CrossRef]
  18. Gong, H.; Rafi, K.; Gu, H.; Starr, T.; Stucker, B. Analysis of defect generation in Ti–6Al–4V parts made using powder bed fusion additive manufacturing processes. Addit. Manuf. 2014, 1, 87–98. [Google Scholar] [CrossRef]
  19. Du Plessis, A.; Yadroitsava, I.; Yadroitsev, I. Effects of defects on mechanical properties in metal additive manufacturing: A review focusing on X-ray tomography insights. Mater. Des. 2020, 187, 108385. [Google Scholar] [CrossRef]
  20. Rahman, M.E.; Weibel, J.A. Influence of convective heat transfer and wall thermal capacity on dynamic interactions between wall temperature and pressure drop oscillations during microchannel flow boiling. Int. J. Heat Mass Transf. 2024, 221, 125111. [Google Scholar] [CrossRef]
  21. Silva, E.C.; Candiango, J.A.; Rodrigues, S.J.; Sampaio, Á.M.; Pontes, A.J. Hybrid Manufacturing of Aluminium Parts Combining Additive and Conventional Technologies—Mechanical and Thermal Properties. J. Manuf. Mater. Process. 2022, 6, 40. [Google Scholar] [CrossRef]
  22. Lv, F.; Shen, L.; Liang, H.; Xie, D.; Wang, C.; Tian, Z. Mechanical properties of AlSi10Mg alloy fabricated by laser melting deposition and improvements via heat treatment. Optik 2019, 179, 8–18. [Google Scholar] [CrossRef]
  23. Jing, C.; Hou, W.; Wang, X.; Chu, S.; Yang, Z. Microstructure, porosity and mechanical properties of selective laser melted AlSi10Mg. Chin. J. Aeronaut. 2020, 33, 2043–2054. [Google Scholar]
  24. Lind, N.C. Consistent partial safety factors. J. Struct. Div. 1971, 97, 1651–1669. [Google Scholar] [CrossRef]
  25. Chai, L.; Xia, G.; Zhou, M.; Li, J.; Qi, J. Optimum thermal design of interrupted microchannel heat sink with rectangular ribs in the transverse microchambers. Appl. Therm. Eng. 2013, 51, 880–889. [Google Scholar] [CrossRef]
  26. Wang, Y.-Z.; Li, G.-Q.; Wang, Y.-B.; Lyu, Y.-F. Simplified method to identify full von Mises stress-strain curve of structural metals. J. Constr. Steel Res. 2021, 181, 106624. [Google Scholar] [CrossRef]
  27. Amstutz, S.; Novotny, A.A. Topological optimization of structures subject to von Mises stress constraints. Struct. Multidiscip. Optim. 2010, 41, 407–420. [Google Scholar] [CrossRef]
  28. Mischke, C.R. Fitting Weibull strength data and applying it to stochastic mechanical design. J. Mech. Des. 1992, 114, 29–34. [Google Scholar] [CrossRef]
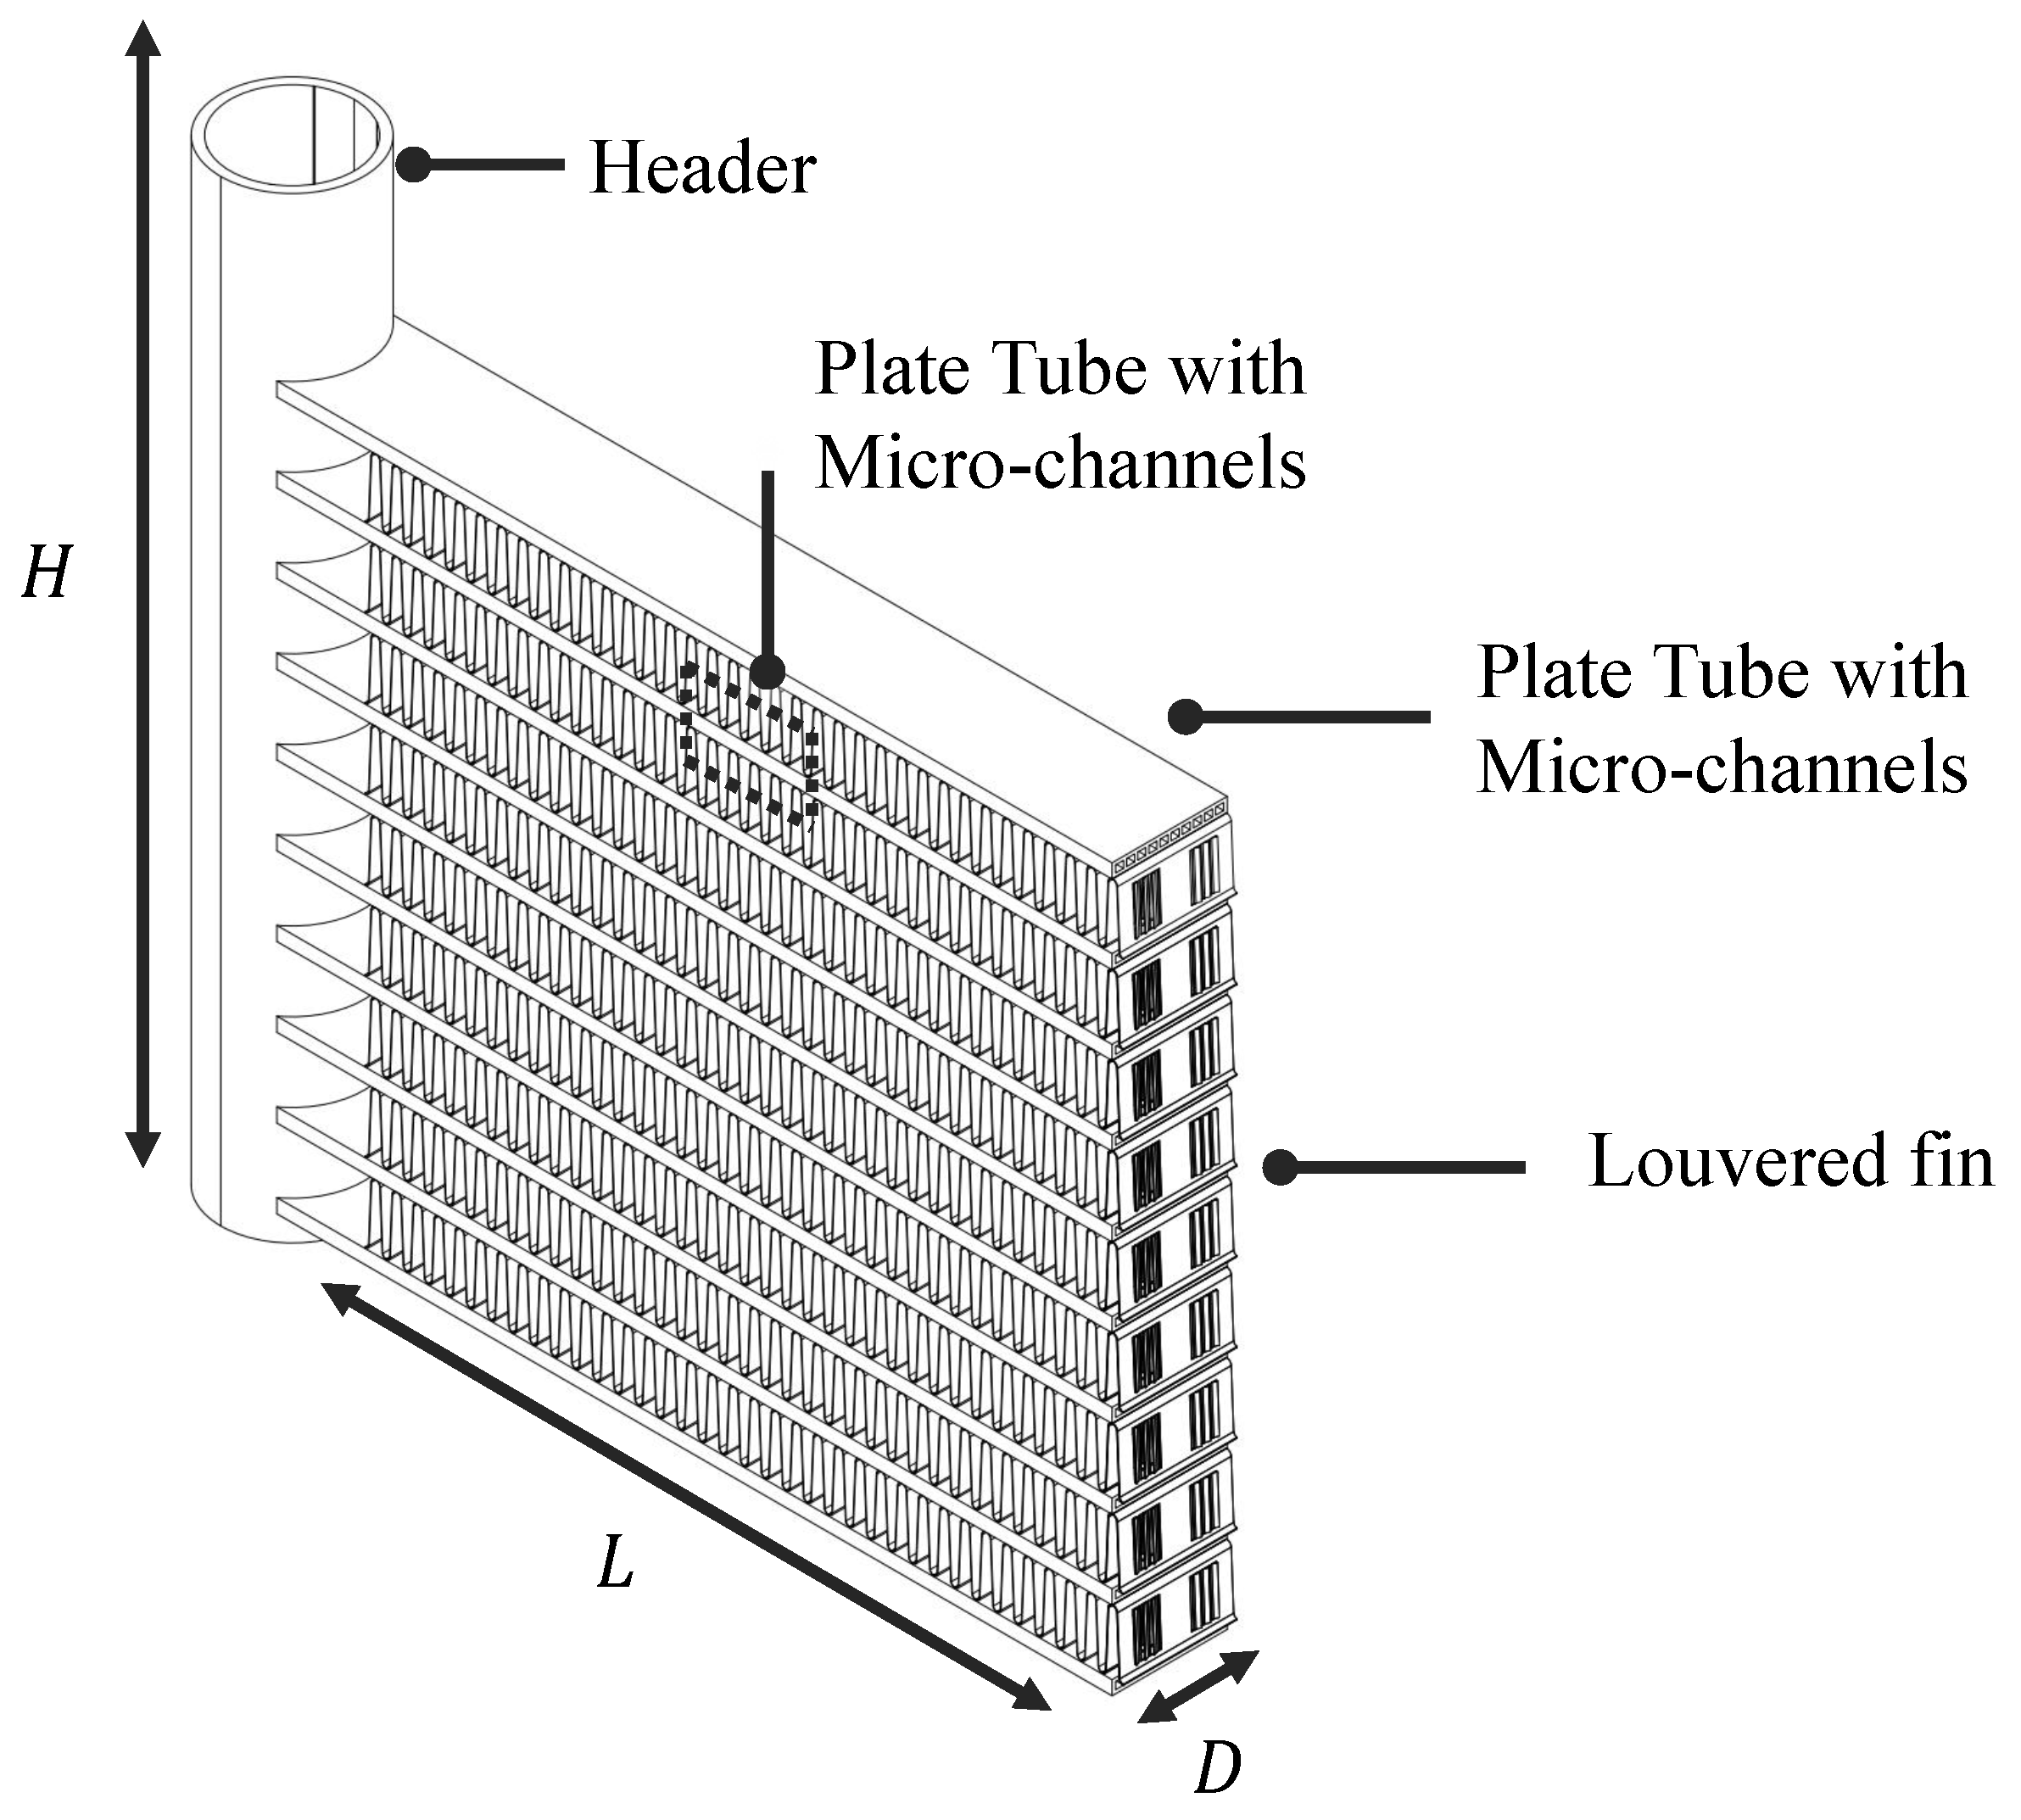
Figure 1. A simple showcase of the MCHX. Key components include the header, plate tubes with microchannels, and louvered fins. The diagram highlights the height (H), length (L), and width (D) dimensions of the MCHX, providing a clear view of its configuration and essential elements [9].
Inventions 09 00097 g001
Figure 2. A simple Basic working principles of L-PBF. A powder roller spreads a thin layer of metal powder from the powder stock onto the powder bed, and the laser melts the powder according to the part’s digital design. After each layer is fused, the build platform moves down to allow a new layer of powder to be spread, repeating the process until the part is fully formed. The arrows indicate the movement direction of each L-PBF component.
Inventions 09 00097 g002
Figure 3. Experiment workflow illustration.
Inventions 09 00097 g003
Figure 4. Transparent three-quarter section view. (a) 1.0× AlSi10Mg tube with a wall thickness of 0.35 mm; (b) 1.5× AlSi10Mg tube with a wall thickness of 0.53 mm; (c) 1.0× aluminum tube with a wall thickness of 0.35 mm.
Inventions 09 00097 g004
Figure 5. Cross-sectional dimensions of the 1.0× and 1.5× microchannel tubes are as follows: (a) The 1.0× tube features a channel width of 0.77 mm, a height of 1.1 mm, and a wall thickness of 0.35 mm. (b) The 1.5× tube has a channel width of 0.77 mm, a height of 0.75 mm, and a wall thickness of 0.53 mm.
Inventions 09 00097 g005
Figure 6. Illustration of the boundary conditions: (a) The front face of the tube is fixed. (b) Similarly, the opposite face of the tube is also fixed. (c) A uniform pressure is applied to all channel surfaces. (d) Mesh configuration is displayed.
Inventions 09 00097 g006
Figure 7. Simulation results for von Mises stress of three tubes.
Inventions 09 00097 g007
Figure 8. Simulation results for safety factors of three tubes.
Inventions 09 00097 g008
Figure 9. The diagram illustrates the von Mises stress distribution on three tubes under a channel pressure of 8 MPa. The tubes shown are the 1.0× tube, the 1.5× tube, and the 1.0× aluminum tube, each displayed in a transparent three-quarter section view. The colour bar represents the distribution of von Mises stress, ranging from a minimum value of 0 MPa to a maximum of 40 MPa.
Inventions 09 00097 g009
Figure 10. The diagram illustrates the safety factor distribution on three tubes under a channel pressure of 8 MPa. The tubes shown are the 1.0× tube, the 1.5× tube, and the 1.0× aluminum tube, each displayed in a transparent three-quarter section view. The colour bar represents the distribution of safety factor, ranging from a minimum value of 0 to a maximum of 40.
Inventions 09 00097 g010
Figure 11. The face area is classified into two main parts, area A as the red color, and area B (yellow) as another area.
Inventions 09 00097 g011
Figure 12. Experimental procedure. (a) Initial setup: Prepare the experimental setup by ensuring the nitrogen gas supply and pressure regulating equipment are properly configured and connected to the sample. (b) Baseline measurement: Apply an initial pressure of 1 MPa to the sample and maintain it for 10 min to establish a baseline for the tube’s condition. (c) Incremental pressure application: Gradually increase the pressure in 0.2 MPa increments, maintaining each pressure level for 10 min if no observable changes occur, continuing until a maximum pressure of 2 MPa is reached. (d) Monitoring and documentation: At each pressure increment, utilize high-definition video and photography to document the tube’s surface condition, specifically observing for bubble formation or any signs of leakage. (e) Data analysis and recording: Analyze the visual data collected to identify the pressure point at which leakage begins, recording the findings for further analysis regarding the tube’s pressure endurance and structural integrity.
Inventions 09 00097 g012
Figure 13. Bubble status: (a) ‘nearly no bubbles’, where the pressure is insufficient to compromise the tube’s structural integrity, possibly due to dissolved air or micro-perforations in the tube. This stage shall be considered as no leakages; (b) ‘micro and attached bubbles’, where larger bubbles are present and adhere to the tube surface along with persistent microbubbles; (c) ‘microbubbles and small bubbles’, where some microbubbles grow into small bubbles that primarily remain attached to the tube surface, with clusters forming underneath; and (d) ‘numerous and violent’, characterized by a rapid increase in both the number and detachment rate of bubbles, with significant clustering observed on the lower surface.
Inventions 09 00097 g013
Figure 14. Cross-sectional area showing the porosity distribution in one of the L-PBF-printed tubes with a 1.0× wall thickness.
Inventions 09 00097 g014
Figure 15. SEM images illustrating the channels: (a) Tubes that have not undergone pressure testing. (b) Machined tube channel surface. (c) Cracks in the inner tube channel (wide field view). (d) Cracks in the inner tube channel (focused view). (e) Cracks in the inner tube channel (wide field view). (f) Cracks in the inner tube channel (focused view). The white areas in (e,f) are impurities.
Inventions 09 00097 g015
Table 1. Zhang’s experiment setting and testing results [14].
ParameterValue
Orientation90° micro-rod (Parallel to the vertical direction)
Laser power190 W
Scanning speed900 mm/s
Displacement rate0.1 mm/min
Tensile strength509 MPa (approx.)
Test resultElastic modulus in 73 GPa (50% of forged samples)
Table 2. Physical properties of AlSi10Mg.
TagValue
Thermal Conductivity   1.630 × 10 2 W / ( m · K )
Specific heat0.730 J/g·°C
Thermal expansion coefficient21.800 µm/m·°C
Young’s modulus54.500 GPa
Poisson’s ratio0.25
Shear modulus20.960 MPa
Density2.640 g/cm3
Damping coefficient0.002(0)
Yield strength102.100 MPa
Tensile strength296.000 MPa
Table 3. The 1.0× tube pressure Performance-Experiment 1.
StagePressure Gauge ValueTime StepImportant Time StepLeakage LevelBubbles Performance
Stage 11.0 MPa0 s0 min 34 smediumnumerous and violent
Stage 21.2 MPa10 min-highnumerous and violent
Stage 31.4 MPa20 min-highnumerous and violent
Stage 41.6 MPa30 min-extremenumerous and violent
Stage 51.8 MPa40 min-extremenumerous and violent
Stage 62.0 MPa60 min-extremenumerous and violent
Table 4. The 1.5× tube pressure Performance-Experiment 2.
StagePressure Gauge ValueTime StepImportant Time StepLeakage LevelBubbles Performance
Stage 11.0 MPa0 s-NoNearly-no-bubbles
Stage 21.2 MPa10 min10 min 23 sslightmicro and attached bubbles
Stage 31.4 MPa20 min20 min 12 sslightmicro and small bubbles
Stage 41.6 MPa30 min-lowmicro and small bubbles
Stage 51.8 MPa40 min-lowmicro and small bubbles
Stage 62.0 MPa60 min-lowmicro and small bubbles
Table 5. The 1.0× Al tube pressure Performance-Experiment 3.
StagePressure Gauge ValueTime StepImportant Time StepLeakage LevelBubbles Performance
Stage 11.0 MPa0 s-NoNearly No Bubbles
Stage 21.2 MPa10 min-NoNearly No Bubbles
Stage 31.4 MPa20 min-NoNearly No Bubbles
Stage 41.6 MPa30 min-NoNearly No Bubbles
Stage 51.8 MPa40 min-NoNearly No Bubbles
Stage 62.0 MPa60 min-slightmicro and attached bubbles
Disclaimer/Publisher’s Note: The statements, opinions and data contained in all publications are solely those of the individual author(s) and contributor(s) and not of MDPI and/or the editor(s). MDPI and/or the editor(s) disclaim responsibility for any injury to people or property resulting from any ideas, methods, instructions or products referred to in the content.