Article

Repeatability and Validity of Different Methods to Determine the Anaerobic Threshold Through the Maximal Multistage Test in Male Cyclists and Triathletes

1
AKTIBOki, Research Group in Physical Activity, Physical Exercise and Sport, Department of Physical Education and Sport, Faculty of Education and Sport, University of the Basque Country (UPV/EHU), 01007 Vitoria-Gasteiz, Spain
2
Society, Sports and Physical Exercise Research Group (GIKAFIT), Department of Physical Education and Sport, Faculty of Education and Sport, University of the Basque Country (UPV/EHU), 01007 Vitoria-Gasteiz, Spain
3
Physical Activity, Exercise, and Health Group, Bioaraba Health Research Institute, Basque Country, 01007 Vitoria-Gasteiz, Spain
4
Faculty of Education and Sport, University of the Basque Country (UPV/EHU), 01007 Vitoria-Gasteiz, Spain
*
Author to whom correspondence should be addressed.
J. Funct. Morphol. Kinesiol. 2025, 10(1), 9; https://doi.org/10.3390/jfmk10010009
Submission received: 1 December 2024 / Revised: 17 December 2024 / Accepted: 24 December 2024 / Published: 27 December 2024
(This article belongs to the Special Issue Applied Sport Physiology and Performance—4th Edition)

Abstract

:
Objectives: The aim of this study was to analyze the repeatability and validity of different methods to determine the anaerobic threshold through a maximal multistage cycling test; Methods: In total, 17 male endurance-trained athletes [7 cyclists and 10 triathletes, age 33.2 ± 6.9 yr, workload at maximal lactate steady state (MLSSW) 268 ± 27 W] participated in the study. The participants performed a maximal multistage cycling test twice to analyze the repeatability of the anaerobic threshold (AT) using nine different methods. In the remaining sessions, several 20 min constant load tests were performed to determine MLSSW (gold standard); Results: The workload corresponding to 73% of the maximal power (AT73Pmax) showed the best repeatability followed by the Dmax method calculated from the blood lactate concentration ([La]) associated with the Minimum Lactate Equivalent and final [La] (DmaxLE). Validity analyses showed that all AT determined in the present study were strong predictors of MLSSW, however, AT73Pmax and the workloads at 1.5 mmol·L−1 above the first lactate threshold significantly underestimated MLSSW. The use of correction equations for these variables lowered their absolute mean bias to <5 W. DmaxLE and workload associated with the 86% of the maximal heart rate showed the narrowest limits of agreement to estimate MLSSW closely followed by corrected AT73Pmax; Conclusions: AT73Pmax, using the correction equation and DmaxLE, stand out as powerful predictors of MLSSW among the variables analyzed in the present study in trained cyclists or triathletes. Sports physiologists and coaches can use corrected AT73Pmax and DmaxLE to accurately assess athletes’ endurance capacity and prescribe their training.

1. Introduction

Endurance-cycling and triathlon are sports in which the aerobic capacity of athletes is crucial for their competitive performance [1,2]. The exercise intensity corresponding to the maximal lactate steady state (MLSSW), the highest workload that can be maintained over time without continual blood lactate accumulation [3,4], is regarded by many sport and exercise physiologists as one of the reference methods for the assessment of aerobic capacity [5,6,7,8,9,10]. MLSSW estimates performance in endurance sports lasting 30–60 min [4,11,12]; it is unique to each individual and it can be useful to establish training intensities [13] since authors have presented evidence that exercising at workloads where blood lactate concentration remains stable may reduce risk of overtraining [14]. In addition, MLSSW defines the genuine boundary discriminating between the heavy and severe exercise intensity domains [15,16]. These studies accentuate the importance of MLSSW identification in the physiological profiling of endurance cyclists or triathletes because establishing training intensities based on the MLSSW concept avoids overtraining and reduces the risk of injury [16,17].
The determination of the MLSSW requires the performance of 3–6 subsequent tests on separate days. As this procedure is time-consuming and may interfere with the training process, simpler methods based on a single maximal multistage test measuring ventilation or blood lactate concentration ([La]) are usually utilized to estimate MLSSW. The exercise intensities determined based on these methods are usually referred to as anaerobic threshold. Equipment for measuring gas exchange is quite expensive, so it is interesting to look for more cost-effective alternatives. Among the methods that require [La] measurement, estimators based on the first lactate threshold [18,19,20,21], fixed [La] [11,18,20], and the modified Dmax method [22,23] are commonly utilized as surrogates for estimating MLSSW. Note that some predictors of MLSSW are based on the first lactate threshold, even though this threshold represents a lower exercise intensity than MLSSW. Maximal aerobic workout (Pmax) or fixed percentages of Pmax and maximal heart rate (HRmax) have also been proposed as MLSSW predictors [6,7,18]. However, the generalizability of these MLSSW estimates is limited to the running protocols previously employed. It is, therefore, uncertain whether these MLSSW estimates apply to other exercise modes, such as cycling.
The assessment of repeatability is an important aspect of examining alternative methods because measurement errors can seriously affect statistical analysis and interpretation. Determining minimum detectable changes (MDC) of MLSSW predictors is especially useful because it allows exercise physiologists, trainers, and sports practitioners to distinguish individual actual changes in anaerobic thresholds from the measurement error. As far as we are concerned, the repeatability, MDC, and validity of most of the MLSSW predictors abovementioned have not been compared. Therefore, the aims of this study were to compare the repeatability, MDC, and validity (considering the MLSSW as the gold standard) of different cost-effective methods to determine the anaerobic threshold through a maximal multistage test in male cyclists and triathletes. This study focused on methods based on the Minimum Lactate Equivalent (LEmin, the minimum value of the [La]/Workload vs. Workload curve fitting during an incremental test) related intensities, workload at fixed [La], Dmax, and fixed relative HR and power values.

2. Materials and Methods

2.1. Participants

Seventeen amateur male endurance-trained athletes who were at the level of tier 2 [23] (seven cyclists and ten triathletes; means ± standard deviation, age 33.2 ± 6.9 yr, height 177.7 ± 8.3 cm, body mass 74.9 ± 10.1 kg, body fat 8.6 ± 2.9%) voluntarily participated in this study. Participants were required to meet the following inclusion criteria: (1) being a male triathlete or cyclist aged between 18 and 45 years, (2) had been consistently involved in triathlon or cycling training for at least 2 years and had participated in a triathlon or cycling event prior to participation in the study, and (3) had a training routine of ≥2 cycling training sessions a week during the last two months. Some participants were triathletes and, in addition to ≥2 bicycle sessions, also trained in running and swimming. All participants completed at least four endurance sessions per week. The exclusion criteria were (1) taking any medications or substances known to influence physical performance, [La] or HR, and (2) having any musculoskeletal injury and illness that might limit their full participation. Written informed consent was obtained from all participants before the start of this study, which was approved by an Ethics Committee (code M10_2018_215) and conformed to the guidelines of the Declaration of Helsinki [24].

2.2. Study Design

A repeatability and validity study was conducted to determine MLSSW from a maximal multistage cycling test (MMCT). For each participant, testing was conducted over 8–11 laboratory sessions separated by at least 2 days. In the first session, an initial evaluation (a training history and injury and illness questionnaire), anthropometric measurements, and a preliminary familiarization cycling trial were performed. In the second and third sessions, participants performed an identical maximal multistage cycling test (MMCT1 and MMCT2) to calculate the anaerobic threshold or its estimator (AT) using nine different methods and their repeatability. In the remaining sessions, several 20-min constant load tests (CLTs) were performed to determine twice MLSSW for each participant. The mean value of two MLSSW determinations as a proxy of aerobic cycling performance was used to study the validity of different ATs.

2.3. Testing Procedures

The same researcher took measurements on every cyclist and triathlete at a similar time of day (±2.5 h) for each of them. All participants were required not to engage in any vigorous activity during the 2 days before each test. To facilitate the replenishment of carbohydrate stores and adequate hydration status during the period of the study, they received specific instructions on how to increase their dietary carbohydrate intake and hydration. The athletes were required to maintain their training protocol in terms of volume and intensity, and their lifestyle was unchanged (i.e., physical activity and hours of sleep). They were also required to have abstained from alcohol and caffeine intake for 12 h and from a substantial meal for 2 h. All the cycling trials were performed in the same facility and on the same cycloergometer (ERGelek EG2, Vitoria-Gasteiz, Spain), which was adapted for use with triathlon bars and calibrated by the manufacturer prior to the experiment. The cycloergometer provided work rates that were independent of pedal frequencies. The total test period for a participant was shorter than 8 weeks. The athletes used the same cycling shoes, and no fan was used for the tests. The room temperature during the whole testing period was 18.6 ± 2.3 °C and the relative humidity (49 ± 9%).

2.4. Preliminary Trial

During the preliminary trial, participants were familiarized with the methodology after they had made adjustments to the cycloergometer for proper fit. This trial consisted of a submaximal multistage exercise in a cycloergometer up to 85% of the estimated HRmax (HRmax = 220 − age). The athletes were free to choose any constant pedal cadence between 75 and 95 rpm and were required to maintain the exact cadence chosen in the following tests. No data from the preliminary trial were analyzed.

2.5. Maximal Multistage Cycling Test (MMCT)

A MMCT was conducted twice, 2–6 days apart, to determine duplicate AT. The test started at 30 W and increased by 30 W every 3 min until volitional exhaustion. This protocol, which was similar to that used in other studies with trained cyclists [25,26,27,28,29], was chosen to ensure that an adequate number of blood [La] measuring points were used both as the basis lactate and for the determination of the LEmin [18]. Stage duration of 3 min was chosen because it is the minimum stage duration needed [La] to remain stable in each exercise stage [20]. The test terminated when the participants could not maintain the pedal cadence despite strong verbal encouragement. Perceived exertion was determined at the end of each MMCT [30]. Maximal effort criteria were considered to verify the outcomes, from which participants must have reached at least two from the list: (a) failure of HR to increase with further increases in exercise intensity, (b) [La] > 9 mmol·L−1, and (c) a rating of perceived exertion (RPE) ≥ 18 on the 6–20 scale. Blood samples were collected while the participant was cycling to measure [La] at rest, at the last 15 s of each stage, and at the end of the test. An earlobe was cleaned and dried before puncturing by a lancet for blood sampling. After discarding the first drop, a capillary blood sample was obtained and [La] was determined via amperometric measurement using a portable analyzer (Lactate Pro 2; Arkray, Kyoto, Japan). Participants were blinded to the elapsed time, exercise intensity, and physiological measurements but they continuously received visual feedback for the pedal cadence. The maximal aerobic workout (Pmax) was estimated as follows: Pmax = Power of last completed stage (W) + [t (s)/180·30] where ‘t’ is the time sustained during the incomplete stage. HR was registered at 1 s intervals using an HR monitor (Sportester, Polar, Kempele, Finland) and HRmax was considered as the highest 5 s average.
Five ATs and four estimators of the theoretical AT were determined mathematically during MMCT. The ATs determined mathematically during MMCT were the following: (1) the workload at 1.5 mmol·L−1 above the [La] associated with the lowest stage above which [La] increased by ≥0.1 mmol·L−1 in the following stage and ≥0.2 mmol·L−1 in the subsequent stage (LT1+1.5mM) [18]. (2) The workload corresponding to the Minimum Lactate Equivalent (LEmin) plus 1.5 mmol·L−1 (LE+1.5mM). The workload at 1.5 mmol·L−1 above the [La] associated with the LEmin in the individual [La] vs. workload second-order polynomial curves. The LEmin was considered the minimum value of the quotient [La]/Workload in the individual [La]/Workload vs. Workload second-order polynomial curves. Using an appropriate protocol, the incremental test produces a “U-shaped” curve. The lower limit of this curve is considered the intensity at the LEmin. The [La] that corresponded to this intensity was determined in the individual [La] vs. workload second-order polynomial curves. Once 1.5 mmol·L−1 was added to the determined [La], the intensity corresponding to the resulting [La] was determined in the last mentioned curves. For more details, see Berg et al. [31]. (3) The workload at 1.5 mmol·L−1 in the individual [La] vs. workload second-order polynomial curves above the average of the first four [La] values of exercise (LT2) [32]. (4) The workload at the maximum perpendicular distance from the straight line between the [La] is associated with the Minimum Lactate Equivalent and final [La] data point in the third-order polynomial curve describing the [La] kinetics during the MMCT (DmaxLE) [22]. (5) The workload at the maximum perpendicular distance from the straight line between the [La] associated with the previous stage to the one that the [La] increased ≥0.4 mmol·L−1 and final [La] data point in the third-order polynomial curve describing the [La] kinetics during the MMCT (Dmax0.4) [21]. The four estimators of the theoretical AT determined mathematically during MMCT were the following: (1) and (2) the workloads at fixed [La] of 3.5 mmol·L−1 (LT3.5mM) and 4 mmol·L−1 in the individual [La] vs. workload second-order polynomial curves (LT4mM) [20]. (3) The workload corresponds to 73% of the Pmax (AT73Pmax). The specific value of 73% was chosen because the average taken across a series of studies using different participant characteristics and protocols showed that cycling the MLSSW corresponded, on average, to 73% of the maximal workload (Pmax) [33,34,35]. (4) The workload at 86% of HRmax (AT86HRmax). The specific value of 86% was chosen to take into account the study by Snyder et al. [36], who showed that this is approximately the percentage of HRmax associated with the intensity of MLSSW. HR was plotted against workload, and a second-degree polynomial regression fit was calculated. The resulting formula was used to determine AT86HRmax. Note that the power values corresponding to AT are only expressed in absolute units for clarity. Coefficients of determination (R2) of the individual second-order [La] vs. workload curves were all >0.85, of the third-order [La] vs. workload curves and of the HR vs. workload curves, they were all >0.97; of the individual [La]/Workload quotient vs. workload, second-order polynomial curves were all >0.71.

2.6. Constant Load Tests for the Determination of MLSSW

Athletes completed five to eight 20-min CLTs at different workloads to determine and duplicate the exercise intensity corresponding to the maximal lactate steady state (MLSSW1; MLSSW2). Blood samples were taken at rest and at the 10th and 20th min of exercise with the same equipment and procedure used in the MMCTs. The workload of the first CLTs corresponded to 73% of the Pmax reached during the second MMCT. The workload of the first CLT of the MLSSW2 corresponded to MLSSW1. If, during this first CLT, a steady state or a decrease in [La] was found, the workload was increased by 20 W, and subsequent CLTs were performed until no steady state of [La] was observed. Conversely, if the first CLT resulted in a clearly identifiable increase in [La], subsequent CLTs were performed at 20 W lower velocities until a steady state [La] was reached. The process of increasing or decreasing workload by 20 W, or later by 10 W, in subsequent tests was further repeated until MLSSW was determined twice to a precision of 10 W. Thus, each participant had to perform at least five CLTs to determine two MLSSW-s. The CLTs were separated by at least 2 days. An increase of ≤0.5 mmol·L−1 in [La] during the final 10 min of exercise (0.05 mmol·L−1·min−1) was defined as the criterion for [La] to be considered at a steady state [6]. The MLSSW was defined as the highest workload meeting this stability criterion. In most studies, MLSSW was determined during a CLT lasting 30 min, and a [La] increase ≤ 1.0 mmol·L−1 (0.05 mmol·L−1·min−1) between the 10th and the 30th min of exercise set as the stability criteria. In the present study, however, because of time limitations, MLSSW was determined by analyzing the change in [La] between the 10th and the 20th min of CLTs, and MLSSW was also defined as an increase ≤ 0.05 mmol·L−1·min−1 in the 10 last minutes of exercise. Using the mentioned lactate stability criteria, CLTs lasting only 20 min can be adequate for MLSSW determination since no difference in the MLSSW was found when 20 min or 30 min CLTs were used [37]. HR was averaged every 30 s of exercise. The average value of HR measured at 10, 15, and 20 min of exercise was considered the mean HR value at MLSSW. The average value of [La] measured at 10 and 20 min of exercise was considered the mean lactate value at MLSSW.

2.7. Statistical Analyses

Standard statistics were used to calculate means and standard deviations (SD). Normal data distribution was analyzed using the Shapiro–Wilk test. The Paired Student’s t-test and the Wilcoxon test were used, respectively, for normally and not normally distributed data (work rate at Dmax0.4) to compare MMCT1 and MMCT2. The magnitudes of the differences were assessed using 90% confidence intervals (CI) and Hedges’ g effect sizes (ES). Repeatability of ATs was analyzed, comparing the consistency between trials (i.e., MMCT1 vs. MMCT2) by calculating the mean of the intra-subject SD (the SDs were log-transformed before calculating the average, and then back-transformed using an exponential function) and the mean of the untransformed intra-subject coefficient of variation (CV), by the standard error of measurement (SEM) calculated from the two way Analysis of Variance [38], by the intraclass correlation coefficient (ICC, two-way mixed effects, absolute agreement and single measurement model) as suggested by Koo et al. [39] and by the 95% limits of agreement method (LoA; mean difference ± 1.96 SD) [40]. Friedman’s test, with pairwise comparison post-hoc tests, was used to compare intra-subject CV and intra-subject SD between ATs. Pearson’s correlation coefficients (r) were used to determine the association between the mean of ATs and their repeatability in terms of intra-subject SD and intra-subject CV. The r values of 0.1–0.3, 0.3–0.5, 0.5–0.7, 0.7–0.9, and ≥0.9 were considered to represent small, moderate, large, very large, and nearly perfect associations, respectively [41]. The MDC was calculated as follows: MDC = SEM × 1.96 × √2 [38].
Agreement with the reference method (MLSSW) was assessed over the mean values by the standard error of the estimate (SEE) and by the Bland–Altman method. When the absolute mean difference, i.e., the absolute mean of the bias, was higher than 6 W, simple regression analyses were applied to produce correction equations. The corresponding AT was used as the independent variable and MLSSW was employed as a dependent variable in the stepwise regression analyses. Pearson’s correlation coefficients were performed to assess associations between MLSSW and workload at AT measured at MMCT. Correlation magnitudes were interpreted as described above. Statistical significance was set at p ≤ 0.05. Statistical analyses were conducted using IBM SPSS Statistics 27.0 (SPSS Inc., Chicago, IL, USA).

3. Results

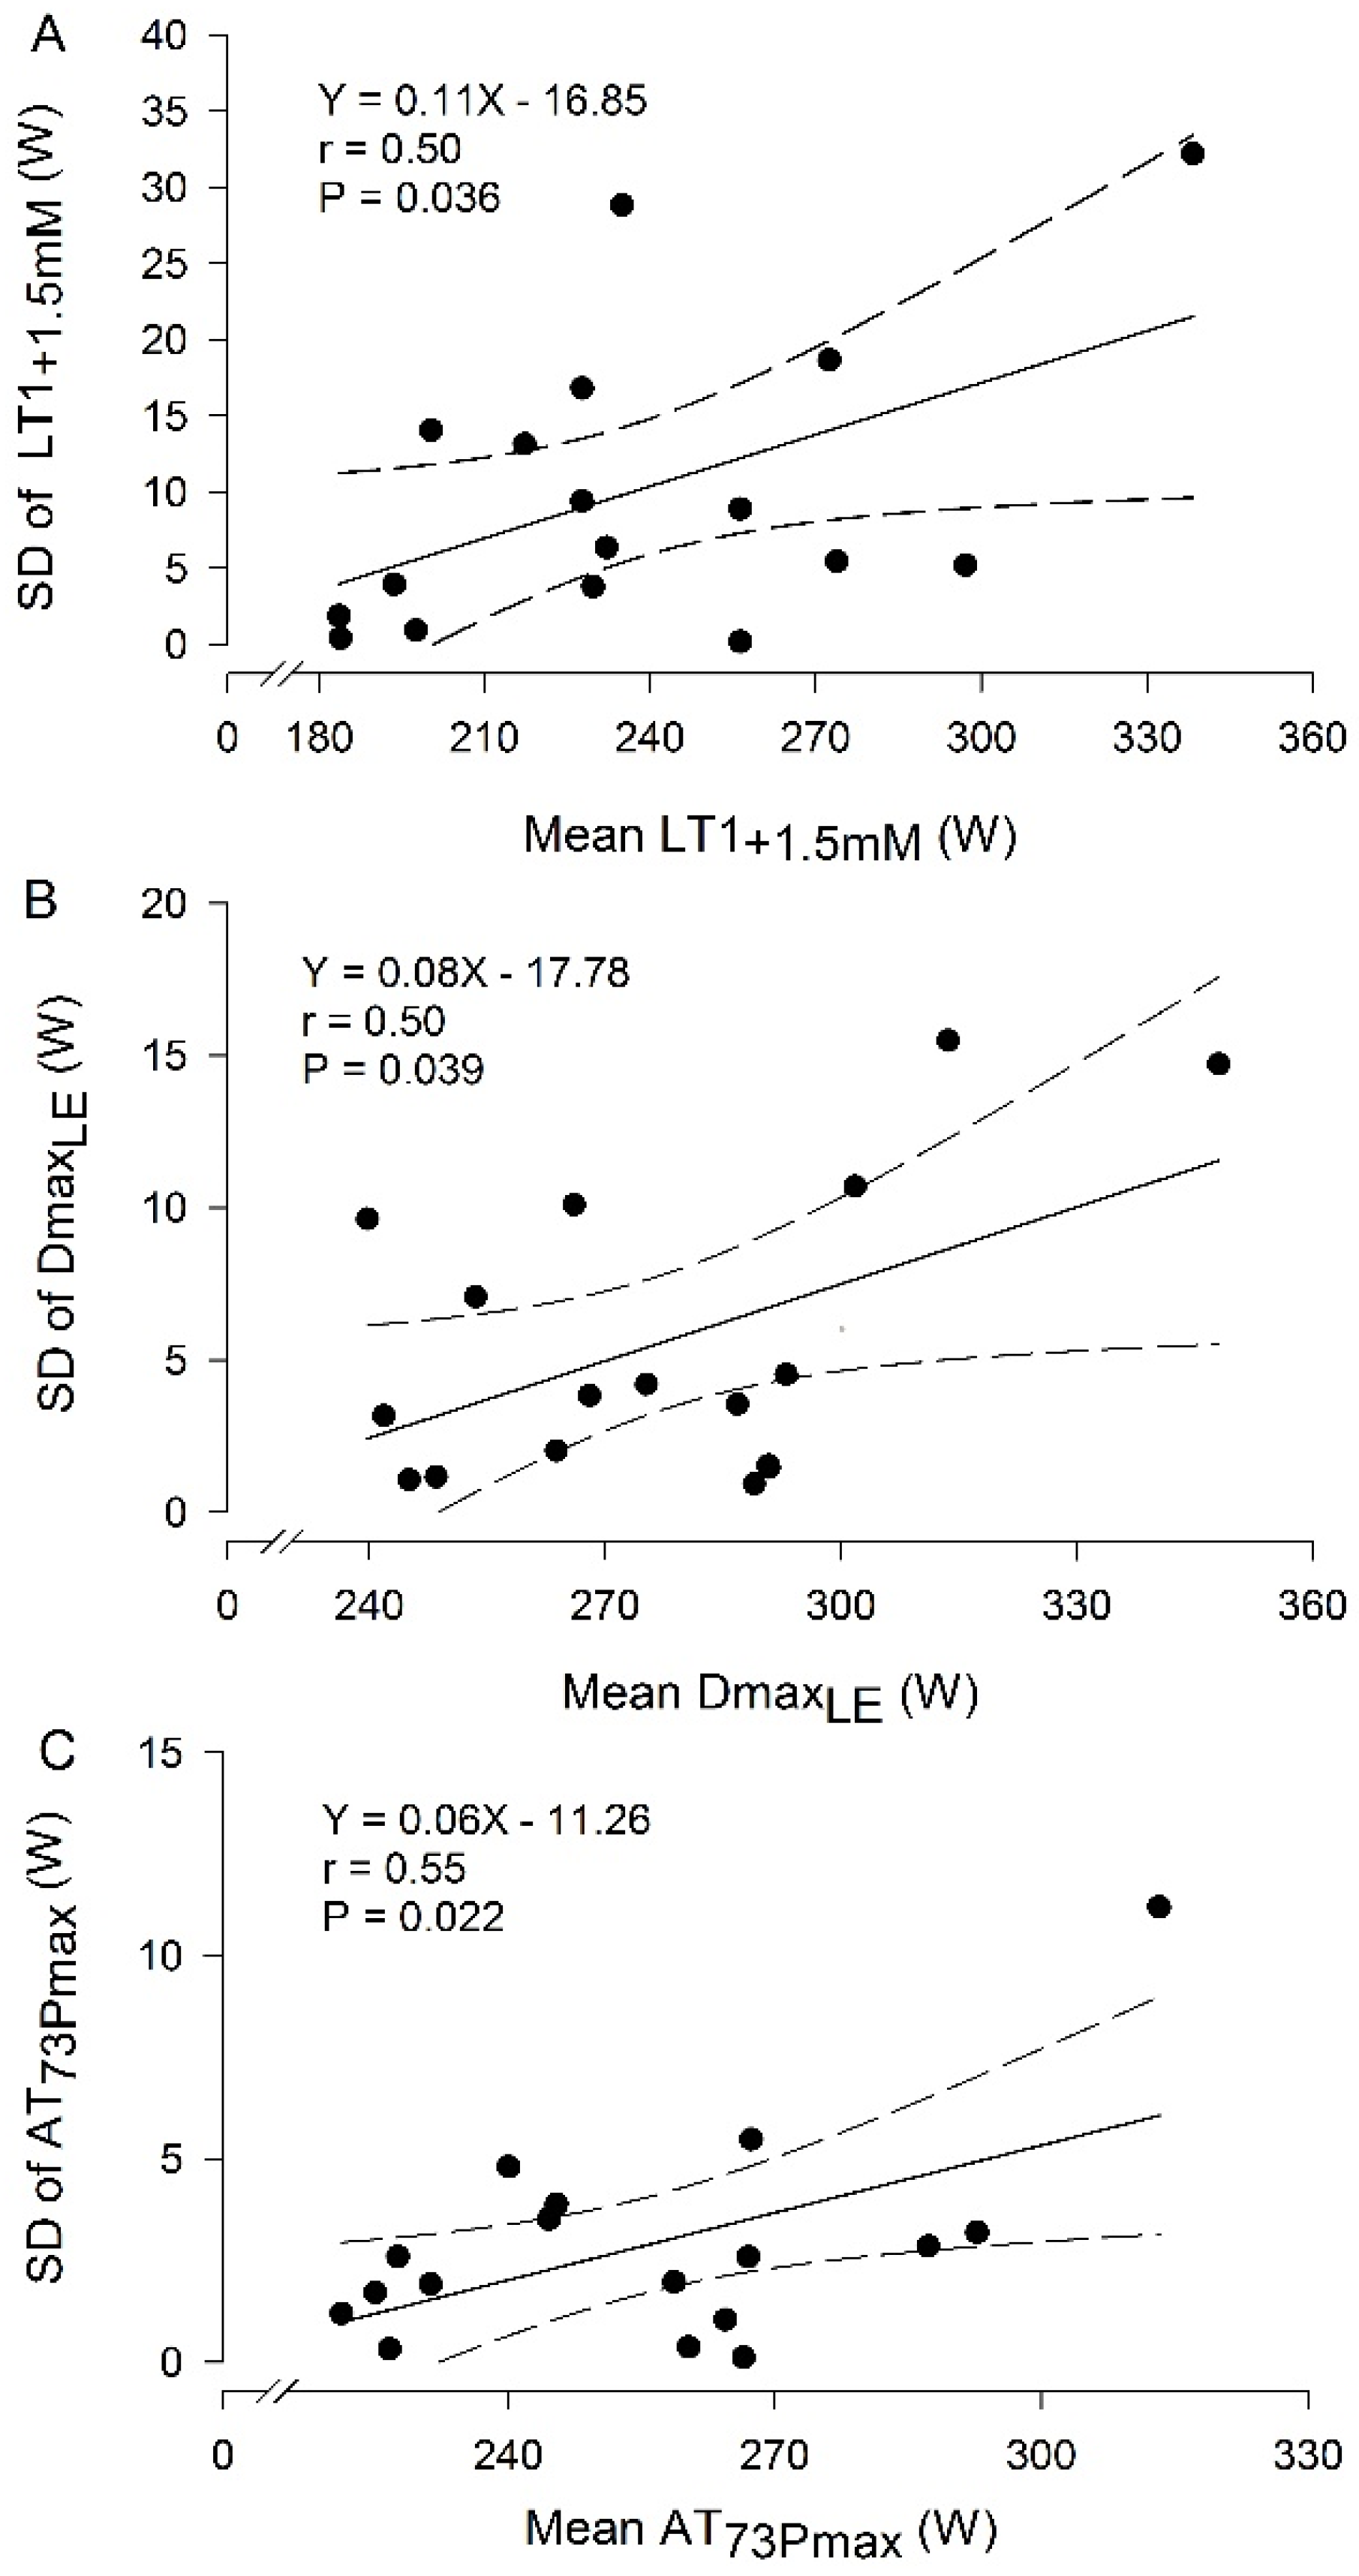
3.1. Repeatability of Anaerobic Thresholds Through MMCTs

All the participants completed both MMCTs, and all ATs could be calculated in all participants. Mean Pmax, HRmax, final [La], and final RPE at MMCT1 (349 ± 34 W, 175 ± 8 beats·min−1, 10.9 ± 3.7 mmol·L−1, 19.3 ± 0.9 UA) were not significantly different from MMCT2 (351 ± 38 W, 176 ± 8 beats·min−1, 10.8 ± 3.3 mmol·L−1, 19.4 ± 0.9 UA). Table 1 shows descriptive characteristics and the repeatability results of ATs at MMCT1 and MMCT2. There were no significant differences in the analyzed variables between MMCTs except for the workload at DmaxLE, which was lower at MMCT1 than at MMCT2. All ATs showed nearly perfect ICC except LT4mM, which showed a very large value. AT73Pmax showed the best repeatability results regarding intra-subject SD, intra-subject CV, Bland–Altman LoA, SEM, and MDC. When ATs were expressed as HR, very large ICC values were found except for AT86HRmax and AT73Pmax, which showed nearly perfect values. Heart rate at AT86HRmax showed the best repeatability values in terms of, intra-subject CV, Bland–Altman LoA, SEM, and MDC.
The association between the mean (MMCT1 and MMCT2) ATs and their repeatability in terms of intra-subject SD and intra-subject CV was analyzed to see if the measurement variation was homogeneous throughout the range of mean AT values. LT1+1.5mM, DmaxLE, and AT73Pmax expressed as workloads and their respective intra-subject SD values were the only variables that showed statistically significant associations (Figure 1A, Figure 1B, and Figure 1C, respectively).

3.2. Constant Load Tests

One participant did not complete any of the CLTs due to an illness; therefore, 16 participants completed all the CLTs required to determine twice the MLSSW. The mean of the individual MLSSW values was 268 ± 27 W (289 ± 25 W in cyclists and 256 ± 21 W in triathletes).

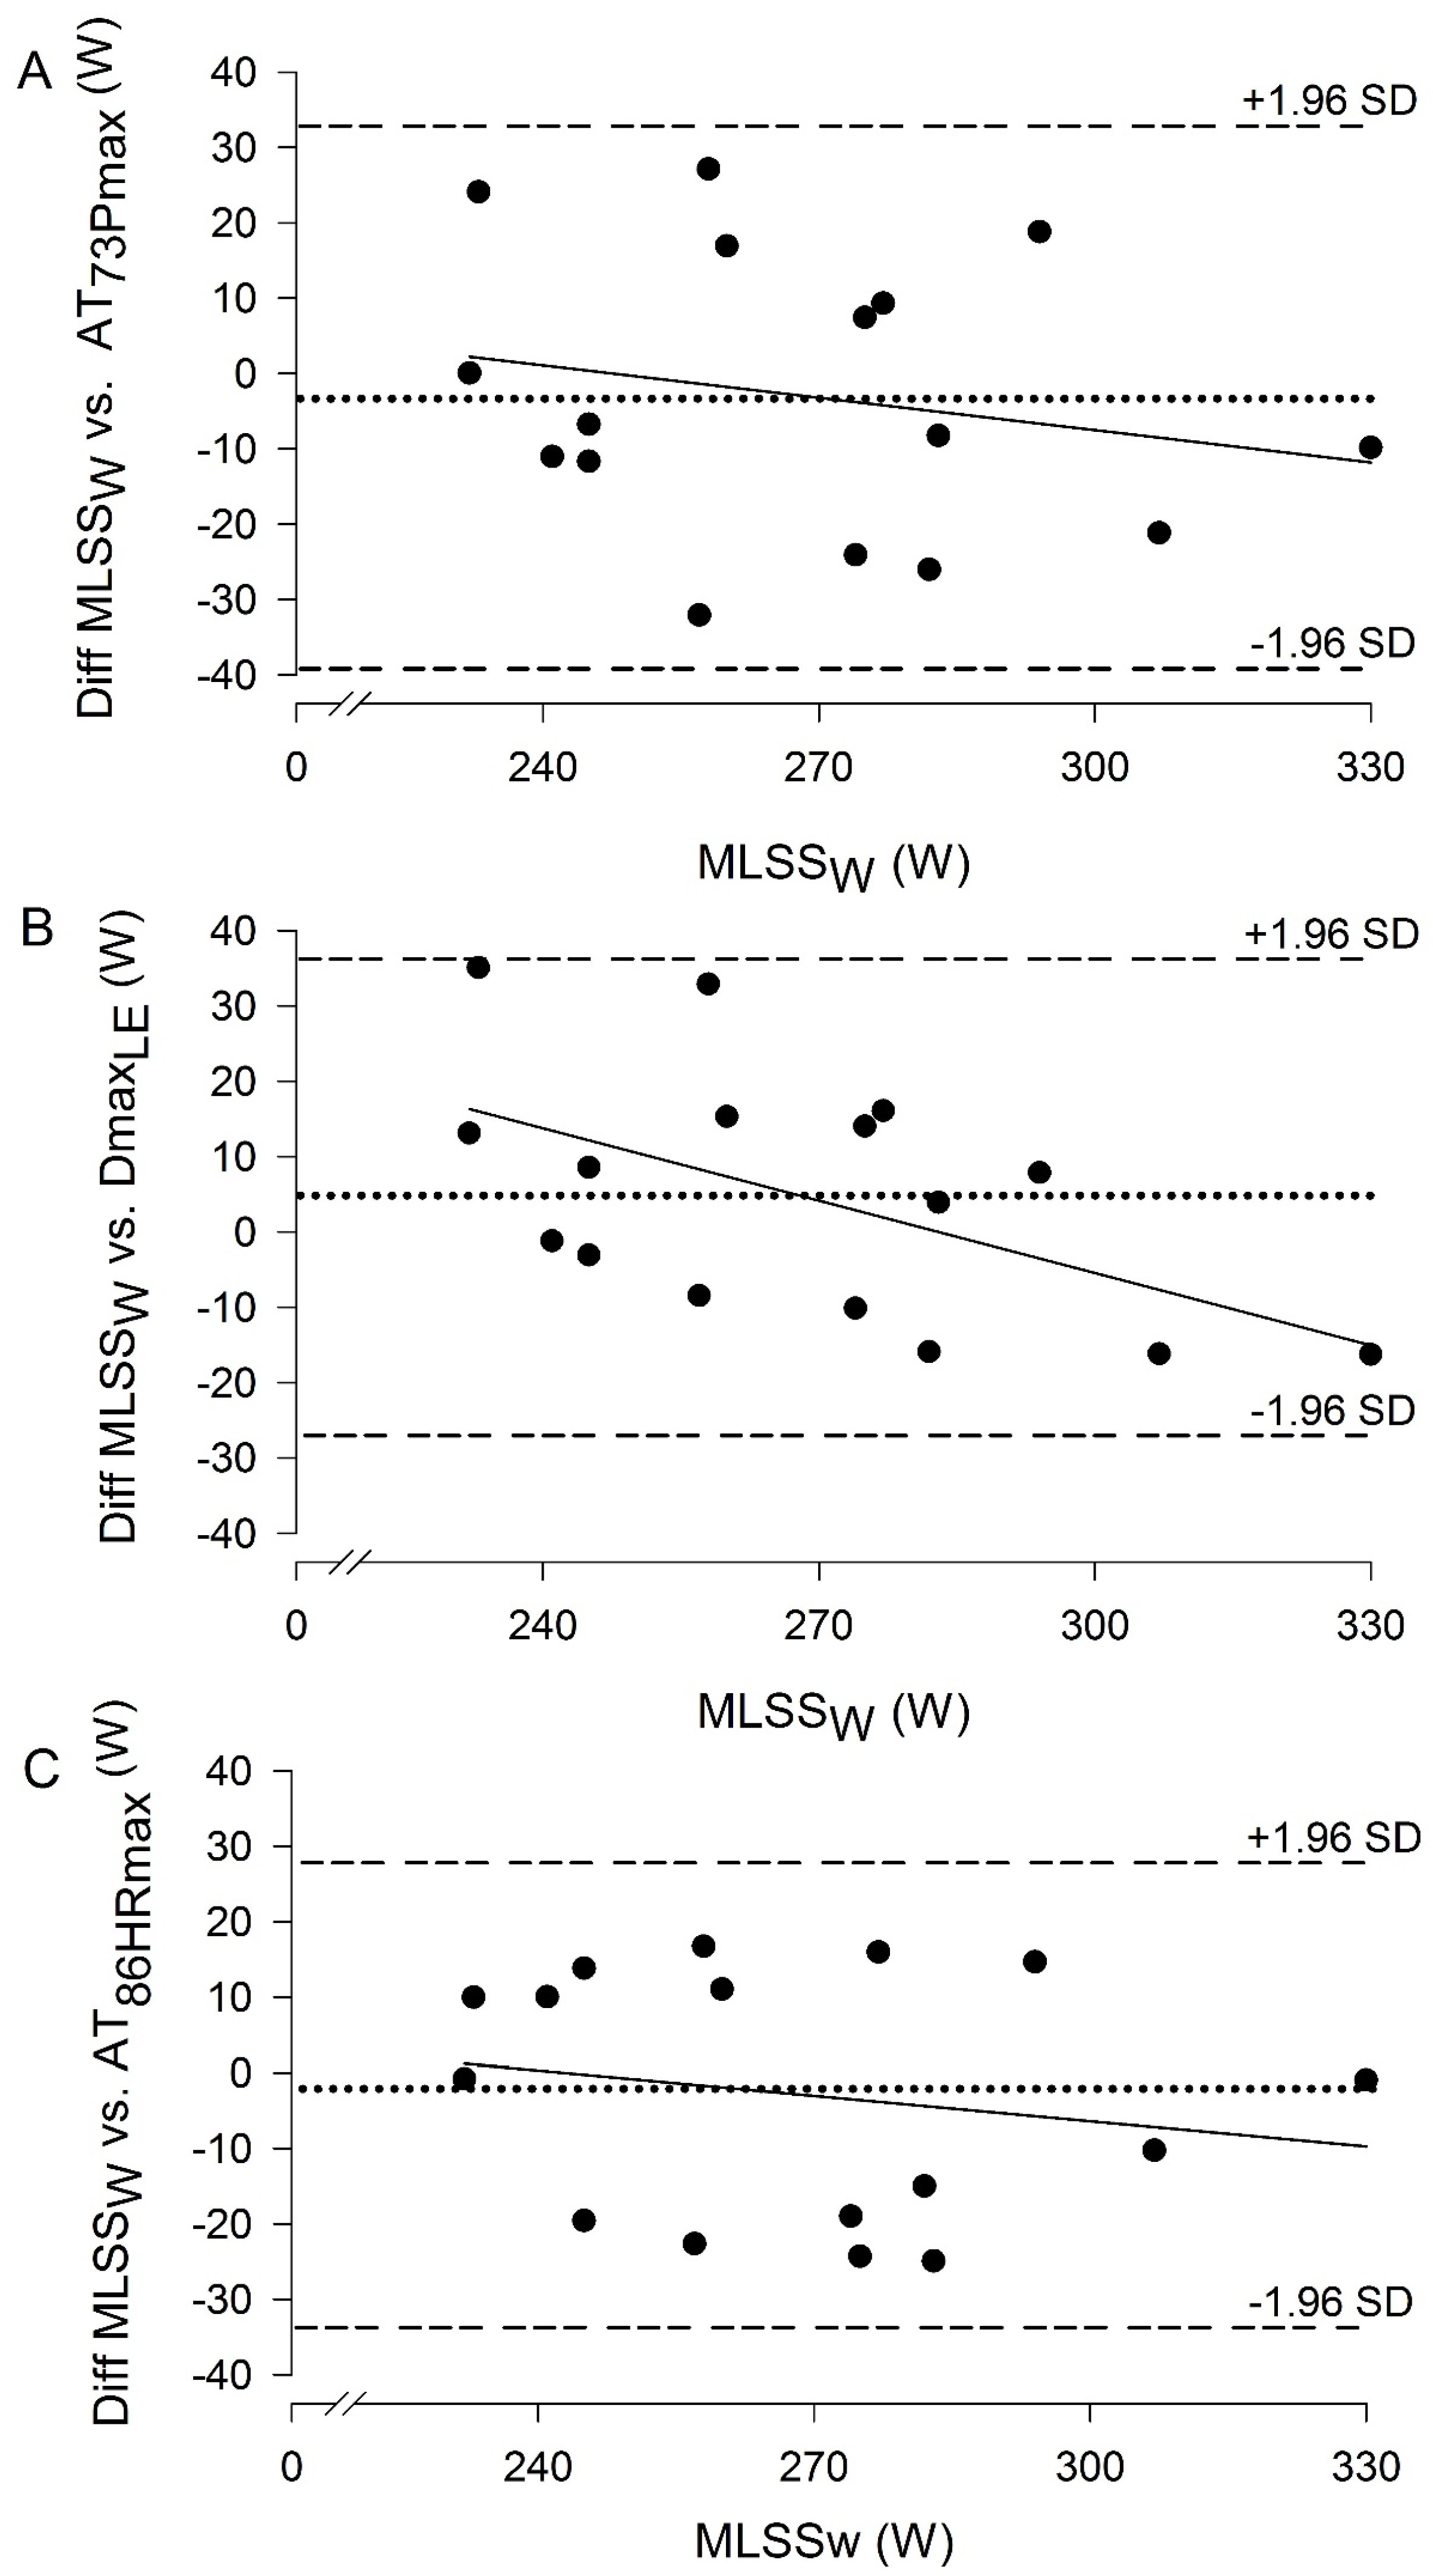
3.3. Validity of Anaerobic Thresholds

The validity analysis was performed by comparing the workloads at ATs against MLSSW (Table 2). The mean workloads corresponding to AT73Pmax, LT2, LE+1.5mM, and LT1+1.5mM were significantly lower than MLSSW. All ATs showed nearly perfect associations with MLSSW except LT1+1.5mM, which showed a very large association (Table 2). DmaxLE, AT73Pmax, and AT86HRmax showed the narrowest LoA. The absolute mean bias for LT1+1.5mM, LE+1.5mM, LT2, LT3.5mM, and AT73Pmax was higher than 6 W; consequently, correction equations were performed for the mentioned ATs (Table 3). The use of correction equations lowered the absolute mean bias to <5 W.
The Bland–Altman plots of Figure 2 show the difference between the workload of corrected AT73Pmax, DmaxLE, and AT86HRmax and the actual MLSSW against the MLSSW. These plots indicate good agreement between the estimated and actual MLSSW based on the low bias and relatively narrow limits of agreement. Unlike for AT73Pmax and AT86HRmax (p = 0.43 and 0.49, respectively), the gradient of the regression line was different from zero for DmaxLE (p = 0.03), which means that DmaxLE tends to slightly overestimate MLSSW for cyclists with low MLSSW and slightly underestimate that for the ones with high MLSSW.

4. Discussion

The objectives of the present research were to compare the repeatability, MDC, and validity (considering the MLSSW as the gold standard) of different methods to determine AT through a maximal multistage test in male cyclists and triathletes. The mean MLSSW in the present study was similar to the values previously reported for trained male cyclists (264 ± 39 W [42]; 255 ± 32 W [43]). Regarding workload, AT73Pmax showed the best repeatability (the highest ICC, lowest intra-subject SD, intra-subject CV, SEM, and MDC, and the narrowest LoA; Table 1). Validity analyses showed that all methods used in the present study to determine AT were strong predictors of MLSSW; however, AT73Pmax, LT2, LE+1.5mM, and LT1+1.5mM significantly underestimated MLSSW. The use of correction equations for these variables lowered their absolute mean bias to <5 W. DmaxLE and AT86HRmax showed the narrowest LoA to estimate MLSSW closely followed by AT73Pmax, Dmax0.4, and LT2. DmaxLE, followed by Dmax0.4, showed the lowest SEE. These results indicate that AT73Pmax, using the correction equation [Corrected AT73Pmax = −69.893 + (1.332 ∗ AT73Pmax)] and DmaxLE, are the best predictors of MLSSW among the variables analyzed in the present study in cyclists or triathletes. In terms of HR, AT86HRmax showed the highest ICC, the lowest SEM and MDC, and the narrowest LoA. Both AT86HRmax and AT73Pmax showed significantly lower intra-subject SD and intra-subject CV compared to the rest of the ATs.
The workload at AT73Pmax was the most repeatable AT, showing an ICC value of 0.99, followed by DmaxLE, LT3.5mM, LE+1.5mM, and LT2 (ICC 0.96–0.97). This result is in line with previous research showing very high repeatability of Pmax obtained during incremental tests in cycling [41,44] and treadmill running [45]. The ICC of AT73Pmax in the present study compares favorably with other ATs determined in male cyclists during incremental maximal exercise tests, such as the second ventilatory threshold (ICC 0.96, [43]; ICC 0.87, [46]), respiratory exchange ratio = 1 (ICC 0.79), workloads at 0.5–3.0 mmol·L−1 above baseline lactate measurements (ICC 0.87–0.89), original Dmax (ICC 0.57) [43], and ATs based on surface electromyography (ICC 0.86–0.87, [47]), and is similar to the values for the workload corresponding to a 20-min time-trial in competitive male cyclists (ICC 0.98) [48]. Differences such as homogeneity and sample size of the participants [39], test protocol characteristics, and repeatability of the instruments/equipment, as well as the exact ICC model chosen for each study, might explain the differences in ICC values between studies [49]. Indeed, research has shown that ICC values were affected by ranges and slopes of the data and differed according to the different models of ICC used [50]. The mean intersubject variability (CV) in the present study was 10.4% for AT73Pmax and 10.5% for DmaxLE. Most of the abovementioned studies had similar or slightly higher intersubject variability (CV 10.6–15.1%), which indicates that the higher ICC values for AT73Pmax and DmaxLE in the present study are not due to differences in the heterogeneity of the sample. The AT73Pmax may be the most reliable measurement because it is a performance-based metric rather than a physiological one, unlike other thresholds or estimators that depend on [La] levels or HR percentages.
The SEMs for workloads at AT73Pmax and DmaxLE in the present study were 3.75 W (1.5% of the mean AT73Pmax) and 6.24 W (2.3% of the mean DmaxLE), respectively. These values compare favorably with ATs based on the second ventilatory threshold determined through a ramp exercise test in cyclists (SEM 16 W) [46]. The variation in SEM values may be due to the analytical approach used [46]. The workload at AT73Pmax in the present study showed significantly better repeatability in terms of intra-subject CV (1.1%) than most of the ATs. Moreover, DmaxLE showed significantly better intra-subject CV (2.0%) compared to LE+1.5mM and LT1+1.5mM. These intra-subject CVs of AT73Pmax and DmaxLE are slightly lower than the value of 2.8% for both LE+1.5mM and LT3.5mM in the study of Hoefelmann et al., determined in male cyclists during a protocol similar to the present study [26], and this value, in turn, is slightly lower than the values for the same variables in the present study (intra-subject CV for LT3.5mM 3.1% and for LE+1.5mM 3.4%). Pallares et al. showed intra-subject CV values of 2.1% for the second ventilatory threshold, 3.0–3.7% for ATs derived from the lactate threshold determined as the highest workload not associated with a rise in [La] above baseline, 3.7% for LT4mM, 6.4% for respiratory exchange ratio = 1, and 10.3% for the original Dmax, determined in male cyclists during ramp protocol tests [43]. The differences in intra-subject CVs between the present study and the one by Pallares et al. could be due to the dissimilarities in the protocols (ramp vs. stage). The present results indicate that the workload at AT73Pmax, followed by DmaxLE, is more repeatable than other ATs.
Considering the MDC of ATs is important when monitoring the progress of athletes because biological variation and measurement error may incorrectly suggest a change that is not real. Since the MDC of AT73Pmax is almost half that of DmaxLE and approximately three times lower than the rest of the ATs, it is suggested that the workload at AT73Pmax is the most sensitive method to distinguish true changes in AT from intertrial variation and measurement error. In the present study, the power output at AT73Pmax and DmaxLE required to detect a change in an individual physiological profile with 95% confidence was relatively low, at 4.1% and 6.2%, respectively. Significant correlations were found in the present study between individual mean LT1+1.5mM, DmaxLE, and AT73Pmax expressed as workloads and their respective intra-subject SD values. Since the MDC is affected by the intra-subject SD [38], MDC may tend to be higher the higher the level of the athlete is and lower the lower the level, for the mentioned Ats. This trend may not be observed when the MDC is expressed as a percentage.
In terms of HR, AT86HRmax was the most repeatable AT in the present study (ICC 0.95; intra-subject CV 0.94%; SEM 1.8 beats·min−1) followed by AT73Pmax (ICC 0.90; intra-subject CV 1.10%; SEM 3.7 beats·min−1) and DmaxLE (ICC 0.85; intra-subject CV 1.7%; SEM 4.6 beats·min−1). The ICC value for HR at AT86HRmax in the present study was similar to the ICC values shown for HR during 20 min time trials in competitive male cyclists (ICC 0.94, [48]) and higher than for the respiratory compensation point determined in cyclists during ramp exercise (ICC 0.92) [46]. Hoefelmann et al. reported a slightly better repeatability for HR at LT3.5mM (ICC 0.82; intra-subject CV 2.5%) compared to the one for the same variable (ICC 0.80; intra-subject CV 3.1%) and lower than the ones for AT86HRmax and AT73Pmax in the present study [26]. Since the MDC of HR at AT86HRmax is lower than half that of HR at AT73Pmax and DmaxLE and approximately three times lower than the rest of the ATs, it is suggested that AT86HRmax is the most sensitive AT in terms of HR to distinguish true individual changes from measurement error and biological variation.
Controversial results have been found in the literature regarding the bias of ATs to estimate MLSSW. The mean workloads at DmaxLE, AT86HRmax, LT3.5mM, LT4mM, and Dmax0.4 were not significantly different from MLSSW in the present study. This is consistent with studies showing that LT3.5mM [25], DmaxLE, and Dmax0.4 were not significantly different from MLSSW [22,51]. In contrast, Hauser et al. showed significantly lower values for LT4mM determined in a similar test protocol to the present study (increments of 40 W every 4 min) than MLSSW in male participants with different endurance levels [52], and Pallares et al. showed that in trained cyclists, the mean LT4mM determined during a maximal ramp test protocol (increments of 25 W·min−1) significantly overestimated MLSSW [43]. Differences in the protocol of the maximal test and the endurance level of the participants could explain the differences between the studies. The absolute mean bias for LT1+1.5mM, LE+1.5mM, LT2, LT3.5mM, and AT73Pmax was higher than 6 W in the present study (mean bias between —9 W and –38 W). Specifically, the uncorrected mean LE+1.5mM was 31 W lower than the mean MLSSW, which is in agreement with the study by Hauser et al. who showed that LE+1.5mM was 37 W lower than MLSSW in males with different endurance levels [52]. The use of correction equations in Table 3 lowered the absolute mean bias to <5 W without harming LoAs, which suggests that when these AT values are determined through a similar test protocol to the present study in trained cyclists or triathletes, correction equations should be used.
The MLSSW corresponded to 76.8% of Pmax in the present study. Previous studies have shown that experienced endurance-trained athletes tend to attain their MLSSW or ventilatory-related thresholds at a higher %Pmax compared to lower-level athletes [7,25,47]. In the present study, the association between MLSSW and MLSSW expressed as a percentage of Pmax almost reached statistical significance (p = 0.052; r = 0.49 yielding the following equation MLSSW in %Pmax = 54.17 + 0.09 ∗ MLSSW). This suggests that an uncorrected AT73Pmax could agree with MLSSW for people with an MLSSW of about 209 W but may tend to overestimate it in people with lower endurance capacity and underestimate it in people with higher endurance levels, as is the case in the present study. This variation should be taken into account for coaches and athletes who prescribe training intensities as percentages of Pmax. The protocol used to measure MLSSW could also influence the percentage of Pmax at which MLSSW is observed. In the present study, we used a CLT of 20 min whereas in most of the studies, a CLT of 30 min has been used. A CLT lasting only 20 min can, however, be adequate for MLSSW determination when 0.05 mmol·L−1·min−1 criteria are used for [La] stability [37]
The lowest LoA values for MLSSW prediction in the present study were when DmaxLE (±32 W or ±11.8%), AT86HRmax (±32 W or ±11.8%), and Dmax0.4 (±33 W or ±12.4%), as well as the corrected and uncorrected AT73Pmax (±36 W or ±13.6% and 33 W or ±12.3%, respectively) and LT2 (±35 W or ±13.2% and ±34 W or ±12.7%, respectively) were used. These LoA are slightly higher than those in the study by Grossl et al. in trained cyclists predicting MLSSW from LT3.5mM (±25 W or ±10.3% of their MLSSW, which was 247 ± 33 W, CV of MLSSW 13.4%) and LE+1.5mM (±23 W or ±9.5% of their MLSSW) through a multistage maximal protocol test with an initial workload of 105 W and 35 W increments every 3 min [53] and lower than those in the study by Pallares et al. predicting MLSSW from second ventilatory threshold (±39 W or ±15.3% of their MLSSW, which was 255 ± 32 W [43]; CV of MLSSW 12.5%), workloads at [La] of 1.5, 2.0, 2.5, and 3 mM·L−1 above baseline measurements (±41–43 W or ±16.1–16.9% of their MLSSW) and LT4mM (±42 W or ±16.6% of their MLSSW) through a maximal ramp exercise test with increments of 25 W·min−1. The workload associated with a respiratory exchange ratio equal to unity, RER = 1 (±89 W or ±34.9% of their MLSSW), and Dmax threshold determined through the two endpoints of the curve (±75 W or ±29.2%) showed substantially higher values of LoA in the study by Pallares et al. [43]. Hauser et al. also showed higher LoAs for LT4mM and LE+1.5mM (±49 W or ±22% of their MLSSW, which was 221 ± 43 W; CV of MLSSW 19.5%) in males with a heterogeneous endurance level [52]. Differences in the heterogeneity of the sample (CV of MLSSW in the present study was 10.1%), in the protocol of the multistage maximal tests, and in the exact method for AT determination could explain the differences in the LoAs. The effects of the multistage protocol test design and the exact methods for AT determination on the validity of MLSSW prediction have been precisely highlighted by Jamnick et al. [42].
The present investigation is limited in some aspects. Many tests were conducted with each participant, with over 100 tests completed across all participants; therefore, the sample size of endurance athletes was low, although similar to previous studies [43,46,48]. The applicability of the results of the present study is limited to trained cyclists or triathletes with MLSSW ranging from 232 to 330 W. Caution should be taken when generalizing these results to other populations, especially to those with significantly different MLSSW values and females, or to other testing procedures and equipment. Moreover, some methods used to determine the boundary discriminating between the heavy and severe exercise intensity, such as the second ventilatory threshold and critical power have not been measured. Therefore, a direct comparison between these methods and those measured in the present study has not been possible. In addition, the participants agreed to maintain their training protocol in terms of volume and intensity and to keep their lifestyles unchanged during the testing period. We assumed they adhered to this. Despite these limitations, the results of the present study provide important and novel information about the estimation of the MLSSW, which is considered one of the reference methods for the assessment of endurance capacity.

5. Conclusions

All methods analyzed in the present study to determine AT from the MMCT showed very large or nearly perfect values of repeatability in terms of ICC. AT73Pmax showed the best repeatability results in terms of intra-subject SD, intra-subject CV, Bland–Altman LoA, SEM, and MDC. When ATs were expressed as HR, AT86HRmax and AT73Pmax showed nearly perfect values. The heart rate at AT86HRmax showed the best repeatability values in terms of intra-subject SD, intra-subject CV, Bland–Altman LoA, SEM, and MDC. All ATs showed nearly perfect associations with MLSSW except LT1+1.5mM, which showed a very large association. The mean bias for LT1+1.5mM, LE+1.5mM, LT2, LT3.5mM, and AT73Pmax were higher than ±6 W; consequently, correction equations were performed for the mentioned ATs to lower mean of the bias to <5 W. These results indicate that AT73Pmax, using the correction equation [Corrected AT73Pmax = −69.893 + (1.332 · AT73Pmax)] and DmaxLE, are the best predictors of MLSSW among the variables analyzed in the present study in cyclists or triathletes. These results are valuable and of interest to sports physiologists, coaches, and athletes to test athletes’ endurance capacity and individualize their training accurately.

Author Contributions

Conceptualization, I.L.; methodology, I.L.; formal analysis, I.L, M.U. and A.L.; writing—original draft preparation, I.L., J.Y., A.I., J.C. and C.G.; writing—review and editing, I.L., M.U., A.L., J.Y., A.I., J.C. and C.G.; visualization, I.L.; supervision, I.L. All authors have read and agreed to the published version of the manuscript.

Funding

This research received no external funding.

Institutional Review Board Statement

The study was conducted in accordance with the Declaration of Helsinki and approved by the Ethics Committee of the University of the Basque Country (protocol code M10_2018_215).

Informed Consent Statement

Informed consent was obtained from all participants involved in the study.

Data Availability Statement

The data generated and analyzed during this study are available from the corresponding author upon reasonable request.

Conflicts of Interest

The authors declare no conflicts of interest.

Abbreviations

ANOVAAnalysis of variance
ATAnaerobic threshold
AT73PmaxThe workload corresponding to 73% of the maximal aerobic workout
AT86HRmaxThe workload associated with the 86% of HRmax
CIConfidence intervals
CLTConstant load tests
CVCoefficient of variation
Dmax0.4The workload at the maximum perpendicular distance from the straight line between the blood lactate concentration associated with the previous stage to the one that the blood lactate concentration increased ≥0.4mmol·L−1 and final blood lactate concentration data point in the third-order polynomial curve describing the blood lactate concentration kinetics during the maximal multistage cycling test
DmaxLEThe workload at the maximum perpendicular distance from the straight line between the blood lactate concentration associated with the minimum lactate equivalent and final blood lactate concentration data point in the third-order polynomial curve describing the blood lactate concentration kinetics during the maximal multistage cycling test
ESEffect size
HRmaxMaximal heart rate
ICCIntraclass correlation coefficient
[La]Blood lactate concentration
LEminMinimum lactate equivalent
LE+1.5mMThe workload corresponding to the minimum lactate equivalent plus 1.5 mmol·L−1
LoALimits of agreement method
LT1+1.5mMThe workload at 1.5 mmol·L−1 above the blood lactate concentration associated with the lowest stage above which blood lactate concentration increased by ≥0.1 mmol·L−1 in the following stage and ≥0.2 mmol·L−1 in the subsequent stage
LT2The workload at 1.5 mmol·L−1 in the individual blood lactate concentration vs. workload second-order polynomial curves above the average of the first four blood lactate concentrations values of exercise
LT3.5mMThe workloads associated with fixed blood lactate concentration of 3.5 mmol·L−1
LT4mMThe workloads associated with fixed blood lactate concentration of 4 mmol·L−1
MDCMinimum detectable change
MLSSWExercise intensity corresponding to the maximal lactate steady state
MMCTMaximal multistage cycling test
PmaxMaximal aerobic workout
RPERating of perceived exertion
SDStandard deviation
SEEStandard error of the estimate
SEMStandard error of measurement

References

  1. Faria, E.W.; Parker, D.L.; Faria, I.E. The Science of Cycling: Factors Affecting Performance—Part 2. Sports Med. 2005, 35, 313–337. [Google Scholar] [CrossRef]
  2. O’Toole, M.L.; Douglas, P.S. Applied Physiology of Triathlon. Sports Med. 1995, 19, 251–267. [Google Scholar] [CrossRef]
  3. Beneke, R.; von Duvillard, S.P. Determination of Maximal Lactate Steady State Response in Selected Sports Events. Med. Sci. Sports Exerc. 1996, 28, 241–246. [Google Scholar] [CrossRef]
  4. Billat, V.L.; Sirvent, P.; Py, G.; Koralsztein, J.P.; Mercier, J. The Concept of Maximal Lactate Steady State: A Bridge between Biochemistry, Physiology and Sport Science. Sports Med. 2003, 33, 407–426. [Google Scholar] [CrossRef] [PubMed]
  5. Kilding, A.E.; Jones, A.M. Validity of a Single-Visit Protocol to Estimate the Maximum Lactate Steady State. Med. Sci. Sports Exerc. 2005, 37, 1734–1740. [Google Scholar] [CrossRef]
  6. Llodio, I.; Garcia-Tabar, I.; Sánchez-Medina, L.; Ibáñez, J.; Gorostiaga, E.M. Estimation of the Maximal Lactate Steady State in Junior Soccer Players. Int. J. Sports Med. 2015, 36, 1142–1148. [Google Scholar] [CrossRef]
  7. Llodio, I.; Gorostiaga, E.M.; Garcia-Tabar, I.; Granados, C.; Sánchez-Medina, L. Estimation of the Maximal Lactate Steady State in Endurance Runners. Int. J. Sports Med. 2016, 37, 539–546. [Google Scholar] [CrossRef]
  8. Messias, L.H.D.; Polisel, E.E.C.; Manchado-Gobatto, F.B. Advances of the Reverse Lactate Threshold Test: Non-Invasive Proposal Based on Heart Rate and Effect of Previous Cycling Experience. PLoS ONE 2018, 13, e0194313. [Google Scholar] [CrossRef]
  9. Sotero, R.C.; Pardono, E.; Campbell, C.S.; Simões, H.G. Indirect Assessment of Lactate Minimum and Maximal Blood Lactate Steady-State Intensity for Physically Active Individuals. J. Strength Cond. Res. 2009, 23, 847–853. [Google Scholar] [CrossRef] [PubMed]
  10. Sotero, R.C.; Pardono, E.; Landwehr, R.; Campbell, C.S.; Simões, H.G. Blood Glucose Minimum Predicts Maximal Lactate Steady State on Running. Int. J. Sports Med. 2009, 30, 643–646. [Google Scholar] [CrossRef]
  11. Van Schuylenbergh, R.; Vanden Eynde, B.; Hespel, P. Correlations between Lactate and Ventilatory Thresholds and the Maximal Lactate Steady State in Elite Cyclists. Int. J. Sports Med. 2004, 25, 403–408. [Google Scholar] [CrossRef] [PubMed]
  12. Harnish, C.R.; Swensen, T.C.; Pate, R.R. Methods for Estimating the Maximal Lactate Steady State in Trained Cyclists. Med. Sci. Sports Exerc. 2001, 33, 1052–1055. [Google Scholar] [CrossRef] [PubMed]
  13. Leti, T.; Mendelson, M.; Laplaud, D.; Flore, P. Prediction of Maximal Lactate Steady State in Runners with an Incremental Test on the Field. J. Sports Sci. 2012, 30, 609–616. [Google Scholar] [CrossRef]
  14. Halson, S.L.; Bridge, M.W.; Meeusen, R.; Busschaert, B.; Gleeson, M.; Jones, D.A.; Jeukendrup, A.E. Time Course of Performance Changes and Fatigue Markers during Intensified Training in Trained Cyclists. J. Appl. Physiol. 2002, 93, 947–956. [Google Scholar] [CrossRef] [PubMed]
  15. Iannetta, D.; Ingram, C.P.; Keir, D.A.; Murias, J.M. Methodological Reconciliation of CP and MLSS and Their Agreement with the Maximal Metabolic Steady State. Med. Sci. Sports Exerc. 2022, 54, 622–632. [Google Scholar] [CrossRef]
  16. Gorostiaga, E.M.; Garcia-Tabar, I.; Sánchez-Medina, L. Critical power: Over 95 years of “evidence” and “evolution”. Scand. J. Med. Sci. Sports 2022, 32, 1069–1071. [Google Scholar] [CrossRef] [PubMed]
  17. Iannetta, D.; Inglis, E.C.; Fullerton, C.; Passfield, L.; Murias, J.M. Metabolic and performance-related consequences of exercising at and slightly above MLSS. Scand. J. Med. Sci. Sports 2018, 28, 2481–2493. [Google Scholar] [CrossRef] [PubMed]
  18. Garcia-Tabar, I.; Gorostiaga, E.M. A “Blood Relationship” Between the Overlooked Minimum Lactate Equivalent and Maximal Lactate Steady State in Trained Runners: Back to the Old Days? Front. Physiol. 2018, 9, 1034. [Google Scholar] [CrossRef]
  19. Garcia-Tabar, I.; Rampinini, E.; Gorostiaga, E.M. Lactate Equivalent for Maximal Lactate Steady State Determination in Soccer. Res. Q. Exerc. Sport 2019, 90, 678–689. [Google Scholar] [CrossRef] [PubMed]
  20. Heck, H.; Mader, A.; Hess, G.; Mücke, S.; Müller, R.; Hollmann, W. Justification of the 4-Mmol/l Lactate Threshold. Int. J. Sports Med. 1985, 6, 117–130. [Google Scholar] [CrossRef] [PubMed]
  21. Bourdon, P. Blood Lactate Transition Thresholds: Concepts and Controversies. In Physiological Tests for Elite Athletes; Gore, C., Ed.; Human Kinetics: Champaign, IL, USA, 2000; pp. 55–65. [Google Scholar]
  22. Zwingmann, L.; Strütt, S.; Martin, A.; Volmary, P.; Bloch, W.; Wahl, P. Modifications of the Dmax Method in Comparison to the Maximal Lactate Steady State in Young Male Athletes. Physician Sports Med. 2019, 47, 174–181. [Google Scholar] [CrossRef] [PubMed]
  23. McKay, A.K.A.; Stellingwerff, T.; Smith, E.S.; Martin, D.T.; Mujika, I.; Goosey-Tolfrey, V.L.; Sheppard, J.; Burke, L.M. Defining Training and Performance Caliber: A Participant Classification Framework. Int. J. Sports Physiol. Perform. 2022, 17, 317–331. [Google Scholar] [CrossRef]
  24. World Medical Association. World Medical Association Declaration of Helsinki: Ethical Principles for Medical Research Involving Human Subjects. JAMA 2013, 310, 2191–2194. [Google Scholar] [CrossRef] [PubMed]
  25. Denadai, B.S.; Figueira, T.R.; Favaro, O.R.; Gonçalves, M. Effect of the Aerobic Capacity on the Validity of the Anaerobic Threshold for Determination of the Maximal Lactate Steady State in Cycling. Braz. J. Med. Biol. Res. 2004, 37, 1551–1556. [Google Scholar] [CrossRef]
  26. Hoefelmann, C.P.; Diefenthaeler, F.; Costa, V.P.; de Lucas, R.D.; Shambrook, P.; Guglielmo, L.G. Test-Retest Reliability of Second Lactate Turnpoint Using Two Different Criteria in Competitive Cyclists. Eur. J. Sport Sci. 2015, 15, 265–270. [Google Scholar] [CrossRef]
  27. Nikooie, R. Determination of Anaerobic Threshold by Monitoring the O2 Pulse Changes in Endurance Cyclists. J. Strength Cond. Res. 2016, 30, 1700–1707. [Google Scholar] [CrossRef] [PubMed]
  28. Płoszczyca, K.; Jazic, D.; Piotrowicz, Z.; Chalimoniuk, M.; Langfort, J.; Czuba, M. Comparison of Maximal Lactate Steady State with Anaerobic Threshold Determined by Various Methods Based on Graded Exercise Test with 3-Minute Stages in Elite Cyclists. BMC Sports Sci. Med. Rehabil. 2020, 12, 70. [Google Scholar] [CrossRef]
  29. Roseguini, B.T.; Narro, F.; Oliveira, A.R.; Ribeiro, J.P. Estimation of the Lactate Threshold from Heart Rate Response to Sub-Maximal Exercise: The Pulse Deficit. Int. J. Sports Med. 2007, 28, 463–469. [Google Scholar] [CrossRef]
  30. Borg, G. Perceived Exertion as an Indicator of Somatic Stress. Scand. J. Rehabil. Med. 1970, 2, 92–98. [Google Scholar] [CrossRef] [PubMed]
  31. Berg, A.; Jakob, E.; Lehmann, M.; Dickhuth, H.H.; Huber, G.; Keul, J. Aktuelle Aspekte der modernen Ergometrie. Pneumologie 1990, 44, 2–13. [Google Scholar] [PubMed]
  32. Keul, J.; Berg, A. Energiestoffwechsel und körperliche Leistung. In Zentrale Themen der Sportmedizin, 3rd ed.; Hollmann, W., Ed.; Springer: Berlin/Heidelberg, Germany; New York, NY, USA; Tokyo, Japan, 1985; pp. 196–244. [Google Scholar]
  33. Beneke, R.; Hütler, M.; Leithäuser, R.M. Maximal Lactate-Steady-State Independent of Performance. Med. Sci. Sports Exerc. 2000, 32, 1135–1139. [Google Scholar] [CrossRef]
  34. Beneke, R.; Leithäuser, R.M.; Hütler, M. Dependence of the Maximal Lactate Steady State on the Motor Pattern of Exercise. Br. J. Sports Med. 2001, 35, 192–196. [Google Scholar] [CrossRef] [PubMed]
  35. Dekerle, J.; Baron, B.; Dupont, L.; Vanvelcenaher, J.; Pelayo, P. Maximal Lactate Steady State, Respiratory Compensation Threshold and Critical Power. Eur. J. Appl. Physiol. 2003, 89, 281–288. [Google Scholar] [CrossRef]
  36. Snyder, A.C.; Woulfe, T.; Welsh, R.; Foster, C. A Simplified Approach to Estimating the Maximal Lactate Steady State. Int. J. Sports Med. 1994, 15, 27–31. [Google Scholar] [CrossRef] [PubMed]
  37. Beneke, R. Methodological aspects of maximal lactate steady state implications for performance testing. Eur. J. Appl. Physiol. 2003, 89, 95–99. [Google Scholar] [CrossRef] [PubMed]
  38. Weir, J.P. Quantifying Test-Retest Reliability Using the Intraclass Correlation Coefficient and the SEM. J. Strength Cond. Res. 2005, 19, 231–240. [Google Scholar] [CrossRef]
  39. Koo, T.K.; Li, M.Y. A Guideline of Selecting and Reporting Intraclass Correlation Coefficients for Reliability Research. J. Chiropr. Med. 2016, 15, 155–163, Correction in J. Chiropr. Med. 2017, 16, 346. [Google Scholar] [CrossRef] [PubMed]
  40. Bland, J.M.; Altman, D.G. Statistical Methods for Assessing Agreement Between Two Methods of Clinical Measurement. Lancet 1986, 1, 307–310. [Google Scholar] [CrossRef]
  41. Hopkins, W.G.; Schabort, E.J.; Hawley, J.A. Reliability of Power in Physical Performance Tests. Sports Med. 2001, 31, 211–234. [Google Scholar] [CrossRef]
  42. Jamnick, N.A.; Botella, J.; Pyne, D.B.; Bishop, D.J. Manipulating Graded Exercise Test Variables Affects the Validity of the Lactate Threshold and VO2peak. PLoS ONE 2018, 13, e0199794. [Google Scholar] [CrossRef]
  43. Pallarés, J.G.; Morán-Navarro, R.; Ortega, J.F.; Fernández-Elías, V.E.; Mora-Rodriguez, R. Validity and Reliability of Ventilatory and Blood Lactate Thresholds in Well-Trained Cyclists. PLoS ONE 2016, 11, e0163389. [Google Scholar] [CrossRef] [PubMed]
  44. Murgatroyd, S.R.; Wylde, L.A.; Cannon, D.T.; Ward, S.A.; Rossiter, H.B. A ‘Ramp-Sprint’ Protocol to Characterise Indices of Aerobic Function and Exercise Intensity Domains in a Single Laboratory Test. Eur. J. Appl. Physiol. 2014, 114, 1863–1874. [Google Scholar] [CrossRef]
  45. Stratton, E.; O’Brien, B.J.; Harvey, J.; Blitvich, J.; McNicol, A.J.; Janissen, D.; Paton, C.; Knez, W. Treadmill Velocity Best Predicts 5000-m Run Performance. Int. J. Sports Med. 2009, 30, 40–45. [Google Scholar] [CrossRef] [PubMed]
  46. Weston, S.B.; Gabbett, T.J. Reproducibility of Ventilation of Thresholds in Trained Cyclists during Ramp Cycle Exercise. J. Sci. Med. Sport 2001, 4, 357–366. [Google Scholar] [CrossRef] [PubMed]
  47. Lucía, A.; Pardo, J.; Durántez, A.; Hoyos, J.; Chicharro, J.L. Physiological Differences Between Professional and Elite Road Cyclists. Int. J. Sports Med. 1998, 19, 342–348. [Google Scholar] [CrossRef] [PubMed]
  48. Nimmerichter, A.; Williams, C.; Bachl, N.; Eston, R. Evaluation of a Field Test to Assess Performance in Elite Cyclists. Int. J. Sports Med. 2010, 31, 160–166. [Google Scholar] [CrossRef]
  49. Shrout, P.E.; Fleiss, J.L. Intraclass Correlations: Uses in Assessing Rater Reliability. Psychol. Bull. 1979, 86, 420–428. [Google Scholar] [CrossRef] [PubMed]
  50. Lee, K.M.; Lee, J.; Chung, C.Y.; Ahn, S.; Sung, K.H.; Kim, T.W.; Lee, H.J.; Park, M.S. Pitfalls and important issues in testing reliability using intraclass correlation coefficients in orthopaedic research. Clin. Orthop. Surg. 2012, 4, 149–155. [Google Scholar] [CrossRef]
  51. Czuba, M.; Zając, A.; Cholewa, J.; Poprzęcki, S.; Waśkiewicz, Z.; Mikołajec, K. Lactate threshold (D-max method) and maximal lactate steady state in cyclists. J. Hum. Kinet. 2009, 21, 49–56. [Google Scholar] [CrossRef]
  52. Hauser, T.; Adam, J.; Schulz, H. Comparison of Selected Lactate Threshold Parameters with Maximal Lactate Steady State in Cycling. Int. J. Sports Med. 2014, 35, 517–521. [Google Scholar] [CrossRef] [PubMed]
  53. Grossl, T.; De Lucas, R.D.; De Souza, K.M.; Guglielmo, L.G.A. Maximal Lactate Steady-State and Anaerobic Thresholds from Different Methods in Cyclists. Eur. J. Sport Sci. 2012, 12, 161–167. [Google Scholar] [CrossRef]
Figure 1. Linear relationship between the workload at (A) LT1+1.5mM, the workload at 1.5 mmol·L−1 above the [La] associated with the lowest stage above, which [La] increased by ≥0.1 mmol·L−1 in the following stage and ≥0.2 mmol·L−1 in the subsequent stage, (B) DmaxLE, workload at the maximum perpendicular distance from the straight line between the [La] associated with the Minimum Lactate Equivalent and final [La], and (C) AT73Pmax, workload at 73% of Pmax, and their respective intra-subject SD. Solid lines represent linear regression and dashed lines represent 95% confidence intervals.
Jfmk 10 00009 g001
Figure 2. Bland–Altman plots show the difference between the workloads at anaerobic thresholds over the MLSSW. Anaerobic thresholds correspond to the following. (A) Corrected AT73Pmax, workload at 73% of Pmax, (B) DmaxLE, workload at the maximum perpendicular distance from the straight line between the [La] associated with the Minimum Lactate Equivalent and final [La], and (C) AT86HRmax, workload at 86% of maximal heart rate. The dotted horizontal lines represent the bias between the 2 measurements. The dashed horizontal lines represent the 95% limits of agreement between the 2 variables and the solid lines correspond to the regression lines.
Jfmk 10 00009 g002
Table 1. Repeatability of anaerobic thresholds measured through MMCT expressed in terms of workload and HR (n = 17).
Mean ± SDDifference ICCBland AltmanIntra-Subject SD Intra-Subject CV (%)SEMMDC
MMCT1MMCT2p90% CIESprBiasLoA
AT73PmaxWorkload (W)254 ± 25256 ± 280.20−3.97; 0.520.310<0.0010.9861.72−8.67; 12.111.971.083.7510.39
HR (beats·min−1)146 ± 10145 ± 80.66−1.66; 2.790.102<0.0010.902−0.56−10.86; 9.731.101.103.7210.30
DmaxLEWorkload (W)275 ± 27280 ± 310.02 §−9.46; −1.990.618<0.0010.9725.73−11.56; 23.014.111.966.2417.29
HR (beats·min−1)153 ± 10154 ± 80.52−3.79; 1.710.153<0.0010.8491.04−11.68; 13.761.851.664.5912.72
AT86HRmaxWorkload (W)267 ± 32273 ± 360.13−13.20; 0.660.365<0.0010.9546.27−25.78; 38.315.20 *2.94 *11.5632.05
HR (beats·min−1)151 ± 7152 ± 70.09−2.18; −0.450.420<0.0010.9491.11−3.83; 6.051.450.941.784.94
LT3.5mMWorkload (W)261 ± 36265 ± 340.29−10.01; 2.300.253<0.0010.9653.86−24.65; 32.364.68 *3.08 *10.2828.50
HR (beats·min−1)148 ± 14148 ± 90.99−3.62; 3.690.004<0.0010.798−0.04−16.95; 16.873.44 *$3.14 $*6.1016.91
LT2Workload (W)240 ± 30242 ± 320.57−9.01; 4.550.132<0.0010.9582.23−29.17; 33.623.423.14 *11.3231.39
HR (beats·min−1)141 ± 12141 ± 90.65−2.25; 3.900.108<0.0010.812−0.82−15.03; 13.382.80 *2.41 $*5.1314.21
LT4mMWorkload (W)271 ± 39276 ± 360.29−10.80; 2.420.256<0.0010.8324.19−26.39; 34.775.44 *3.19 *11.0330.58
HR (beats·min−1)152 ± 14152 ± 90.95−4.02; 3.750.014<0.0010.7930.13−17.87; 18.143.61 *$3.24 $*6.4918.00
LE+1.5mMWorkload (W)240 ± 32242 ± 320.46−8.97; 3.520.176<0.0010.9622.72−26.19; 31.635.11 *3.44 *10.4228.91
HR (beats·min−1)141 ± 12141 ± 100.69−2.36; 3.810.094<0.0010.833−0.72−15.01; 13.572.60 *2.22 $*5.1514.29
Dmax0.4Workload (W)277 ± 35279 ± 340.62−10.17; 5.590.117<0.0010.9542.29−34.18; 38.767.28 *3.70 *13.1636.47
HR (beats·min−1)153 ± 13154 ± 90.87−4.06; 3.370.037<0.0010.7860.34−16.86; 17.553.39 *$2.80 $*6.2117.20
LT1+1.5mMWorkload (W)235 ± 37238 ± 480.47−11.76; 4.800.169<0.0010.9453.48−34.86; 41.824.95 *4.03 *13.8338.34
HR (beats·min−1)140 ± 12140 ± 100.84−2.59; 3.300.049<0.0010.810−0.36−14.00; 13.292.56 *$2.70 $*4.9213.65
SD, standard deviation; ICC, intraclass correlation coefficient; CV, coefficient of variation; SEM, standard error of measurement; MDC, minimum detectable change; MMCT, maximal multistage cycling test; [La], blood lactate concentration; CI, confidence intervals; ES, effect size; LoA, limits of agreement; AT73Pmax, workload at 73% of Pmax; DmaxLE, workload at the maximum perpendicular distance from the straight line between the [La] associated with the Minimum Lactate Equivalent and final [La]; AT86HRmax, workload at 86% of maximal heart rate; LT3.5mM and LT4mM, workloads associated with [La] of 3.5 mmol·L−1 and 4 mmol·L−1, respectively; LT2, workload at 1.5 mmol·L−1 above the average of the first four [La] values of exercise; LE+1.5mM, workload at Minimum Lactate Equivalent plus 1.5 mmol·L−1. Dmax0.4, workload at the maximum perpendicular distance from the straight line between the [La] associated with the previous stage to the one that the [La] increased ≥0.4 mmol·L−1 and final [La]. LT1+1.5mM, the workload at 1.5 mmol·L−1 above the [La] associated with the lowest stage above, which [La] increased by ≥0.1 mmol·L−1 in the following stage and ≥0.2 mmol·L−1 in the subsequent stage. § Significant difference between the two MMCT; * Significantly different from AT73Pmax; Significantly different from DmaxLE; $ Significantly different from AT86HRmax (p ≤ 0.05). The symbols show differences with respect to the way the anaerobic threshold is specifically expressed, HR or Workload.
Table 2. Validity of workloads at anaerobic thresholds measured through MMCT for MLSSW estimation (n = 16).
Mean DifferencesPearsonBland Altman (W)SEE (W)
prBias (Mean ± SD)LoA
AT73Pmax0.0010.94−16.6 ± 16.8−49.5; 16.216.8
DmaxLE0.2950.954.7 ± 16.2−27.1; 36.415.7
AT86HRmax0.4910.93−2.9 ± 16.2−34.6; 28.918.3
LT3.5mM0.1170.93−9.2 ± 22.1−52.4; 34.018.0
LT2<0.0010.94−31.4 ± 17.3−65.3; 2.416.4
LT4mM0.8350.931.3 ± 24−46.0; 48.618.7
LE+1.5mM<0.0010.91−31.0 ± 23−76.1; 14.120.7
Dmax0.40.2220.955.4 ± 17.0−28.0; 38.815.9
LT1+1.5mM<0.0010.88−38.0 ± 25.6−88.2; 12.323.2
Table 3. Correction equations for LT1+1.5mM, LE+1.5mM, LT2, LT3.5mM, and AT73Pmax.
Correction EquationBland Altman (W)
Bias (Mean ± SD)LoA
LT1+1.5mMCorrected LT1+1.5mM = 33.76 + (0.999 ∗ LT1+1.5mM) −4.4 ± 25.60−54.61; 45.74
LE+1.5mMCorrected LE+1.5mM = 6.643+(1.089 ∗ LE+1.5mM)−3.22 ± 24.23−50.71; 44.28
LT2Corrected LT2 = 4.794+ (1.110 ∗ LT2)−0.56 ± 18.11−36.06; 34.95
LT3.5mMCorrected LT3.5mM = 34.088+ (0.894 ∗ LT3.5mM)−2.56 ± 20.49−42.71; 37.60
AT73PmaxCorrected AT73Pmax = −69.893 + (1.332 ∗ AT73Pmax)−2.98 ± 18.56−39.36; 33.39
SD, standard deviation; LoA, limits of agreement; AT73Pmax, workload at 73% of Pmax; LT3.5mM, workload associated with [La] of 3.5 mmol·L−1; LT2, workload at 1.5 mmol·L−1 above the average of the first four [La] values of exercise; LE+1.5mM, workload at Minimum Lactate Equivalent plus 1.5 mmol·L−1. LT1+1.5mM, the workload at 1.5 mmol·L−1 above the [La] associated with the lowest stage above, which [La] increased by ≥0.1 mmol·L−1 in the following stage and ≥0.2 mmol·L−1 in the subsequent stage.
Disclaimer/Publisher’s Note: The statements, opinions and data contained in all publications are solely those of the individual author(s) and contributor(s) and not of MDPI and/or the editor(s). MDPI and/or the editor(s) disclaim responsibility for any injury to people or property resulting from any ideas, methods, instructions or products referred to in the content.

