
Reliability and Accuracy of Linear Position Transducers During the Bench Press and Back Squat: Implications for Velocity-Based Training

 , ,
, ,  , ,
, ,
Abstract
1. Introduction
2. Materials and Methods
2.1. The Experimental Approach to the Problem
2.2. Subjects
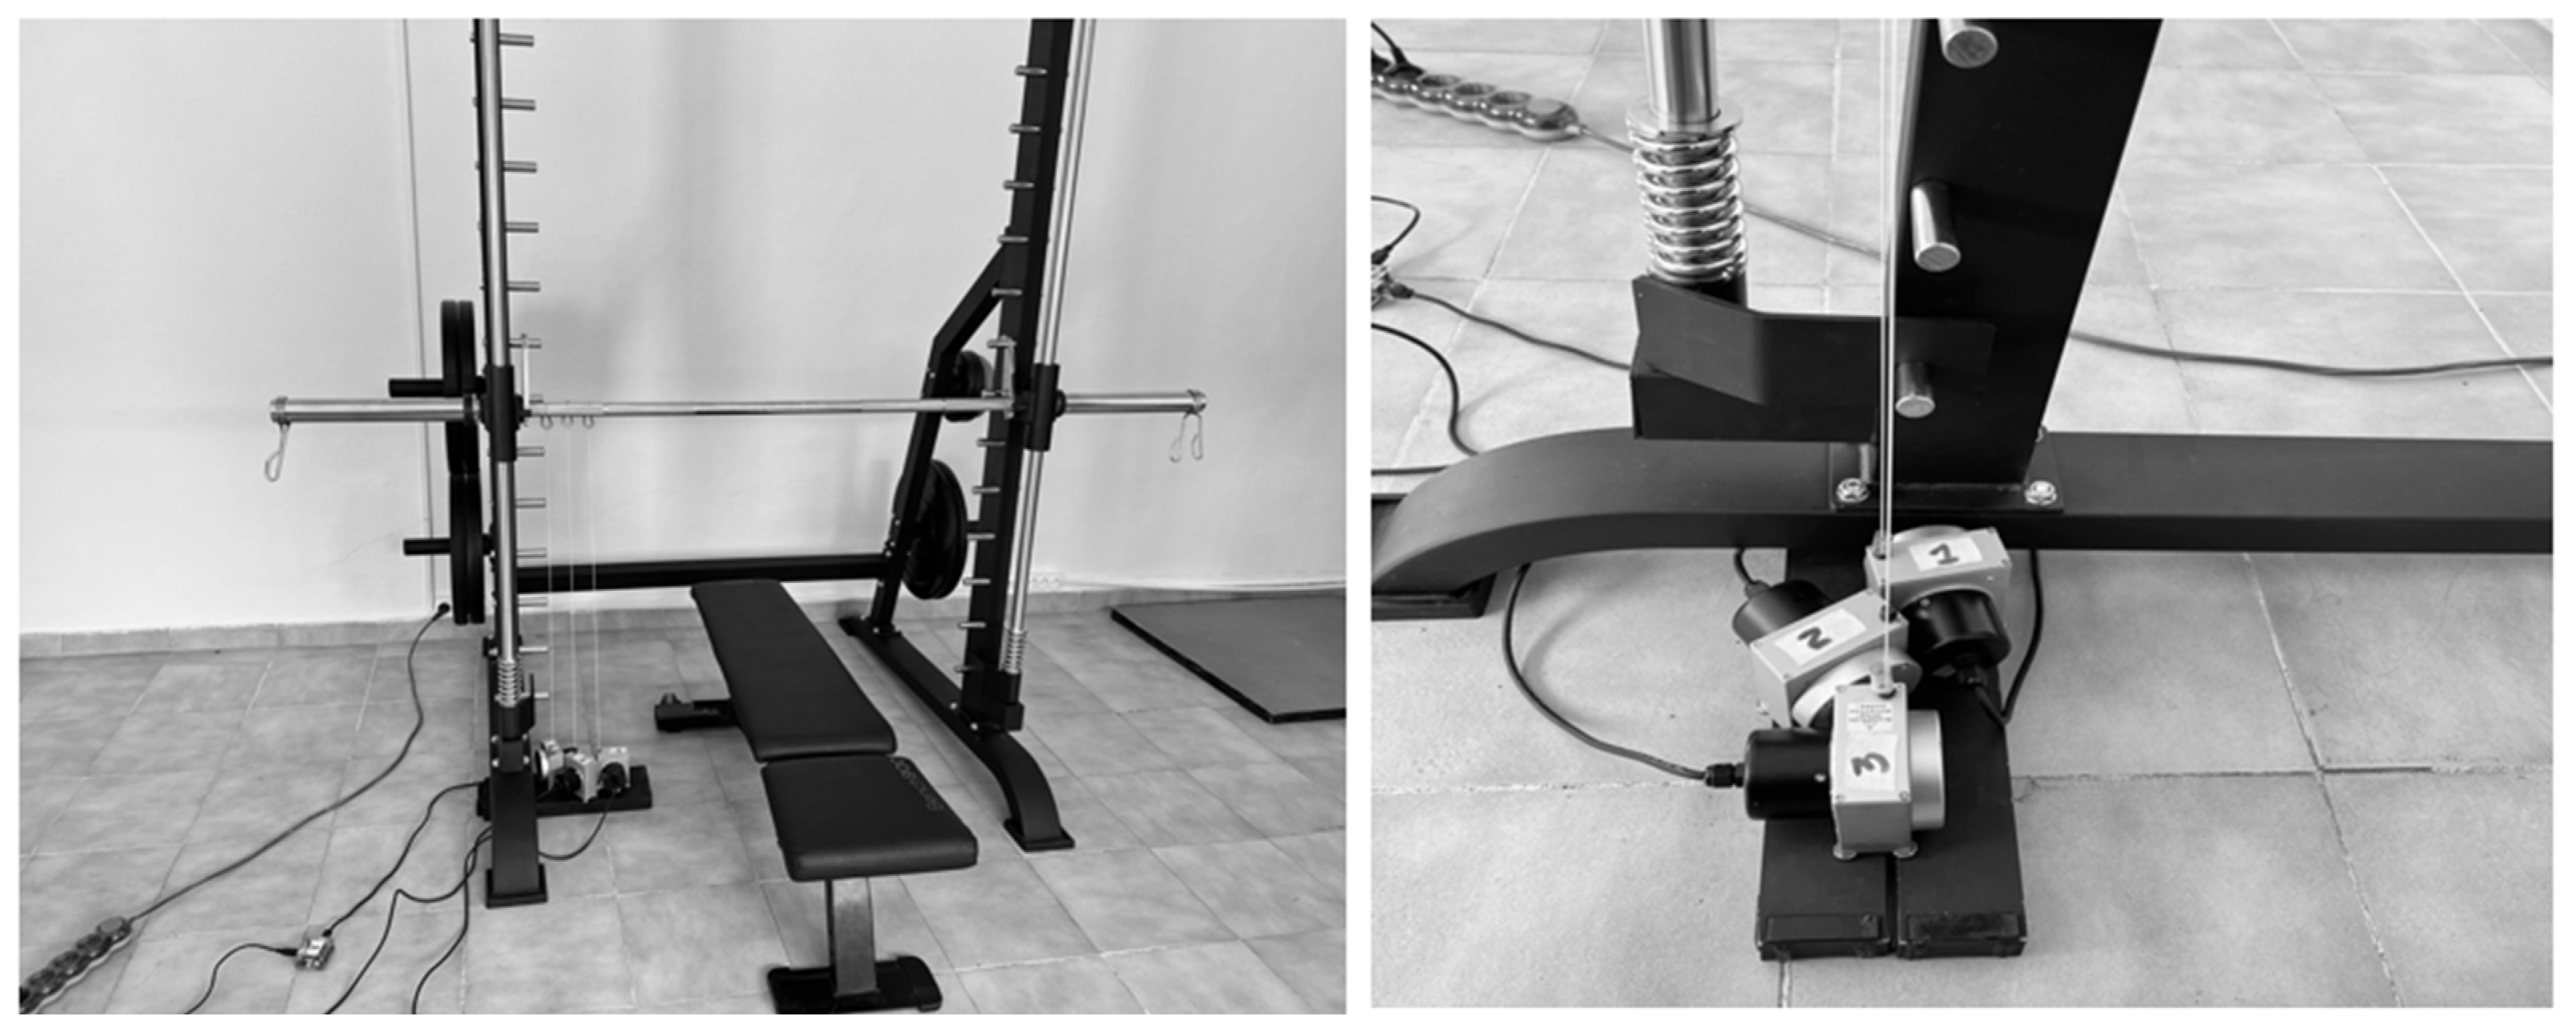
2.3. Measurement Equipment and Data Acquisition
2.4. Testing Procedures
2.5. Statistical Analyses
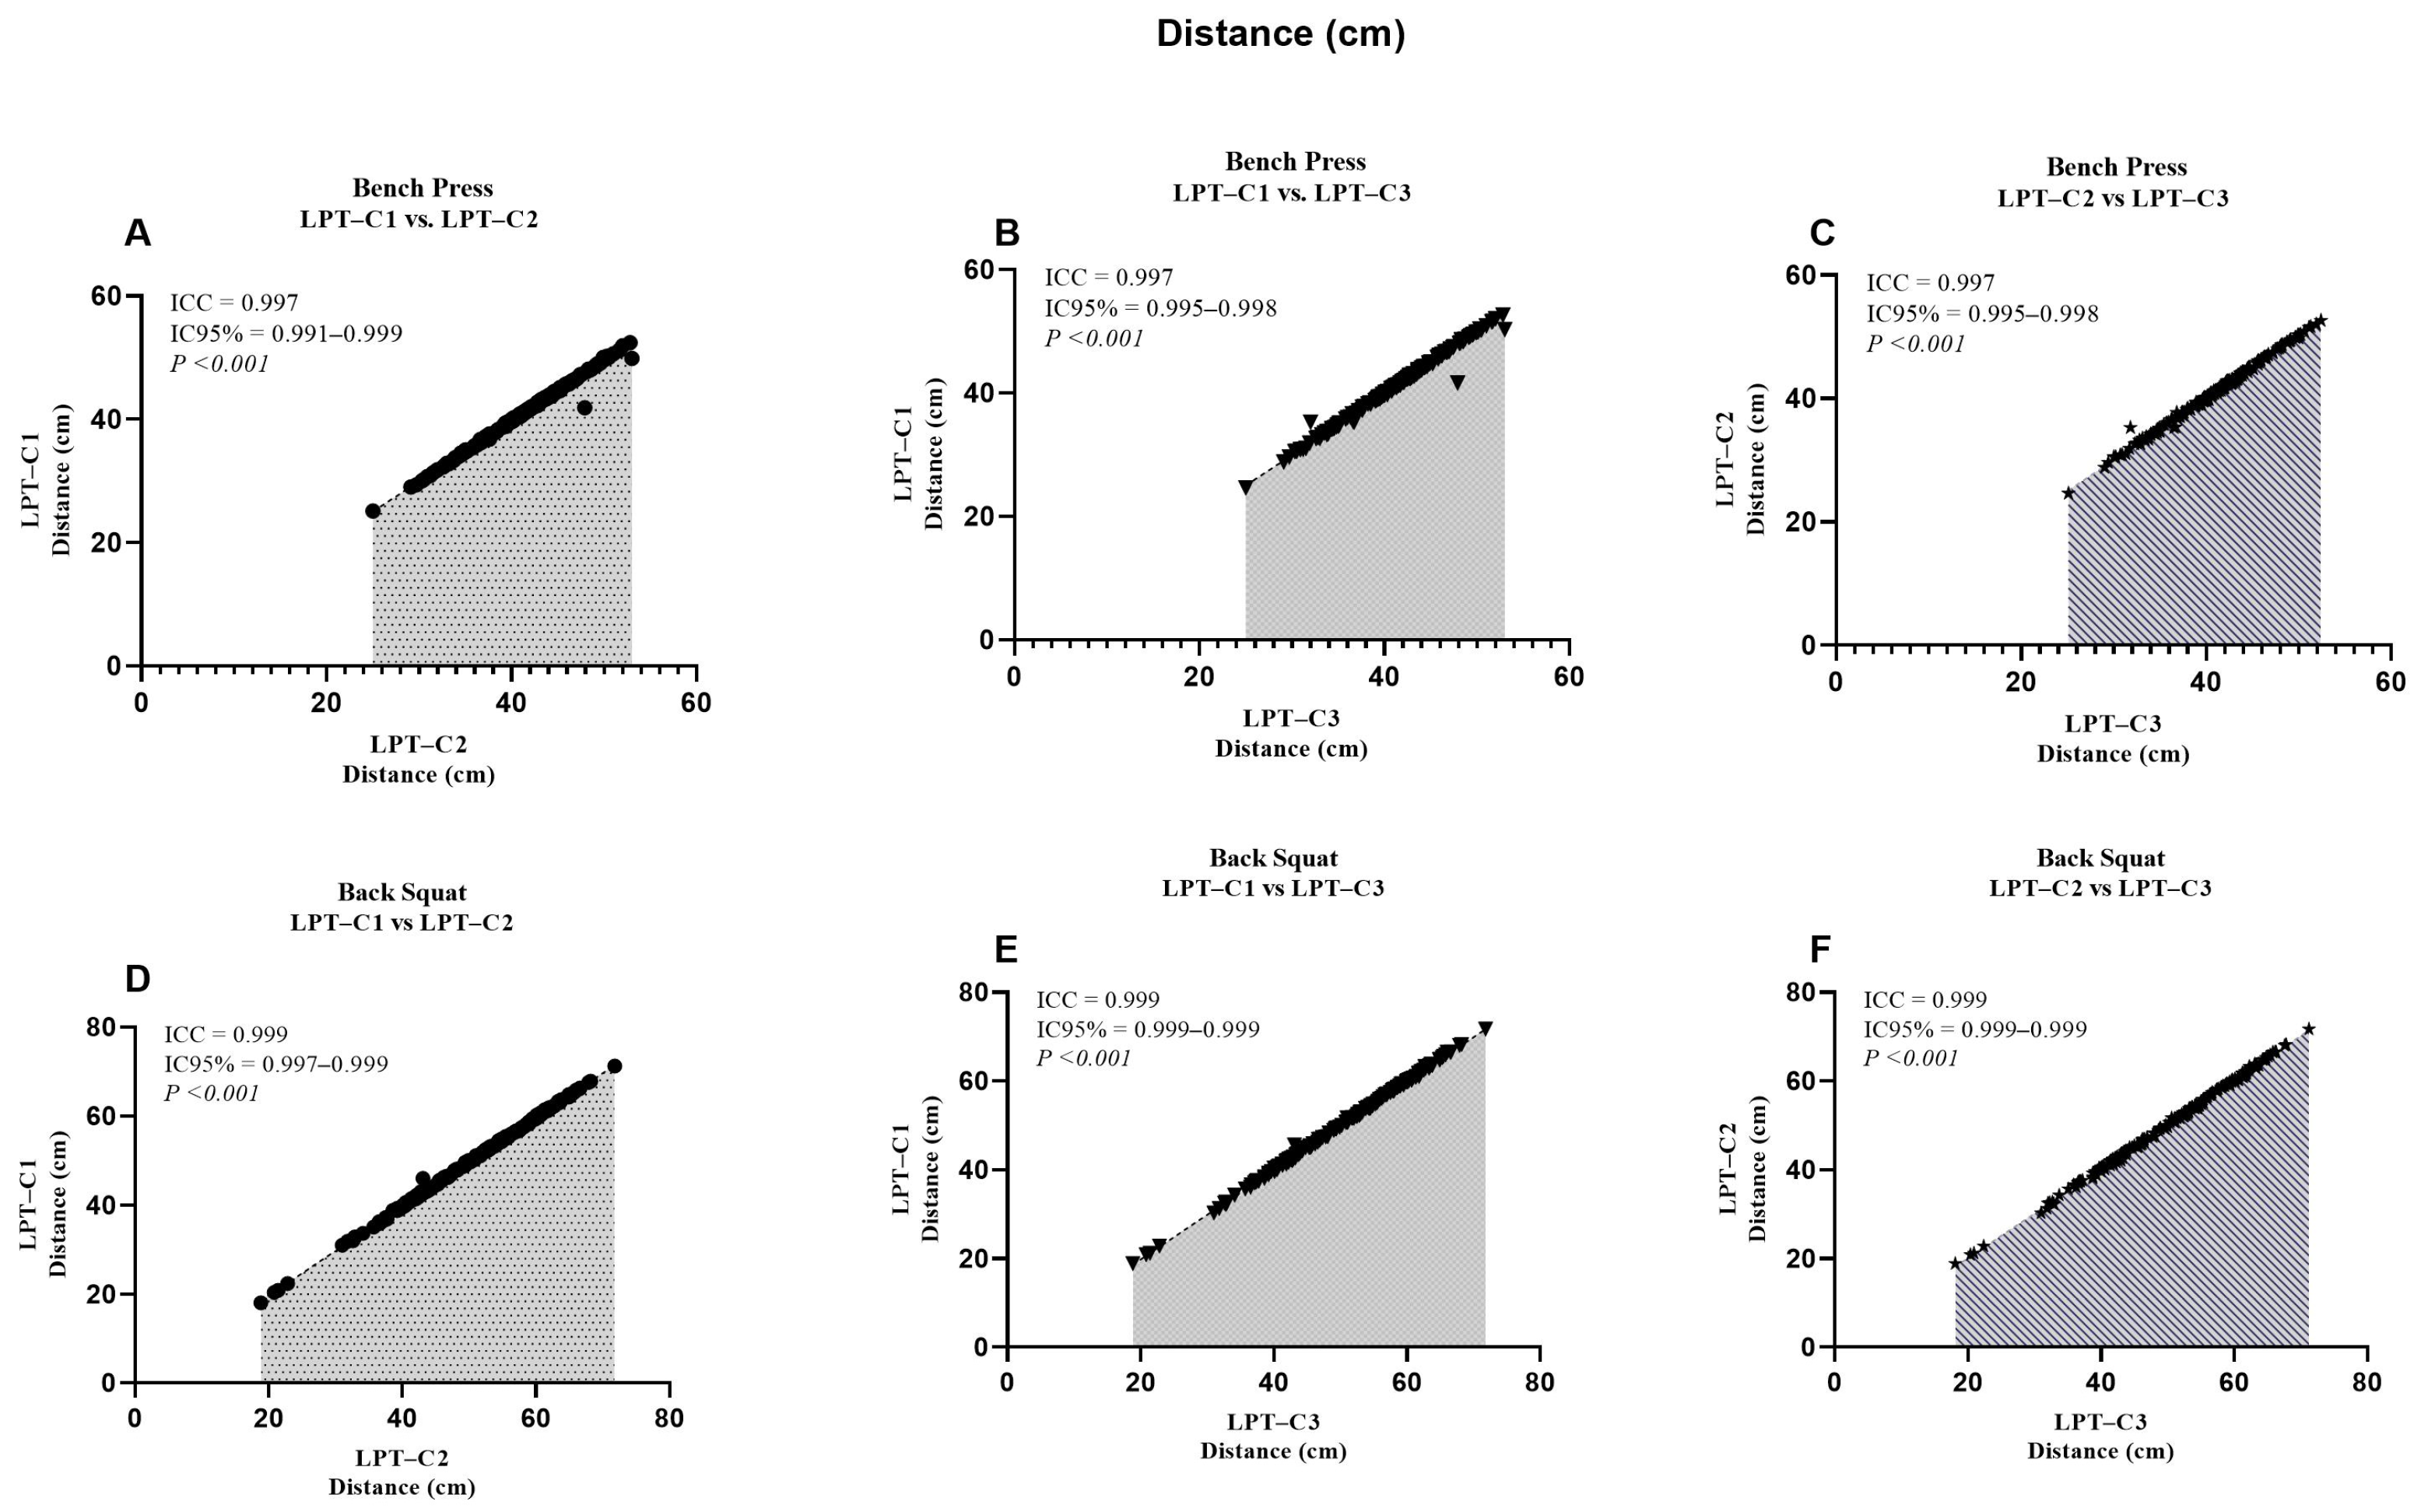
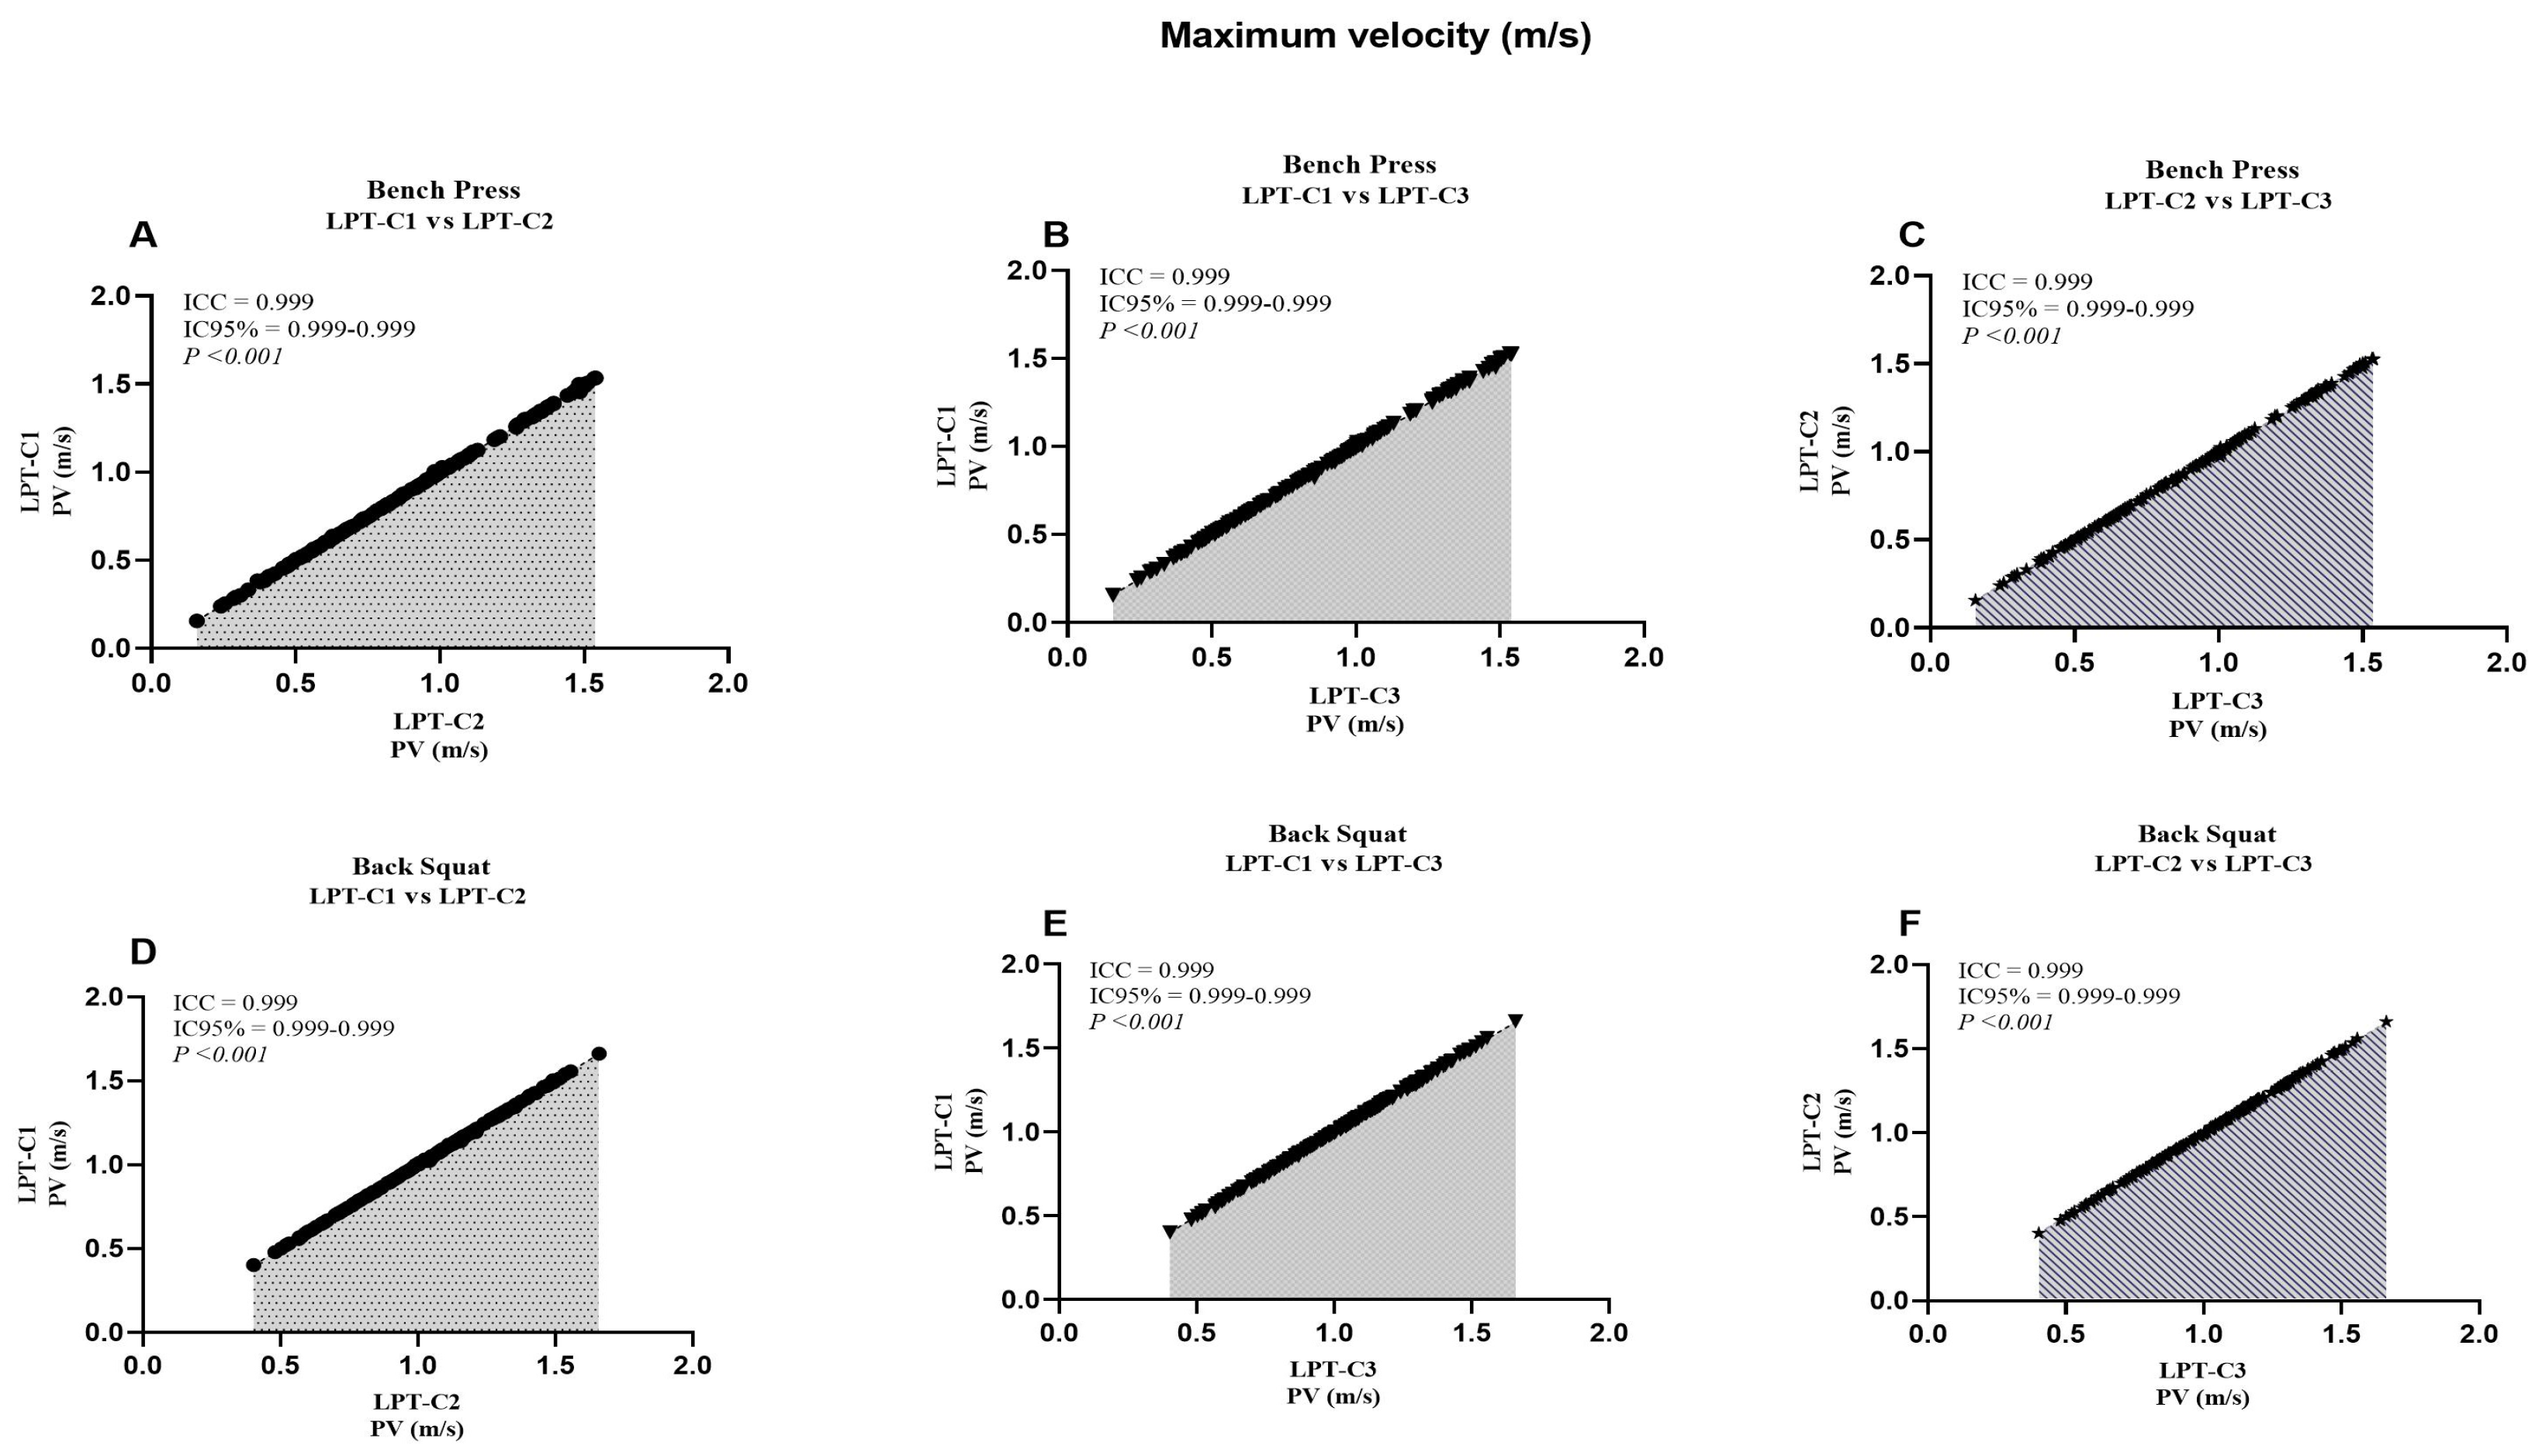
3. Results
4. Discussion
5. Conclusions
Author Contributions
Funding
Institutional Review Board Statement
Informed Consent Statement
Data Availability Statement
Conflicts of Interest
References
- Sánchez-Moreno, M.; Bachero-Mena, B.; Sanchez-Valdepeñ, J.; Nakamura, F.Y.; Pareja-Blanco, F. Impact of Generalized Versus Individualized Load-Velocity Equations on Velocity-Loss Magnitude in Bench-Press Exercise: Mixed-Model and Equivalence Analysis. Int. J. Sport. Physiol. 2024, 19, 1480–1490. [Google Scholar] [CrossRef] [PubMed]
- Moran-Navarro, R.; Martinez-Cava, A.; Sanchez-Medina, L.; Mora-Rodriguez, R.; Gonzalez-Badillo, J.J.; Pallares, J.G. Movement Velocity as a Measure of Level of Effort During Resistance Exercise. J. Strength Cond. Res. 2019, 33, 1496–1504. [Google Scholar] [PubMed]
- Pareja-Blanco, F.; Sánchez-Medina, L.; Suárez-Arrones, L.; González-Badillo, J.J. Effects of Velocity Loss During Resistance Training on Performance in Professional Soccer Players. Int. J. Sports Physiol. Perform 2017, 12, 512–519. [Google Scholar] [CrossRef] [PubMed]
- Sanchez-Medina, L.; Gonzalez-Badillo, J.J. Velocity loss as an indicator of neuromuscular fatigue during resistance training. Med. Sci. Sports Exerc. 2011, 43, 1725–1734. [Google Scholar]
- Orser, K.; Agar-Newman, D.J.; Tsai, M.-C.; Klimstra, M. The validity of the Push Band 2.0 to determine speed and power during progressively loaded squat jumps. Sports Biomech 2020, 23, 109–117. [Google Scholar] [CrossRef]
- Pérez-Castilla, A.; Piepoli, A.; Delgado-García, G.; Garrido-Blanca, G.; García-Ramos, A. Reliability and Concurrent Validity of Seven Commercially Available Devices for the Assessment of Movement Velocity at Different Intensities During the Bench Press. J. Strength Cond. Res. 2019, 33, 1258–1265. [Google Scholar]
- Martínez-Cava, A.; Hernández-Belmonte, A.; Courel-Ibáñez, J.; Morán-Navarro, R.; González-Badillo, J.J.; Pallarés, J.G. Reliability of technologies to measure the barbell velocity: Implications for monitoring resistance training. PLoS ONE 2020, 15, e0232465. [Google Scholar]
- Rodríguez-Rosell, D.; Yáñez-García, J.M.; Mora-Custodio, R.; Sánchez-Medina, L.; Ribas-Serna, J.; González-Badillo, J.J. Effect of velocity loss during squat training on neuromuscular performance. Scand. J. Med. Sci. Sports. 2021, 31, 1621–1635. [Google Scholar]
- Hopkins, W.G. Measures of reliability in sports medicine and science. Sports Med. 2000, 30, 1–15. [Google Scholar] [CrossRef]
- Courel-Ibáñez, J.; Martínez-Cava, A.; Morán-Navarro, R.; Escribano-Peñas, P.; Chavarren-Cabrero, J.; González-Badillo, J.J.; Pallarés, J.G. Reproducibility and Repeatability of Five Different Technologies for Bar Velocity Measurement in Resistance Training. Ann. Biomed. Eng. 2019, 47, 1523–1538. [Google Scholar]
- Dorrell, H.F.; Moore, J.M.; Smith, M.F.; Gee, T.I. Validity and reliability of a linear positional transducer across commonly practised resistance training exercises. J. Sports Sci. 2019, 37, 67–73. [Google Scholar] [CrossRef] [PubMed]
- Weakley, J.; Morrison, M.; García-Ramos, A.; Johnston, R.; James, L.; Cole, M.H. The Validity and Reliability of Commercially Available Resistance Training Monitoring Devices: A Systematic Review. Sports Med. 2021, 51, 443–502. [Google Scholar] [CrossRef] [PubMed]
- Sousa, T.; Pereira, A.; Marques, D.L.; Neiva, H.P.; Marinho, D.A.; Marques, M.C. Validity and reliability of the T–Force and Chronojump systems to measure movement velocity on resistance machines with older adults. Sci. Rep. 2024, 14, 23727. [Google Scholar] [CrossRef] [PubMed]
- Donoghue, O.A.; Savva, G.M.; Börsch-Supan, A.; Kenny, R.A. Reliability, measurement error and minimum detectable change in mobility measures: A cohort study of community-dwelling adults aged 50 years and over in Ireland. BMJ Open. 2019, 9, e030475. [Google Scholar] [CrossRef]
- Beckerman, H.; Roebroeck, M.E.; Lankhorst, G.J.; Becher, J.G.; Bezemer, P.D.; Verbeek, A.L.M. Smallest real difference, a link between reproducibility and responsiveness. Qual. Life Res. 2001, 10, 571–578. [Google Scholar] [CrossRef]
- Horta-Gim, M.A.; Romero-Pérez, E.M.; Medina-Pérez, C.; Tánori-Tapia, J.M.; Núñez-Othón, G.; Novo, A.; de Paz, J.A. Test-Retest and Minimal Detectable Change in the Assessment of Muscle Strength and Muscle Power in Upper and Lower Extremity Exercises in 9-to 14-Year-Old Children. Appl. Sci. 2021, 11, 2204. [Google Scholar] [CrossRef]
- Johnston, W.; O’Reilly, M.; Argent, R.; Caulfield, B. Reliability, Validity and Utility of Inertial Sensor Systems for Postural Control Assessment in Sport Science and Medicine Applications: A Systematic Review. Sports Med. 2019, 49, 783–818. [Google Scholar] [CrossRef]
- Pueo, B.; Penichet-Tomas, A.; Jimenez-Olmedo, J.M. Reliability and validity of the Chronojump open-source jump mat system. Biol. Sport. 2020, 37, 255–259. [Google Scholar] [CrossRef]
- Montoro-Bombu, R.; Field, A.; Santos, A.C.; Rama, L. Validity and reliability of the Output sport device for assessing drop jump performance. Front. Bioeng. Biotechnol. 2022, 10, 1015526. [Google Scholar] [CrossRef]
- James, L.P.; Roberts, L.A.; Haff, G.G.; Kelly, V.G.; Beckman, E.M. Validity and Reliability of a Portable Isometric Mid-Thigh Clean Pull. J. Strength Cond. Res. 2017, 31, 1378–1386. [Google Scholar] [CrossRef]
- Lunn, W.R.; Axtell, R.S. Validity and Reliability of the Lode Excalibur Sport Cycle Ergometer for the Wingate Anaerobic Test. J. Strength Cond. Res. 2021, 35, 2894–2901. [Google Scholar] [PubMed]
- Balsalobre-Fernández, C.; Marchante, D.; Baz-Valle, E.; Alonso-Molero, I.; Jiménez, S.L.; Muñoz-López, M. Analysis of Wearable and Smartphone-Based Technologies for the Measurement of Barbell Velocity in Different Resistance Training Exercises. Front. Physiol. 2017, 8, 649. [Google Scholar]
- Shrout, P.E.; Fleiss, J.L. Intraclass correlations: Uses in assessing rater reliability. Psychol. Bull. 1979, 86, 420–428. [Google Scholar] [CrossRef] [PubMed]
- Laschinger, H.K. Intraclass correlations as estimates of interrater reliability in nursing research. West. J. Nurs. Res. 1992, 14, 246–251. [Google Scholar] [CrossRef]
- Martinez-Ferran, M.; Berlanga, L.A.; Barcelo-Guido, O.; Matos-Duarte, M.; Vicente-Campos, D.; Sanchez-Jorge, S.; Romero-Morales, C.; Munguía-Izquierdo, D.; Pareja-Galeano, H. Antioxidant vitamin supplementation on muscle adaptations to resistance training: A double-blind, randomized controlled trial. Nutrition 2023, 105, 111848. [Google Scholar]
- Bonde-Jensen, F.; Dalgas, U.; Langeskov-Christensen, M. Are physical activity levels, cardiorespiratory fitness and peak power associated with Parkinson’s disease severity? J. Neurol. Sci. 2024, 460, 122996. [Google Scholar]
- Martínez-Rubio, C.; Quidel-Catrilelbún, M.E.L.; Baena-Raya, A.; Rodríguez-Pérez, M.A.; Pérez-Castilla, A. Inter-repetition Rest Impact on Percentage of Repetition Completed at Certain Velocity Loss. Int. J. Sports Med. 2024, 45, 116–124. [Google Scholar] [CrossRef]
- Dietz, V.; Schmidtbleicher, D.; Ledig, T.; Noth, J. Timing of Stance and Swing Phase and Occurrence of Phasic Stretch Reflex in Running Man. Pflug. Arch. Eur. J. Phy. 1978, R71. [Google Scholar]
- Sanchez-Medina, L.; Perez, C.E.; Gonzalez-Badillo, J.J. Importance of the Propulsive Phase in Strength Assessment. Int. J. Sports Med. 2010, 31, 123–129. [Google Scholar]
- Salami, S.; Wei, J.; Regan, M.; Scherr, D.; Siddiqui, J.; Kearney, M.; Eyre, R.; Dewolf, W.; Rubin, M.; Sanda, M. Body Mass Index and Prostate Size Improve Performance of a Prostate Cancer Risk Calculator at High Levels of Sensitivity for Predicting Prostate Cancer at Initial Prostate Biopsy: Results from a Prospective, Multi-Center Cohort. J. Urology. 2010, 183, e818–e819. [Google Scholar] [CrossRef]
- Banyard, H.G.; Nosaka, K.; Haff, G.G. Reliability and Validity of the Load-Velocity Relationship to Predict the 1RM Back Squat. J. Strength Cond. Res. 2017, 31, 1897–1904. [Google Scholar] [PubMed]
- Montoro-Bombú, R.; Gomes, B.B.; Santos, A.; Rama, L. Validity and Reliability of a Load Cell Sensor-Based Device for Assessment of the Isometric Mid-Thigh Pull Test. Sensors 2023, 23, 5832. [Google Scholar] [CrossRef] [PubMed]
- Schoenfeld, B.J.; Grgic, J. Effects of range of motion on muscle development during resistance training interventions: A systematic review. Sage Open Med. 2020, 8, 2050312120901559. [Google Scholar] [PubMed]
- Timmins, R.G.; Shield, A.J.; Williams, M.D.; Lorenzen, C.; Opar, D.A. Architectural adaptations of muscle to training and injury: A narrative review outlining the contributions by fascicle length, pennation angle and muscle thickness. Br. J. Sports Med. 2016, 50, 1467–1472. [Google Scholar]
- Krzysztofik, M.; Zajac, A.; Zmijewski, P.; Wilk, M. Can the Cambered Bar Enhance Acute Performance in the Bench Press Exercise? Front. Physiol. 2020, 11, 577400. [Google Scholar]
- Pallarés, J.G.; Hernández-Belmonte, A.; Martínez-Cava, A.; Vetrovsky, T.; Steffl, M.; Courel-Ibáñez, J. Effects of range of motion on resistance training adaptations: A systematic review and meta-analysis. Scand. J. Med. Sci. Sports 2021, 31, 1866–1881. [Google Scholar]
- Kawamori, N.; Haff, G.G. The optimal training load for the development of muscular power. J. Strength Cond. Res. 2004, 18, 675–684. [Google Scholar]
- Thomas, K.; French, D.; Hayes, P.R. The effect of two plyometric training techniques on muscular power and agility in youth soccer players. J. Strength Cond. Res. 2009, 23, 332–335. [Google Scholar]
- Maffiuletti, N.A.; Aagaard, P.; Blazevich, A.J.; Folland, J.; Tillin, N.; Duchateau, J. Rate of force development: Physiological and methodological considerations. Eur. J. Appl. Physiol. 2016, 116, 1091–1116. [Google Scholar]
- Jensen, R.L.; Ebben, W.P. Quantifying plyometric intensity via rate of force development, knee joint, and ground reaction forces. J. Strength Cond. Res. 2007, 21, 763–767. [Google Scholar]


| Bench Press (BP) | Back Squat (SQ) | |||||
|---|---|---|---|---|---|---|
| Encoder–1 | Encoder–2 | Encoder–3 | Encoder–1 | Encoder–2 | Encoder–3 | |
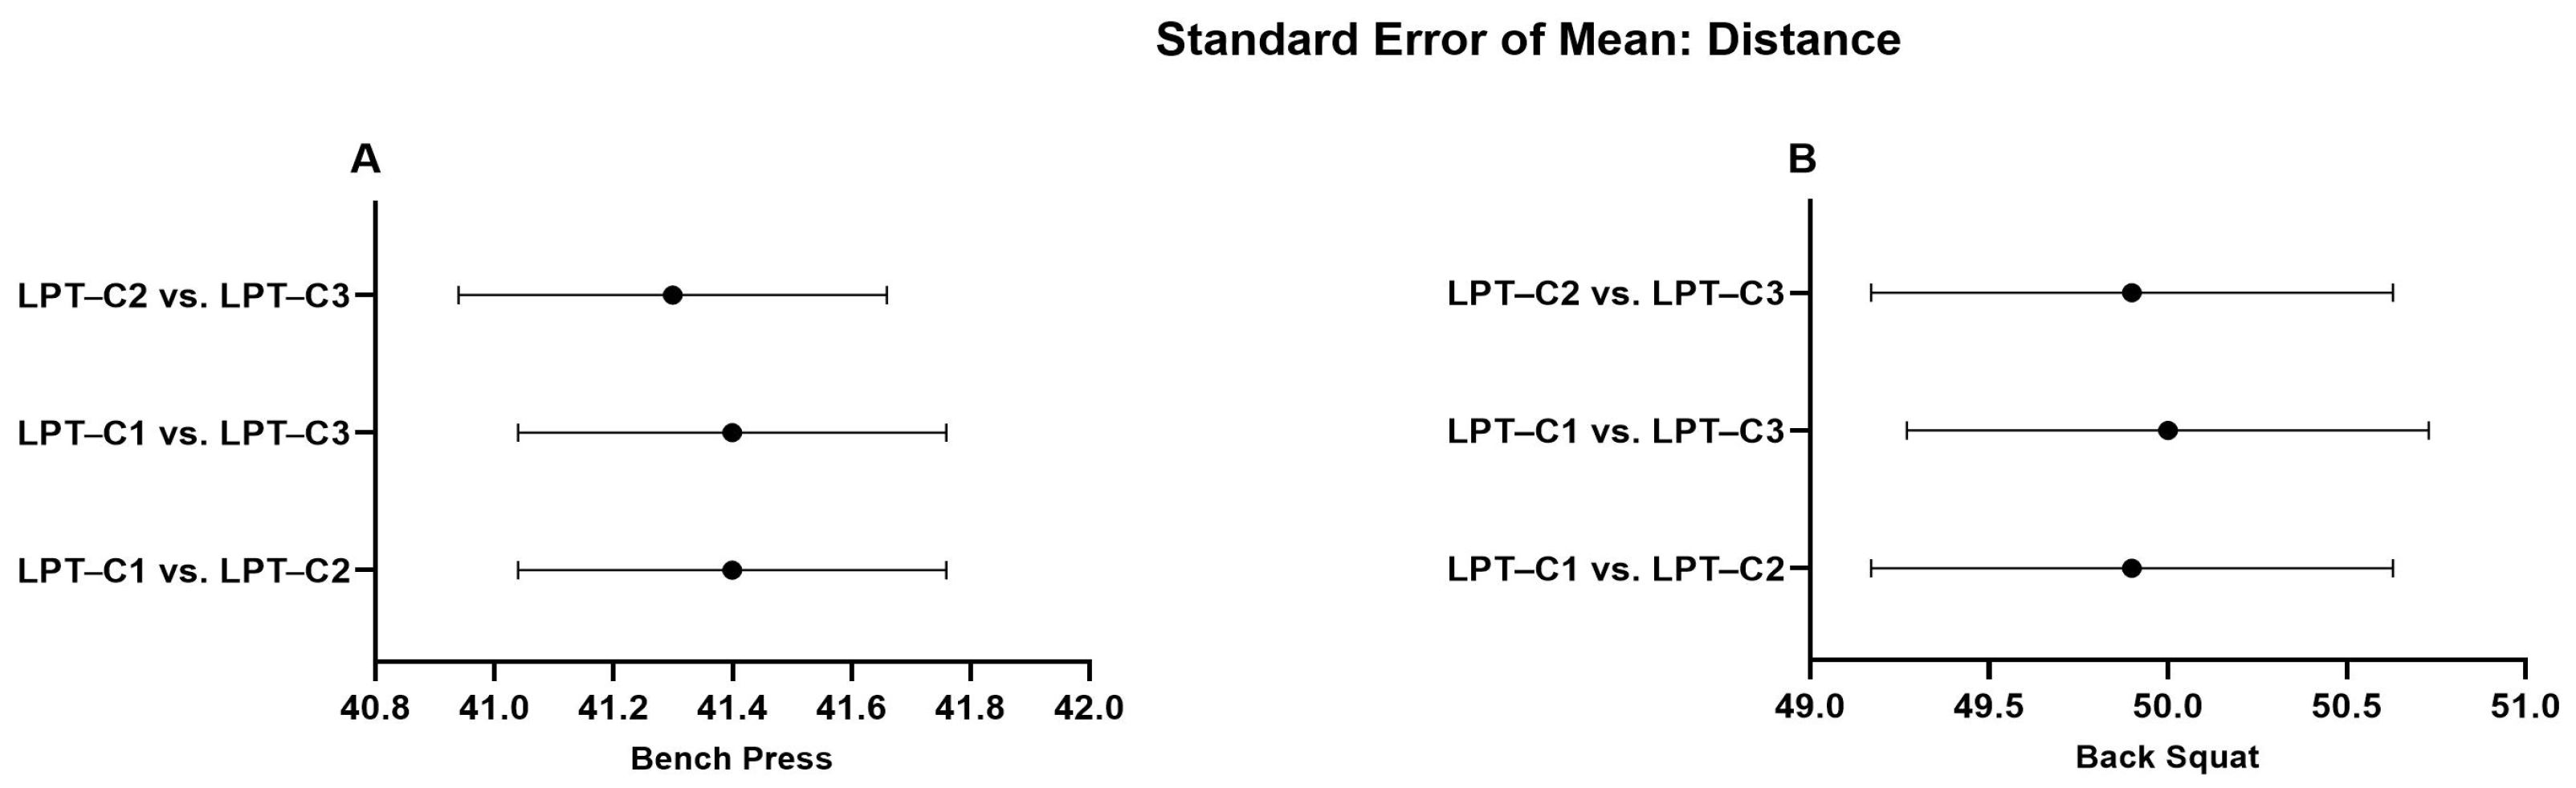
| ∆S (cm) | 41.5 ± 5.20 | 41.2 ± 5.11 | 41.4 ± 5.17 | 50.1 ± 10.4 | 49.8 ± 10.4 | 50.0 ± 10.4 |
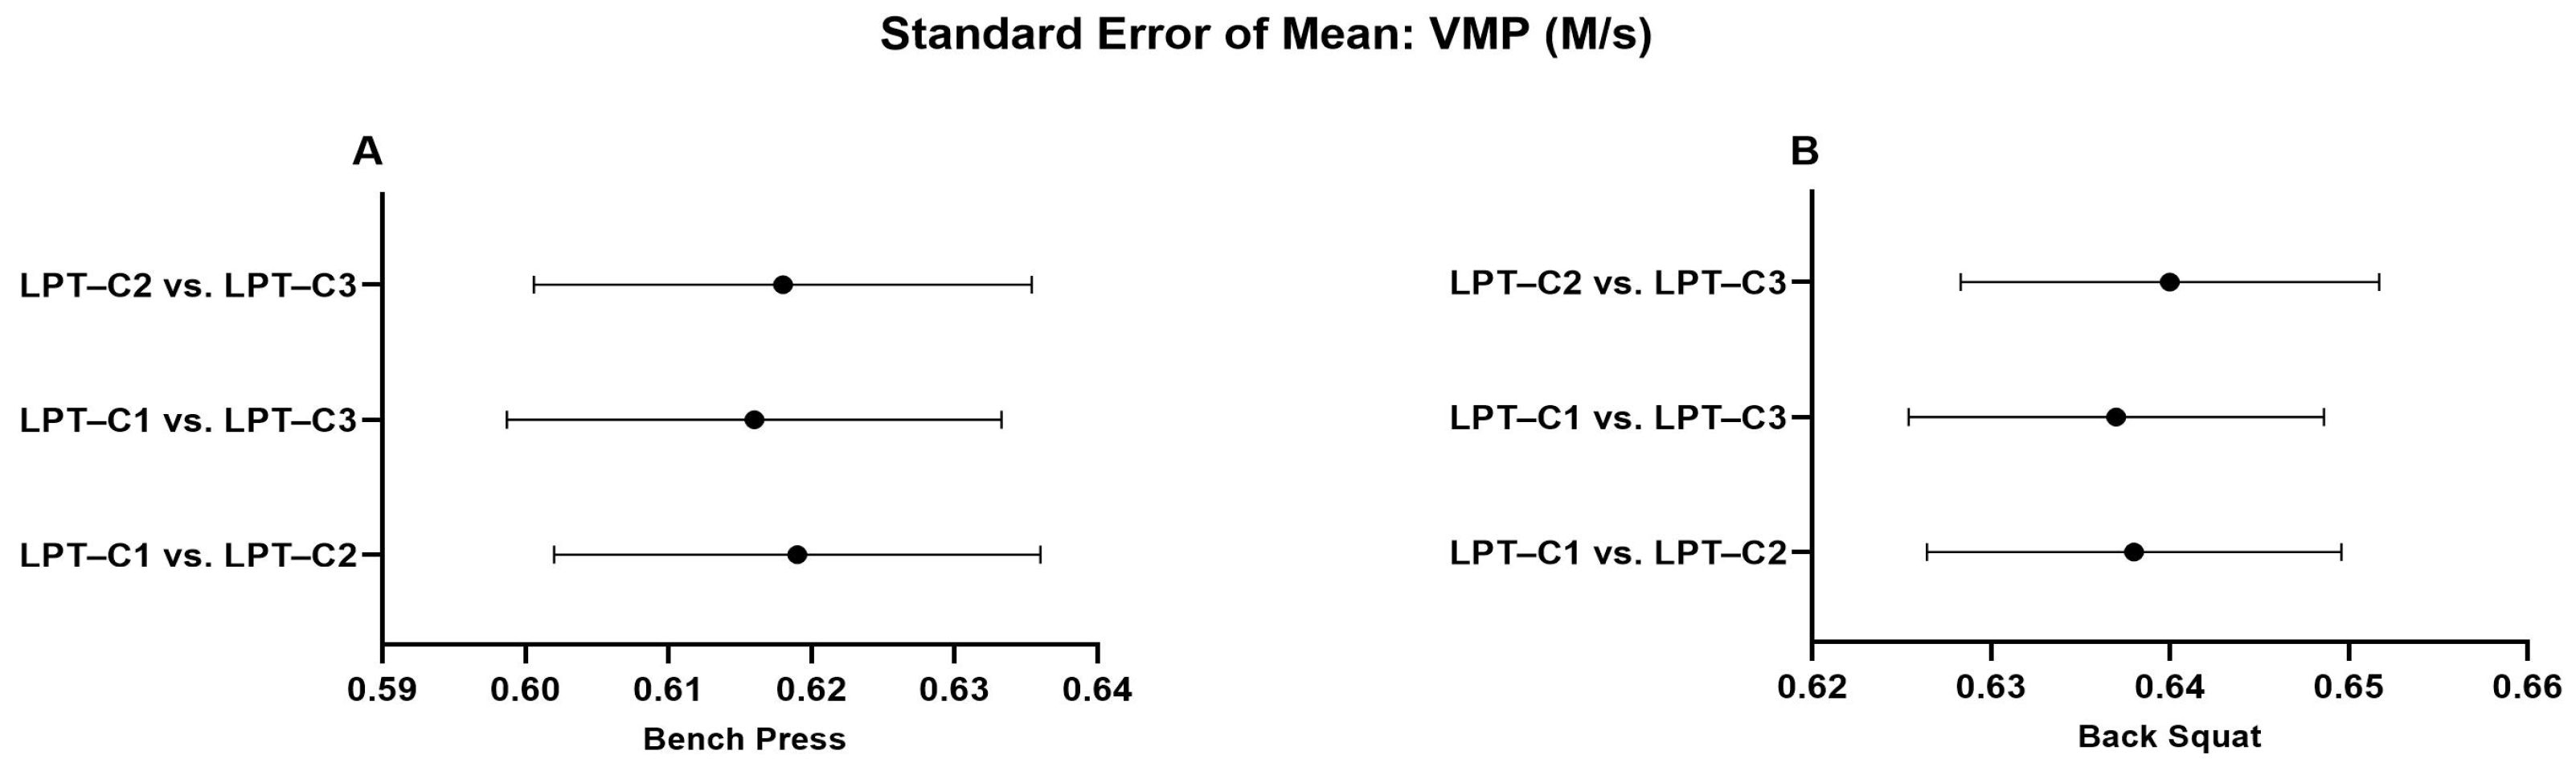
| MPV (m/s) | 0.617 ± 0.245 | 0.621 ± 0.249 | 0.614 ± 0.245 | 0.634 ± 0.163 | 0.621 ± 0.173 | 0.614 ± 0.165 |
| PV (m/s) | 0.872 ± 0.333 | 0.871 ± 0.332 | 0.869 ± 0.331 | 1.03 ± 0.259 | 1.03 ± 0.260 | 1.03 ± 0.259 |
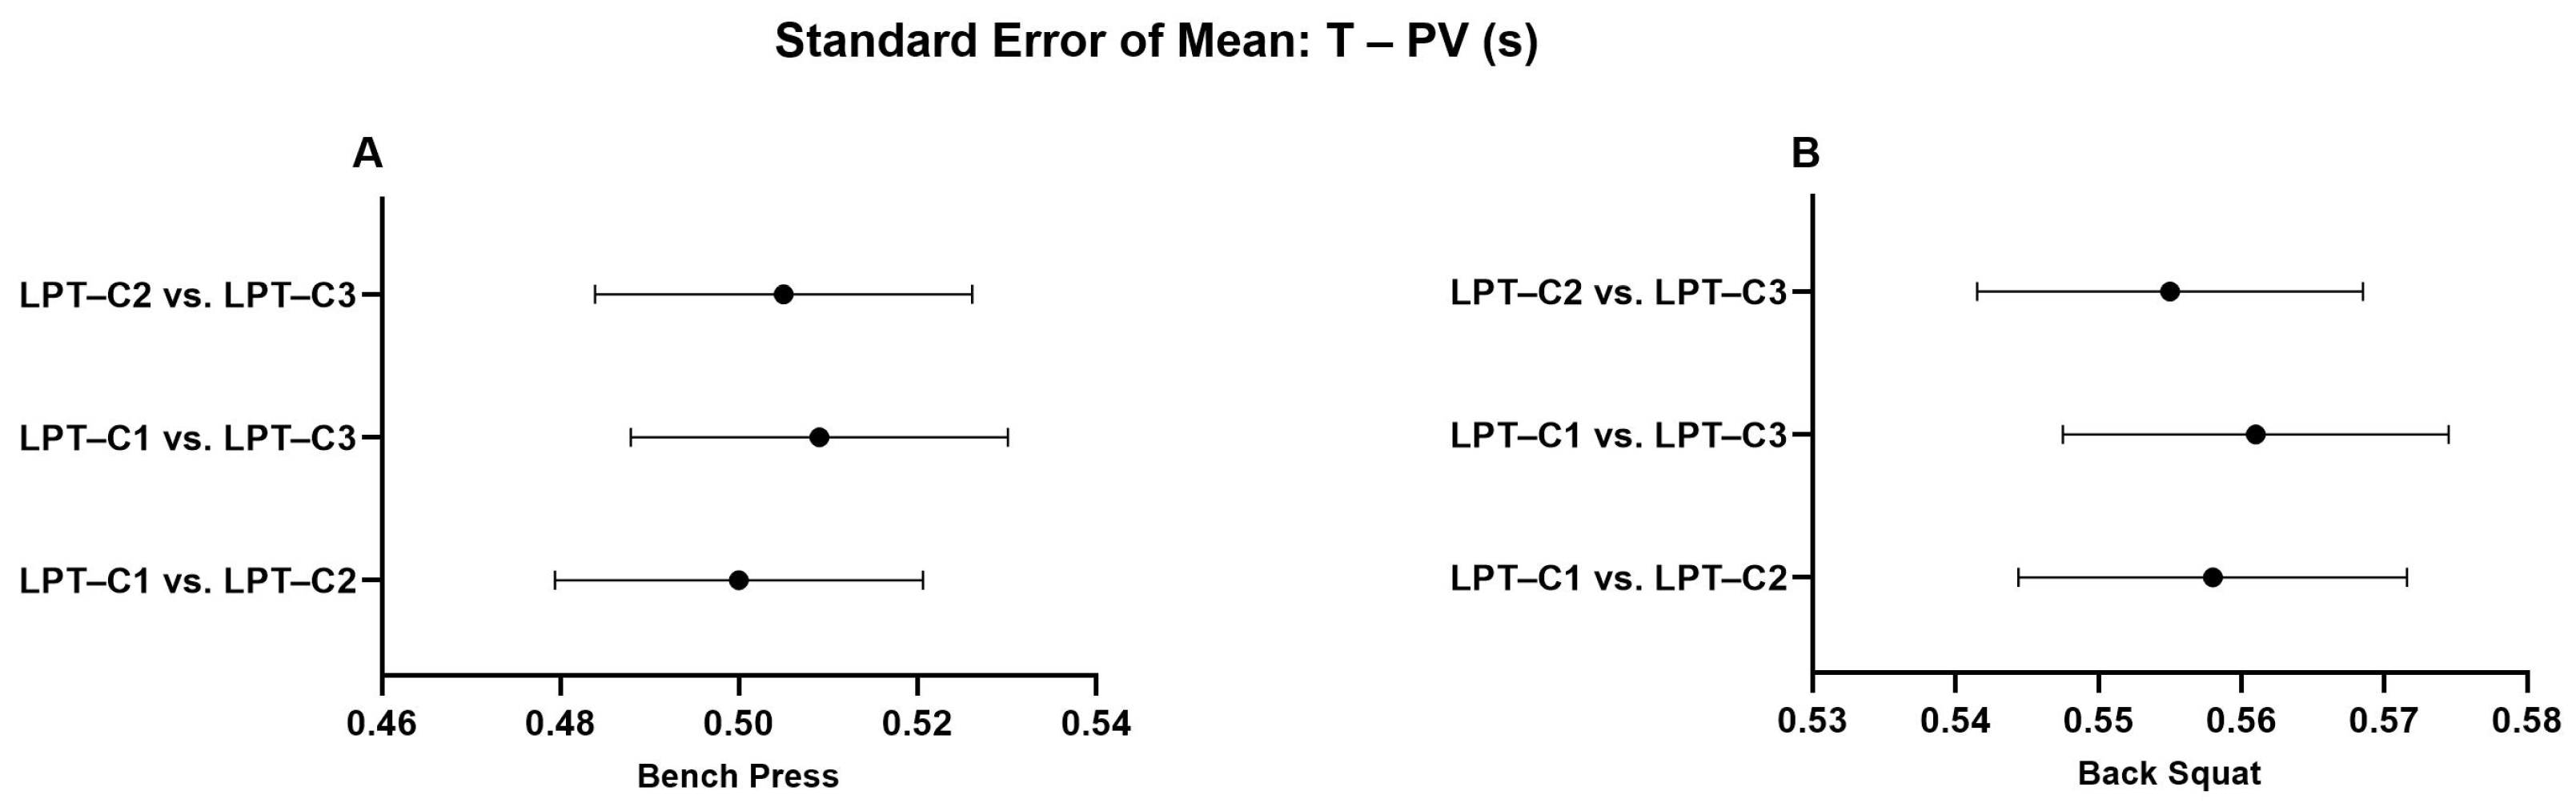
| T–PV (s) | 0.504 ± 0.291 | 0.496 ± 0.291 | 0.514 ± 0.326 | 0.563 ± 0.192 | 0.551 ± 0.192 | 0.559 ± 0.191 |
| Bench Press (BP) | Back Squat (SQ) | ||||||
|---|---|---|---|---|---|---|---|
| LPT–C1 vs. LPT–C2 | LPT–C1 vs. LPT–C3 | LPT–C2 vs. LPT–C3 | LPT–C1 vs. LPT–C2 | LPT–C1 vs. LPT–C3 | LPT–C2 vs. LPT–C3 | ||
| ∆S (cm) | MD | 0.31 ± 0.47 | 0.18 ± 0.56 | 0.12 ± 0.37 | 0.31 ± 0.32 | 0.10 ± 0.30 | 0.20 ± 0.43 |
| CI-95% upper | 0.37 | 0.26 | 0.18 | 0.35 | 0.148 | 0.145 | |
| CI-95% lower | 0.24 | 0.10 | 0.07 | 0.26 | 0.064 | 0.026 | |
| T-Test (p) | <0.001 | <0.001 | <0.001 | <0.001 | <0.001 | <0.001 | |
| SLR | 0.009 | 0.500 | 0.848 | 0.391 | 0.549 | 0.540 | |
| CV(%) | 1.52 | 3.05 | 2.96 | 1.05 | 2.82 | 2.09 | |
| SRD (m s−1) | 0.093 | 0.110 | 0.110 | 0.124 | 0.158 | 0.148 | |
| MPV (m/s) | MD | 0.004 ± 0.014 | 0.002 ± 0.023 | 0.006 ± 0.025 | 0.010 ± 0.019 | 0.004 ± 0.018 | 0.006 ± 0.022 |
| CI-95% upper | 0.006 | 0.005 | 0.0010 | 0.013 | 0.006 | 0.009 | |
| CI-95% lower | 0.002 | 0.000 | 0.003 | 0.008 | 0.001 | 0.003 | |
| T-Test (p) | <0.001 | <0.001 | 0.116 | <0.001 | <0.001 | <0.001 | |
| SLR | 0.534 | 0.990 | 0.963 | 0.401 | 0.193 | 0.102 | |
| CV(%) | 3.10 | 10.16 | 3.73 | 0.26 | 0.27 | 0.26 | |
| SRD (m s−1) | 0.004 | 0.004 | 0.004 | 0.013 | 0.003 | 0.013 | |
| PV (m/s) | MD | 0.001 ± 0.005 | 0.003 ± 0.005 | 0.001 ± 0.006 | 0.001 ± 0.003 | 0.001 ± 0.004 | 0.001 ± 0.004 |
| CI-95% Upper | 0.002 | 0.003 | 0.003 | 0.001 | 0.006 | 0.002 | |
| CI-95% lower | 0.000 | 0.002 | 0.000 | 0.000 | 0.002 | 0.001 | |
| T-Test (p) | <0.001 | <0.001 | <0.001 | 0.056 | <0.001 | <0.001 | |
| SLR | 0.313 | 0.456 | 0.524 | 0.152 | 0.168 | 0.346 | |
| CV(%) | 3.13 | 1.81 | 4.20 | 3 | 2.99 | 4.00 | |
| SRD (m s−1) | 0.001 | 0.001 | 0.001 | 0.000 | 0.000 | 0.001 | |
| T–PV (s) | MD | 0.007 ± 0.016 | 0.002 ± 0.021 | 0.005 ± 0.023 | 0.012 ± 0.017 | 0.004 ± 0.016 | 0.007 ± 0.022 |
| CI-95% upper | 0.010 | 0.005 | 0.008 | 0.015 | 0.006 | 0.011 | |
| CI-95% lower | 0.005 | 0.000 | 0.001 | 0.010 | 0.002 | 0.004 | |
| T-Test (p) | <0.001 | 0.008 | 0.003 | <0.001 | <0.001 | <0.001 | |
| SLR | 0.575 | 0.433 | 0.256 | 0.570 | 0.593 | 0.334 | |
| CV (%) | 2.15 | 8.11 | 4.61 | 1.36 | 3.48 | 2.92 | |
| SRD (m s−1) | 0.003 | 0.032 | 0.032 | 0.003 | 0.003 | 0.004 | |
Disclaimer/Publisher’s Note: The statements, opinions and data contained in all publications are solely those of the individual author(s) and contributor(s) and not of MDPI and/or the editor(s). MDPI and/or the editor(s) disclaim responsibility for any injury to people or property resulting from any ideas, methods, instructions or products referred to in the content. |
© 2025 by the authors. Licensee MDPI, Basel, Switzerland. This article is an open access article distributed under the terms and conditions of the Creative Commons Attribution (CC BY) license (https://creativecommons.org/licenses/by/4.0/).
Share and Cite
Montoro-Bombú, R.; Costa, A.; Sousa, P.M.; Pinheiro, V.; Forte, P.; Monteiro, L.; Ribeiro, A.S.; Rama, L. Reliability and Accuracy of Linear Position Transducers During the Bench Press and Back Squat: Implications for Velocity-Based Training. J. Funct. Morphol. Kinesiol. 2025, 10, 109. https://doi.org/10.3390/jfmk10020109
Montoro-Bombú R, Costa A, Sousa PM, Pinheiro V, Forte P, Monteiro L, Ribeiro AS, Rama L. Reliability and Accuracy of Linear Position Transducers During the Bench Press and Back Squat: Implications for Velocity-Based Training. Journal of Functional Morphology and Kinesiology. 2025; 10(2):109. https://doi.org/10.3390/jfmk10020109
Chicago/Turabian StyleMontoro-Bombú, Raynier, Armando Costa, Paulo Malico Sousa, Valter Pinheiro, Pedro Forte, Luis Monteiro, Alex S. Ribeiro, and Luis Rama. 2025. "Reliability and Accuracy of Linear Position Transducers During the Bench Press and Back Squat: Implications for Velocity-Based Training" Journal of Functional Morphology and Kinesiology 10, no. 2: 109. https://doi.org/10.3390/jfmk10020109
APA StyleMontoro-Bombú, R., Costa, A., Sousa, P. M., Pinheiro, V., Forte, P., Monteiro, L., Ribeiro, A. S., & Rama, L. (2025). Reliability and Accuracy of Linear Position Transducers During the Bench Press and Back Squat: Implications for Velocity-Based Training. Journal of Functional Morphology and Kinesiology, 10(2), 109. https://doi.org/10.3390/jfmk10020109