
Reliability of Muscle Oxygen Saturation for Evaluating Exercise Intensity and Knee Joint Load Indicators


 , , , , , and
Abstract
:1. Introduction
2. Materials and Methods
2.1. Problem Experimental
2.2. Participants
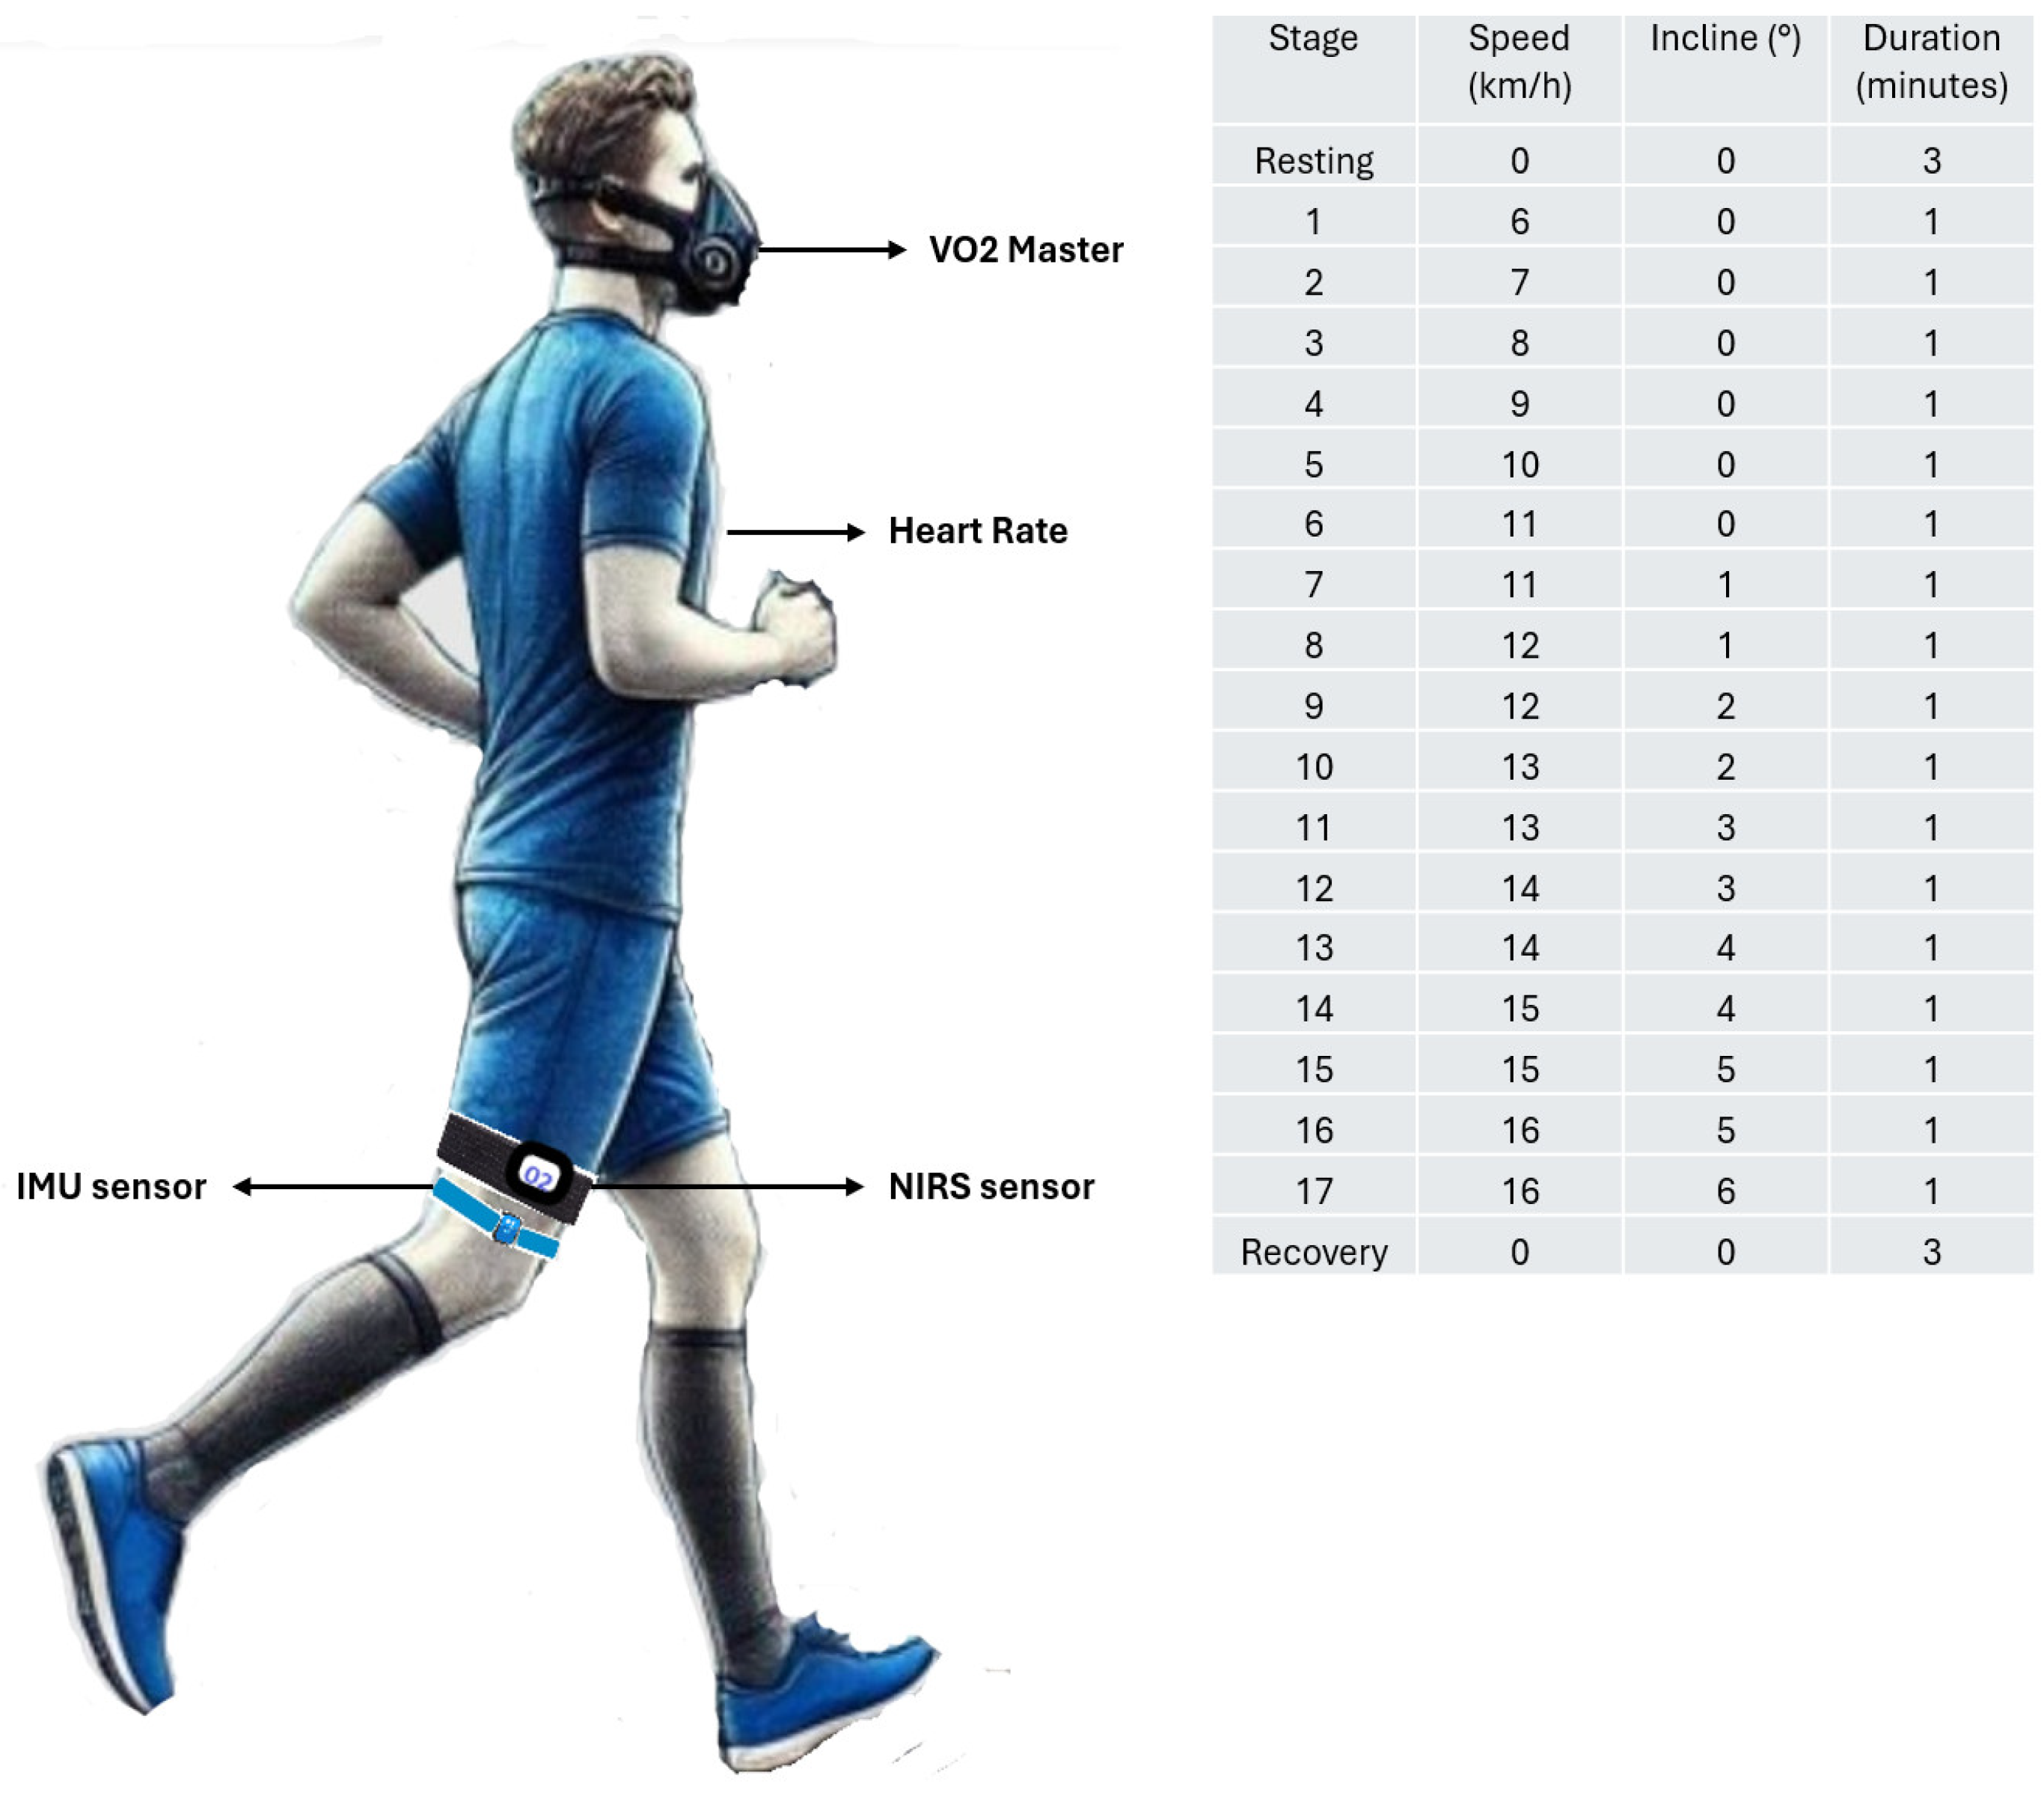
2.3. Protocol
2.4. Assessment
2.4.1. V’O2 Master Pro Analyzer
2.4.2. Exercise Intensity
2.4.3. Inertial Measurement Unit (IMU)
2.4.4. Muscle Oxygen Saturation Through of Near-Infrared Spectroscopy (NIRS) Technology
2.5. Statistical Analysis
3. Results
4. Discussion
4.1. Recommendations and Limitations
Practical Application
5. Conclusions
Author Contributions
Funding
Institutional Review Board Statement
Informed Consent Statement
Data Availability Statement
Conflicts of Interest
References
- Perrey, S.; Quaresima, V.; Ferrari, M. Muscle Oximetry in Sports Science: An Updated Systematic Review. Sports Med. 2024, 54, 975–996. [Google Scholar] [CrossRef] [PubMed]
- Vasquez Bonilla, A.A.; González-Custodio, A.; Timón, R.; Camacho-Cardenosa, A.; Camacho-Cardenosa, M.; Olcina, G. Training Zones through Muscle Oxygen Saturation during a Graded Exercise Test in Cyclists and Triathletes. Biol. Sport 2023, 40, 439–448. [Google Scholar] [CrossRef]
- Nemoto, S.; Nakabo, T.; Tashiro, N.; Kishino, A.; Yoshikawa, A.; Nakamura, D.; Geshi, E. Relationship among Muscle Strength, Muscle Endurance, and Skeletal Muscle Oxygenation Dynamics during Ramp Incremental Cycle Exercise. Sci. Rep. 2024, 14, 11676. [Google Scholar] [CrossRef] [PubMed]
- Vasquez-Bonilla, A.; Yáñez-Sepúlveda, R.; Gómez-Carmona, C.D.; Olcina, G.; Olivares-Arancibia, J.; Rojas-Valverde, D. Calculating Load and Intensity Using Muscle Oxygen Saturation Data. Sports 2024, 12, 113. [Google Scholar] [CrossRef] [PubMed]
- Born, D.-P.; Stöggl, T.; Swarén, M.; Björklund, G. Near-Infrared Spectroscopy: More Accurate Than Heart Rate for Monitoring Intensity in Running in Hilly Terrain. Int. J. Sports Physiol. Perform. 2017, 12, 440–447. [Google Scholar] [CrossRef]
- Crum, E.M.; O’Connor, W.J.; Van Loo, L.; Valckx, M.; Stannard, S.R. Validity and Reliability of the Moxy Oxygen Monitor during Incremental Cycling Exercise. Eur. J. Sport Sci. 2017, 17, 1037–1043. [Google Scholar] [CrossRef]
- Sendra-Pérez, C.; Sanchez-Jimenez, J.L.; Marzano-Felisatti, J.M.; Encarnación-Martínez, A.; Salvador-Palmer, R.; Priego-Quesada, J.I. Reliability of Threshold Determination Using Portable Muscle Oxygenation Monitors during Exercise Testing: A Systematic Review and Meta-Analysis. Sci. Rep. 2023, 13, 12649. [Google Scholar] [CrossRef]
- Austin, K.G.; Daigle, K.A.; Patterson, P.; Cowman, J.; Chelland, S.; Haymes, E.M. Reliability of Near-Infrared Spectroscopy for Determining Muscle Oxygen Saturation during Exercise. Res. Q. Exerc. Sport 2005, 76, 440–449. [Google Scholar] [CrossRef]
- Feldmann, A.; Erlacher, D. Critical Oxygenation: Can Muscle Oxygenation Inform Us about Critical Power? Med. Hypotheses 2021, 150, 110575. [Google Scholar] [CrossRef]
- Vasquez Bonilla, A.A.; Rojas Valverde, D.; Timón Andrada, R.; Olcina Camacho, G.J. Influence of Fat Percentage on Muscle Oxygen Uptake and Metabolic Power during Repeated-Sprint Ability of Footballers. Apunts Med. Esport 2022, 57, 3. [Google Scholar] [CrossRef]
- Volaklis, K.A.; Halle, M.; Meisinger, C. Muscular Strength as a Strong Predictor of Mortality: A Narrative Review. Eur. J. Intern. Med. 2015, 26, 303–310. [Google Scholar] [CrossRef] [PubMed]
- Vasquez-Bonilla, A.A.; Tomas-Carus, P.; Brazo-Sayavera, J.; Malta, J.; Folgado, H.; Olcina, G. Muscle Oxygenation Is Associated with Bilateral Strength Asymmetry during Isokinetic Testing in Sport Teams. Sci. Sports 2023, 38, 426.e1–426.e9. [Google Scholar] [CrossRef]
- Bonnet, V.; Joukov, V.; Kulić, D.; Fraisse, P.; Ramdani, N.; Venture, G. Monitoring of Hip and Knee Joint Angles Using a Single Inertial Measurement Unit During Lower Limb Rehabilitation. IEEE Sens. J. 2016, 16, 1557. [Google Scholar] [CrossRef]
- Leardini, A.; Lullini, G.; Giannini, S.; Berti, L.; Ortolani, M.; Caravaggi, P. Validation of the Angular Measurements of a New Inertial-Measurement-Unit Based Rehabilitation System: Comparison with State-of-the-Art Gait Analysis. J. NeuroEng. Rehabil. 2014, 11, 136. [Google Scholar] [CrossRef]
- Felius, R.A.W.; Geerars, M.; Bruijn, S.M.; van Dieën, J.H.; Wouda, N.C.; Punt, M. Reliability of IMU-Based Gait Assessment in Clinical Stroke Rehabilitation. Sensors 2022, 22, 908. [Google Scholar] [CrossRef]
- Thomas, S.; Jörg, R.; Thomas, S. IMU-Based Joint Angle Measurement for Gait Analysis. Sensors 2014, 14, 6891–6909. [Google Scholar] [CrossRef]
- Alanen, A.-M.; Bruce, O.L.; Benson, L.C.; Chin, M.; van den Berg, C.; Jordan, M.J.; Ferber, R.; Pasanen, K. Capturing in Season Change-of-Direction Movement Pattern Change in Youth Soccer Players with Inertial Measurement Units. Biomechanics 2023, 3, 155–165. [Google Scholar] [CrossRef]
- Chalitsios, C.; Nikodelis, T.; Mougios, V. Mechanical Deviations in Stride Characteristics During Running in the Severe Intensity Domain Are Associated With a Decline in Muscle Oxygenation. Scand. J. Med. Sci. Sports 2024, 34, e14709. [Google Scholar] [CrossRef]
- Praagman, M.; Veeger, H.E.J.; Chadwick, E.K.J.; Colier, W.N.J.M.; van der Helm, F.C.T. Muscle Oxygen Consumption, Determined by NIRS, in Relation to External Force and EMG. J. Biomech. 2003, 36, 905–912. [Google Scholar] [CrossRef]
- Racinais, S.; Buchheit, M.; Girard, O. Breakpoints in Ventilation, Cerebral and Muscle Oxygenation, and Muscle Activity during an Incremental Cycling Exercise. Front. Physiol. 2014, 5, 142. [Google Scholar] [CrossRef]
- Kang, J.; Chaloupka, E.C.; Mastrangelo, M.A.; Biren, G.B.; Robertson, R.J. Physiological Comparisons among Three Maximal Treadmill Exercise Protocols in Trained and Untrained Individuals. Eur. J. Appl. Physiol. 2001, 84, 291–295. [Google Scholar] [CrossRef] [PubMed]
- Costill, D.L. Energetics of Marathon Running. Med. Sci. Sports 1969, 1, 81–86. [Google Scholar] [CrossRef]
- Lacour, J.R.; Padilla-Magunacelaya, S.; Chatard, J.C.; Arsac, L.; Barthélémy, J.C. Assessment of Running Velocity at Maximal Oxygen Uptake. Eur. J. Appl. Physiol. 1991, 62, 77–82. [Google Scholar] [CrossRef]
- Morishita, S.; Tsubaki, A.; Hotta, K.; Kojima, S.; Sato, D.; Shirayama, A.; Ito, Y.; Onishi, H. Relationship Between the Borg Scale Rating of Perceived Exertion and Leg-Muscle Deoxygenation During Incremental Exercise in Healthy Adults. In Oxygen Transport to Tissue XLII; Nemoto, E.M., Harrison, E.M., Pias, S.C., Bragin, D.E., Harrison, D.K., LaManna, J.C., Eds.; Springer International Publishing: Cham, Switzerland, 2021; pp. 95–99. ISBN 978-3-030-48238-1. [Google Scholar]
- Muscat, K.M.; Kotrach, H.G.; Wilkinson-Maitland, C.A.; Schaeffer, M.R.; Mendonca, C.T.; Jensen, D. Physiological and Perceptual Responses to Incremental Exercise Testing in Healthy Men: Effect of Exercise Test Modality. Appl. Physiol. Nutr. Metab. Physiol. Appl. Nutr. Metab. 2015, 40, 1199–1209. [Google Scholar] [CrossRef] [PubMed]
- Montoye, A.H.K.; Vondrasek, J.D.; Hancock, J.B. Validity and Reliability of the VO2 Master Pro for Oxygen Consumption and Ventilation Assessment. Int. J. Exerc. Sci. 2020, 13, 1382–1401. [Google Scholar]
- Bosquet, L.; Léger, L.; Legros, P. Methods to Determine Aerobic Endurance. Sports Med. 2002, 32, 675–700. [Google Scholar] [CrossRef]
- Haugen, T.; Sandbakk, Ø.; Seiler, S.; Tønnessen, E. The Training Characteristics of World-Class Distance Runners: An Integration of Scientific Literature and Results-Proven Practice. Sports Med.-Open 2022, 8, 46. [Google Scholar] [CrossRef]
- Gómez-Carmona, C.D.; Bastida-Castillo, A.; González-Custodio, A.; Olcina, G.; Pino-Ortega, J. Using an Inertial Device (WIMU PRO) to Quantify Neuromuscular Load in Running: Reliability, Convergent Validity, and Influence of Type of Surface and Device Location. J. Strength Cond. Res. 2020, 34, 365. [Google Scholar] [CrossRef] [PubMed]
- Niswander, W.; Wang, W.; Kontson, K. Optimization of IMU Sensor Placement for the Measurement of Lower Limb Joint Kinematics. Sensors 2020, 20, 5993. [Google Scholar] [CrossRef]
- Liang, M.; Zhao, N.; Li, Y. Nine-Axis Sensor for Athlete Physical Training Load Characteristics. Contrast Media Mol. Imaging 2022, 2022, 1538331. [Google Scholar] [CrossRef]
- Rahman, M.M.; Gan, K.B. Range of Motion Measurement Using Single Inertial Measurement Unit Sensor: A Validation and Comparative Study of Sensor Fusion Techniques. In Proceedings of the 2022 IEEE 20th Student Conference on Research and Development (SCOReD), Bandar Baru Bangi, Malaysia, 8–9 November 2022; pp. 114–118. [Google Scholar]
- Rahman, M.M.; Gan, K.B.; Aziz, N.A.A.; Huong, A.; You, H.W. Upper Limb Joint Angle Estimation Using Wearable IMUs and Personalized Calibration Algorithm. Mathematics 2023, 11, 970. [Google Scholar] [CrossRef]
- Feldmann, A.M.; Erlacher, D.; Schmitz, R. NIRS on a Functional Scale of 0–100%: Establishing Practicality of the Moxy Monitor for Sport Science. In Proceedings of the European College of Sport Science, 24th Annual Congress of the European College of Sports Science, Prague, Czech Republic, 3–6 July 2019. [Google Scholar]
- Koo, T.K.; Li, M.Y. A Guideline of Selecting and Reporting Intraclass Correlation Coefficients for Reliability Research. J. Chiropr. Med. 2016, 15, 155–163. [Google Scholar] [CrossRef] [PubMed]
- Hopkins, W.G.; Schabort, E.J.; Hawley, J.A. Reliability of Power in Physical Performance Tests. Sports Med. 2001, 31, 211–234. [Google Scholar] [CrossRef]
- Liow, D.K.; Hopkins, W.G. Velocity Specificity of Weight Training for Kayak Sprint Performance. Med. Sci. Sports Exerc. 2003, 35, 1232–1237. [Google Scholar] [CrossRef]
- Hopkins, W.G.; Marshall, S.W.; Batterham, A.M.; Hanin, J. Progressive Statistics for Studies in Sports Medicine and Exercise Science. Med. Sci. Sports Exerc. 2009, 41, 3–12. [Google Scholar] [CrossRef]
- Bartlett, J.E.; Charles, S.J. Power to the People: A Beginner’s Tutorial to Power Analysis Using Jamovi. Meta-Psychol. 2022, 6. [Google Scholar] [CrossRef]
- Feldmann, A.; Ammann, L.; Gächter, F.; Zibung, M.; Erlacher, D. Muscle Oxygen Saturation Breakpoints Reflect Ventilatory Thresholds in Both Cycling and Running. J. Hum. Kinet. 2022, 83, 87–97. [Google Scholar] [CrossRef] [PubMed]
- Yogev, A.; Arnold, J.; Clarke, D.; Guenette, J.A.; Sporer, B.C.; Koehle, M.S. Comparing the Respiratory Compensation Point With Muscle Oxygen Saturation in Locomotor and Non-Locomotor Muscles Using Wearable NIRS Spectroscopy During Whole-Body Exercise. Front. Physiol. 2022, 13, 818733. [Google Scholar] [CrossRef]
- Vasquez-Bonilla, A.A.; Yáñez-Sepúlveda, R.; Tuesta, M.; Martin, E.B.S.; Monsalves-Álvarez, M.; Olivares-Arancibia, J.; Duclos-Bastías, D.; Recabarren-Dueñas, C.; Alacid, F. Acute Fatigue Impairs Heart Rate Variability and Resting Muscle Oxygen Consumption Kinetics. Appl. Sci. Switz. 2024, 14, 9166. [Google Scholar] [CrossRef]
- Hiroyuki, H.; Hamaoka, T.; Sako, T.; Nishio, S.; Kime, R.; Murakami, M.; Katsumura, T. Oxygenation in Vastus Lateralis and Lateral Head of Gastrocnemius during Treadmill Walking and Running in Humans. Eur. J. Appl. Physiol. 2002, 87, 343–349. [Google Scholar] [CrossRef]
- Grassi, B.; Quaresima, V.; Marconi, C.; Ferrari, M.; Cerretelli, P. Blood Lactate Accumulation and Muscle Deoxygenation during Incremental Exercise. J. Appl. Physiol. 1999, 87, 348–355. [Google Scholar] [CrossRef] [PubMed]
- Paquette, M.; Bieuzen, F.; Billaut, F. Sustained Muscle Deoxygenation vs. Sustained High VO2 During High-Intensity Interval Training in Sprint Canoe-Kayak. Front. Sports Act. Living 2019, 1, 6. [Google Scholar] [CrossRef] [PubMed]
- Baudry, S.; Sarrazin, S.; Duchateau, J. Effects of Load Magnitude on Muscular Activity and Tissue Oxygenation during Repeated Elbow Flexions until Failure. Eur. J. Appl. Physiol. 2013, 113, 1895–1904. [Google Scholar] [CrossRef] [PubMed]
- Vedsted, P.; Blangsted, A.K.; Søgaard, K.; Orizio, C.; Sjøgaard, G. Muscle Tissue Oxygenation, Pressure, Electrical, and Mechanical Responses during Dynamic and Static Voluntary Contractions. Eur. J. Appl. Physiol. 2006, 96, 165–177. [Google Scholar] [CrossRef]
- Paquette, M.; Bieuzen, F.; Billaut, F. Muscle Oxygenation Rather Than VO2max as a Strong Predictor of Performance in Sprint Canoe–Kayak. Int. J. Sports Physiol. Perform. 2018, 13, 1299–1307. [Google Scholar] [CrossRef] [PubMed]
- Paquette, M.; Bieuzen, F.; Billaut, F. Effect of a 3-Weeks Training Camp on Muscle Oxygenation, O2 and Performance in Elite Sprint Kayakers. Front. Sports Act. Living 2020, 2, 47. [Google Scholar] [CrossRef]
- Lucero, A.A.; Gifty, A.; Wayne, L.; Beemnet, N.; Credeur, D.P.; James, F.; David, R.; Lee, S. Reliability of Muscle Blood Flow and Oxygen Consumption Response from Exercise Using Near-infrared Spectroscopy. Exp. Physiol. 2017, 103, 90–100. [Google Scholar] [CrossRef]

| LIT | LIT | LIT | MIT | HIT | HIT | SmO2 Difference Between Training Zones | ||
|---|---|---|---|---|---|---|---|---|
| Variables | Resting | 50–59% | 60–69% | 70–79% | 80–89% | 90–99% | 100% | |
| Time (sec) | 0 ± 0 | 77 ± 40 | 141 ± 79 | 204 ± 109 | 299 ± 132 | 367 ± 157 | 447 ± 187 | MIT vs. LIT (80–89% ≠ 50% and 69%). HIT vs. LIT (90–100% ≠ 50–79%) HIT vs. MIT (No difference) |
| V’O2 mL/min | 857 ± 277 | 2119 ± 461 * | 2581 ± 587 | 2958 ± 733 | 3315 ± 728 | 3619 ± 892 | 4089 ± 844 | |
| V’O2 mL/kg/min | 13.9 ± 4.1 | 33.2 ± 4.3 * | 40.3 ± 6.2 | 45.9 ± 6.7 | 51.6 ± 7.6 | 56.2 ± 9.7 | 63.7 ± 9.5 | |
| V’E (L/min) | 31.4 ± 8.6 | 59.7 ± 12.9 * | 66.7 ± 13.7 | 80.1 ± 19.0 | 98.4 ± 22.7 | 108.9 ± 23.9 | 124.6 ± 23.7 | |
| HR (bmp) | 117 ± 20 | 151 ± 19 * | 163 ± 15 | 171 ± 13 | 179 ± 11 | 184 ± 10 | 190 ± 8 | |
| ACC (m/s2) | 2.29 ± 0.77 | 2.58 ± 0.68 | 2.99 ± 0.87 | 3.33 ± 0.64 | 3.47 ± 0.68 | 3.61 ± 0.81 | 4.09 ± 0.79 | |
| Knee Load (U.A) | 255 ± 89 | 314 ± 106 | 334 ± 86 | 340 ± 85 | 371 ± 92 | 419 ± 104 | 447 ± 108 | |
| Angular Velocity (s/°) | 24.2 ± 6.3 | 27.0 ± 5.8 | 30.0 ± 7.4 | 34.2 ± 5.9 | 36.6 ± 5.2 | 40.8 ± 5.6 | 42.3 ± 6.4 | |
| SmO2 (%) | 61.1 ± 14.8 | 48.1 ± 12.5 * | 44.0 ± 14.7 | 31.8 ± 9.1 | 21.5 ± 9.2 | 14.3 ± 10.2 | 13.2 ± 10.9 |
| Variables | SmO2 | Reliability | Sensitivity | |||
|---|---|---|---|---|---|---|
| Test 1 | Test 2 | ICC | CV% | SE | MDC | |
| Resting | 57.9 ± 15.1 | 64.0 ± 11.5 | 0.143 | 21.8 | 3.5 | 9.7 |
| 50% | 48.2 ± 11.7 | 50.1 ± 11.6 | 0.744 | 23.7 | 3.1 | 8.6 |
| 60% | 44.6 ± 14.2 | 46.6 ± 12.5 | 0.527 | 29.2 | 3.5 | 9.7 |
| 70% | 30.6 ± 9.2 | 31.6 ± 8.8 | 0.568 | 28.9 | 2.4 | 6.7 |
| 80% | 18.3 ± 6.9 | 18.8 ± 5.6 | 0.577 | 33.6 | 1.6 | 4.4 |
| 90% | 8.9 ± 5.1 | 9.8 ± 4.3 | 0.594 | 50.2 | 1.2 | 3.3 |
| 100% | 9.1 ± 7.4 | 10.2 ± 7.6 | 0.729 | 77.7 | 2.0 | 5.5 |
| Variables | SmO2 (%) | VO2 [mL/kg/min] | VE [L/min] | HR (bmp) | Acc (m/s2) | Player Load (U.A.) | Angular Velocity (S/°) |
|---|---|---|---|---|---|---|---|
| SmO2 (%) | — | ||||||
| V’O2 [mL/kg/min] | −0.799 * | — | |||||
| V’E [L/min] | −0.800 * | 0.899 * | — | ||||
| HR (bmp) | −0.783 * | 0.814 * | 0.794 * | — | |||
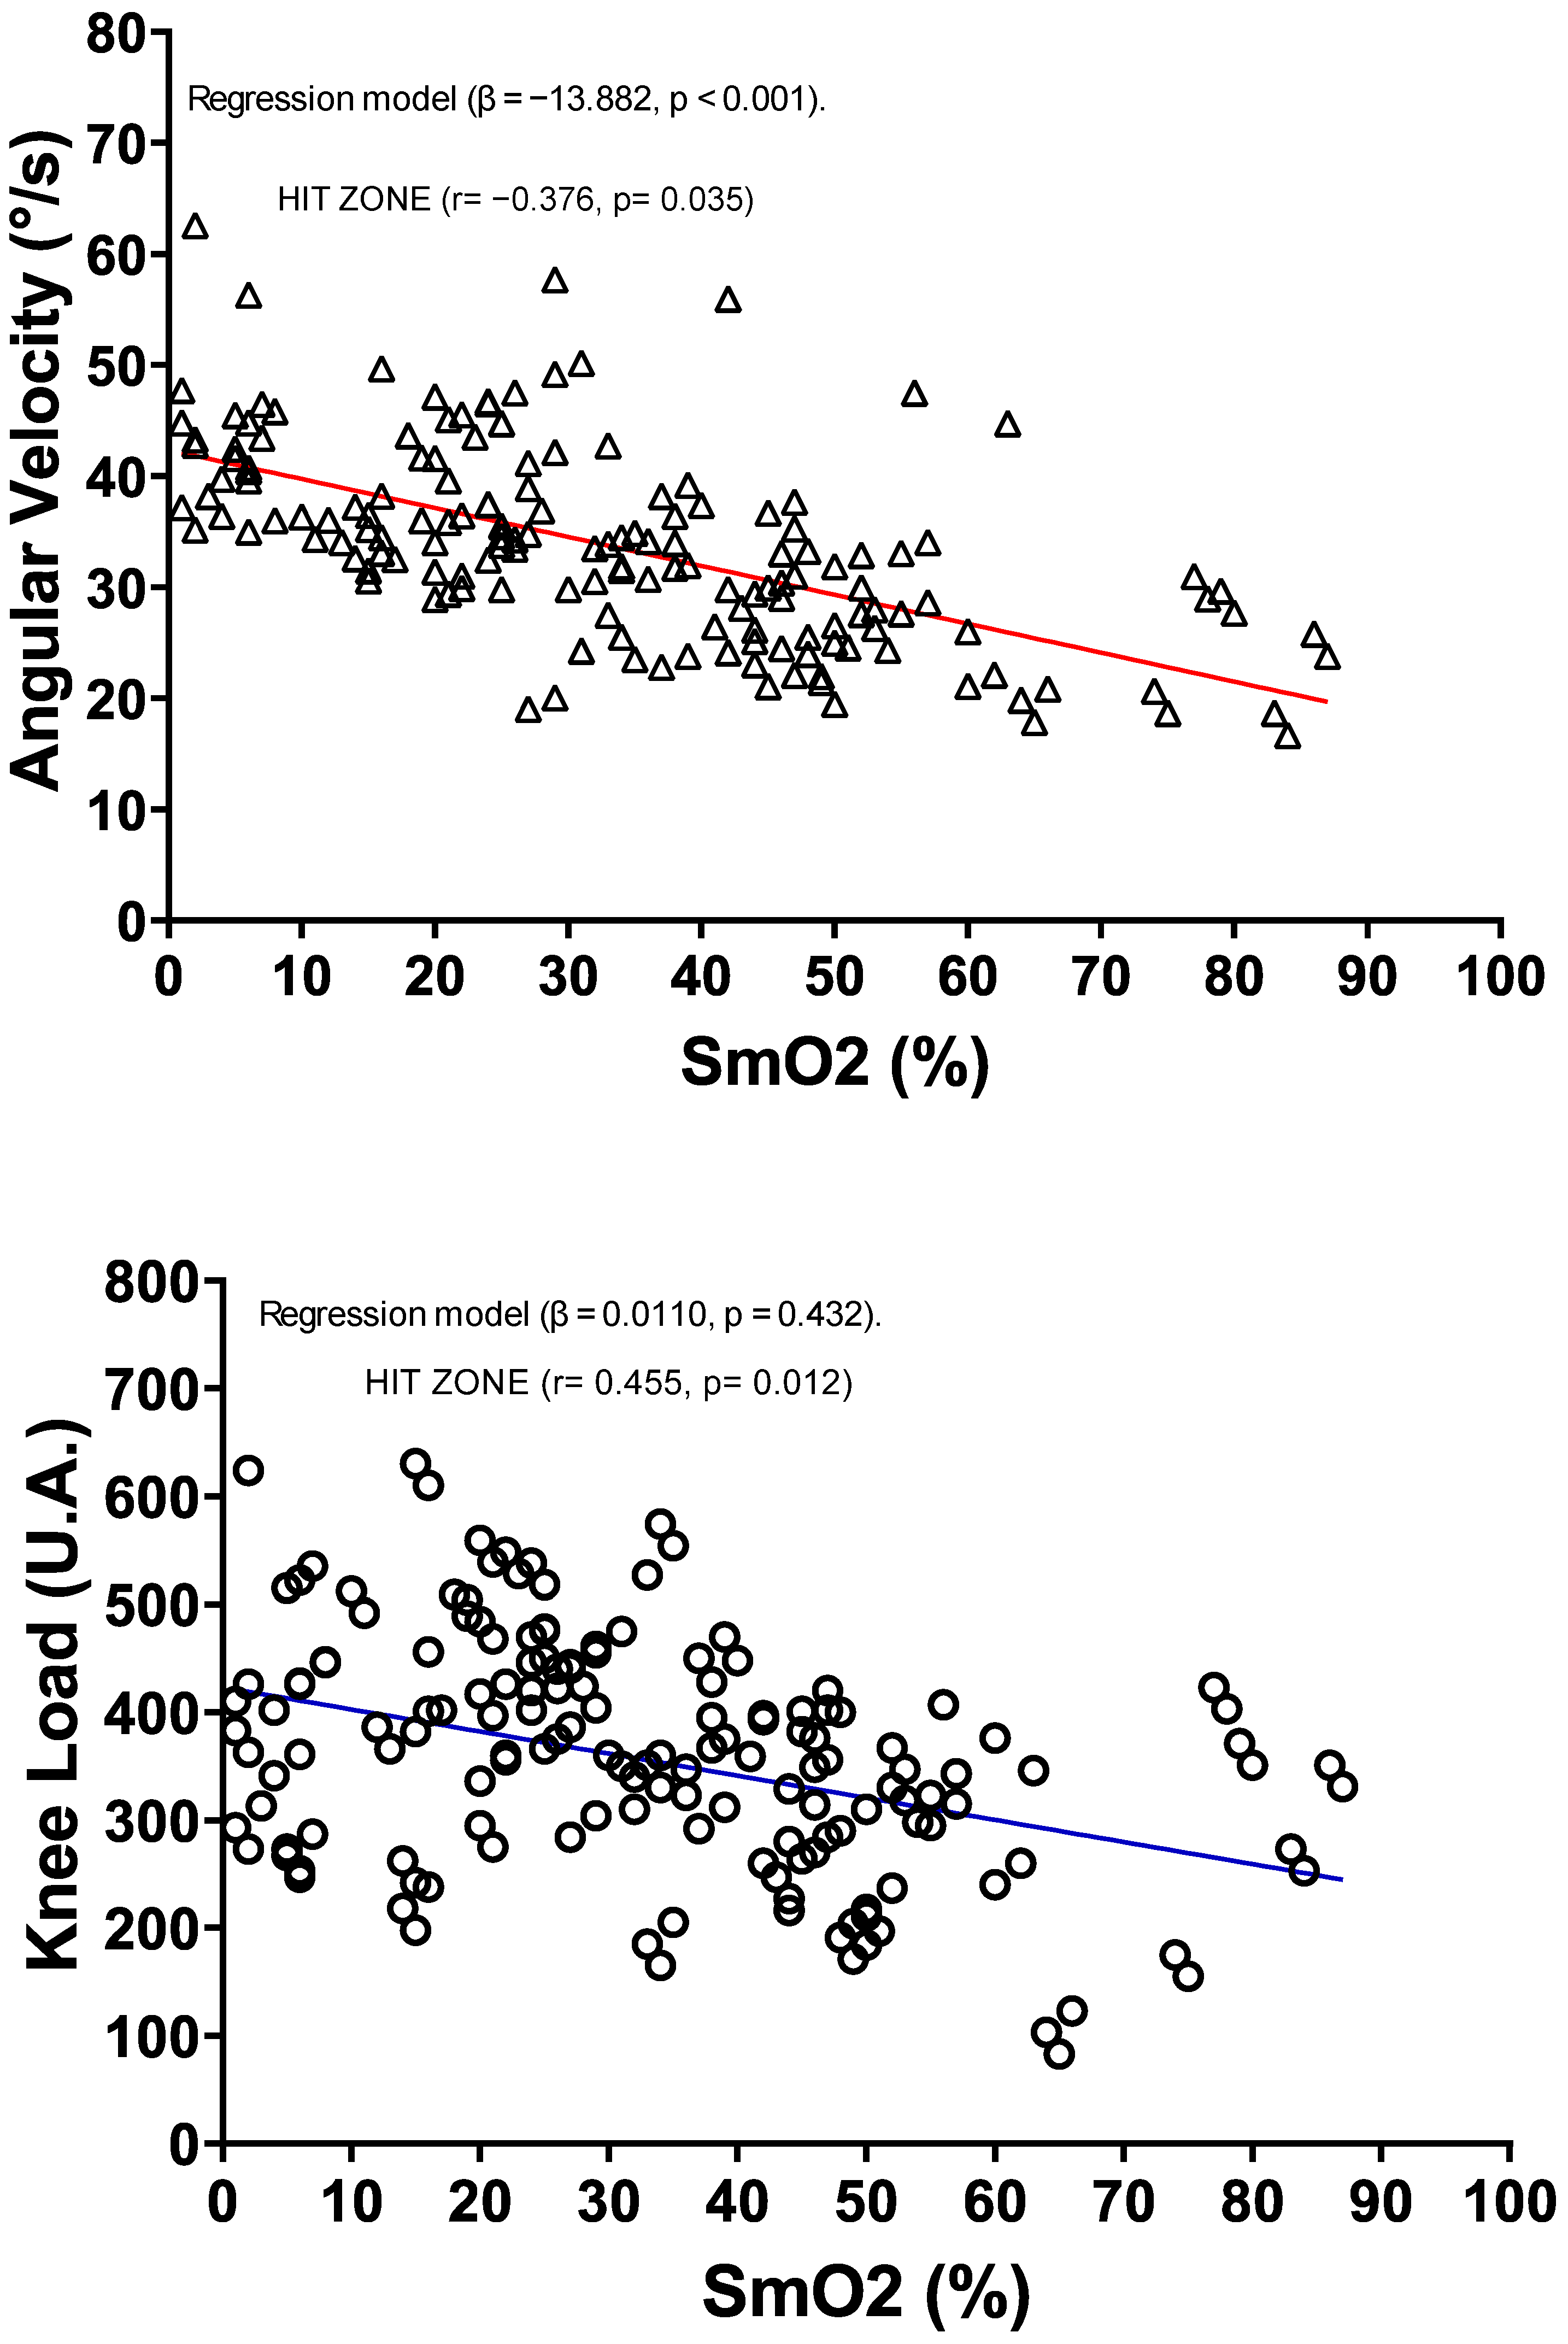
| Acc (m/s2) | −0.455 * | 0.479 * | 0.420 * | 0.269 * | — | ||
| Knee Load (U.A.) | −0.379 * | 0.344 * | 0.345 * | 0.241 * | 0.801 * | — | |
| Angular Velocity (S/°) | −0.617 * | 0.651 * | 0.713 * | 0.467 * | 0.694 * | 0.613 * | — |
| Model Coefficients—Time (seg) | ||||
|---|---|---|---|---|
| Predictor | Estimate (β) | SE | t | p |
| Intercept | 217.3 | 133.8 | 1.62 | 0.107 |
| V’O2 [mL/kg/min] | 10.2 | 1.3 | 7.65 | <0.001 * |
| V’E [L/min] | −0.632 | 0.624 | −1.01 | 0.313 |
| HR (bmp) | −1.1 | 0.669 | −1.65 | 0.100 |
| Acc (m/s2) | −30.7 | 17.2 | −1.79 | 0.076 |
| Knee Load (U.A.) | −0.248 | 0.127 | −1.96 | 0.053 |
| Angular Velocity (S/°) | 2.8 | 1.7 | 1.68 | 0.095 |
| SmO2 (%) | −3.7 | 0.714 | −5.28 | <0.001 * |
Disclaimer/Publisher’s Note: The statements, opinions and data contained in all publications are solely those of the individual author(s) and contributor(s) and not of MDPI and/or the editor(s). MDPI and/or the editor(s) disclaim responsibility for any injury to people or property resulting from any ideas, methods, instructions or products referred to in the content. |
© 2025 by the authors. Licensee MDPI, Basel, Switzerland. This article is an open access article distributed under the terms and conditions of the Creative Commons Attribution (CC BY) license (https://creativecommons.org/licenses/by/4.0/).
Share and Cite
Vasquez-Bonilla, A.A.; Yáñez-Sepúlveda, R.; Monsalves-Álvarez, M.; Tuesta, M.; Duclos-Bastías, D.; Cortés-Roco, G.; Olivares-Arancibia, J.; Guzmán-Muñoz, E.; López-Gil, J.F. Reliability of Muscle Oxygen Saturation for Evaluating Exercise Intensity and Knee Joint Load Indicators. J. Funct. Morphol. Kinesiol. 2025, 10, 136. https://doi.org/10.3390/jfmk10020136
Vasquez-Bonilla AA, Yáñez-Sepúlveda R, Monsalves-Álvarez M, Tuesta M, Duclos-Bastías D, Cortés-Roco G, Olivares-Arancibia J, Guzmán-Muñoz E, López-Gil JF. Reliability of Muscle Oxygen Saturation for Evaluating Exercise Intensity and Knee Joint Load Indicators. Journal of Functional Morphology and Kinesiology. 2025; 10(2):136. https://doi.org/10.3390/jfmk10020136
Chicago/Turabian StyleVasquez-Bonilla, Aldo A., Rodrigo Yáñez-Sepúlveda, Matías Monsalves-Álvarez, Marcelo Tuesta, Daniel Duclos-Bastías, Guillermo Cortés-Roco, Jorge Olivares-Arancibia, Eduardo Guzmán-Muñoz, and José Francisco López-Gil. 2025. "Reliability of Muscle Oxygen Saturation for Evaluating Exercise Intensity and Knee Joint Load Indicators" Journal of Functional Morphology and Kinesiology 10, no. 2: 136. https://doi.org/10.3390/jfmk10020136
APA StyleVasquez-Bonilla, A. A., Yáñez-Sepúlveda, R., Monsalves-Álvarez, M., Tuesta, M., Duclos-Bastías, D., Cortés-Roco, G., Olivares-Arancibia, J., Guzmán-Muñoz, E., & López-Gil, J. F. (2025). Reliability of Muscle Oxygen Saturation for Evaluating Exercise Intensity and Knee Joint Load Indicators. Journal of Functional Morphology and Kinesiology, 10(2), 136. https://doi.org/10.3390/jfmk10020136