1. Introduction
Posture is defined as the position of the human-body segments and their orientation in space [
1]. Postural Control System (PCS) processes the peripheral sensory afferents and modulates the muscle chains in order to keep the projection of the center of body mass between the two feet against the force of gravity, ensuring minimal energy expenditure through functional neuromuscular adaptation and biomechanical strategies [
1,
2]. PCS acts continuously both in static and dynamic phases, guaranteeing balance in the most unstable postural conditions [
3]; however, its precise functioning may be affected by age, cognitive–motor factors and organic pathologies [
4], therefore an accurate postural analysis may be useful during medical diagnostic–therapeutic process. Posture can be evaluated by clinical and instrumental methods: while the former is greatly prone to inter-operator variability, the latter allows the quantification of any postural elements, such as postural stability [
2], morphology and symmetry [
5] of musculoskeletal districts and/or plantar pressures in static and dynamic conditions. The gold standard for the three-dimensional analysis of whole-body posture in standing and during various motor tasks is 3D stereophotogrammetry [
6]. This technology uses an optoelectronic system consisting of cameras sending and receiving infrared rays reflected by skin markers placed on specific body landmarks of the subject to be evaluated; subsequently, a software processes the signals and reconstructs a three-dimensional image of the posture in relation to the marker set used. Traditional stereophotogrammetric models [
7,
8,
9,
10,
11] were used to assess the kinematics of pelvis, hip, knee, ankle, trunk (considered as a single rigid segment that does not provide information on kinematic changes within the spine) and rarely head and upper limbs. A few studies analyzed the multi-segmental-trunk, head, lower- and upper- limbs kinematics in upright standing [
12,
13,
14] by introducing a larger number of skin markers on the body; other ones assessed the trunk in several districts during locomotion or elementary exercises [
15,
16,
17,
18,
19,
20,
21,
22]. In particular, [
15] described spine kinematics considering lower-thoracic, lumbar and pelvic segments during walking; [
16] characterized spine motion by 5-link-segment-model to upright posture, chair raising-sitting, stepping up and down, and level walking, and [
17] investigated the contribution of upper-body movements to dynamic balance control during different and challenging motor tasks. Other studies evaluated the kinematic mechanisms within the spine during walking using the following stereophotogrammetric parameters: Sagittal Vertical Axis (SVA), Pelvic Tilt (PT), and lordosis and kyphosis angles. The latter were assessed in young asymptomatic volunteers [
18], in elderly females [
19], in patients with adult spinal deformities (ASD) compared to controls without treatment [
20] and after spinal surgery [
21], showing changes in sagittal alignment and compensation strategies both before and after surgical correction. However, no study considered whole-body kinematic parameters as we performed in our recent study [
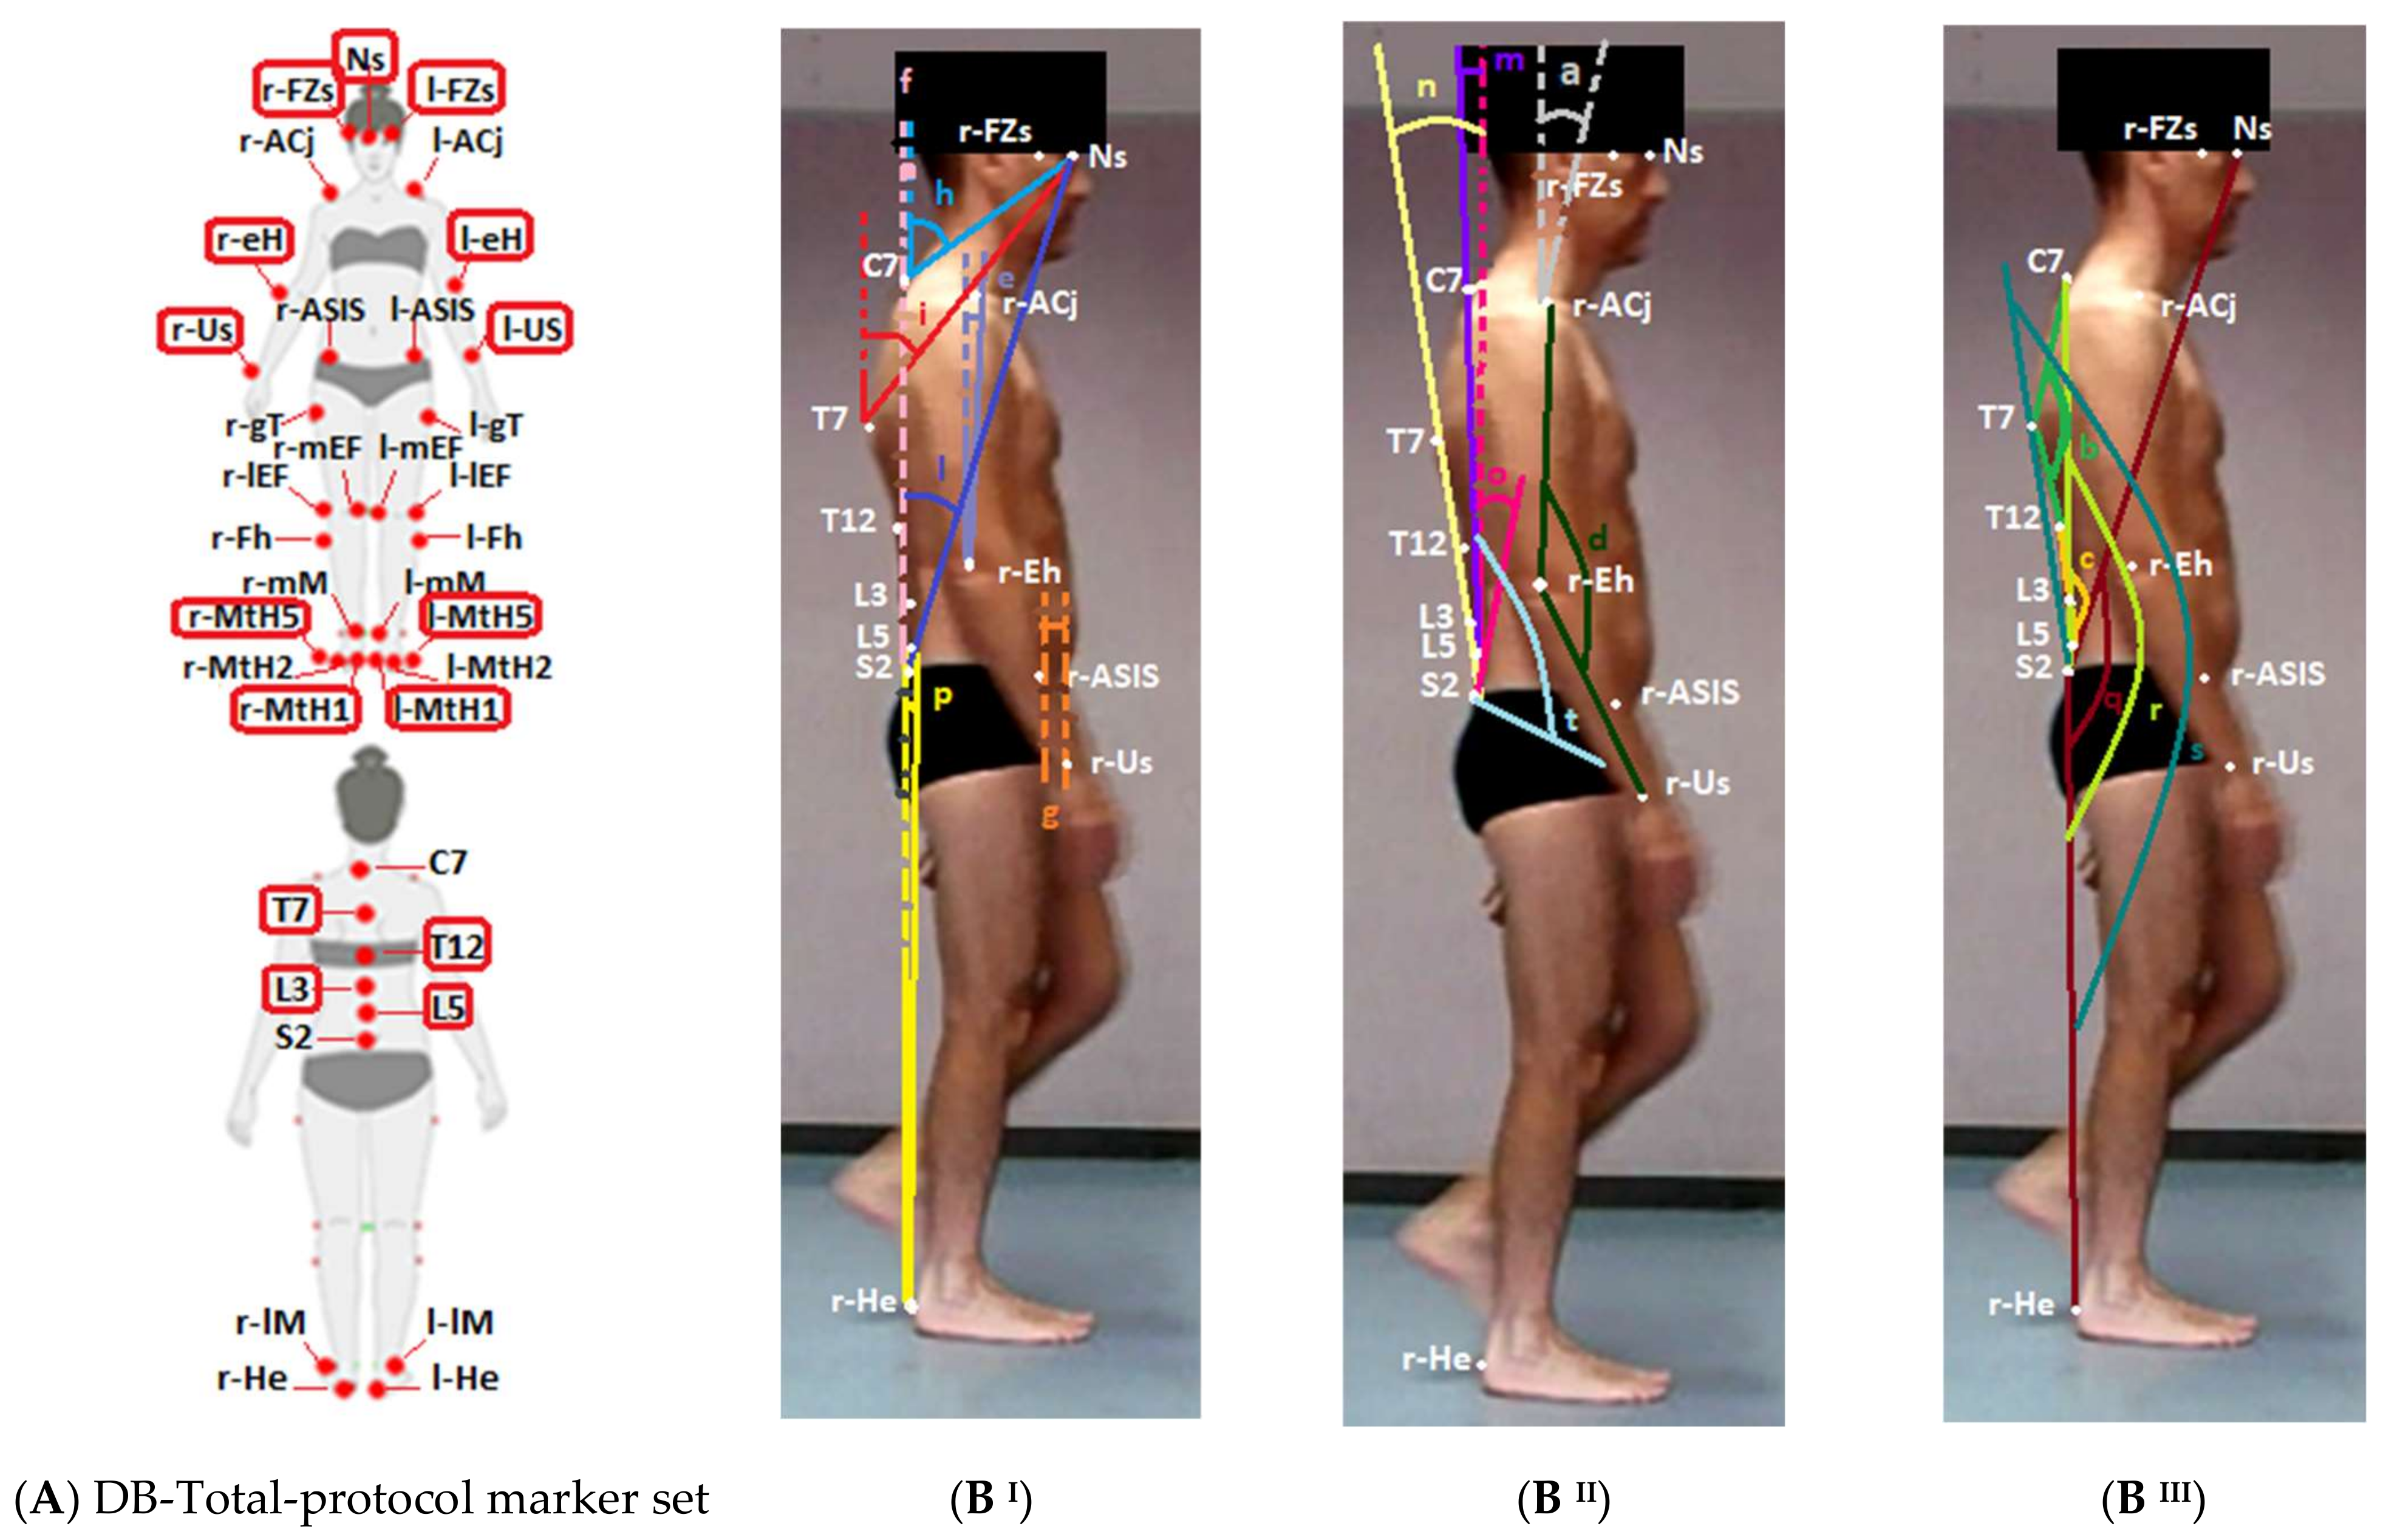
14], introducing a new marker set titled DB-Total protocol, that placed additional skin markers on the head, spine and upper limbs with respect to the Helen Hayes marker set [
11] for better evaluating the sagittal spine and whole-body posture of patients with late-onset Pompe disease compared to healthy controls in upright standing. Moreover, DB-Total protocol showed high reliability for the assessment of the sagittal spine thanks to strong correlations between the stereophotogrammetric and radiographic parameters. Therefore, aim of the present study was to analyze the DB-Total parameters in an adult healthy population during walking in order to define their kinematic curves, additional values (mean of Average, Excursion Range, Absolute Excursion Range), intra- and inter-subject repeatability.
3. Results
The mean, SD and median of the baseline characteristics of healthy participants are shown in
Table 1. The results of the spatial–temporal parameters are reported in
Table 2; they highlighted very small SD and Excursion Range values for all spatial-temporal parameters (low inter-subject variability, CV < 7%) except for the gait speed, the double-support phase and the step width, which showed slightly larger inter-subject variability (CV~8–15%).
Table 2.
Mean and Standard Deviation (with minimum and maximum values of range) and Coefficient of Variation for each spatial–temporal parameter in healthy subjects. Standard Deviation (SD), Coefficient of Variation (CV).
Table 2.
Mean and Standard Deviation (with minimum and maximum values of range) and Coefficient of Variation for each spatial–temporal parameter in healthy subjects. Standard Deviation (SD), Coefficient of Variation (CV).
| Spatial–Temporal Parameters | Mean ± SD (Min, Max) | CV (%) |
|---|
| Cycle Duration (s) | 1.15 ± 0.09 (1.04; 1.34) | 7.8% |
| Cadence (step/min) | 104.8 ± 8.00 (89.55; 113.2) | 7.6% |
| Gait Speed (m/s) | 1.06 ± 0.13 (0.9; 1.3) | 12.2% |
| Stance Phase (%) | 64.36 ± 1.54 (61.41; 66.31) | 2.4% |
| Swing Phase (%) | 35.53 ± 1.64 (33.09; 38.59) | 4.6% |
| Double-Support Phase (%) | 14.26 ± 2.06 (10.6; 17.09) | 14.4% |
| Stride Length (m) | 0.610 ± 0.060 (0.520; 0.740) | 9.8% |
| Step Width (m) | 0.090 ± 0.002 (0.050; 0.110) | 0.2% |
The means and SDs of Average and Excursion Range values, Absolute Excursion Range with Absolute Maximum and Minimum, intra-subject CV and SD Average for each new kinematic parameter are respectively reported in
Table 3.
Table 3.
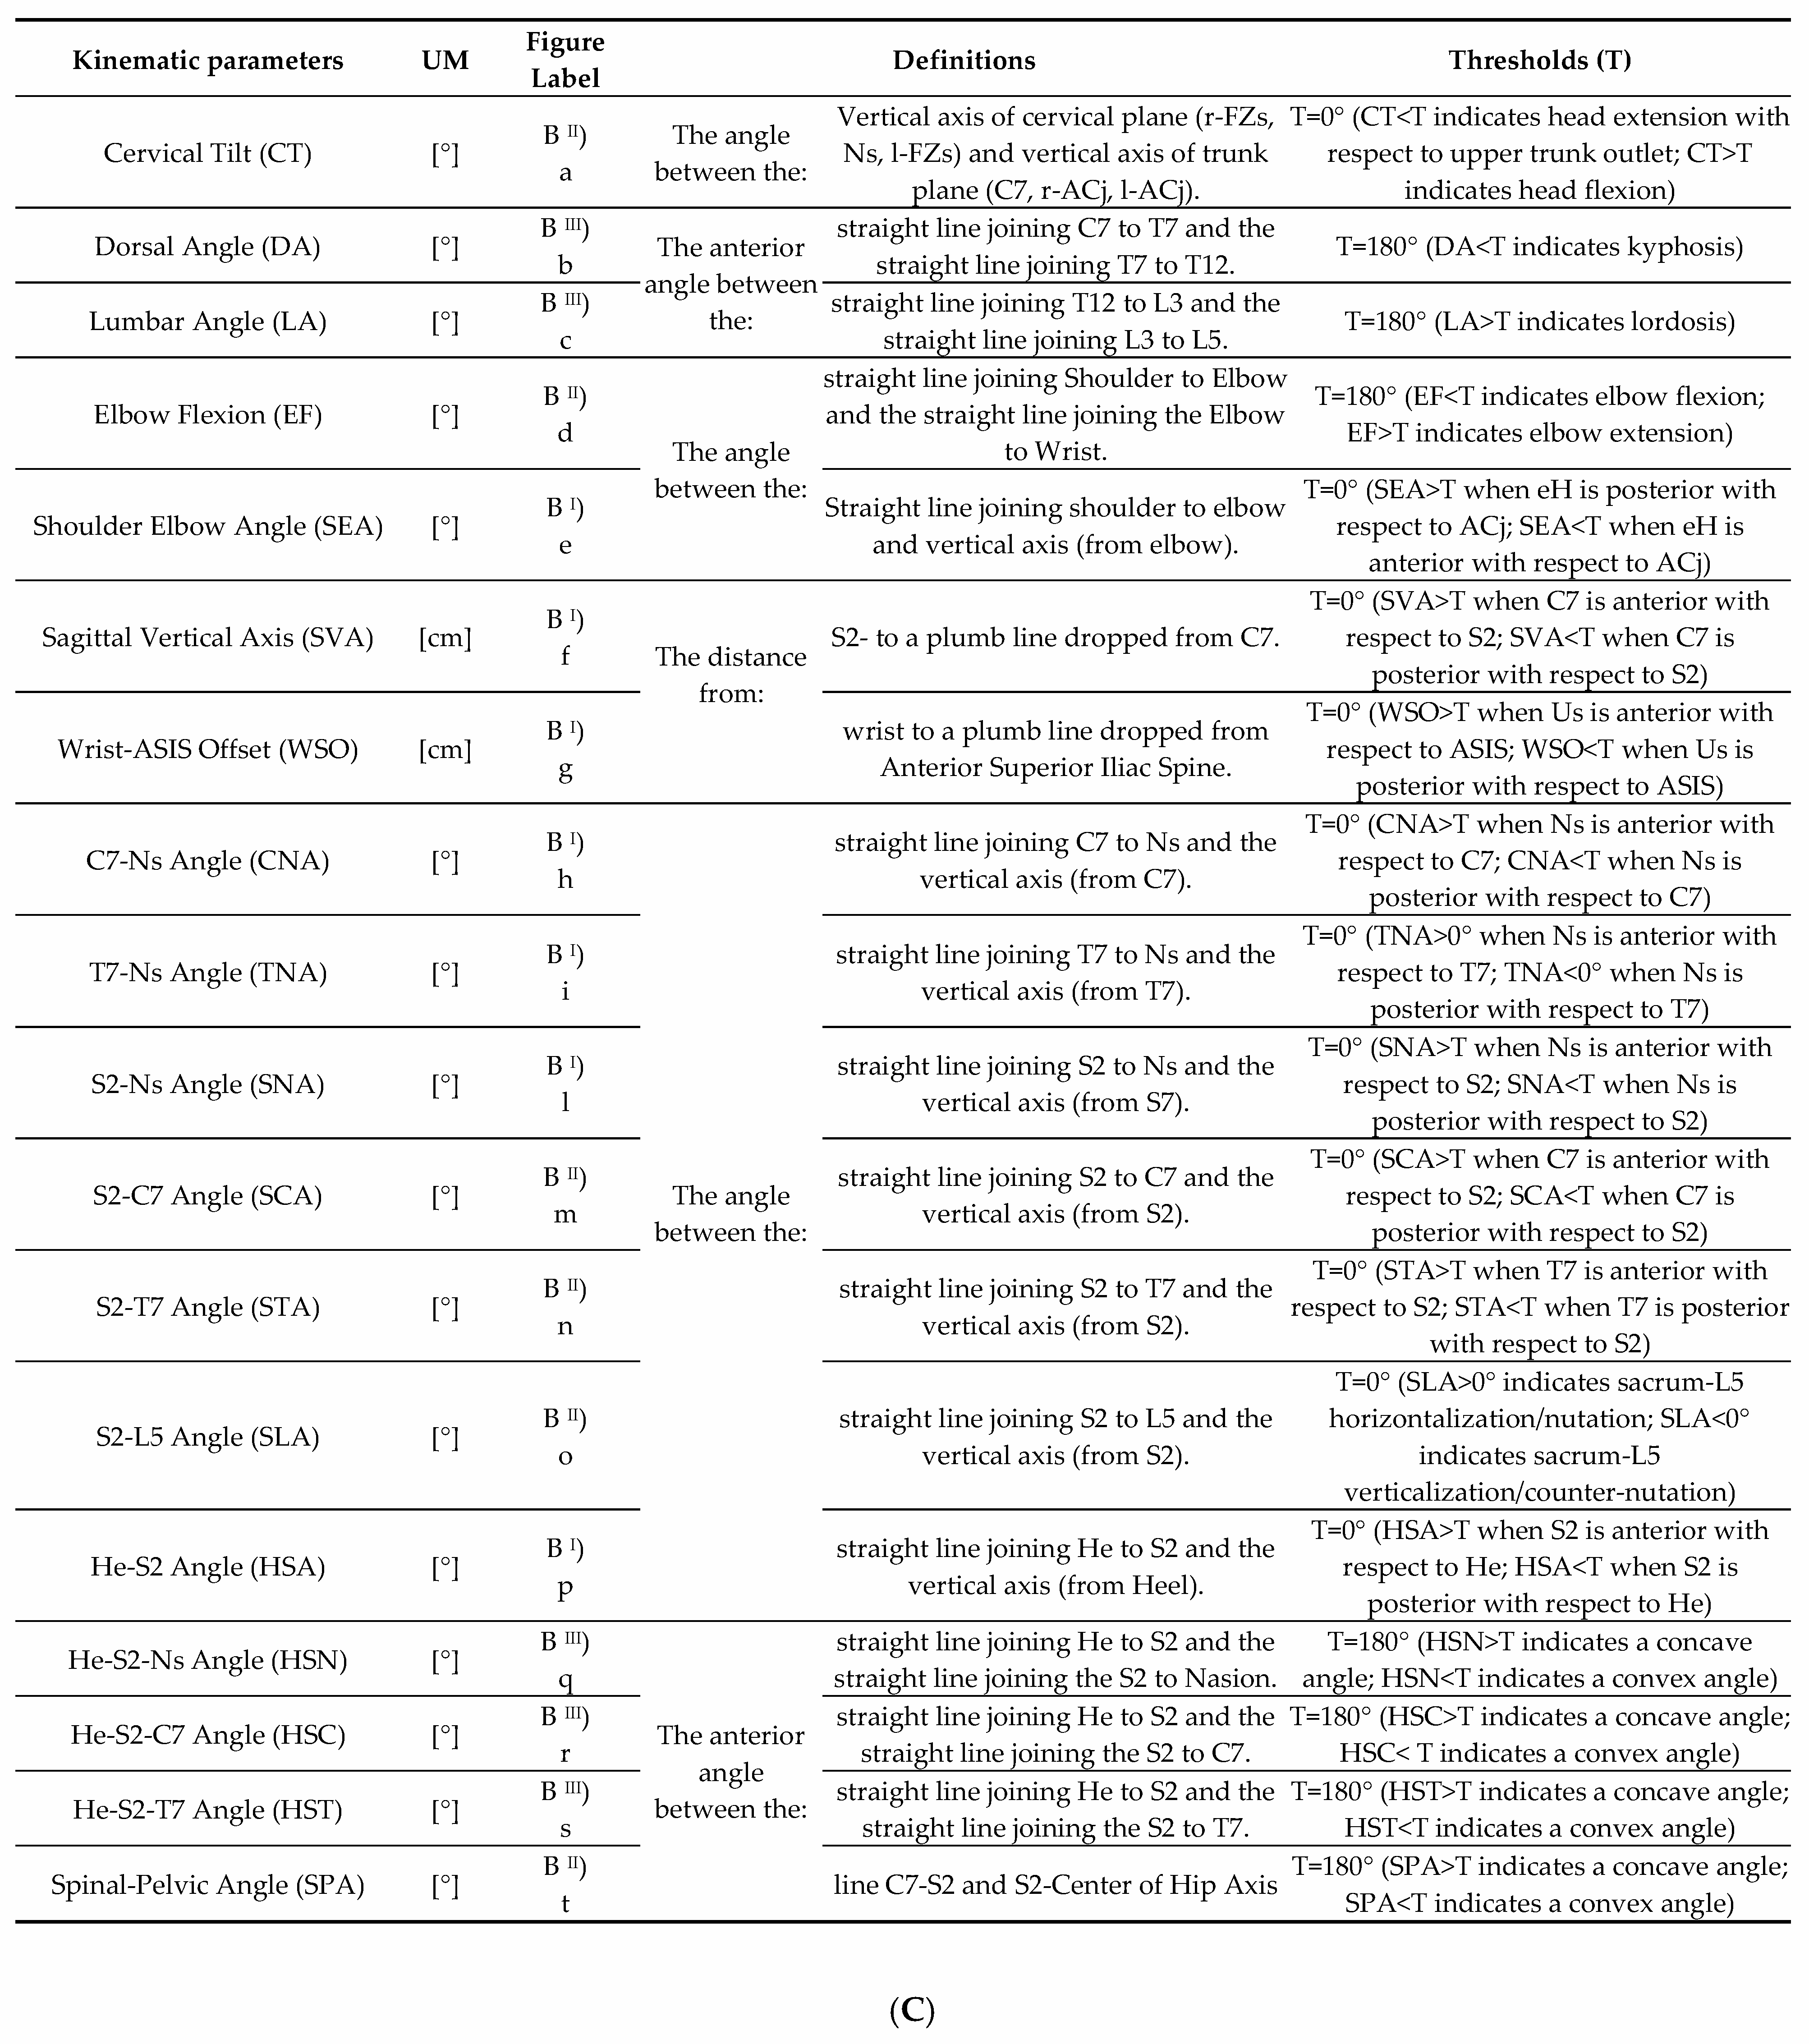
Mean value, Mean Excursion Range, SD Average, Absolute Excursion Range (absolute inter-subject min and max degree of curves for each group), Coefficient of Variation (CV) of intra-subject repeatability and inter-subject repeatability. Dorsal Angle (DA), Lumbar Angle (LA), Elbow Flexion (EF), Shoulder–Elbow Angle (SEA), Sagittal Vertical Axis (SVA), Wrist–ASIS Offset (WSO), C7–Nasion Angle (CNA), T7–Nasion Angle (TNA), S2–Nasion Angle (SNA), S2–C7 Angle (SCA), S2–T7 Angle (STA), S2–L5 Angle (SLA), He–S2 Angle (HSA), He–S2–Ns Angle (HSN), He–S2–C7 Angle (HSC), He–S2–T7 Angle (HST), Spinal–Pelvic Angle (SPA). Maximum (Max), Minimum (Min), Standard Deviation (SD), Coefficient of Variation (CV). The parameters with CV < 50% (high intra-subject repeatability) and with SD Average ≤ 1 (high inter-subject repeatability) are highlighted in bold.
Table 3.
Mean value, Mean Excursion Range, SD Average, Absolute Excursion Range (absolute inter-subject min and max degree of curves for each group), Coefficient of Variation (CV) of intra-subject repeatability and inter-subject repeatability. Dorsal Angle (DA), Lumbar Angle (LA), Elbow Flexion (EF), Shoulder–Elbow Angle (SEA), Sagittal Vertical Axis (SVA), Wrist–ASIS Offset (WSO), C7–Nasion Angle (CNA), T7–Nasion Angle (TNA), S2–Nasion Angle (SNA), S2–C7 Angle (SCA), S2–T7 Angle (STA), S2–L5 Angle (SLA), He–S2 Angle (HSA), He–S2–Ns Angle (HSN), He–S2–C7 Angle (HSC), He–S2–T7 Angle (HST), Spinal–Pelvic Angle (SPA). Maximum (Max), Minimum (Min), Standard Deviation (SD), Coefficient of Variation (CV). The parameters with CV < 50% (high intra-subject repeatability) and with SD Average ≤ 1 (high inter-subject repeatability) are highlighted in bold.
New Kinematic
DB-Total Parameters | Average
Mean ± SD | Excursion Range
Mean ± SD | Absolute Excursion Range
(Absolute Max; Min) | CV (%)
Intra-Subject Repeatability | SD Average
Inter-Subject
Repeatability |
|---|
| HSA (Deg) | −0.17 ± 1.50 | 38.8 ± 7.1 | 48.5 (23.9; −24.6) | 40.9% | 0.8 |
| HST (Deg) | 183.61 ±1.87 | 41.5 ± 7.9 | 52.5 (209.4; 156.9) | 34.1% | 1.0 |
| HSC (Deg) | 173.01 ± 1.70 | 35.6 ± 13.2 | 53.0 (200.0; 147.0) | 28.5% | 0.9 |
| HSN (Deg) | 155.66 ± 2.20 | 36.8 ± 13.9 | 52.1 (184.2; 132.1) | 48.7% | 1.3 |
| SNA(Deg) | 24.19 ± 2.52 | 2.8 ± 0.7 | 13.1 (31.1; 18) | 54.5% | 1.4 |
| TNA (Deg) | 42.65 ±2.44 | 3.6 ± 1.3 | 13 (49.6; 36.6) | 75.8% | 1.9 |
| CNA (Deg) | 61.37 ± 5.96 | 4.1 ± 1.8 | 20 (71.4; 50.4) | 62.2% | 3.1 |
| CT (Deg) | −47.05 ± 15.47 | 5.1 ± 2.2 | 49.6 (−24.9; −74.5) | 59.7% | 3.6 |
| SLA (Deg) | 14.08 ± 5.96 | 4.2 ± 1.6 | 25.3 (26.9; 1.6) | 36.7% | 1.3 |
| STA (Deg) | −3.78 ± 2.37 | 2.7 ± 0.8 | 12.3 (3.7; −8.6) | 30.5% | 1.0 |
| SCA (Deg) | 6.82 ± 1.84 | 2.5 ± 0.7 | 9.6 (11.8; 2.2) | 35.9% | 1.0 |
| SVA (cm) | 5.6 ± 1.4 | 2.7 ± 1.3 | 8.0 (10.0; 2.0) | 39.9% | 0.9 |
| SPA (Deg) | 127.99 ± 5.65 | 3.5 ± 1.5 | 18.8 (136.2; 117.4) | 52.3% | 1.8 |
| LA (Deg) | 196.72 ± 7.02 | 5.2 ± 2.7 | 33.7 (220.6; 186.9) | 31.5% | 1.1 |
| DA (Deg) | 149.45 ± 5.38 | 1.7 ± 0.5 | 18.4 (157.5; 139.1) | 30.5% | 0.7 |
| WSO (cm) | −2.1 ± 3.7 | 34.5 ± 17.6 | 50 (19.0; −32.0) | 36.9% | 2.3 |
| SEA (Deg) | 7.33 ± 2.99 | 25.9 ± 8.5 | 39.5 (29.2; −10.3) | 22.6% | 2.1 |
| EF (Deg) | 146.80 ± 6.22 | 21.3 ± 7.8 | 35.3 (167.2; 131.9) | 32.6% | 1.8 |
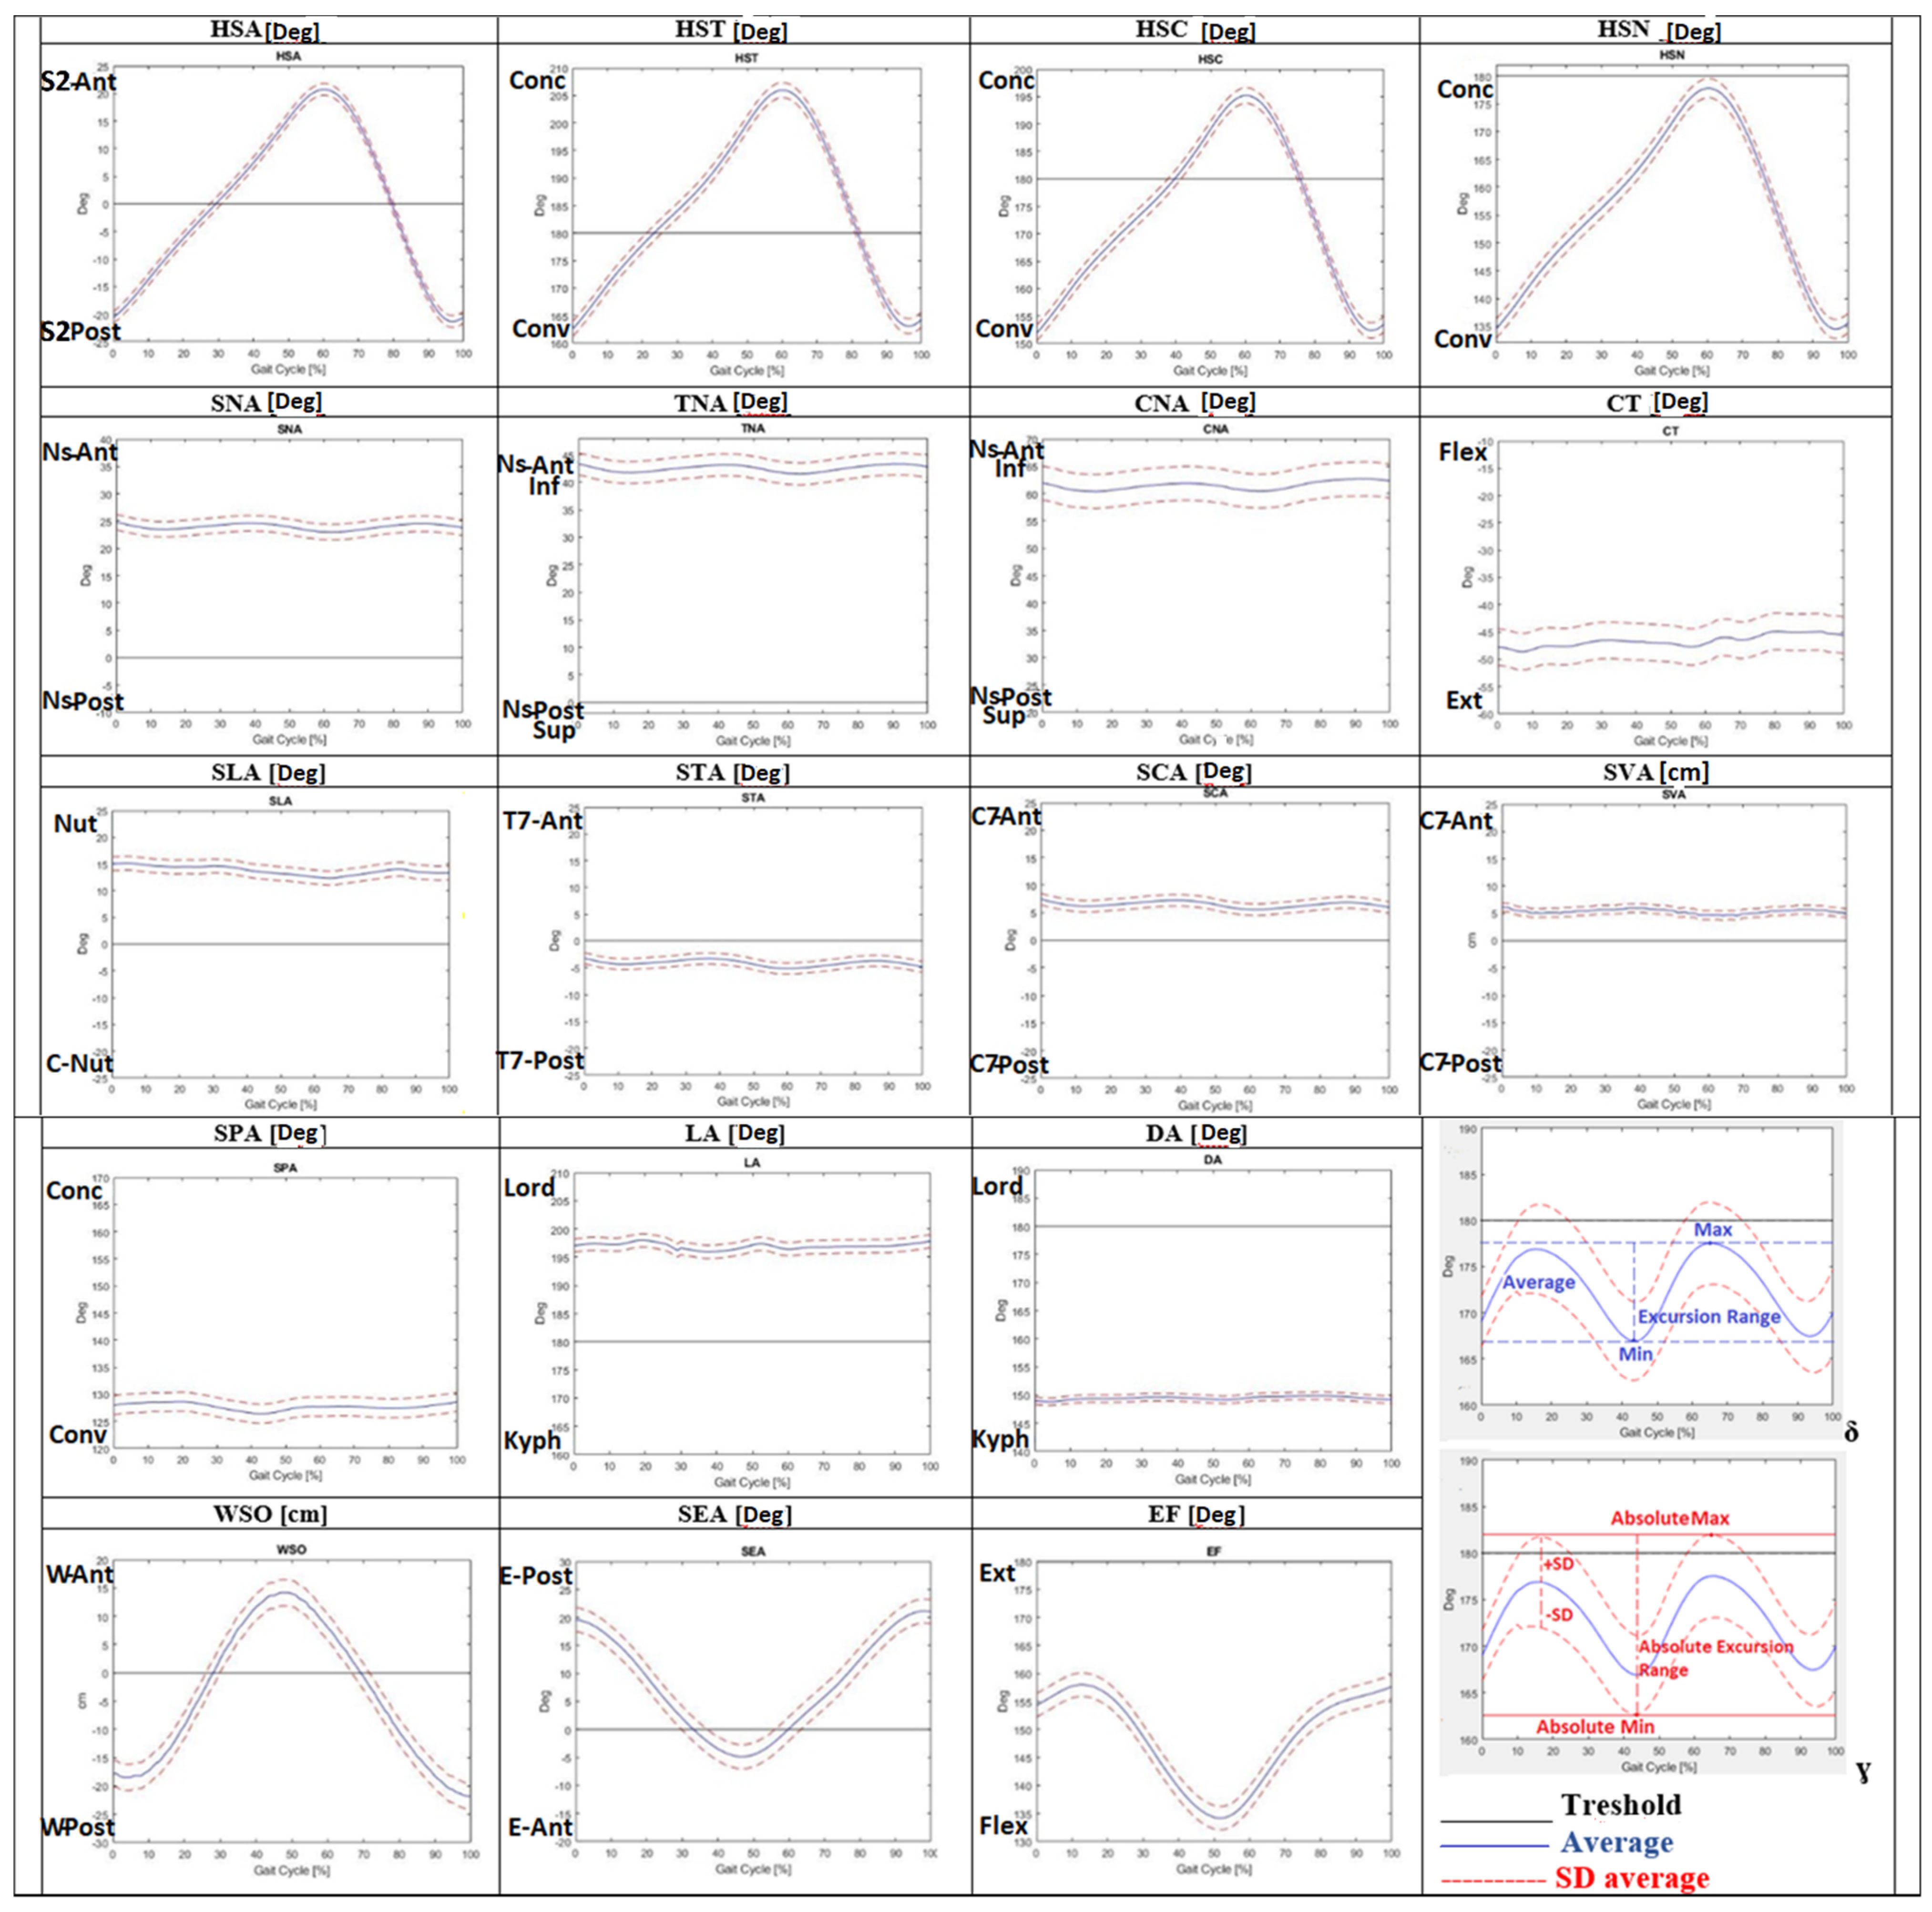
Moreover, the Average of each DB-Total parameter is represented as a kinematic curve in
Figure 2. Low intra-subject variability (CV < 50% = high repeatability) of the new kinematic parameters was found for most parameters (HSA, SCA, STA, SLA, DA, LA, SVA, HSN, HSC, HST, SEA, EF and WSO), while higher intra-subject variability (CV > 50% = lower repeatability) was detected for the other ones (SPA, CNA, TNA, SNA and CT, as shown in
Table 3). Low inter-subject variability (SD Average ≤ 1 = high repeatability) was reported for many DB-Total parameters (HSA, SCA, STA, DA, SVA, HSC and HST), while slightly larger variability (1 < SD Average < 2) was found for TNA, SNA, SPA, SLA, LA, HSN and EF; the highest inter-subject variability (>2) was shown for CNA, CT, SEA and WSO, as shown numerically in
Table 3 and graphically in
Figure 2 (observing the width of the SD between kinematic curves).
Figure 2.
Average of kinematic curves during the gait cycle for eighteen new sagittal DB-Total [
14] parameters. Graphs δ and ɣ explain the new kinematic DB-Total values: Average, Excursion Range, Absolute Excursion Range, Minimum (Min), Maximum (Max), Standard Deviation (SD), and Absolute Minimum (Min) and Maximum (Max). The scale range of the graph was set to 50 (degrees or cm) in order to highlight different inter-subject variability. Dorsal Angle (DA), Lumbar Angle (LA), Elbow Flexion (EF), Shoulder–Elbow Angle (SEA), Sagittal Vertical Axis (SVA), Wrist–ASIS Offset (WSO), C7–Nasion Angle (CNA), T7–Nasion Angle (TNA), S2–Nasion Angle (SNA), S2–C7 Angle (SCA), S2–T7 Angle (STA), S2–L5 Angle (SLA), He–S2 Angle (HAS), He–S2–Ns Angle (HSN), He–S2–C7 Angle (HSC), He–S2–T7 Angle (HST), Spinal–Pelvic Angle (SPA), nasion (Ns), wrist (W), elbow (E), posterior (Post), anterior (Ant), dorsiflexion (Dors), plantiflexion (Plant), flexion (Flex), extension (Ext), adduction (Add), abduction (Abd), kyphosis (Kyph), lordosis (Lord), nutation (Nut), counter nutation (CNut), concavity (Conc), convexity (Conv).
![Jfmk 07 00057 g002]()
4. Discussion
The present study aimed to characterize the sagittal spinal and whole-body posture of healthy subjects during walking. The use of the DB-Total protocol [
14] allowed us to measure additional whole-body kinematic parameters during walking with respect to traditional stereophotogrammetric protocols [
7,
8,
9,
10,
11], which usually consider the trunk as a single rigid segment, without information on the kinematic changes within the spine about the head and the upper limbs. A few studies evaluated multi-segmental trunk and whole-body angles considering a standing posture [
12,
13,
14] or during walking [
15,
16,
17,
18,
19,
20,
21]. Our study analyzed the DB-Total parameters (characterizing sagittal spinal and whole-body kinematics and their intra-subject and inter-subject repeatability) and calculated new additional values (Excursion Range, Absolute Excursion Range, Average and SD Average).
The results of the spatial–temporal parameters (
Table 2) highlighted very small SD and low inter-subject variability (CV < 7%) except for the gait speed, the double-support phase and the step width (CV~8–15%), underlining the high repeatability of all s–t parameters and the slightly larger variability of the latter; these findings indicated a good homogeneity of walking across all healthy subjects, which makes the statistical analysis of kinematic parameters more reliable.
Regarding the new DB-Total parameters, the low intra-subject variability (CV < 50%) of most of them (HSA, HSN, HSC, HST, STA, SCA, SVA, SLA, DA, LA, SEA, EF and WSO) showed high intra-subject repeatability of their kinematic curve during the gait cycle. Instead, the higher intra-subject variability (CV > 50%) of SPA, CNA, TNA, SNA and CT revealed low repeatability, highlighting a less consistent pattern for the parameters related to the cervical spine–head, probably for the greater mobility of this body district (
Table 3). Low inter-subject variability (SD Average < 1) was reported for HSA, HSC, HST, SCA, SVA, STA and DA and slightly larger (<2) for HSN, TNA, SNA, SPA, SLA, LA and EF, while higher inter-subject variability (>2) for CNA, CT, SEA and WSO was found, revealing the high inter-subject repeatability of the former parameters related to more fixed body regions (pelvis–dorsal spine) with respect to more mobile ones (cervical spine–head–upper limbs) (
Table 3,
Figure 2). Another biomechanical explanation may relate to the need of maintaining the heaviest and most rigid body districts (pelvis and rib cage) inside the support area between the two feet; therefore, the heel–sacrum–T7/C7 segments should be aligned, while more mobile ones (lower limbs, lumbar and cervical spine) can adapt to movement. These results are in agreement with those in [
18], which presented great variability in the cervicothoracic junction (SD = 13.7°) of healthy adolescents and young adults, confirming a larger mobility of this anatomical region with respect to the others. Moreover, high intra-subject but low inter-subject repeatability was found for SEA, EF and WSO (
Table 3,
Figure 2), revealing an intra-subject homogeneous kinematic pattern of the upper limbs that varied across the subjects because of different postural attitudes. Therefore, these parameters should be used with caution in any comparison with larger healthy or pathological populations to identify abnormalities during walking.
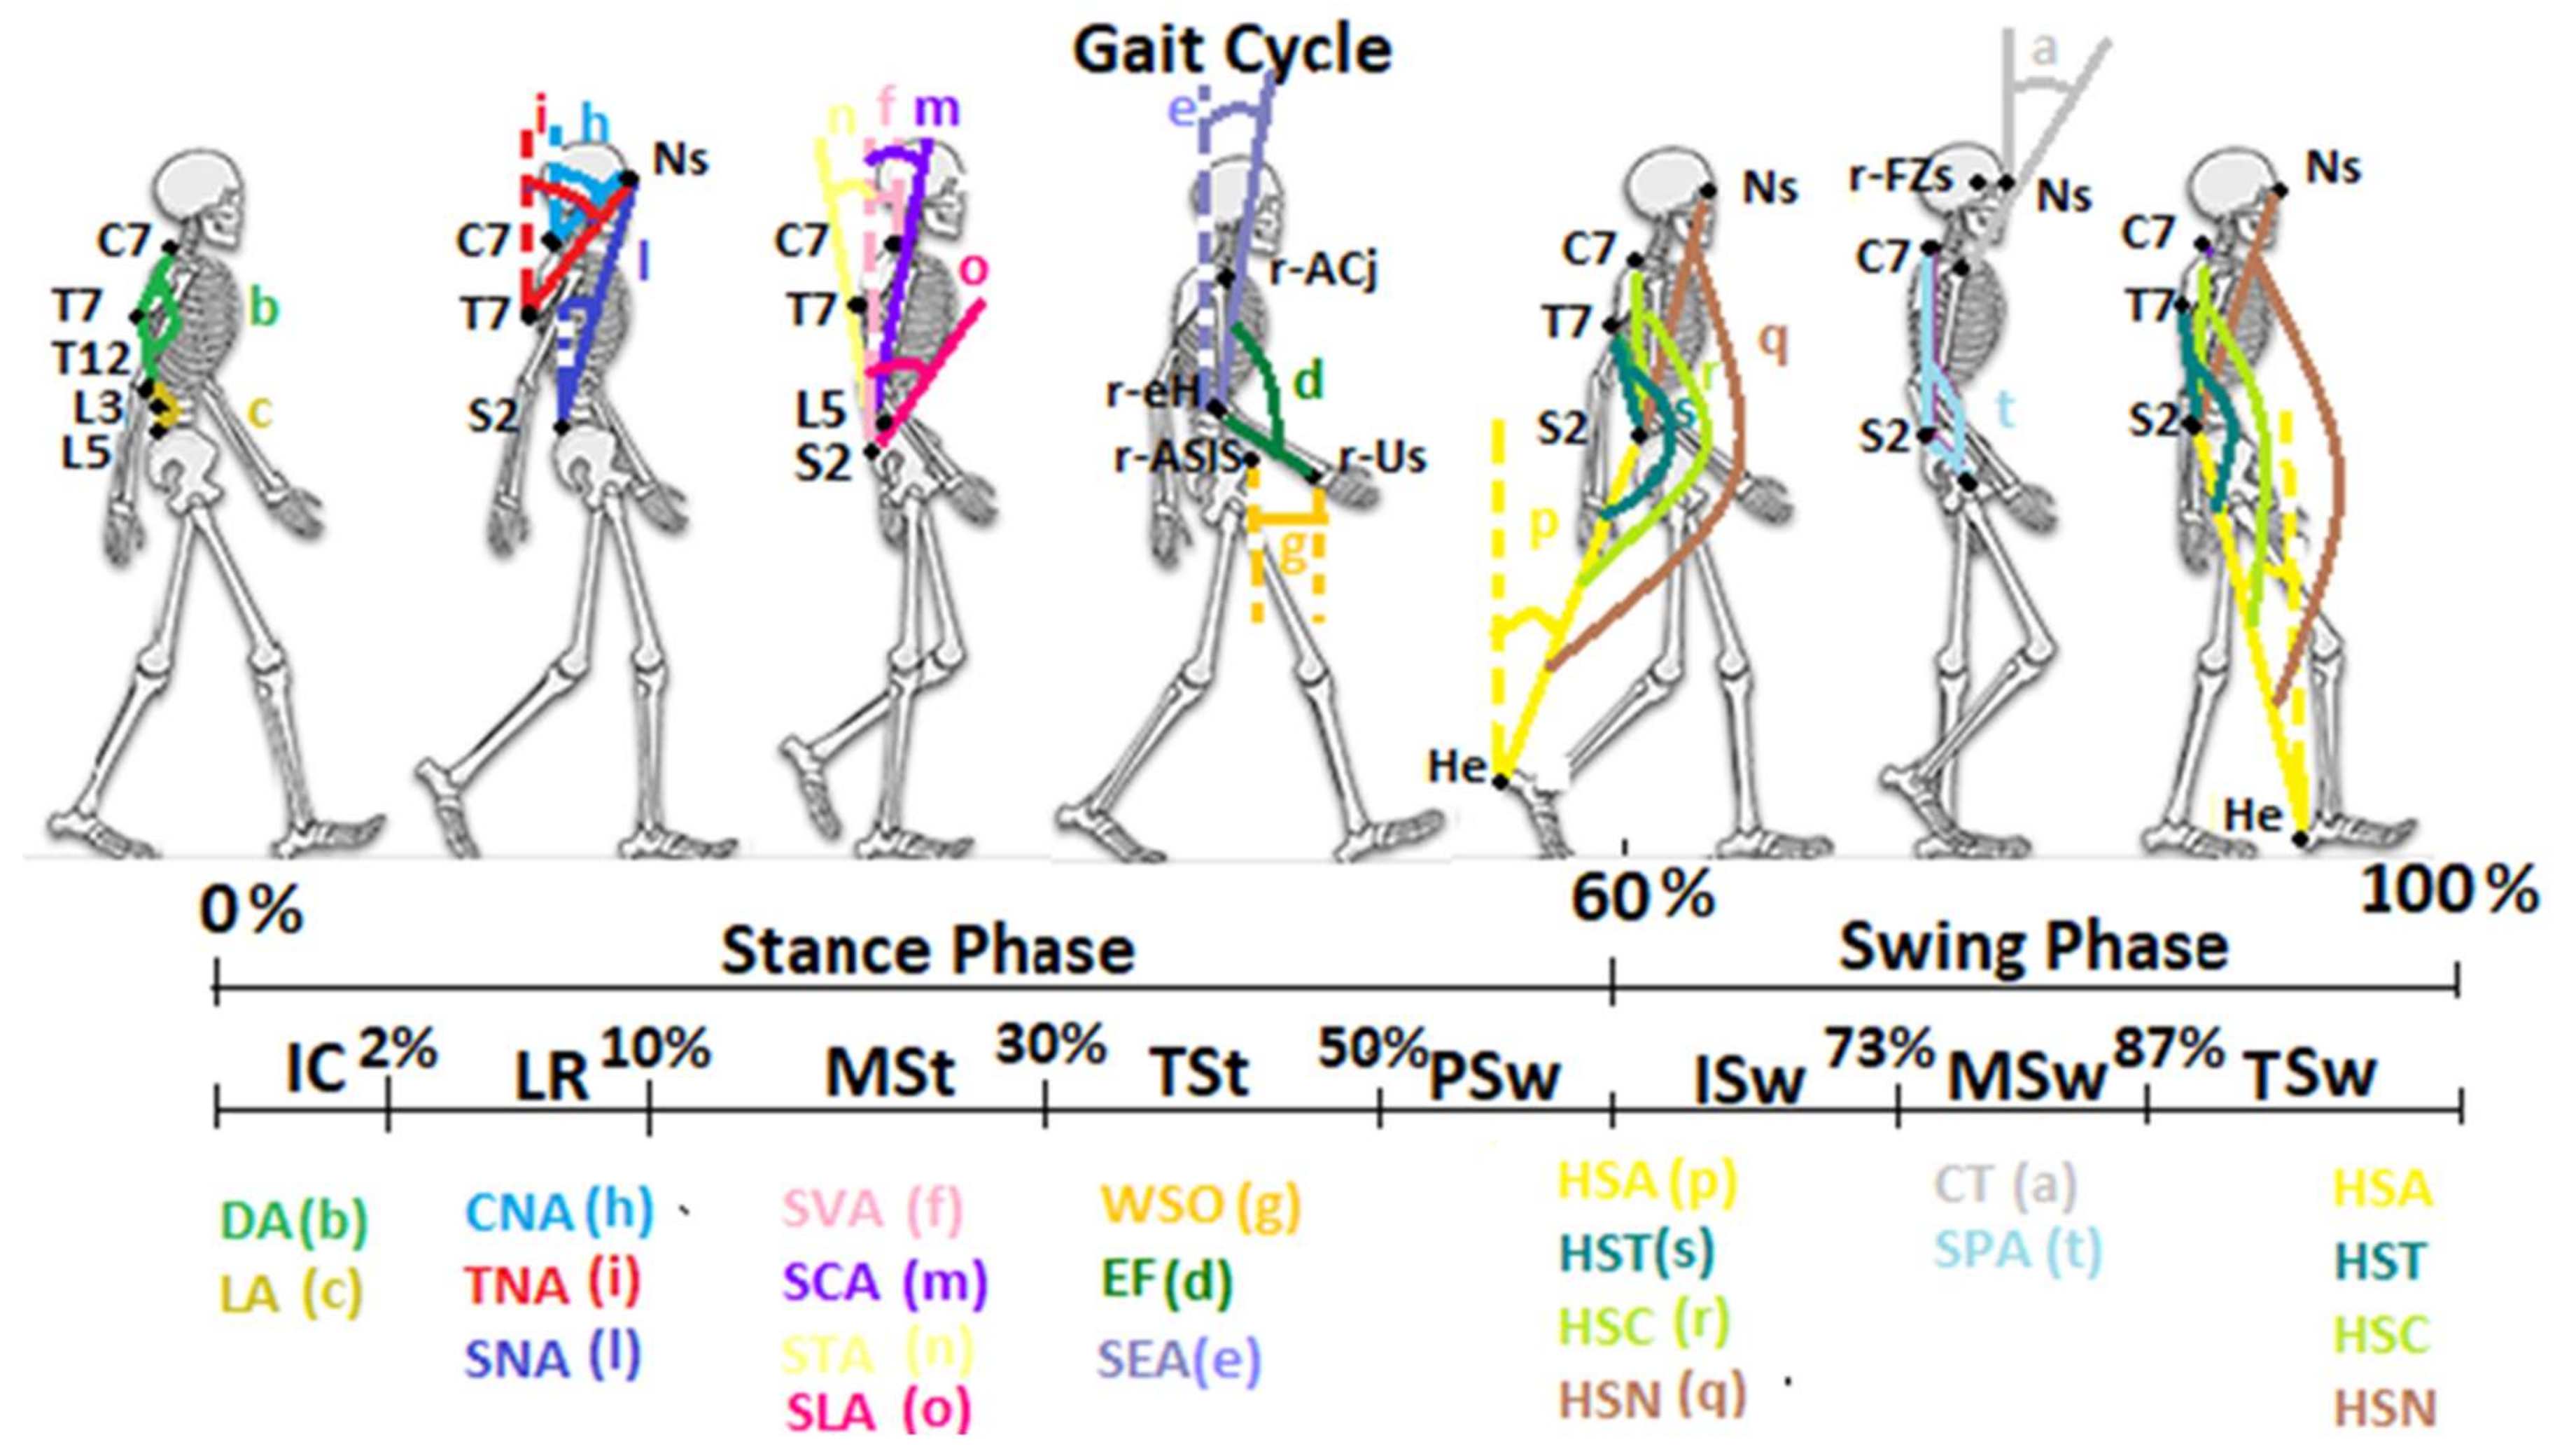
The results of our study defined the kinematic curves and normal ranges of the new DB-Total parameters that analyzed, bottom-up, the correlations among the positions of the heels, pelvis, multi-segmental trunk, head and upper limbs during the different phases of the gait cycle. The Average of the Heel–S2 Angle showed the anterior position of the sacrum with respect to the heel from the mid-stance to mid-swing phases and then a posterior one from the mid-swing to the mid-stance (
Figure 2). A similar kinematic trend was found for the Average of HST, HSC and HSN (
Figure 2). These angles investigated the sagittal alignment among Heel, S2 and, respectively, T7, C7 or Nasion, representing “sagittal whole-body arches” (with S2 as the vertex), and showed a peak of concavity in the phases of pre-/initial swing and of convexity in the terminal swing (
Figure 2 and
Figure 3). In the latter phase, therefore, the head–trunk and heel segments were in the most anterior position, while in the phases of pre-/initial swing, they were in the most posterior position with respect to the sacrum (
Figure 3).
The analyses of the CNA, TNA and SNA Average values, always placed over the threshold line, confirmed the anterior position of the nasion with respect to C7, T7 and sacrum, respectively, during walking (
Figure 2). In particular, the Average of these angles showed a similar kinematic trend, with a decrease during the loading response and the pre-swing, and an increase in the terminal stance and the mid-swing (
Figure 2 and
Figure 3). These trends highlighted the need for trunk–head alignment before the single-support phase and for head anteriorization during the single-support phase in order to promote, respectively, the stability and forward propulsion of the body during walking. These findings were confirmed by the similar trend of the STA, SCA and SVA Average values (
Figure 2); the former was found to be below the threshold line, showing a mild posterior position of T7 with respect to the sacrum, while the latter ones were always represented over the threshold lines, underlining the anterior position of C7 with respect to the sacrum during the entire gait cycle (
Figure 2 and
Figure 3). Our results of the dynamic SVA are in agreement with previous studies [
19,
20,
21], where a positive mean value and very small ROM (as Excursion Range) were found. Another study [
18] reported a greater mean value and ROM than those in our findings, probably because of the younger age of the sample, which can show a more dynamic and variable kinematic pattern. The analysis of the Cervical Tilt angle, which expresses the relation between the head (horizontal plane of the gaze) and the trunk (plane of upper thoracic outlet), was always found to be below the threshold line, underlining the relative extension of the head with respect to the upper-trunk outlet during the whole gait cycle. Regarding the sagittal spinal angles, the Dorsal Angle showed a constant Average of about 150° (kyphosis angle with a small Excursion Range of 2°) and the Lumbar Angle one of about 197° (lordosis angle with a slightly larger Excursion Range of 5°). The Dorsal Angle Excursion Range being shorter than the Lumbar one during walking depended on the more rigid and stable structure of the dorsal spine; these results are in agreement with those in [
18,
20,
21] in regard to the mean value and Excursion Range. The analysis of the S2–L5 Angle revealed an Average over the threshold line and a mean value of 14.08, indicating a trend of horizontalization and nutation of the Sacrum–L5 plate during the gait cycle, with a mild increase in the initial contact–mid-stance and a decrease in the initial swing phase (
Figure 2), which was very similar to the sagittal pelvic pattern because of the close anatomical relationships. Another investigated angle was the Spinal–Pelvic Angle, which analyzed the relation between C7–S2 and the center of the femoral head. This angle is an intrinsic parameter of balance, as well as the corresponding radiological spino-sacral angle [
25]; its Average under the threshold line and mean value of 128° underlined a convexity with an almost constant kinematic pattern (
Figure 2 and
Figure 3). Finally, the quantitative evaluation of upper-limb kinematics during the gait cycle showed an Average of the Shoulder–Elbow Angle with a positive value (meaning a posterior position of the elbow with respect to the shoulder) and a negative one during the last part of the terminal stance and pre-swing (40–60%, with an anterior position of the elbow with respect to the shoulder). The kinematic pattern was characterized by two peaks, a positive one in the terminal-swing/initial-contact phases, which indicated the maximum posteriorization of the elbow with respect to the shoulder, and a negative one in the pre-swing, which indicated the maximum anteriorization of the elbow (
Figure 2 and
Figure 3). A similar trend was found for the Elbow Flexion angle, showing an Average under the threshold line (<180°) with flexion during all the gait cycle and the maximum peak in the pre-swing (50–60%) (
Figure 2 and
Figure 3). Eventually, the analysis of the Wrist–ASIS Offset Average showed a posterior position of the wrist with respect to the ASIS during the gait cycle except for the terminal stance, and the phases of pre- and initial swing (30–70%), with a negative peak (maximum posteriorization of the wrist with respect to the ASIS) in the initial contact and a positive peak (maximum anteriorization of the wrist) in the pre-swing phase.
Limitations: There are some limitations associated with the present study, such as the relatively small sample size and the heterogeneity of the recruited group with respect to the age, weight and height. However, the use of 3D motion analysis (gold-standard instrumental examination for static and dynamic postural evaluation), the accuracy of the DB-Total protocol and the assignment of markers placement to a single expert physician make our results reliable. The normal dataset may be used for comparison with a pathological population, above all for the most repeatable kinematic parameters. Nevertheless, future studies on a larger population would be needed in order to verify inter-subject variability in relation to different features (age, weight, height, etc.) of the healthy population.


 ,
, 
