
Effects of Exercise, Rehabilitation, and Nutritional Approaches on Body Composition and Bone Density in People with Multiple Sclerosis: A Systematic Review and Meta-Analysis

 , , , , , ,
  and
and
Abstract
:
1. Introduction
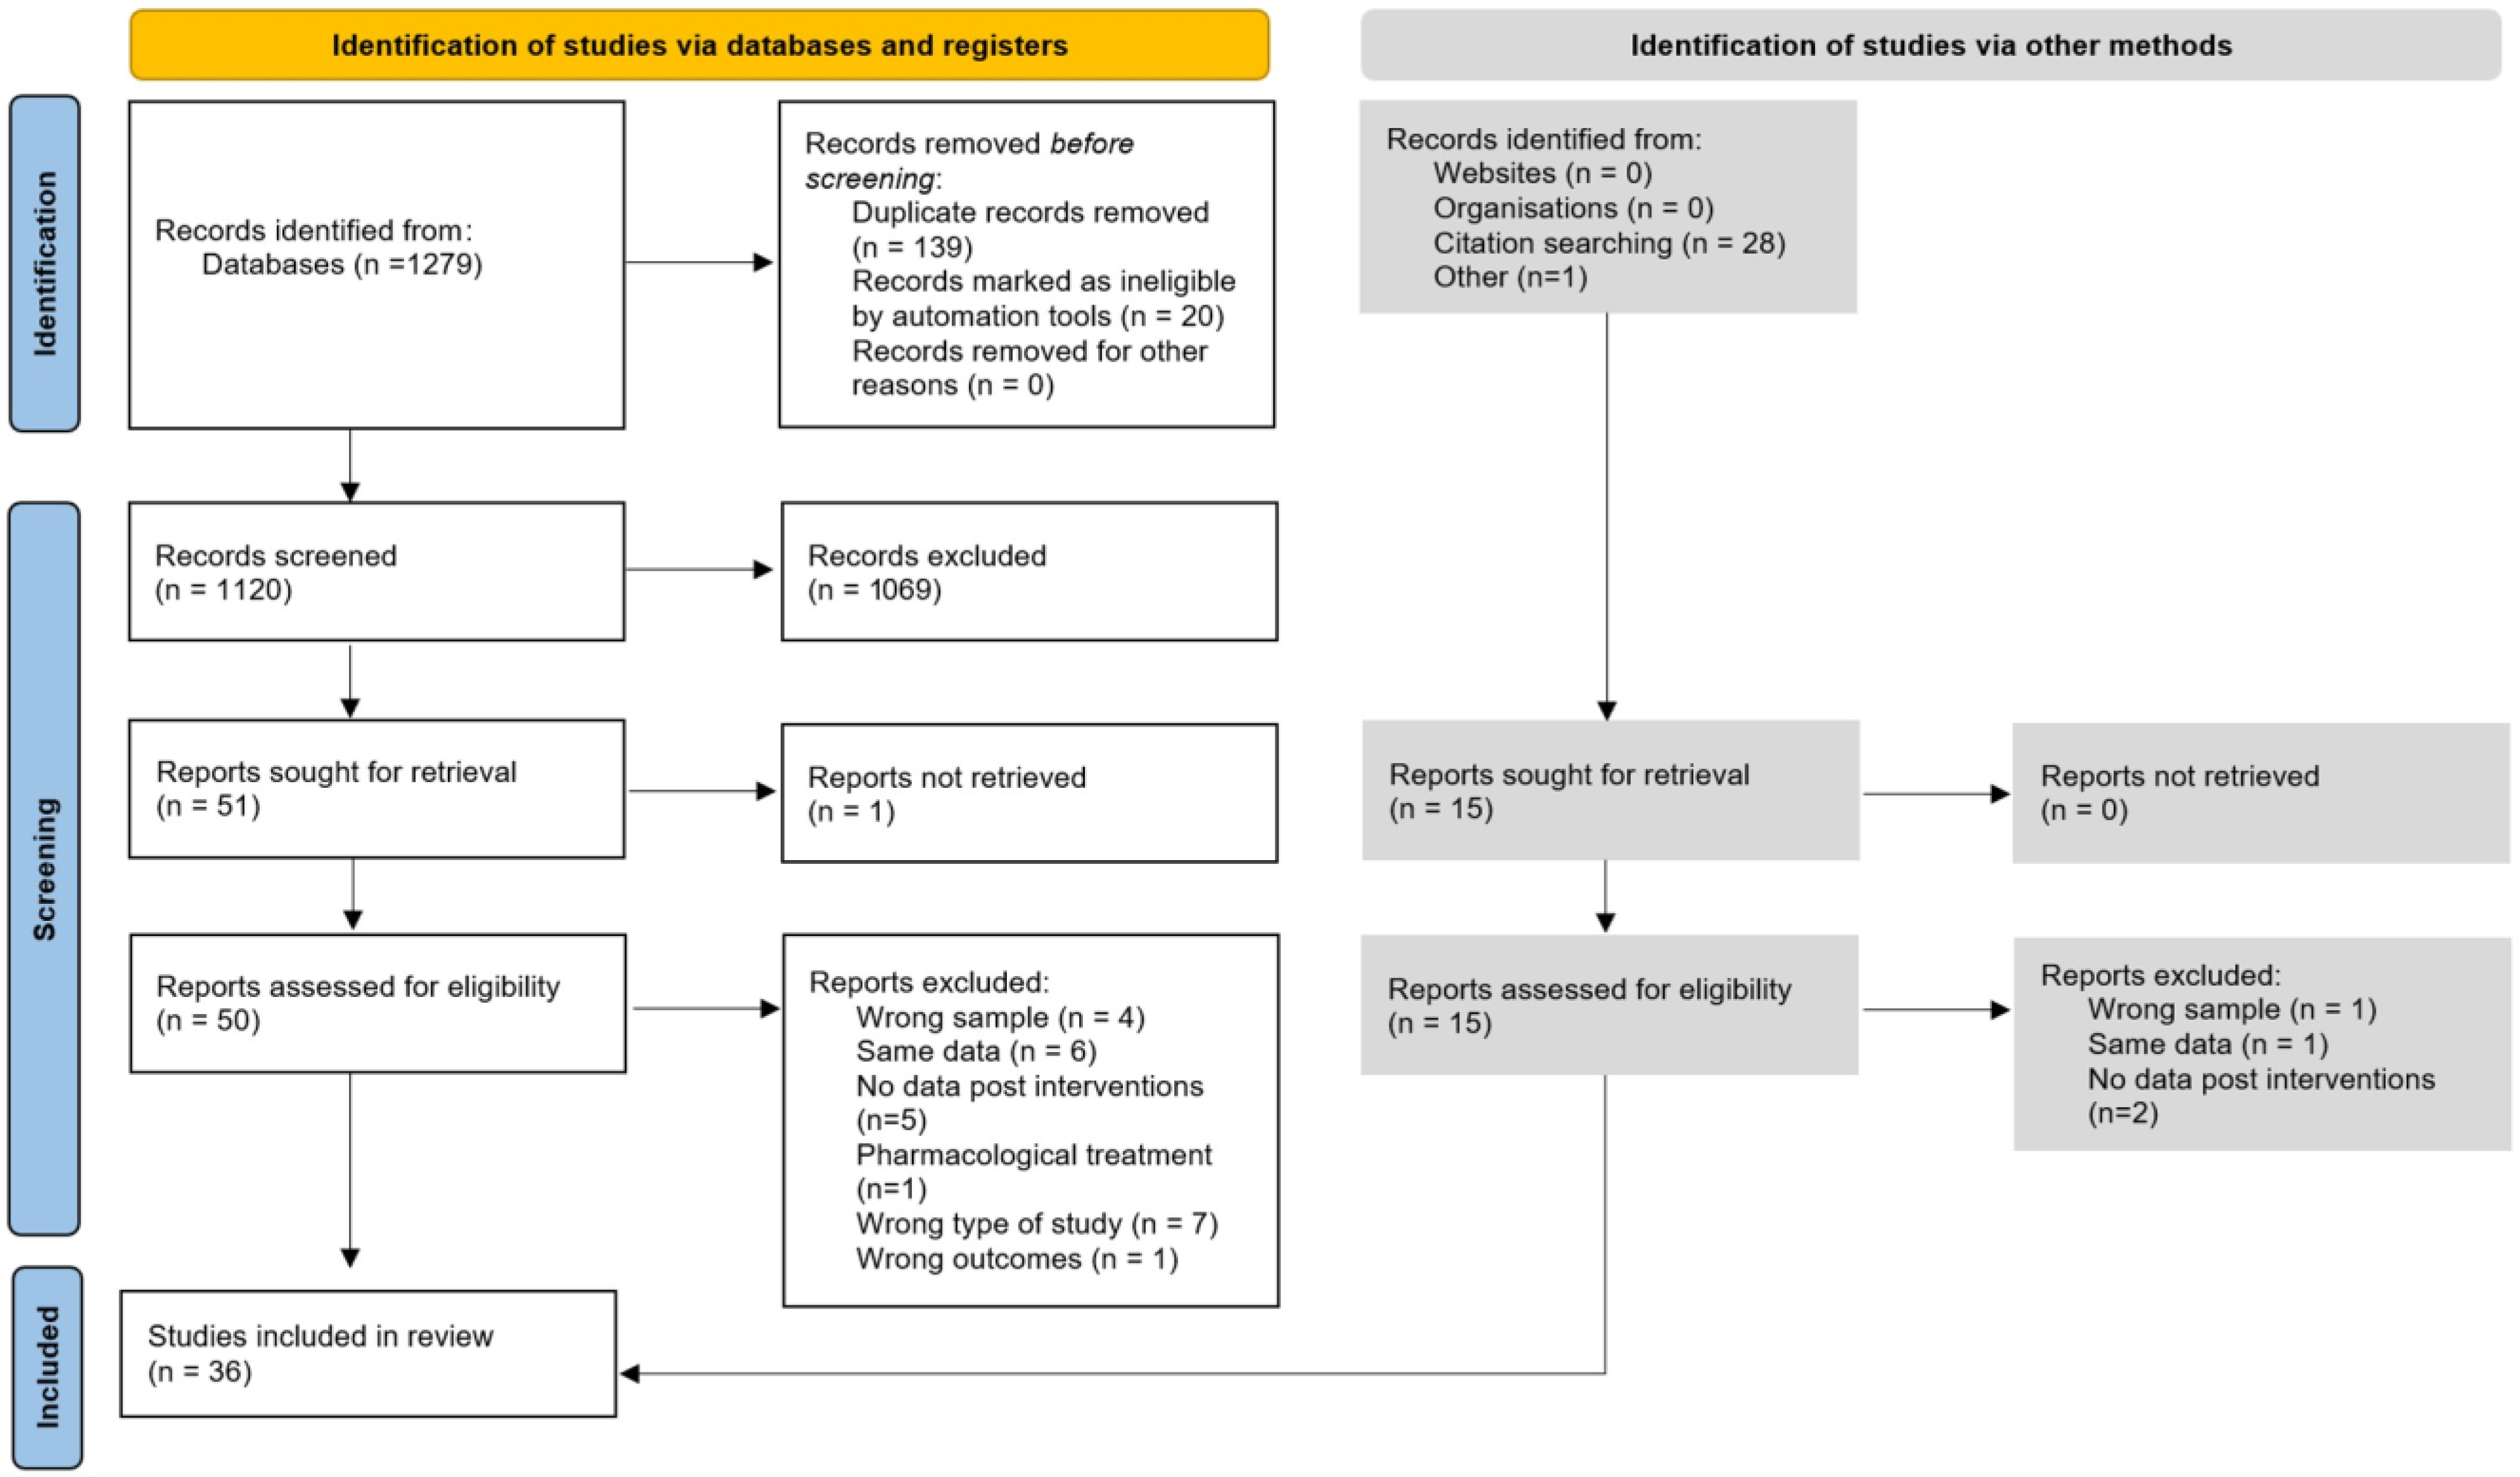
2. Materials and Methods
2.1. Selection Criteria
2.2. Literature Search
2.3. Data Collection
2.4. Statistical Analysis
3. Results
3.1. Characteristics of the Analyzed Studies
3.2. Outcomes of Interest
3.3. Types of Interventions
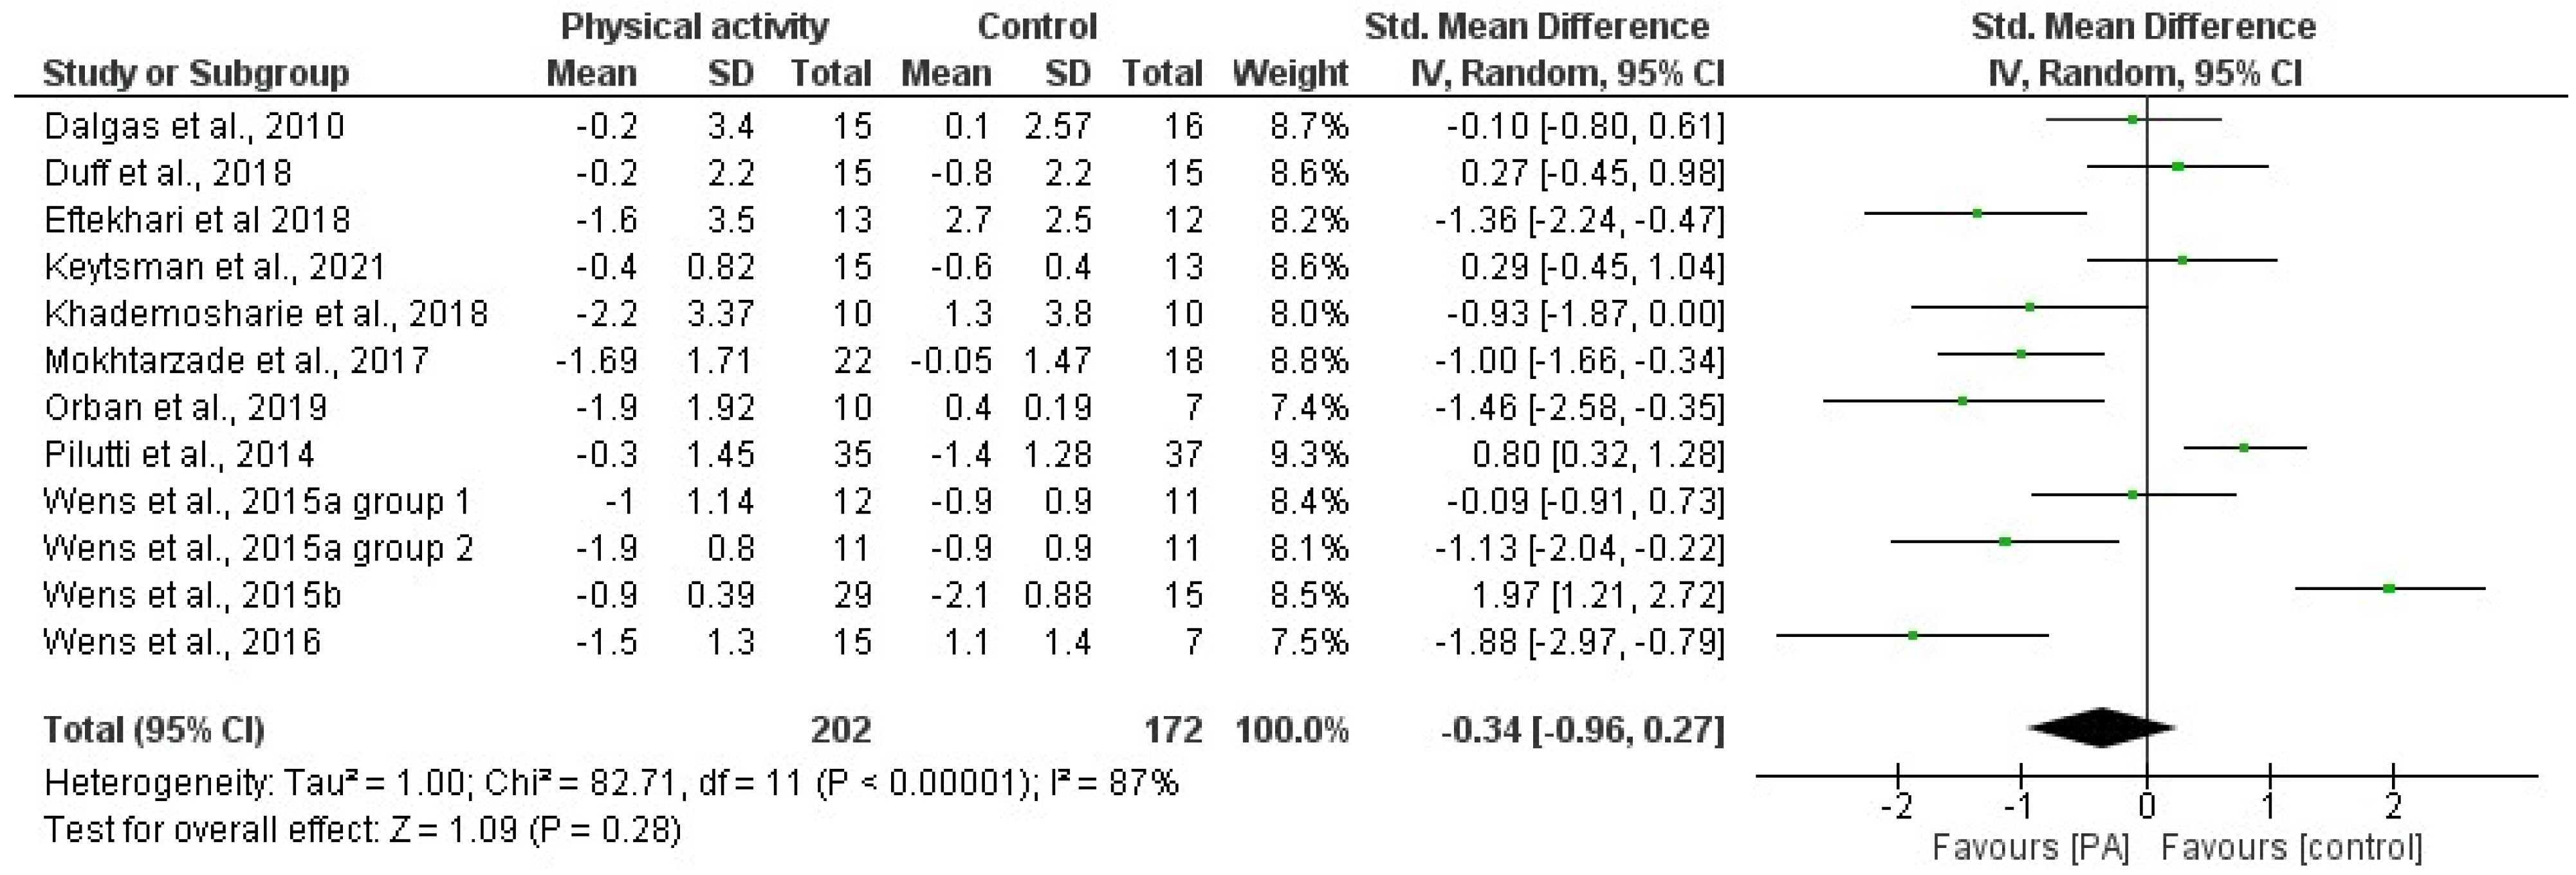
3.4. Effects of Physical Activity and Multimodal Intervention on BMI, BC, and BMD
3.5. Effects of Diet/Supplement-Based Interventions on BC and BMD
3.6. Risk of Bias
4. Discussion
5. Conclusions
Supplementary Materials
Author Contributions
Funding
Institutional Review Board Statement
Informed Consent Statement
Conflicts of Interest
References
- Walton, C.; King, R.; Rechtman, L.; Kaye, W.; Lerray, E.; Marrie, R.A.; Robertson, N.; La Rocca, N.; Uitdehaag, B.; van der Mei, R.; et al. Rising prevalence of multiple sclerosis worldwide: Insights from the Atlas of MS. Mult. Scler. J. 2020, 26, 1816–1821. [Google Scholar] [CrossRef] [PubMed]
- McGinley, M.P.; Goldschmidt, C.H.; Rae-Grant, A.D. Diagnosis and treatment of multiple sclerosis: A review. JAMA 2021, 325, 765–779. [Google Scholar] [CrossRef] [PubMed]
- Hauser, S.L.; Cree, B.A.C. Treatment of Multiple Sclerosis: A Review. Am. J. Med. 2020, 133, 1380–1390.e2. [Google Scholar] [CrossRef] [PubMed]
- Gil-González, I.; Martín-Rodríguez, A.; Conrad, R.; Pérez-San-Gregorio, M.Á. Quality of life in adults with multiple sclerosis: A systematic review. BMJ Open 2020, 10, e041249. [Google Scholar] [CrossRef]
- Nourbakhsh, B.; Mowry, E.M. Multiple sclerosis risk factors and pathogenesis. Contin. Lifelong Learn. Neurol. 2019, 25, 596–610. [Google Scholar] [CrossRef]
- Schreiner, T.G.; Genes, T.M. Obesity and multiple sclerosis—A multifaceted association. J. Clin. Med. 2021, 10, 2689. [Google Scholar] [CrossRef]
- Dionyssiotis, Y. Body composition in multiple sclerosis. Hippokratia 2013, 17, 7–11. [Google Scholar]
- Livne-Margolin, M.; Latzer, I.T.; Pinhas-Hamiel, O.; Harari, G.; Achiron, A. Bodyweight measures and lifestyle habits in individuals with multiple sclerosis and moderate to severe disability. J. Clin. Med. 2021, 10, 2083. [Google Scholar] [CrossRef]
- Dardiotis, E.; Tsouris, Z.; Aslanidou, P.; Aloizou, A.-M.; Sokratus, M.; Provatas, A.; Siokas, V.; Deretzi, G.; Hadjigeorgiou, G.M. Body mass index in patients with Multiple Sclerosis: A meta-analysis. Neurol. Res. 2019, 41, 836–846. [Google Scholar] [CrossRef]
- Gianfrancesco, M.A.; Barcellos, L.F. Obesity and multiple sclerosis susceptibility: A review. J. Neurol. Neuromed. 2016, 1, 1. [Google Scholar] [CrossRef]
- Hedström, A.K.; Olsson, T.; Alfredsson, L. High body mass index before age 20 is associated with increased risk for multiple sclerosis in both men and women. Mult. Scler. J. 2012, 18, 1334–1336. [Google Scholar] [CrossRef]
- Hedström, A.K.; Olsson, T.; Alfredsson, L. Body mass index during adolescence rather than childhood is critical in determining MS risk. Mult. Scler. J. 2016, 22, 878–883. [Google Scholar] [CrossRef]
- Munger, K.L.; Chitnis, T.; Ascherio, A. Body size and risk of MS in two cohorts of US women. Neurology 2009, 73, 1543–1550. [Google Scholar] [CrossRef]
- Lutfullin, I.; Eveslage, M.; Bittner, S.; Antony, G.; Flaskamp, M.; Luessi, F.; Salmen, A.; Gisevius, B.; Klotz, L.; Korsukewitz, C.; et al. Association of obesity with disease outcome in multiple sclerosis. J. Neurol. Neurosurg. Psychiatry 2022, 94, 57–61. [Google Scholar] [CrossRef] [PubMed]
- Marck, C.H.; Neate, S.L.; Taylor, K.L.; Weiland, T.J.; Jelinek, G.A. Prevalence of Comorbidities, Overweight and Obesity in an International Sample of People with Multiple Sclerosis and Associations with Modifiable Lifestyle Factors. PLoS ONE 2016, 11, e0148573. [Google Scholar] [CrossRef] [PubMed]
- Tettey, P.; Balogun, S. Obesity and multiple sclerosis: Prevalence, susceptibility and progression in disability. Future Neurol. 2017, 12, 149–157. [Google Scholar] [CrossRef]
- Fitzgerald, K.C.; Salter, A.; Tyry, T.; Fox, R.J.; Cutter, G.; Marrie, R.A. Measures of general and abdominal obesity and disability severity in a large population of people with multiple sclerosis. Mult. Scler. J. 2020, 26, 976–986. [Google Scholar] [CrossRef] [PubMed]
- Mokhtarzade, M.; Agha-Alinejad, H.; Motl, R.W.; Negaresh, R.; Baker, J.S.; Zimmer, P. Weight control and physical exercise in people with multiple sclerosis: Current knowledge and future perspectives. Complement. Ther. Med. 2019, 43, 240–246. [Google Scholar] [CrossRef]
- Sioka, C.; Fotopoulos, A.; Georgiou, A.; Papakonstantinou, S.; Pelidou, S.H.; Kyritsis, A.P.; Kalef-Ezra, J.A. Body composition in ambulatory patients with multiple sclerosis. J. Clin. Densitom. 2011, 14, 465–470. [Google Scholar] [CrossRef]
- Keytsman, C.; Eijnde, B.O.; Hansen, D.; Verboven, K.; Wens, I. Elevated cardiovascular risk factors in multiple sclerosis. Mult. Scler. Relat. Disord. 2017, 17, 220–223. [Google Scholar] [CrossRef]
- Cleland, B.T.; Papanek, P.; Ingraham, B.A.; Harkins, A.; Woo, D.; Csuka, M.E.; Ng, A. Determinants of low bone mineral density in people with multiple sclerosis: Role of physical activity. Mult. Scler. Relat. Disord. 2020, 38, 101864. [Google Scholar] [CrossRef] [PubMed]
- Peterson, E.W.; Cho, C.C.; von Koch, L.; Finlayson, M.L. Injurious falls among middle aged and older adults with multiple sclerosis. Arch. Phys. Med. Rehabil. 2008, 89, 1031–1037. [Google Scholar] [CrossRef] [PubMed]
- Mazumder, R.; Murchison, C.; Bourdette, D.; Cameron, M. Falls in People with Multiple Sclerosis Compared with Falls in Healthy Controls. PLoS ONE 2014, 9, e107620. [Google Scholar] [CrossRef] [PubMed]
- Gibson, J.C.; Summers, G.D. Bone health in multiple sclerosis. Osteoporos. Int. 2011, 22, 2935–2949. [Google Scholar] [CrossRef] [PubMed]
- Bisson, E.J.; Finlayson, M.L.; Ekuma, O.; Leslie, W.D.; Marrie, R.A. Multiple sclerosis is associated with low bone mineral density and osteoporosis. Neurol. Clin. Pract. 2019, 9, 391–399. [Google Scholar] [CrossRef] [PubMed]
- Huang, Z.; Qi, Y.; Du, S.; Chen, G.; Yan, W. BMI levels with MS Bone mineral density levels in adults with multiple sclerosis: A meta-analysis. Int. J. Neurosci. 2015, 125, 904–912. [Google Scholar] [CrossRef]
- Nilsagård, Y.; Gunn, H.; Freeman, J.; Hoang, P.; Lord, S.; Mazumder, R.; Cameron, M. Falls in people with MS—An individual data meta-analysis from studies from Australia, Sweden, United Kingdom and the United States. Mult. Scler. J. 2015, 21, 92–100. [Google Scholar] [CrossRef]
- Sosnoff, J.J.; Socie, M.J.; Boes, M.K.; Sandroff, B.M.; Pula, J.H.; Suh, Y.; Weikert, M.; Balantrapu, S.; Morrison, S.; Motl, R.W. Mobility balance and falls in persons with multiple sclerosis. PLoS ONE 2011, 6, e28021. [Google Scholar] [CrossRef]
- Motl, R.W.; McAuley, E.; Snook, E.M. Physical activity and multiple sclerosis: A meta-analysis. Mult. Scler. J. 2005, 11, 459–463. [Google Scholar] [CrossRef]
- Coulter, E.H.; Bond, S.; Dalgas, U.; Paul, L. The effectiveness of interventions targeting physical activity and/or sedentary behaviour in people with Multiple Sclerosis: A systematic review. Disabil. Rehabil. 2020, 42, 594–612. [Google Scholar] [CrossRef]
- Stoiloudis, P.; Kesidou, E.; Bakirtzis, C.; Sintila, S.A.; Konstantinidou, N.; Boziki, M.; Grigoriadis, N. The role of diet and interventions on multiple sclerosis: A review. Nutrients 2022, 14, 1150. [Google Scholar] [CrossRef] [PubMed]
- Aristotelous, P.; Stefanakis, M.; Pantzaris, M.; Pattichis, C.S.; Calder, P.C.; Patrikios, I.S.; Sakkas, G.K.; Giannaki, C.D. The effects of specific omega-3 and omega-6 polyunsaturated fatty acids and antioxidant vitamins on gait and functional capacity parameters in patients with relapsing-remitting multiple sclerosis. Nutrients 2021, 13, 3661. [Google Scholar] [CrossRef]
- Duff, W.R.D.; Andrushko, J.W.; Renshaw, D.W.; Chilibeck, P.D.; Farthing, J.P.; Danielson, J.; Evans, C.D. Impact of pilates exercise in multiple sclerosis: A randomized controlled trial. Int. J. MS Care 2018, 20, 92–100. [Google Scholar] [CrossRef] [PubMed]
- Pilutti, L.A.; Dlugonski, D.; Sandroff, B.M.; Klaren, B.M.; Motl, R.V. Internet-delivered lifestyle physical activity intervention improves body composition in multiple sclerosis: Preliminary evidence from a randomized controlled trial. Arch. Phys. Med. Rehabil. 2014, 95, 1283–1288. [Google Scholar] [CrossRef] [PubMed]
- Platero, J.L.; Cuerda-Ballester, M.; Ibáñez, V.; Sancho, D.; Lopez-Rodríguez, M.M.; Drehmer, E.; de la Rubia Ortí, J.E. The impact of coconut oil and epigallocatechin gallate on the levels of IL-6, anxiety and disability in multiple sclerosis patients. Nutrients 2020, 12, 305. [Google Scholar] [CrossRef]
- Ewanchuk, B.W.; Gharagozloo, M.; Peelen, E.; Pilutti, L.A. Exploring the role of physical activity and exercise for managing vascular comorbidities in people with multiple sclerosis: A scoping review. Mult. Scler. Relat. Disord. 2018, 26, 19–32. [Google Scholar] [CrossRef]
- Rodríguez-Fuentes, G.; Silveira-Pereira, L.; Ferradáns-Rodríguez, P.; Campo-Prieto, P. Therapeutic Effects of the Pilates Method in Patients with Multiple Sclerosis: A Systematic Review. J. Clin. Med. 2022, 11, 683. [Google Scholar] [CrossRef]
- Orban, A.; Garg, B.; Sammi, M.K.; Bourdette, D.N.; Rooney, W.D.; Kuehl, K.; Spain, R.I. Effect of High-Intensity Exercise on Multiple Sclerosis Function and Phosphorous Magnetic Resonance Spectroscopy Outcomes. Med. Sci. Sport. Exerc. 2019, 51, 1380–1386. [Google Scholar] [CrossRef]
- Tamtaji, O.R.; Kouchaki, E.; Salami, M.; Aghadavod, E.; Akbari, E.; Tajabadi-Ebrahimi, M.; Asemi, Z. The Effects of Probiotic Supplementation on Gene Expression Related to Inflammation, Insulin, and Lipids in Patients with Multiple Sclerosis: A Randomized Double-Blind Placebo-Controlled Trial. J. Am. Coll. Nutr. 2017, 36, 660–665. [Google Scholar] [CrossRef]
- Brenton, J.N.; Lehner-Gulotta, D.; Woolbright, E.; Banwell, B.; Bergqvist, A.C.; Chen, S.; Coleman, R.; Conaway, M.; Goldman, M.D. Phase II study of ketogenic diets in relapsing multiple sclerosis: Safety, tolerability and potential clinical benefits. J. Neurol. Neurosurg. Psychiatry 2022, 93, 637–644. [Google Scholar] [CrossRef]
- Carter, A.M.; Daley, A.J.; Kesterton, S.W.; Woodroofe, N.M.; Saxton, J.M.; Sharrack, B. Pragmatic exercise intervention in people with mild to moderate multiple sclerosis: A randomised controlled feasibility study. Contemp. Clin. Trials 2013, 35, 40–47. [Google Scholar] [CrossRef] [PubMed]
- Negaresh, R.; Motl, R.; Mokhtarzade, M.; Ranjbar, R.; Majdinasab, N.; Khodadoost, M.; Zimmer, P.; Baker, J.S.; Patel, D. Effect of Short-Term Interval Exercise Training on Fatigue Depression, and Fitness in Normal Weight vs Overweight Person with Multiple Sclerosis. Explore 2019, 15, 134–141. [Google Scholar] [CrossRef] [PubMed]
- Pilutti, L.A.; Motl, R.W. Body mass index underestimates adiposity in persons with multiple sclerosis. Arch. Phys. Med. Rehabil. 2016, 97, 405–412. [Google Scholar] [CrossRef]
- Castellanos Montealegre, M.; García García, J.M.; Torres Pareja, M.; Montealegre, C.C.; Laiz, N.M. Efectos de dos programas de entrenamiento de potencia e hipertrofia sobre la densidad mineral ósea y la potencia media en personas con esclerosis múltiple durante 7 semanas Estudio preliminar. Cult. Cienc. Deporte 2020, 43, 5–16. [Google Scholar]
- Torres Pareja, M.; Peinado Palomino, D.; Vaquerizo García, J.; Santos-García, D.J.; García, P.E.; Laiz, N.M. Evaluación de un programa de entrenamiento de fuerza en personas con esclerosis multiple. Cult. Cienc. Deporte 2019, 14, 265–275. [Google Scholar]
- Yang, F.; Finlayson, M.; Bethoux, F.; Su, X.; Dillon, L.; Maldonado, H.M. Effects of controlled whole-body vibration training in improving fall risk factors among individuals with multiple sclerosis: A pilot study. Disabil. Rehabil. 2018, 40, 553–560. [Google Scholar] [CrossRef]
- Page, M.J.; McKenzie, J.E.; Bossuyt, P.M.; Boutron, I.; Hoffmann, T.C.; Mulrow, C.D.; Shamseer, L.; Tetzlaff, J.M.; Akl, E.A.; Brennan, S.E.; et al. The PRISMA 2020 statement: An updated guideline for reporting systematic reviews. Int. J. Surg. 2021, 88, 105906. [Google Scholar] [CrossRef]
- Sterne, J.A.C.; Savović, J.; Page, M.J.; Elbers, R.G.; Blencowe, N.S.; Boutron, I.; Cates, C.J.; Cheng, H.-Y.; Corbett, M.S.; Eldridge, S.M.; et al. RoB 2: A revised tool for assessing risk of bias in randomised trials. BMJ 2019, 366, l4898. [Google Scholar] [CrossRef]
- De la Rubia Ortí, J.E.; Platero, J.L.; Yang, I.H.; Ceron, J.J.; Tvarijonaviciute, A.; Sabater, P.S.; Sancho, S.; Benlloch, M.; Sancho-Cantus, D. Possible Role of Butyrylcholinesterase in Fat Loss and Decreases in Inflammatory Levels in Patients with Multiple Sclerosis after Treatment with Epigallocatechin Gallate and Coconut Oil: A Pilot Study. Nutrients 2021, 13, 3230. [Google Scholar] [CrossRef]
- Eftekhari, E.; Etemadifar, M. Impact of Clinical Mat Pilates on Body Composition and Functional Indices in Female Patients with Multiple Sclerosis. Crescent J. Med. Biol. Sci. 2018, 5, 297–305. [Google Scholar]
- Mokhtarzade, M.; Motl, R.; Negaresh, R.; Zimmer, P.; Khodadoost, M.; Baker, J.S.; Patel, D.; Majdinasab, N.; Ranjbar, R. Exercise-induced changes in neurotrophic factors and markers of blood-brain barrier permeability are moderated by weight status in multiple sclerosis. Neuropeptides 2018, 70, 93–100. [Google Scholar] [CrossRef] [PubMed]
- Fitzgerald, K.C.; Vizthum, D.; Henry-Barron, B.; Schweitzer, A.; Cassard, S.D.; Kossoff, E.; Hartman, A.L.; Kapogiannis, D.; Sullivan, P.; Baer, D.J.; et al. Effect of intermittent vs daily calorie restriction on changes in weight and patient-reported outcomes in people with multiple sclerosis. Mult. Scler. Relat. Disord. 2018, 23, 33–39. [Google Scholar] [CrossRef] [PubMed]
- Wens, I.; Dalgas, U.; Vandenabeele, F.; Verboven, K.; Hansen, D.; Deckx, N.; Cools, N.; Eijnde, B.O. High Intensity Aerobic and Resistance Exercise Can Improve Glucose Tolerance in Persons With Multiple Sclerosis: A Randomized Controlled Trial. Am. J. Phys. Med. Rehabil. 2017, 96, 161–166. [Google Scholar] [CrossRef] [PubMed]
- Motl, R.W.; Pilutti, L.A. The benefits of exercise training in multiple sclerosis. Nat. Rev. Neurol. 2012, 8, 487–497. [Google Scholar] [CrossRef] [PubMed]
- Straudi, S.; De Marco, G.; Martinuzzi, C.; Baroni, A.; Lamberti, N.; Brondi, L.; Da Roit, M.; Di Marco Pizzongolo, L.; Basaglia, N.; Manfredini, F. Combining a supervised and home-based task-oriented circuit training improves walking endurance in patients with multiple sclerosis The MS_TOCT randomized-controlled trial. Mult. Scler. Relat. Disord. 2022, 60, 103721. [Google Scholar] [CrossRef]
- Benlloch, M.; Cuerda-ballester, M.; Drehmer, E.; Platero, J.L.; Carrera-Juliá, S.; López-Rodríguez, M.M.; Ceron, J.J.; Tvarijonaviciute, A.; Navarro, M.A.; Moreno, M.L.; et al. Possible reduction of cardiac risk after supplementation with epigallocatechin gallate and increase of ketone bodies in the blood in patients with multiple sclerosis A pilot study. Nutrients 2020, 12, 3792. [Google Scholar] [CrossRef]
- Dalgas, U.; Stenager, E.; Jakobsen, J.; Petersen, T.; Overgaard, K.; Ingemann-Hansen, T. Muscle fiber size increases following resistance training in multiple sclerosis. Mult. Scler. 2010, 16, 1367–1376. [Google Scholar] [CrossRef]
- Learmonth, Y.C.; Paul, L.; Miller, L.; Mattison, P.; McFadyen, A.K. The effects of a 12-week leisure centre-based group exercise intervention for people moderately affected with multiple sclerosis: A randomized controlled pilot study. Clin. Rehabil. 2012, 26, 579–593. [Google Scholar] [CrossRef]
- Mokhtarzade, M.; Ranjbar, R.; Majdinasab, N.; Patel, D.; Molanouri Shamsi, M. Effect of aerobic interval training on serum IL-10, TNFα, and adipokines levels in women with multiple sclerosis: Possible relations with fatigue and quality of life. Endocrine 2017, 57, 262–271. [Google Scholar] [CrossRef]
- Riccio, P.; Rossano, R.; Larocca, M.; Trotta, V.; Mennella, I.; Vitaglione, P.; Ettorre, M.; Graverini, A.; De Santis, A.; Di Monte, E.; et al. Anti-inflammatory nutritional intervention in patients with relapsing-remitting and primary-progressive multiple sclerosis: A pilot study. Exp. Biol. Med. 2016, 241, 620–635. [Google Scholar] [CrossRef]
- Wens, I.; Dalgas, U.; Vandenabeele, F.; Grevendonk, L.; Verboven, K.; Hansen, D.; Eijnde, B.O. High intensity exercise in multiple sclerosis: Effects on muscle contractile characteristics and exercise capacity a randomised controlled trial. PLoS ONE 2015, 10, e0133697. [Google Scholar] [CrossRef] [PubMed]
- Wens, I.; Hansen, D.; Verboven, K.; Deckx, N.; Kosten, L.; Stevens, A.L.; Cools, N.; Eijnde, B.O. Impact of 24 weeks of resistance and endurance exercise on glucose tolerance in persons with multiple sclerosis. Am. J. Phys. Med. Rehabil. 2015, 94, 838–847. [Google Scholar] [CrossRef] [PubMed]
- Wens, I.; Keytsman, C.; Deckx, N.; Cools, N.; Dalgas, U.; Eijnde, B.O. Brain derived neurotrophic factor in multiple sclerosis: Effect of 24 weeks endurance and resistance training. Eur. J. Neurol. 2016, 23, 1028–1035. [Google Scholar] [CrossRef] [PubMed]
- Yadav, V.; Marracci, G.; Kim, E.; Spain, R.; Cameron, M.; Overs, S.; Riddehough, A.; Li, D.K.B.; McDougall, J.; Lovera, J.; et al. Low-fat plant-based diet in multiple sclerosis: A randomized controlled trial. Mult. Scler. Relat. Disord. 2016, 9, 80–90. [Google Scholar] [CrossRef] [PubMed]
- Khademosharie, M.; Tadibi, V.; Behpoor, N.; Hamedinia, M.R. The effect of 12-weeks concurent training on the serum levels NGF, BDNF, and VDBP in women with multiple sclerosis. Int. J. Appl. Exerc. Physiol. 2018, 7, 77–86. [Google Scholar] [CrossRef]
- Keytsman, C.; Van Noten, P.; Verboven, K.; Van Asch, P.; Eijnde, B.O. Periodized versus classic exercise therapy in Multiple Sclerosis: A randomized controlled trial. Mult. Scler. Relat. Disord. 2021, 49, 102782. [Google Scholar] [CrossRef]
- Barry, A.; Cronin, O.; Ryan, A.M.; Sweeney, B.; O’Toole, O.; Allen, A.P.; Clarke, G.; O’Halloran, K.D.; Downer, E.J. Impact of short-term cycle ergometer training on quality of life cognition and depressive symptomatology in multiple sclerosis patients: A pilot study. Neurol. Sci. 2018, 39, 461–469. [Google Scholar] [CrossRef]
- Keytsman, C.; Van Noten, P.; Spaas, J.; Nieste, I.; Van Asch, P.; Eijnde, B.O. Periodized home-based training: A new strategy to improve high intensity exercise therapy adherence in mildly affected patients with Multiple Sclerosis. Mult. Scler. Relat. Disord. 2019, 28, 91–97. [Google Scholar] [CrossRef]
- Castellano, V.; Patel, D.I.; White, L.J. Cytokine responses to acute and chronic exercise in multiple sclerosis. J. Appl. Physiol. 2008, 104, 1697–1702. [Google Scholar] [CrossRef]
- Fragoso, Y.D.; Santana, D.L.B.; Pinto, R.C. The positive effects of a physical activity program for multiple sclerosis patients with fatigue. Neuro Rehabil. 2008, 23, 153–157. [Google Scholar] [CrossRef]
- White, L.J.; Castellano, V.; Mc Coy, S.C. Cytokine responses to resistance training in people with multiple sclerosis. J. Sport. Sci. 2006, 24, 911–914. [Google Scholar] [CrossRef] [PubMed]
- Schmidt, S.; Wonneberger, M. Long-term endurance exercise improves aerobic capacity in patients with relapsing-remitting Multiple Sclerosis: Impact of baseline fatigue. J. Neurol. Sci. 2014, 336, 29–35. [Google Scholar] [CrossRef] [PubMed]
- Wingo, B.C.; Rinker, J.R.; Goss, A.M.; Green, K.; Wicks, V.; Cutter, G.R.; Motl, R.W. Feasibility of improving dietary quality using a telehealth lifestyle intervention for adults with multiple sclerosis. Mult. Scler. Relat. Disord. 2020, 46, 102504. [Google Scholar] [CrossRef] [PubMed]
- Keytsman, C.; Hansen, D.; Wens, I.; Eijnde, B.O. Impact of high-intensity concurrent training on cardiovascular risk factors in persons with multiple sclerosis–pilot study. Disabil. Rehabil. 2019, 41, 430–435. [Google Scholar] [CrossRef]
- Benlloch, M.; López-Rodríguez, M.M.; Cuerda-Ballester, M.; Drehmer, E.; Carrera, S.; Ceron, J.J.; Tvarijonaviciute, A.; Chirivella, J.; Fernández-García, D.; de la Rubia Ortí, J.E. Satiating effect of a ketogenic diet and its impact on muscle improvement and oxidation state in multiple sclerosis patients. Nutrients 2019, 11, 1156. [Google Scholar] [CrossRef]
- Bisht, B.; Darling, W.G.; Grossmann, R.E.; Shivapour, E.T.; Lutgendorf, S.K.; Snetselaar, L.G.; Hall, M.J.; Bridget Zimmerman, M.; Mahls, T.L. A multimodal intervention for patients with secondary progressive multiple sclerosis: Feasibility and effect on fatigue. J. Altern. Complement. Med. 2014, 20, 347–355. [Google Scholar] [CrossRef]
- Brenton, J.N.; Banwell, B.; Christina Bergqvist, A.G.; Lehner-Gulotta, D.; Gampper, L.; Leytham, E.; Coleman, R.; Goldman, M.D. Pilot study of a ketogenic diet in relapsing-remitting MS. Neurol. Neuroimmunol. Neuroinflamm. 2019, 6. [Google Scholar] [CrossRef]
- Platero, J.L.; Cuerda-Ballester, M.; Sancho-Cantus, D.; Benlloch, M.; Ceron, J.J.; Peres Rubio, C.; García-Pardo, M.P.; López-Rodríguez, M.M.; de la Rubia Ortí, J.E. The Impact of Epigallocatechin Gallate and Coconut Oil Treatment on Cortisol Activity and Depression in Multiple Sclerosis Patients. Life 2021, 11, 353. [Google Scholar] [CrossRef]
- Turner, A.P.; Hartoonian, N.; Sloan, A.P.; Benich, M.; Kivlahan, D.R.; Hughes, C.; Hughes, A.J.; Haselkorn, J.K. Improving fatigue and depression in individuals with multiple sclerosis using telephone-administered physical activity counseling. J. Consult. Clin. Psychol. 2016, 84, 297. [Google Scholar] [CrossRef]
- White, L.J.; McCoy, S.C.; Castellano, V.; Ferguson, M.A.; Hou, W.; Dressendorfer, R.H. Effect of resistance training on risk of coronary artery disease in women with multiple sclerosis. Scand. J. Clin. Lab. Investig. 2006, 66, 351–356. [Google Scholar] [CrossRef]
- Munger, K.L. Childhood obesity is a risk factor for multiple sclerosis. Mult. Scler. J. 2013, 19, 1800. [Google Scholar] [CrossRef] [PubMed]
- Backus, D. Increasing physical activity and participation in people with multiple sclerosis: A review. Arch. Phys. Med. Rehabil. 2016, 97, S210–S217. [Google Scholar] [CrossRef] [PubMed]
- Lambert, C.P.; Lee Archer, R.; Evans, W.J. Body composition in ambulatory women with multiple sclerosis. Arch. Phys. Med. Rehabil. 2002, 83, 1559–1561. [Google Scholar] [CrossRef] [PubMed]
- Wingo, B.C.; Young, H.J.; Motl, R.W. Body composition differences between adults with multiple sclerosis and BMI-matched controls without MS. Disabil. Health J. 2018, 11, 243–248. [Google Scholar] [CrossRef]
- Sandroff, B.M.; Motl, R.W.; Scudder, M.R.; DeLuca, J. Systematic Evidence-Based Review of Exercise Physical, Activity, and Physical Fitness Effects on Cognition in Persons with Multiple Sclerosis. Neuropsychol. Rev. 2016, 26, 271–294. [Google Scholar] [CrossRef]
- Charron, S.; McKay, K.A.; Tremlett, H. Physical activity and disability outcomes in multiple sclerosis: A systematic review (2011–2016). Mult. Scler. Relat. Disord. 2018, 20, 169–177. [Google Scholar] [CrossRef]
- Mousavi-Shirazi-Fard, Z.; Mazloom, Z.; Izadi, S.; Fararouei, M. The effects of modified anti-inflammatory diet on fatigue, quality of life, and inflammatory biomarkers in relapsing-remitting multiple sclerosis patients: A randomized clinical trial. Int. J. Neurosci. 2020, 131, 657–665. [Google Scholar] [CrossRef]
- Snetselaar, L.G.; Cheek, J.J.; Fox, S.S.; Healy, H.S.; Schweizer, M.L.; Bao, W.; Kamholz, J.; Titcomb, T.J. Efficacy of Diet on Fatigue and Quality of Life in Multiple Sclerosis: A systematic review and network meta-analysis of randomized trials. Neurology 2023, 100, e357–e366. [Google Scholar] [CrossRef]
- Farinotti, M.; Vacchi, L.; Simi, S.; Di Pietrantonj, C.; Brait, L.; Filippini, G. Dietary interventions for multiple sclerosis. Cochrane Database System. Rev. 2012, 12. [Google Scholar] [CrossRef]
- Parks, N.E.; Jackson-Tarlton, C.S.; Vacchi, L.; Merdad, R. Dietary interventions for multiple sclerosis-related outcomes. Cochrane Database System. Rev. 2020. [Google Scholar] [CrossRef]
- Mische, L.J.; Mowry, E.M. The Evidence for Dietary Interventions and Nutritional Supplements as Treatment Options in Multiple Sclerosis: A Review. Curr. Treat. Options Neurol. 2018, 20, 8. [Google Scholar] [CrossRef] [PubMed]
- Tredinnick, A.R.; Probst, Y.C. Evaluating the Effects of Dietary Interventions on Disease Progression and Symptoms of Adults with Multiple Sclerosis: An Umbrella Review. Adv. Nutr. 2020, 11, 1603–1615. [Google Scholar] [CrossRef] [PubMed]
- Penesová, A.; Dean, Z.; Kollár, B.; Havranová, A.; Imrich, R.; Vlček, M.; Rádiková, Ž. Nutritional intervention as an essential part of multiple sclerosis treatment? Physiol. Res. 2018, 67, 521–533. [Google Scholar] [CrossRef]
- Krysko, K.M.; Bove, R.; Dobson, R.; Jokubaitis, V.; Hellwig, K. Treatment of women with multiple sclerosis planning pregnancy. Curr. Treat. Options Neurol. 2021, 23, 11. [Google Scholar] [CrossRef] [PubMed]
- Dunn, S.E.; Steinman, L. The Gender Gap in Multiple Sclerosis: Intersection of Science and Society. JAMA Neurol. 2013, 70, 634–635. [Google Scholar] [CrossRef]
- Harbo, H.F.; Gold, R.; Tintoré, M. Sex and gender issues in multiple sclerosis. Ther. Adv. Neurol. Disord. 2013, 6, 237–248. [Google Scholar] [CrossRef]
- Straight, C.R.; Brady, A.O. Evans E Sex-specific relationships of physical activity, body composition, and muscle quality with lower-extremity physical function in older men and women. Menopause 2015, 22, 297–303. [Google Scholar] [CrossRef]
- Schorr, M.; Dichtel, L.E.; Gerweck, A.V.; Valera, R.D.; Torriani, M.; Miller, K.K.; Bredella, M.A. Sex differences in body composition and association with cardiometabolic risk. Biol. Sex Differ. 2018, 9, 28. [Google Scholar] [CrossRef]
- Bredella, M.A. Sex Differences in Body Composition. In Sex and Gender Factors Affecting Metabolic Homeostasis, Diabetes and Obesity; Mauvais-Jarvis, F., Ed.; Springer International Publishing: Cham, Switzerland, 2017; pp. 9–27. [Google Scholar]
- Tindall, A.M.; Stallings, V.A. Sex differences in cardiovascular risk may be related to sex differences in diet patterns: A narrative review. Ann. Hum. Biol. 2021, 48, 517–524. [Google Scholar] [CrossRef]
- Surakka, J.; Romberg, A.; Ruutiainen, J.; Aunola, S.; Virtanen, A.; Karppi, S.L.; Mäentaka, K. Effects of aerobic and strength exercise on motor fatigue in men and women with multiple sclerosis: A randomized controlled trial. Clin. Rehabil. 2004, 18, 737–746. [Google Scholar] [CrossRef]
- Anens, E.; Emtner, M.; Zetterberg, L.; Hellström, K. Physical activity in subjects with multiple sclerosis with focus on gender differences: A survey. BMC Neurol. 2014, 14, 47. [Google Scholar] [CrossRef] [PubMed]
- Gunn, H.; Creanor, S.; Haas, B.; Marsden, J.; Freeman, J. Frequency, characteristics, and consequences of falls in multiple sclerosis: Findings from a cohort study. Arch. Phys. Med. Rehabil. 2014, 95, 538–545. [Google Scholar] [CrossRef] [PubMed]
- Koch-Henriksen, N.; Brønnum-Hansen, H.; Stenager, E. Underlying cause of death in Danish patients with multiple sclerosis: Results from the Danish Multiple Sclerosis Registry. J. Neurol. Neurosurg. Psychiatry 1998, 65, 56–59. [Google Scholar] [CrossRef] [PubMed]
- Bisson, E.J.; Finlayson, M.L.; Ekuma, O.; Ekuma, O.; Marrie, R.A.; Leslie, W.D. Accuracy of FRAX® in People with Multiple Sclerosis. J. Bone Miner. Res. 2019, 34, 1095–1100. [Google Scholar] [CrossRef]
- Ye, S.; Wu, R.; Wu, J. Multiple sclerosis and fracture. Int. J. Neurosci. 2013, 123, 609–616. [Google Scholar] [CrossRef]
- Ross, B.J.; Ross, A.J.; Lee, O.C.; Waters, T.L.; Familia, M.M.; Sherman, W.F. Osteoporosis management and secondary fragility fracture rates in patients with multiple sclerosis: A matched cohort study. Osteoporos. Int. 2022, 33, 1999–2010. [Google Scholar] [CrossRef]
- Fares, A. Pharmacological and Non-pharmacological Means for Prevention of Fractures among Elderly. Int. J. Prev. Med. 2018, 9, 78. [Google Scholar] [CrossRef]
- Hong, A.R.; Kim, S.W. Effects of Resistance Exercise on Bone Health. Endocrinol. Metab. 2018, 33, 435–444. [Google Scholar] [CrossRef]
- Wilson, D.J. Osteoporosis and sport. Eur. J. Radiol. 2019, 110, 169–174. [Google Scholar] [CrossRef]
- Benedetti, M.G.; Furlini, G.; Zati, A.; Mauro, G.L. The Effectiveness of Physical Exercise on Bone Density in Osteoporotic Patients. BioMed Res. Int. 2018, 2018, 4840531. [Google Scholar] [CrossRef]
- Maillane-Vanegas, S.; Agostinete, R.R.; Lynch, K.R.; Ito, I.H.; Luiz-de-Marco, R.; Rodrigues-Junior, M.A.; Turi-Lynch, B.C.; Fernandes, R.A. Bone Mineral Density and Sports Participation. J. Clin. Densitom. 2020, 23, 294–302. [Google Scholar] [CrossRef] [PubMed]
- Schroll, J.B.; Moustgaard, R.; Gøtzsche, P.C. Dealing with substantial heterogeneity in Cochrane reviews. Cross-sectional study. BMC Med. Res. Methodol. 2011, 11, 22. [Google Scholar] [CrossRef] [PubMed]


| Component 1 | Component 2 | |
|---|---|---|
| “Multiple Sclerosis” [Mesh] OR “Multiple Sclerosis” [Mesh:NoExp] OR “multiple scleros*” [tiab] OR “Multiple Sclerosis, Relapsing-Remitting” [Mesh] OR “PwMS” | AND | “Body Weights and Measures” [Mesh] OR “Body mass index” [Mesh] OR “Body Weights and Measures” [Mesh:NoExp] OR “Body mass index” [Mesh:NoExp] OR “Body Composition” [Mesh] OR adiposity [tiab] OR “body fat” [tiab] OR “Waist Circumference*” [tiab] OR “Skinfold* Thick*” [tiab] OR “body compos*” [tw] OR “Bone Density” [Mesh] OR “mineral density” [tiab] OR “bone adj1 density |
| Study | Study Design | Intervention Group | Comparator | Inter. Type | Outcomes of Interest | |||||||
|---|---|---|---|---|---|---|---|---|---|---|---|---|
| Total Sample - %Females | Age | MS Type - EDSS | BMI, BC and BMD At Baseline | Total Sample - %Females | Age | Pathology - EDSS | BMI, BC and BMD At Baseline | |||||
| 1 | Straudi et al., 2022 [55] | RCT | 18 - 38.9 | 49.7 ± 13.6 | 27.8% PPMS 27.8% SPMS 44.4% RRMS - 4.6 ± 0.7 | BMI: 24.3 ± 4.13 | 18 - 33.3 | 52.6 ± 12.6 | 33.3% PPMS 27.8% SPMS 38.9% RRMS - 4.8 ± 0.6 | BMI: 26.3 ± 4.0 | P | BMI |
| 2 | Brenton et al., 2022 [40] | Single-group pre-test–post-test trial | 65 - 84.6 | 40 (15–54) ° | RRMS - 2.3 ± 0.9 | BMI: 33.2 ± 7.0 FM: 41.3 ± 16.1 FFM 51.9 ± 10.7 WC 104.8 ± 14.2 | - | - | - | - | D | BMI, WC, %F (Bodpod) |
| 3 | Aristotelous et al., 2021 [32] | RCT | 18 - 50.0 | 39.1 ± 8.7 | RRMS - 2.2 ± 1.1 | BMI: 25.1 ± 4.4 %F: 29.4 ± 7.0 | 18 - 60.0 | 38.1 ± 5.3 | RRMS - 2.36 ± 1.09 | BMI: 25.1 ± 5.4 %F: 29.0 ± 9.2 | D | BMI, BC (BIA) |
| 4 | Keytsman et al., 2021 [66] | RCT | 15 - 60.0 | 41 ± 9 | Any - 2.0 ± 1.3 | BMI: 25.1 ± 3.2 %F: 30.3 ± 8.8 FFM: 48.2 ± 8.2 | 13 - 61.5 | 43 ± 9 | MS - 2.7 ± 1.3 | BMI: 27.4 ± 3.4 %F: 35.9 ± 4.9 | PA | BMI, %F (DEXA) |
| 5 | de la Rubia Ortí et al., 2021; [49] Platero et al., 2021 [78], 2020 [79]; Benlloch et al., 2020 [56] | RCT | 25 - 81.5 | 44.6 ± 11.3 | 74.1% RRMS 25.9% SPMS - 3.37 ± 2.03 | BMI: 25.9 ± 5.3 %F: 19.3 ± 4.0 WHR: 0.89 ± 0.10 WHTR: 0.57 ± 0.08 | 21 - 58.3 | 49.83 ± 12.42 | 70.8% RRMS 29.2% SPMS - 3.8 ± 2.00 | BMI: 25.7 ± 6.0 %F: 19.1 ± 5.0 WHR: 0.95 ± 0.08; WHTR: 0.60 ± 0.08 | D | BMI, %F (skinfolds, diameters, perimeters), WHR, WHTR |
| 6 | Montealegre et al., 2020 [44] | RCT | 5 | - | SPMS | BMD: 2.03 ± 0.39 g/cm2 FM: 29.45 ± 8.35 | - | - | - | - | PA | BC, BMD (DEXA) |
| 7 | Wingo et al., 2020 [73] | Single-group pre-test–post-test trial | 20 - 85.0 | 46.2 ± 11.6 | RRMS - 3.3 (2.0, 4.4) ° | BMI: 34.7 ± 6.4 FM:43.2 ± 11.0 LBM: 48.2 ± 10.2 WC: 110.4 ± 13.9 | - | - | - | - | D | BMI, %F (DEXA) |
| 8 | Benlloch et al., 2019 [75] | A prospective, mixed and quasi-experimental pilot study | 27 - 81.5 | 44.6 ± 11.3 | 74.1% RRMS; 22.2% SPMS; 3.7% PPMS - N.A. | %F: 19.5 ± 3.8 | - | - | - | - | D | BMI, %F (skinfolds) |
| 9 | Brenton et al., 2019 [77] | Single-arm, uncontrolled, open-label pilot study | 20 - 85.0 | 38 (15–50) ° | RRMS - 2.2 ± 0.9 | BMI: 34.1 ± 6.9 FM: 42.5 ± 16.6 FFM: 51.1 ± 10.8 | - | - | - | - | D | BMI, WC, %F (Bodpod) |
| 10 | Keytsman et al., 2019 [68] | Non-randomized trial | 18 - 33.3 | 41.7 ± 8.5 | N.A. - 1.9 ± 1.1 | BMI: 24.8 ± 3.9 %F: 23.8 ± 9.6 FFM: 51.1 ± 7.4 | 19 - 26.3 | 41.5 ± 9.9 | Healthy | BMI: 24.6 ± 2.8 %F: 22.7 ± 7.5 FFM: 53.3 ± 9.8 | PA | BMI, %F (via DEXA) |
| 11 | Keytsman et al., 2019 [74] | Single group pre-test–post-test trial | 16 - 56.2 | 52.8 ± 7.2 | N.A. - 2.6 ± 1.5 | BMI: 23.5 ± 3.3 %F: 29 ± 6.7 LBM: 44.2 ± 10.7 | - | - | - | - | PA | BMI, %F (via DEXA) |
| 12 | Orban et al., 2019 [38] | RCT | 10 - 90.0 | 44.7 ± 9.4 | RRMS - 3.5 (2.5–4) | BMI: 26.9 ± 4.4; %F: 32.9 ± 11.9; FFM: 46.6 ± 7.0 | 7 - 75.0 | 48.7 ± 8.4 | RRMS - 3 (2–4) | BMI: 29.6 ± 7.1; %F: 23.3 ± 7.1; FFM: 61.8 ± 9.7 | PA | BMI, %F, lean body mass (BIA) |
| 13 | Pareja et al., 2019 [45] | Pre-test–post-test longitudinal design | 11 - 63.6 | 46.5 ± 6.9 | - | F%: 37.1 ± 7.1 FFM: 40.3 ± 7.6 BMD: 1.09 ± 0.15 g/cm2 | - | - | - | - | PA | BMD, %F (DEXA) |
| 14 | Barry et al., 2018 [67] | Non-randomized trial | 9 - 88.9 | 35.3 ± 2.1 | RRMS - 2.2 ± 0.40 | BMI: 27.9 ± 2.1 | 10 - 80.0 | 36.0 ± 2.0 | Healthy | BMI: 24.6 ± 1.2 | PA | BMI |
| 15 | Duff et al., 2018 [33] | RCT | 15 - 80.0 | 45.7 ± 9.4 | 93.3% RRMS, 6.7% PPMS - N.A. | %F: 32.7 ± 8.3; FFM: 50.9 ± 11.6 | 15 - 73.3 | 45.1 ± 7.4 | 73.3% RRMS, 13.3% SPMS, 13.3% PPMS - N.A. | %F: 32.2 ± 10.5; FFM: 51.7 ± 11.5 | PA | BC (DEXA) |
| 16 | Eftekhari and Etemadifar, 2018 [50] | RCT | 13 - 100.0 | 34.5 ± 7.3 | RRMS - N.A. | BMI: 24.4 ± 5.4; %F: 35.1 ± 9.5; FFM: 37.3 ± 3.7; WC: 85.2 ± 16.9; WHR: 0.83 ± 0.08 | 12 - 100.0 | 31.41 ± 8.89 | RRMS - N.A. | BMI: 24.66 ± 4.64; %F: 36.2 ± 6.1; FFM (kg): 40.1 ±4.8; WC: 87.4 ± 11.5; WHR: 0.85 ± 0.07 | PA | BMI, WC, HC, WHR, BC (skinfolds) |
| 17 | Khademosharie et al., 2018 [65] | RCT | 10 - 100.0 | 20–50 | PPMS, SPMS - 3.1 ± 0.5 | Weight: 60.8 ± 13.3; %F: 36.3 ± 8.6 | 10 - 100.0 | 20–50 | PPMS, SPMS - 3.8 ± 1.1 | Weight: 59.7 ± 11; %F: 33.6 ± 8.1 | PA | Weight, %F (skinfolds) |
| 18 | Negaresh et al., 2019 [42]; Mokhtarzade et al., 2018 [51] | RCT | Group 1: 17 - 64.7 | 31.2 ± 3.1 | RRMS - 1.5 ± 0.8 | BMI: 21.4 ± 0.8 | Group 1: 14 - 64.3 | 29.1 ± 3.0 | RRMS - 1.4 ± 1.0 | BMI: 21.8 ± 1.6 | PA | BMI |
| Group 2: 17 - 64.7 | 32.1 ± 2.1 | RRMS - 1.8 ± 0.8 | BMI: 27.7 ± 1.3 | Group 2: 13 - 69.2 | 32.2 ± 3.3 | RRMS - 1.7 ± 1.2 | BMI: 28.3 ± 1.3 | |||||
| 19 | Fitzgerald et al., 2018 [52] | RCT | Group 1: 11 - 81.8 | Group 1: 40.5 ± 5.4 | - | %F: 47.4 ± 7.8; FFM: 45.0 ± 11.2; WC: 104.3 ± 21.4; | 9 - 66.7 | 33.3 ± 7.0 | MS (Any type) | %F: 44.9 ± 4.6; FFM: 45.2 ± 9.7; WC: 101.1 ± 16.6 | D | BMI, BC (DEXA), WC, HC |
| Group 2: 11 - 81.8 | Group 2: 38.5 ± 7.4 | - | %F: 44.8 ± 7.3; FFM: 44.3 ± 7.8; WC: 96.4 ± 10.9 | |||||||||
| 20 | Yang et al., 2018 [46] | Single-group pre-test–post-test longitudinal design | 22 - 72.0 | 50.3 ± 14.1 | 16% RRMS; 5% SPMS; 1% PPMS; 3% UNMS - N.A. | BMD T-score: 0.61 ± 1.85 (stronger side) | - | - | - | . | PA | BMD (QUS) |
| 21 | Mokhtarzade et al., 2017 [59] | RCT | 22 - 100.0 | 32.0 ± 2.81 | RRMS - 1.84 ± 0.35 | BMI: 27.1 ± 2.5; %F: 34.66 ± 5.68 | 18 - 100.0 | 31.27 ± 3.28 | RRMS - 1.57 ± 0.64 | BMI: 26.2 ± 1.7; %F: 35.4 ± 4.5 | PA | BMI, %F (skinfolds) |
| 22 | Tamtaji et al., 2017 [39] | RCT | 20 - N.A. | 32.8 ± 9.2 | RRMS - ≤4.5 | BMI: 25.6 ± 4.6 | 20 - N.A. | 34.9 ± 8.9 | RRMS - ≤4.5 | BMI: 24.7 ± 3.7 | PS | Weight, height, BMI |
| 23 | Wens et al., 2017 [53]; 2015 [61] | RCT | Group 1: 12 - 58.3 | 43 ± 3 | RRMS: 18; CP: 5 - 2.3 ± 0.3 | Group 1: BMI: 26.1 ± 1.14; %F: 36.2 ± 1.9; FFM: 48.5 ± 3.1 | 11 - 81.8 | 47 ± 3 | RRMS: 8; CP: 3 - 2.5 ± 0.3 | BMI: 27.0 ± 1.4; %F: 38.2 ± 2.1; FFM: 43.2 ± 2.1 | PA | BC (DEXA), |
| Group 2: 11 - 54.5 | 47 ± 3 | RRMS: 18; CP: 5 - 2.7 ± 0.3 | BMI: 24.4 ± 1.2; %F: 33.6 ± 2.8 FFM: 45.4 ± 2.6 | |||||||||
| 24 | Riccio et al., 2016 [60] | RCT | Group 1: 11 - 90.9 | - | 72.4% RRMS; 27.6% PPMS - N.A. | BMI: 25.2 ± 1.5; WC: 89.6 ± 3.6; HC: 102.7 ± 1.2; WHR: 0.87 ± 0.03 | 10 - 80.0 | - | RRMS - 23.4 ±4.7 | BMI:23.4 ± 1.2; WC: 83.8 ± 2.7 HC: 97.2 ± 2.4 WHR: 0.87 ± 0.02 | D | BMI, WC, HC |
| Group 2: 10 - 80.0 | - | BMI: 24.2 ± 0.9; WC: 89.6 ± 2.6; HC: 102.0 ± 1.0; WHR: 0.89 ± 0.02 | ||||||||||
| Group 3: 8 - 37.5 | - | BMI: 24.9 ± 1.1; WC: 96.3 ± 2.5; HC: 105.1 ± 3.0; WHR: 0.95 ± 0.05 | ||||||||||
| 25 | Wens et al., 2016 [63] | RCT | 15 - 60.0 | 42 ± 3 | RRMS - 2.7 ± 0.3 | %F: 37.1 ± 2.5; FFM: 41.9 ± 2.6 | 7 - 71.4 | 44 ± 2 | RRMS - 2.0 ± 0.3 | %F: 38.8 ± 3.2; FFM: 36.8 ± 3.2 | PA | BC (DEXA) |
| 26 | Yadav et al., 2016 [64] | RCT | 26 - 96.9 | 40.8 ± 8.86 | N.A. - 2.72 ± 1.05 | BMI: 29.6 ± 1.4 | 27 - 89.6 | 40.9 ± 8.48 | N.A. - 2.22 ± 0.90 | BMI: 28.1 ± 1.3 | D | BMI |
| 27 | Wens et al., 2015 [62] | RCT | 29 - 58.6 | 48 ± 2 | RRMS: 17; CP: 17 - 3.25 ± 0.2 | BMI: 22.6 ± 0.9; %F: 35.3 ± 1.5; FFM: 41.8 ± 1.7 | 15 - 53.3 | 49 ± 2 | RRMS: 11; CP: 4 - 3.36 ± 0.4 | BMI: 22.9 ± 1.3; %F: 36.5 ± 2.4; FFM: 41.8 ± 2.4 | PA | BC (DEXA) |
| 28 | Bisht et al., 2014 [76] | Single-arm open-label intervention study | 9 - 90.0 | 52.4 ± 4.1 | SPMS - N.A. | BMI: 25.5 ± 4.7 | - | - | - | - | Multimodal intervention | BMI |
| 29 | Pilutti et al., 2014 [34] | RCT | 35 - 73.2 | 48.4 ± 9.1 | N.A. - 3.5 (4.25) Self-reported | BMI: 27.9 ± 7.7; BMD: 1.10 ± 0.09 g/cm2; %F: 33.7 ± 8.8; LBM 48.5 ± 1.0 | 37 - 78.0 | 49.5 ± 9.2 | N.A. - 3.5 (4.5) Self-reported | BMI: 27.6 ± 6.4; BMD: 1.102 ± 0.100 g/cm2; FM% 35.7 ± 7.8 LBM 46.4.2 ± 8.9 | PA | BMI; BC, BMD (DEXA) |
| 30 | Schmidt and Wonneberger, 2014 [72] | Pre-test–post-test longitudinal design | 60 - 76.7 | 38.3 ± 8.4 | RRMS - 1.9 ± 0.6 | BMI: 24.7 ± 4.2; %F:19.2 ± 3.7 | - | - | - | - | PA | %F (skinfolds) |
| 31 | Carter et al., 2013 [41] | RCT | 14 - 87.5 | 39.5 ± 6.5 | N.A. - 3.0 ± 1.1 | BMI:26.7 ± 5.7; WHR: 0.79 ± 0.07 | 12 - 82.3 | 40.9 ± 8.7 | N.A. - 3.1 ± 1.7 | BMI: 26.6 ± 5.4; WHR: 0.80 ± 0.08 | PA | BMI, WC, HC |
| 32 | Learmonth et al., 2012 [58] | RCT | 15 - 75.0 | 51.4 ± 8.06 | N.A. - 6.14 ± 0.36 | BMI: 28.7 ± 5 | 10 - 71.4 | 51.8 ± 8.0 | N.A. - 5.82 ± 0.51 | BMI: 31.4 ± 5.9 | PA | BMI |
| 33 | Dalgas et al., 2010 [57] | RCT | 15 - 66.7 | 47.7 ± 10.4 | N.A. - 3.7 ± 0.9 | Weight: 70.1 ± 14.2; %F BIA: 28.4 ± 6.4; %F Sk: 31.7 ± 6.8 | 16 - 62.5 | 49.1 ± 8.4 | N.A. - 3.9 ± 0.9 | Weight: 66.9 ± 15.2; %F BIA: 27.9 ± 9.7; %F Sk: 31.1 ± 8.0 | PA | %F (skinfolds, BIA) |
| 34 | Castellano et al., 2008 [69] | Non-randomized controlled trial | 11 - 72.7 | 40 ± 10 | RRMS - (0–5.5) | BMI: 24 ± 4; %F: 35.6 ± 8 | 11 - 72.7 | 40 ± 10 | Healthy | BMI: 27 ± 5; %F: 37.6 ± 9 | PA | BMI, %F, WHR |
| 35 | Fragoso et al., 2008 [70] | Pre-post test longitudinal design | 9 - 88.9 | 35.4 ± 11.6 | 8% RRMS; 1% SRMS - 1.8 ± 1.8 | BMI: 24.4 ± 4.1 %F: 19.4 ± 6.6 FFM: 47.6 ± 9.4 | - | - | - | - | PA | BMI; %F |
| 36 | White et al., 2006 [71,80] | Pre-test–post-test longitudinal design | 12 - 100.0 | 47.3 ± 4.7 | RRMS - N.A. | BMI: 25.4 ± 5.9 %F: 33.5 ± 7.2 | - | - | - | PA | BMI, %F (skinfolds) | |
| Study design |
|
| Comparator |
|
| Phenotype of MS |
|
| EDSS scale |
|
| Sample size |
|
| Gender of the intervention sample |
|
| Age of the intervention sample |
|
| Study | Intervention Group | Comparator | Key Findings | |||||
|---|---|---|---|---|---|---|---|---|
| Characteristics of Intervention | Duration | Times (mins) | Freq (x/wk) | Intensity | Characteristics of Intervention | |||
| 1 | Straudi et al., 2022 [55] | Task-oriented circuit training (TOCT) (2 weeks supervised and 12 weeks home-based) | 14 weeks | 60 | 3 | Usual care | =BMI | |
| 2 | Keytsman et al., 2021 [66] | Periodized HIIT training program | 12 weeks | 60 | Week 1, 3: 3; Week 2: 2 | Low/moderate | Classic endurance intervention | ↑ BMI in IG =F% and FFM in IG ↓ %F in CG |
| 3 | Montealegre et al., 2020 [44] | Power and hypertrophic training programs | 7 weeks | - | H: 65–80% RM; P: 30–70% RM | - | - | ↓ BMD Hypertrophic group |
| 4 | Keytsman et al., 2019 [68] | High-intensity exercise home-based program (cycling) | 6 months | 3 | High-intensity home-based exercise program (cycling) (same) | ↓ weight and BMI in MS group =%F and FFM in both groups | ||
| 5 | Keytsman et al., 2019 [74] | High-intensity concurrent training (HICT) | 12 weeks | 5 in two weeks | - | - | =%F and LBM | |
| 6 | Orban et al., 2019 [38] | High-intensity aerobic exercise program | 8 weeks | 30 | 4 | 70% of maximal HR | Guided static stretching program for 30 min·d—1, 4 d·wk—1, for 8 wk | ↓ %F ↑ LBM |
| 7 | Pareja et al., 2019 [45] | Resistance training | 10 weeks | =%F and BMD | ||||
| 8 | Barry et al., 2018 [67] | Short-term cycle ergometer training | 8 weeks | 30 | 1 | 65–75% age-predicted max heart rate | Short-term cycle ergometer training (same) | ↓ BMI in the MS group |
| 9 | Duff et al., 2018 [33] | Pilates and massage therapy | 12 weeks | 50 | 2 | Massage therapy (1/w, 1 h) | =%F and LBM | |
| 10 | Eftekhari and Etemadifar, 2018 [50] | Clinical mat Pilates | 8 weeks | 30–40 | 3 | low to moderate | No Pilates | ↓ BW, BMI, WC, HC, %F =WHR and FFM |
| 11 | Khademosharie et al., 2018 | Resistance and endurance training program | 24 weeks | Not fixed | 3 | gradually increased | No additional exercise program | ↓ %F |
| 12 | Negaresh et al., 2019 [42]; Mokhtarzade et al., 2018 [51] | Short-term interval exercise training | 8 weeks | 3 | 60–70% peak power | No additional exercise program | =BMI | |
| 13 | Yang et al., 2018 [46] | Controlled whole-body vibration training | 8 weeks | 5 | 3 | - | - | ↑ BMD |
| 14 | Mokhtarzade et al., 2017 [59] | Aerobic interval training | 8 weeks | 3 | No additional exercise program | ↓ weight, BMI and %F | ||
| 15 | Wens et al., 2016 [63] | Endurance and resistance training | 24 weeks | increasing (from 45 to 75) | 2.5 | mild to moderate | No additional exercise program | =BMI, %F ↑ LBM |
| 16 | Wens et al., 2015 [61]; Wens et al., 2017 [53] | High-intensity training divided into the following:
| 12 weeks | Not fixed | 5 in two weeks | increasing | No additional exercise program (sedentary) | ↓ %F in HITR and HCTR groups ↑ LBM HCTR group |
| 17 | Wens et al., 2015 [62] | Resistance and endurance training | 24 weeks | increasing | 2.5 (5/2 weeks) | increasing | No additional exercise program | ↑ LBM =weight and %F |
| 18 | Bisht et al., 2014 [76] | Modified paleolithic diet with supplements, stretching, strengthening exercises with electrical stimulation of trunk and lower limb muscles, meditation, and massage | 12 months | - | ↓ weight and BMI | |||
| 19 | Pilutti et al., 2014 [34] | Internet-delivered physical activity behavioral intervention (primarily walking) | 6 months | Monthly appointments with a behavioral coach | No behavioral intervention | =BMI and LBM ↓ %F ↑ BMD | ||
| 20 | Schmidt and Wonneberger, 2014 [72] | Individualized aerobic endurance exercise | 12 months | 30 | 3 | ↓ %F | ||
| 21 | Carter et al., 2013 [41] | Pragmatic physical intervention (range of aerobic and body conditioning exercise options) | 10 weeks | 60 | 3 (2 supervised and 1 at home) | 50 to 69% age predicted max HR | No additional exercise program | =BMI and WHR |
| 22 | Dalgas et al., 2010 [57] | Lower body progressive resistance training program | 12 weeks | 2 | No additional exercise program | =%F | ||
| 23 | Learmonth et al., 2012 [58] | Leisure exercise intervention (including mobility, balance, and resistance exercises) | 12 weeks | 60 | 2 | No additional exercise program | =BMI | |
| 24 | Castellano et al., 2008 [69] | Aerobic training program (cycle ergometry) | 8 weeks | 30 | 3 | 60% peak O2 uptake | Aerobic training program (cycle ergometry) (same) | =BMI, WHR and %F |
| 25 | Fragoso et al., 2008 [70] | Gradual stretching, resistance, and aerobic exercises adapted for each individual | 20 weeks | 60–90 | 3 | No additional exercise program | =%F and FFM | |
| 26 | White et al., 2006 [71,80] | Individualized lower-extremity progressive resistance training | 8 weeks | 30 | increasing | =BMI and %F | ||
| Study | Intervention Group | Comparator | Key Findings | ||
|---|---|---|---|---|---|
| Characteristics of Intervention | Duration | Characteristics of Intervention | |||
| 1 | Brenton et al., 2022 [77] | Ketogenic diet administration | 6 months | No comparator | ↓ BMI, WC, FM, FFM |
| 2 | Aristotelus et al., 2021 [32] | Dietary supplement formula, NeuroaspisTM PLP10 (omega-3, omega-6 PUFAs, specific antioxidant vitamins) | 24 months | Placebo | =BMI, %F in both groups |
| 3 | de la Rubia Ortí et al., 2021 [49]; Platero et al., 2021 [78], 2020 [35]; Benlloch et al., 2020 [56] | Isocaloric Mediterranean diet plus 60 mL of coconut oil and 800 mg epigallocatechin gallate | 4 months | Isocaloric Mediterranean diet plus placebo | ↓ BMI, %F; ↑ FFM |
| 4 | Wingo et al., 2020 [73] | Low glycemic load diet (100 g of carbohydrate and GL of ≤45 points/1000 kcal daily | 12 weeks | No comparator | ↓ BMI, FM, FFM |
| 5 | Benlloch et al., 2020 [75] | Mediterranean isocaloric and ketogenic diet (adapted to each subject, 5 meals/day) 60 mL/day of coconut oil | 4 months | No comparator | ↓ %F, ↑ muscle mass |
| 6 | Brenton et al., 2019 [77] | Ketogenic diet administration (modified Atkins diet) | 6 months | No comparator | ↓ BMI, WC, FM, FFM |
| 7 | Fitzgerald et al., 2018 [52] | Group 1: daily caloric restriction: 22% daily restriction | 8 weeks | Isocaloric diet | =BMI, BC, WC, HC. No significant changes among groups over time. |
| Group 2: intermittent CR diet: 75% restriction, 2 days/week; 0% reduction, 5 days/week | |||||
| 8 | Tamtaji et al., 2017 [39] | Probiotic supplements (Lactobacillus acidophilus, Lactobacillus casei, Bifidobacterium bifidum, and Lactobacillus fermentum) on gene expression related to inflammation, insulin, and lipids | 12 weeks | Placebo | =BMI in both groups |
| 9 | Yadav et al., 2016 [64] | Low-fat, plant-based diet | 12 months | Usual diet | ↓ BMI (more significant and faster in IG than in CG) |
| 10 | Riccio et al., 2016 [60] | Group 1 (RRTD): IFN-b and vitamin D administration + dietary prescription. | 7 months | IFN-b therapy; vitamin D3 administration; no dietary or supplements prescription | =BMI, WC, HC. No significant changes among groups. |
| Group 2 (RRTDI): FN-b therapy, vitamin D, dietary restriction + dietary supplements. | |||||
| Group 3 (PPDI): PPMS patients. Cholecalciferolo administration, dietary control, supplement administration. | |||||
Disclaimer/Publisher’s Note: The statements, opinions and data contained in all publications are solely those of the individual author(s) and contributor(s) and not of MDPI and/or the editor(s). MDPI and/or the editor(s) disclaim responsibility for any injury to people or property resulting from any ideas, methods, instructions or products referred to in the content. |
© 2023 by the authors. Licensee MDPI, Basel, Switzerland. This article is an open access article distributed under the terms and conditions of the Creative Commons Attribution (CC BY) license (https://creativecommons.org/licenses/by/4.0/).
Share and Cite
Rinaldo, N.; Pasini, A.; Straudi, S.; Piva, G.; Crepaldi, A.; Baroni, A.; Caruso, L.; Manfredini, F.; Lamberti, N. Effects of Exercise, Rehabilitation, and Nutritional Approaches on Body Composition and Bone Density in People with Multiple Sclerosis: A Systematic Review and Meta-Analysis. J. Funct. Morphol. Kinesiol. 2023, 8, 132. https://doi.org/10.3390/jfmk8030132
Rinaldo N, Pasini A, Straudi S, Piva G, Crepaldi A, Baroni A, Caruso L, Manfredini F, Lamberti N. Effects of Exercise, Rehabilitation, and Nutritional Approaches on Body Composition and Bone Density in People with Multiple Sclerosis: A Systematic Review and Meta-Analysis. Journal of Functional Morphology and Kinesiology. 2023; 8(3):132. https://doi.org/10.3390/jfmk8030132
Chicago/Turabian StyleRinaldo, Natascia, Alba Pasini, Sofia Straudi, Giovanni Piva, Anna Crepaldi, Andrea Baroni, Lorenzo Caruso, Fabio Manfredini, and Nicola Lamberti. 2023. "Effects of Exercise, Rehabilitation, and Nutritional Approaches on Body Composition and Bone Density in People with Multiple Sclerosis: A Systematic Review and Meta-Analysis" Journal of Functional Morphology and Kinesiology 8, no. 3: 132. https://doi.org/10.3390/jfmk8030132