
The Impact of Perception–Action Training Devices on Quickness and Reaction Time in Female Volleyball Players

 ,
,  ,
,  , ,
, ,  ,
,  ,
, 
Abstract
:1. Introduction
2. Materials and Methods
2.1. Participants
2.2. Experimental Procedure
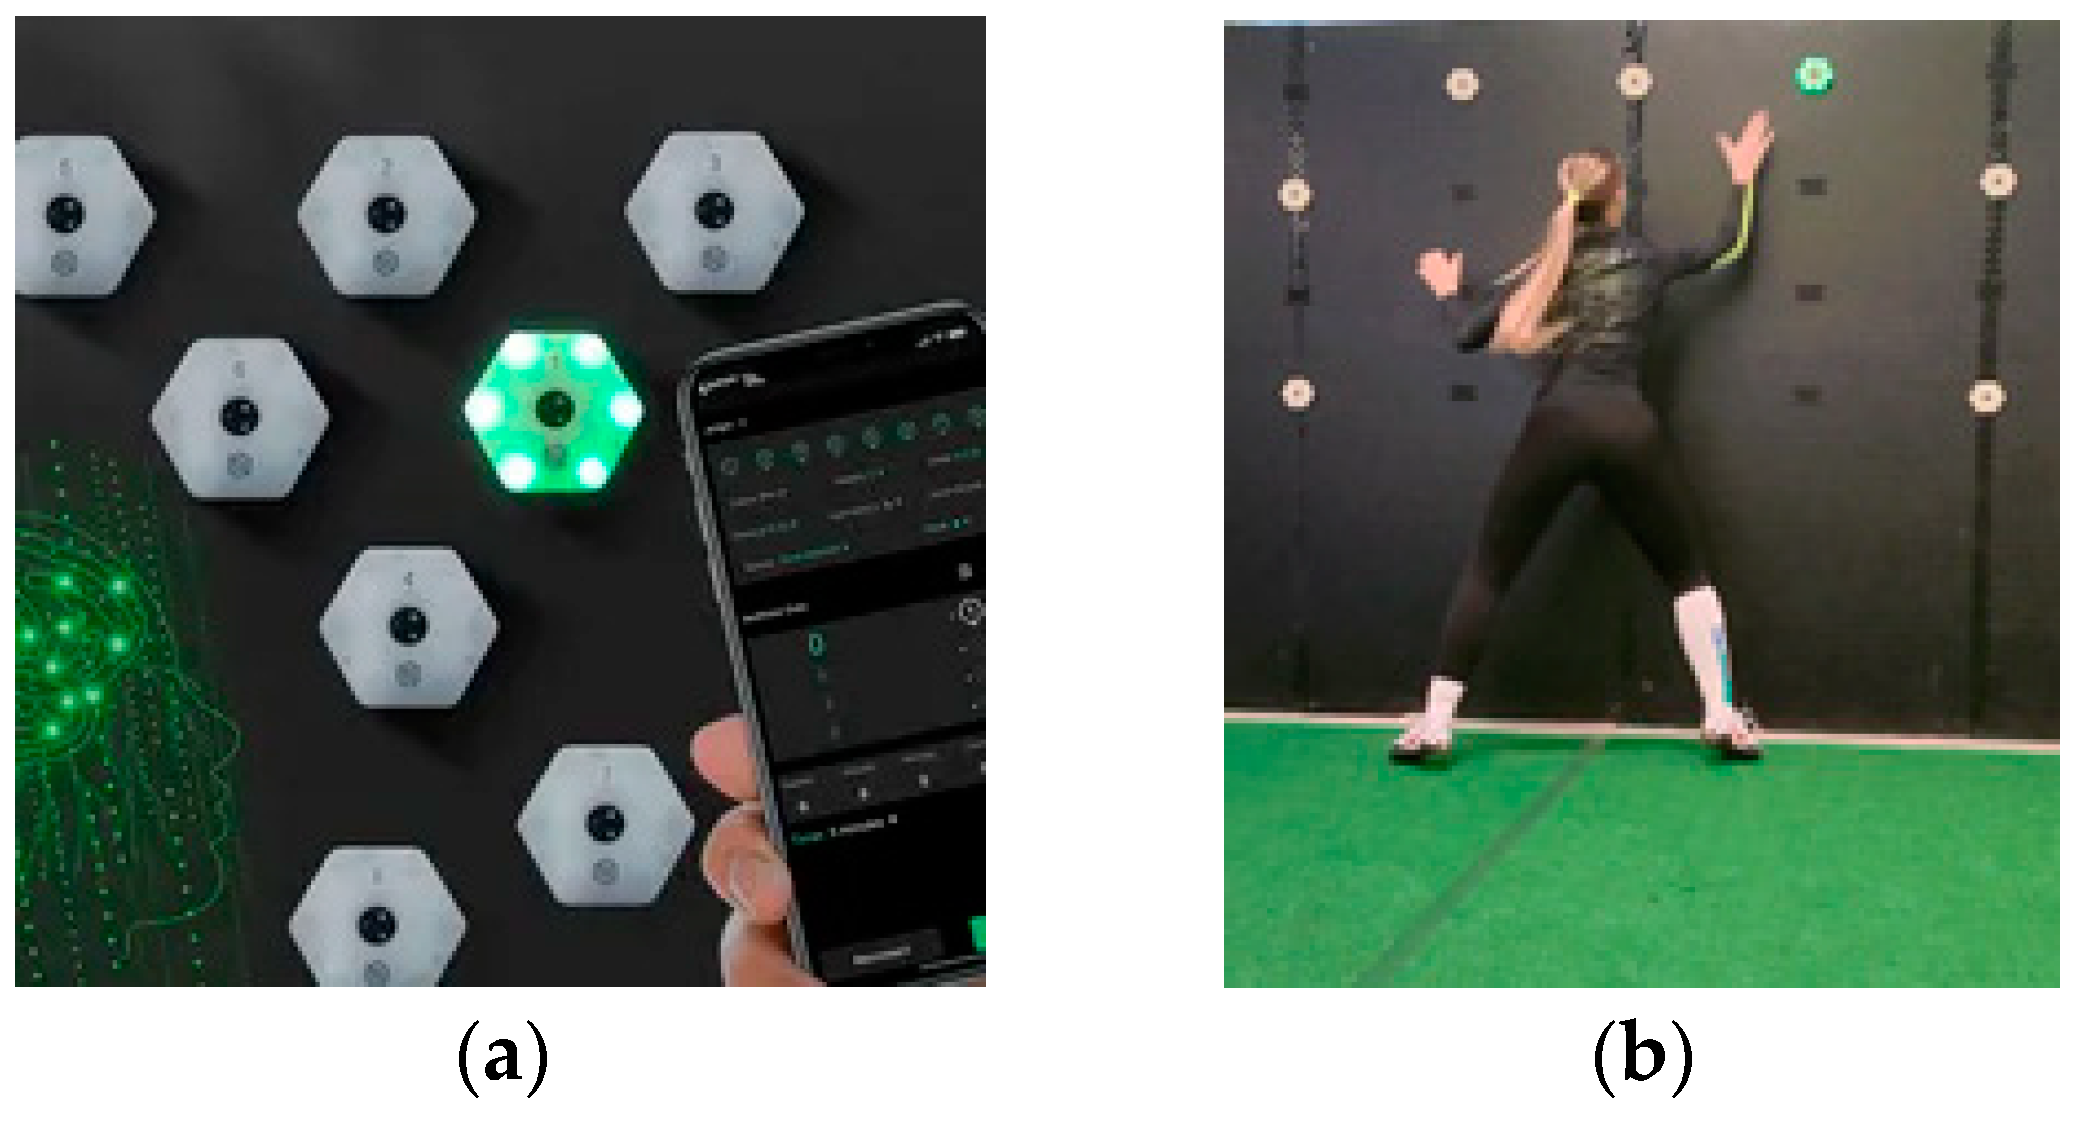
2.3. ReactionX System
2.4. Reaction Time Simple Upper Limb (RTsUL)
2.5. Reaction Time Simple Lower Limb (RTsLL)
2.6. Tapping Lower Limb (TLL)
2.7. Tapping Upper Limb (TUL)
2.8. Statistical Analysis
3. Results
4. Discussion
Practical Implications and Further Research
5. Conclusions
Author Contributions
Funding
Institutional Review Board Statement
Informed Consent Statement
Data Availability Statement
Conflicts of Interest
References
- Moscatelli, F.; Toto, G.A.; Valenzano, A.; Cibelli, G.; Monda, V.; Limone, P.; Mancini, N.; Messina, A.; Marsala, G.; Messina, G.; et al. High Frequencies (HF) Repetitive Transcranial Magnetic Stimulation (RTMS) Increase Motor Coordination Performances in Volleyball Players. BMC Neurosci. 2023, 24, 30. [Google Scholar] [CrossRef]
- Moscatelli, F.; Monda, V.; Limone, P.; Marsala, G.; Mancini, N.; Monda, M.; Messina, A.; De Maria, A.; Scarinci, A.; Monda, A.; et al. Acute Non Invasive Brain Stimulation Improves Performances in Volleyball Players. Physiol. Behav. 2023, 271, 114356. [Google Scholar] [CrossRef]
- Moscatelli, F.; Monda, A.; Messina, A.; Monda, M.; Monda, V.; Villano, I.; De Maria, A.; Nicola, M.; Marsala, G.; de Stefano, M.I.; et al. Evaluation of Orexin-A Salivary Levels and Its Correlation with Attention After Non-Invasive Brain Stimulation in Female Volleyball Players. Sports Med. Open 2024, 10, 32. [Google Scholar] [CrossRef]
- Shedge, S.S.; Ramteke, S.U.; Jaiswal, P.R. Optimizing Agility and Athletic Proficiency in Badminton Athletes Through Plyometric Training: A Review. Cureus 2024, 16, e52596. [Google Scholar] [CrossRef]
- Lee, Y.-S.; Lee, D.; Ahn, N.Y. SAQ Training on Sprint, Change-of-Direction Speed, and Agility in U-20 Female Football Players. PLoS ONE 2024, 19, e0299204. [Google Scholar] [CrossRef]
- Wang, J.; Qin, Z.; Wei, Z. Power and Velocity Performance of Swing Movement in the Adolescent Male Volleyball Players—Age and Positional Difference. BMC Sports Sci. Med. Rehabil. 2024, 16, 111. [Google Scholar] [CrossRef]
- Chilom, D.; Potop, V.; Mihaila, I.; Mihaiu, C.; Mihai, I.; Mancini, N.; Grosu, V.T.; Mateescu, A. Influence of Dancesport on Segmental Coordination Development in 6–8-Year-Old Children. Pedagog. Phys. Cult. Sports 2024, 28, 147–155. [Google Scholar] [CrossRef]
- Hodges, N.J.; Wyder-Hodge, P.A.; Hetherington, S.; Baker, J.; Besler, Z.; Spering, M. Topical Review: Perceptual-Cognitive Skills, Methods, and Skill-Based Comparisons in Interceptive Sports. Optom. Vis. Sci. 2021, 98, 681–695. [Google Scholar] [CrossRef]
- Örs, B.S.; Cantas, F.; Onarici Gungor, E.; Simsek, D. Assessment and Comparison of Visual skills among Athletes. Spor Performans Araştırmaları Derg. 2019, 10, 231–241. [Google Scholar] [CrossRef]
- Jayaswal, D.A.A. Comparison between Auditory and Visual Simple Reaction Times and Its Relationship with Gender in 1st Year MBBS Students of Jawaharlal Nehru Medical College, Bhagalpur, Bihar. Int. J. Med. Res. Rev. 2016, 4, 1228–1232. [Google Scholar] [CrossRef]
- Turna, B. The Effect of Agility Training on Reaction Time in Fencers. J. Educ. Learn. 2020, 9, 127. [Google Scholar] [CrossRef]
- Yıldırım, Y.; Kızılet, A. The Effect of Different Learning Method on the Visual Reaction Time of Hand and Leg in High School Level Tennis Trainees. J. Educ. Issues 2020, 6, 414. [Google Scholar] [CrossRef]
- Balkó, Š.; Rous, M.; Balkó, I.; Hnízdil, J.; Borysiuk, Z. Influence of a 9-Week Training Intervention on the Reaction Time of Fencers Aged 15 to 18 Years. Phys. Act. Rev. 2017, 5, 146–154. [Google Scholar] [CrossRef]
- Walton, C.C.; Keegan, R.J.; Martin, M.; Hallock, H. The Potential Role for Cognitive Training in Sport: More Research Needed. Front. Psychol. 2018, 9, 1121. [Google Scholar] [CrossRef]
- Rabiner, D.L.; Murray, D.W.; Skinner, A.T.; Malone, P.S. A Randomized Trial of Two Promising Computer-Based Interventions for Students with Attention Difficulties. J. Abnorm. Child. Psychol. 2010, 38, 131–142. [Google Scholar] [CrossRef]
- Lynall, R.C.; Blackburn, J.T.; Guskiewicz, K.M.; Marshall, S.W.; Plummer, P.; Mihalik, J.P. Reaction Time and Joint Kinematics During Functional Movement in Recently Concussed Individuals. Arch. Phys. Med. Rehabil. 2018, 99, 880–886. [Google Scholar] [CrossRef]
- Kirk, H.; Gray, K.; Ellis, K.; Taffe, J.; Cornish, K. Impact of Attention Training on Academic Achievement, Executive Functioning, and Behavior: A Randomized Controlled Trial. Am. J. Intellect. Dev. Disabil. 2017, 122, 97–117. [Google Scholar] [CrossRef]
- la Torre, M.E.; Monda, A.; Messina, A.; de Stefano, M.I.; Monda, V.; Moscatelli, F.; Tafuri, F.; Saraiello, E.; Latino, F.; Monda, M.; et al. The Potential Role of Nutrition in Overtraining Syndrome: A Narrative Review. Nutrients 2023, 15, 4916. [Google Scholar] [CrossRef]
- Badau, D.; Badau, A.; Ene-Voiculescu, C.; Larion, A.; Ene-Voiculescu, V.; Mihaila, I.; Fleancu, J.L.; Tudor, V.; Tifrea, C.; Cotovanu, A.S.; et al. The Impact of Implementing an Exergame Program on the Level of Reaction Time Optimization in Handball, Volleyball, and Basketball Players. Int. J. Environ. Res. Public. Health 2022, 19, 5598. [Google Scholar] [CrossRef]
- Mawarti, S.; Rohmansyah, N.A.; Hiruntrakul, A. Effect of Volleyball Training Program to Improve Reaction Time. Int. J. Human. Mov. Sports Sci. 2021, 9, 1314–1318. [Google Scholar] [CrossRef]
- Katanić, B.; Ilić, P.; Stojmenović, A.; Vitasović, M. The Application of Fitlight Trainer System in Sports. Fiz. Kult. 2020, 74, 115–126. [Google Scholar] [CrossRef]
- Oliinyk, I.; Doroshenko, E.; Melnyk, M.; Sushko, R.; Tyshchenko, V.; Shamardin, V. Modern Approaches to Analysis of Technical and Tactical Actions of Skilled Volleyball Players. Phys. Educ. Theory Methodol. 2021, 21, 235–243. [Google Scholar] [CrossRef]
- Salles, W.D.N.; Collet, C.; Porath, M.; Milistetd, M.; Nascimento, J.V. do Fatores Associados à Eficácia No Desempenho Das Ações Técnico-Táticas Do Voleibol. Braz. J. Kinanthropometry Hum. Perform. 2017, 19, 74. [Google Scholar] [CrossRef]
- Lidor, R.; Ziv, G. Physical and Physiological Attributes of Female Volleyball Players-A Review. J. Strength. Cond. Res. 2010, 24, 1963–1973. [Google Scholar] [CrossRef]
- Moroșanu, Ș.; Grosu, V.T.; Răbîncă, S.M.; Grosu, E.F.; Hervás-Gómez, C.; Mancini, N.; Moreno-Alcaraz, V.J. Enhancing Psychomotor Skills in High School Students Using Virtual Reality. J. Phys. Educ. Sport 2024, 24, 1434–1440. [Google Scholar]
- Isorna-Folgar, M.; Leirós-Rodríguez, R.; López-Roel, S.; García-Soidán, J.L. Effects of a Cognitive-Behavioral Therapy Intervention on the Rowers of the Junior Spain National Team. Healthcare 2022, 10, 2357. [Google Scholar] [CrossRef]
- Pereira, L.A.; Romano, F.; Alves, M.; Mercer, V.P.; Bishop, C.; Franchini, E.; Loturco, I. Variations in Power Performance and Perceptual Responses to Training in Olympic Boxers Over a 7-Month Training Period. Int. J. Sports Physiol. Perform. 2023, 18, 414–419. [Google Scholar] [CrossRef]
- Nuri, L.; Shadmehr, A.; Ghotbi, N.; Attarbashi Moghadam, B. Reaction Time and Anticipatory Skill of Athletes in Open and Closed Skill-dominated Sport. Eur. J. Sport. Sci. 2013, 13, 431–436. [Google Scholar] [CrossRef] [PubMed]
- Moscatelli, F.; De Maria, A.; Marinaccio, L.A.; Monda, V.; Messina, A.; Monacis, D.; Toto, G.; Limone, P.; Monda, M.; Messina, G.; et al. Assessment of Lifestyle, Eating Habits and the Effect of Nutritional Education among Undergraduate Students in Southern Italy. Nutrients 2023, 15, 2894. [Google Scholar] [CrossRef] [PubMed]
- Wilke, J.; Vogel, O.; Ungricht, S. Can We Measure Perceptual-Cognitive Function during Athletic Movement? A Framework for and Reliability of a Sports-Related Testing Battery. Phys. Ther. Sport 2020, 43, 120–126. [Google Scholar] [CrossRef]
- Sheppard, J.M.; Young, W.B. Agility Literature Review: Classifications, Training and Testing. J. Sports Sci. 2006, 24, 919–932. [Google Scholar] [CrossRef] [PubMed]
- Chaabouni, S.; Methnani, R.; Al Hadabi, B.; Al Busafi, M.; Al Kitani, M.; Al Jadidi, K.; Samozino, P.; Moalla, W.; Gmada, N. A Simple Field Tapping Test for Evaluating Frequency Qualities of the Lower Limb Neuromuscular System in Soccer Players: A Validity and Reliability Study. Int. J. Environ. Res. Public. Health 2022, 19, 3792. [Google Scholar] [CrossRef]
- Halme, H.-L.; Parkkonen, L. The Effect of Visual and Proprioceptive Feedback on Sensorimotor Rhythms during BCI Training. PLoS ONE 2022, 17, e0264354. [Google Scholar] [CrossRef]
- Zhou, Y.; Tai, F.; Yu, S. Effect of 12-Week SPARQ Training on the Ability of Youth Football Players. Sportverletz. Sportschaden 2024, 38, 64–72. [Google Scholar] [CrossRef]
- Di Libero, T.; Carissimo, C.; Cerro, G.; Abbatecola, A.M.; Marino, A.; Miele, G.; Ferrigno, L.; Rodio, A. An Overall Automated Architecture Based on the Tapping Test Measurement Protocol: Hand Dexterity Assessment through an Innovative Objective Method. Sensors 2024, 24, 4133. [Google Scholar] [CrossRef] [PubMed]
- Belej, M.; Junger, J. Motorické Testy Koordinačných Schopností; Prešovská Univerzita: Prešov, Slovakia, 2006; ISBN 8080685010. [Google Scholar]
- Sawilowsky, S.S. New Effect Size Rules of Thumb. J. Mod. Appl. Stat. Methods 2009, 8, 597–599. [Google Scholar] [CrossRef]
- Moscatelli, F.; Polito, R.; LATorre, M.E.; Vasco, P.; Valenzano, A.; Monda, V.; Cibelli, G.; De Maria, A.; Scarinci, A.; Messina, G. Investigation of physical fitness profiles of undergraduate university students in Italy: A pilot study. J. Sports Med. Phys. Fit. 2023, 63, 1369–1370. [Google Scholar] [CrossRef] [PubMed]
- Hodges, N.J.; Starkes, J.L.; MacMahon, C. Expert Performance in Sport: A Cognitive Perspective. In The Cambridge Handbook of Expertise and Expert Performance; Cambridge University Press: Cambridge, UK, 2006; pp. 471–488. [Google Scholar]
- Enoki, H.; Tani, T.; Ishida, K. Foot Tapping Test as Part of Routine Neurologic Examination in Degenerative Compression Myelopathies: A Significant Correlation between 10-Sec Foot-Tapping Speed and 30-m Walking Speed. Spine Surg. Relat. Res. 2019, 3, 207–213. [Google Scholar] [CrossRef]
- Cieśluk, K.; Sadowska, D.; Krzepota, J. The Use of Modern Measuring Devices in the Evaluation of Movement in the Block in Volleyball Depending on the Difficulty of the Task Determined by Light Signals. Appl. Sci. 2023, 13, 11462. [Google Scholar] [CrossRef]
- Schwab, S.; Memmert, D. The Impact of a Sports Vision Training Program in Youth Field Hockey Players. J. Sports Sci. Med. 2012, 11, 624–631. [Google Scholar]
- Wimshurst, Z.L.; Sowden, P.T.; Cardinale, M. Visual Skills and Playing Positions of Olympic Field Hockey Players. Percept. Mot. Skills 2012, 114, 204–216. [Google Scholar] [CrossRef] [PubMed]
- Drikos, S.; Barzouka, K.; Balasas, D.G.; Sotiropoulos, K. Effect of Quality of Opposition on Game Performance Indicators in Elite Male Volleyball. Int. J. Sports Sci. Coach. 2022, 17, 169–177. [Google Scholar] [CrossRef]
- Florkiewicz, B.; Fogtman, S.; Lesiakowski, P.; Zwierko, T. The Effect of Visual Perception Training on Sensorimotor Function in Handball Players. J. Kinesiol. Exerc. Sci. 2015, 25, 21–28. [Google Scholar]
- Bidil, S.; Arslan, B.; Bozkurt, K.; Düzova, S.C.; Örs, B.S.; Onarici Güngör, E.; Şimşek, D. Investigation of the Effect of Badminton-Specific 8 Week Reaction Training on Visual-Motor Reaction Time and Visual Cognitive Dual Task. Turk. Klin. J. Sports Sci. 2021, 13, 33–40. [Google Scholar] [CrossRef]
- Mayer, C.; Rühlemann, A.; Busch, A.; Jäger, M. Measures of Knee Capability in Handball Players Differ by Age: A Cross Sectional Study. Sports Med. Int. Open 2022, 6, E60–E68. [Google Scholar] [CrossRef] [PubMed]

| Parameters | Experimental Group (n = 12) | Control Group (n = 12) | p-Value |
|---|---|---|---|
| Age | 20.3 ± 1.1 | 20.4 ± 1 | 0.686 |
| Height (cm) | 175.2 ± 5.1 | 176.1 ± 4.9 | 0.657 |
| Body mass (kg) | 70.0 ± 7.3 | 68.7 ± 5.8 | 0.647 |
| Monday | Tuesday | Wednesday | Thursday | Friday | Saturday | |
|---|---|---|---|---|---|---|
| Morning session from 9.30 to 11.00 a.m. | Physical training Motor reaction, agility, and quickness. | Physical training Strength training | Physical training Motor reaction, agility, and quickness. | Physical training Strength training | Physical training Motor reaction, agility, and quickness. | Strength training and friendly match on the sand |
| Afternoon session from 7.00 to 9.00 p.m. | Technical and tactical training | Rest | Technical and tactical training | Rest | Technical and tactical training | Rest |
| Test | Group | X ± SD | DX | 95% CI Lower Upper | t | p | d |
|---|---|---|---|---|---|---|---|
| RTsUL (s) pre | EG (n = 12) | 0.482 ± 0.008 | −0.002 | −0.011 0.006 | −0.59 | 0.562 | 0.18 |
| CG (n = 12) | 0.484 ± 0.011 | ||||||
| RTsUL (s) post | EG (n = 12) | 0.410 ± 0.019 | −0.062 | −0.077 −0.049 | −9.4 | 0.000 * | 4.77 |
| CG (n = 12) | 0.472 ± 0.013 | ||||||
| RTsLL(s) pre | EG (n = 12) | 0.611 ± 0.027 | −0.007 | −0.029 0.017 | −0.56 | 0.582 | 0.26 |
| CG (n = 12) | 0.618 ± 0.027 | ||||||
| RTsLL (s) post | EG (n = 12) | 0.520 ± 0.032 | −0.07 | −0.096 −0.043 | −5.53 | 0.000 * | 2.41 |
| CG (n = 12) | 0.590 ± 0.029 | ||||||
| TUL (s) pre | EG (n = 12) | 5.860 ± 0.244 | 0.059 | −0.158 0.275 | 0.56 | 0.580 | 0.22 |
| CG (n = 12) | 5.801 ± 0.266 | ||||||
| TUL (s) post | EG (n = 12) | 5.238 ± 0.232 | −0.432 | −0.633 −0.231 | −4.46 | 0.000 * | 1.78 |
| CG (n = 12) | 5.670 ± 0.243 | ||||||
| TLL (s) pre | EG (n = 12) | 9.153 ± 0.489 | 0.05 | −0.345 0.445 | 0.26 | 0.795 | 0.11 |
| CG (n = 12) | 9.103 ± 0.444 | ||||||
| TLL (s) post | EG (n = 12) | 8.170 ± 0.473 | −0.840 | −1.202 −0.478 | −4.81 | 0.000 * | 2.23 |
| CG (n = 12) | 9.010 ± 0.376 |
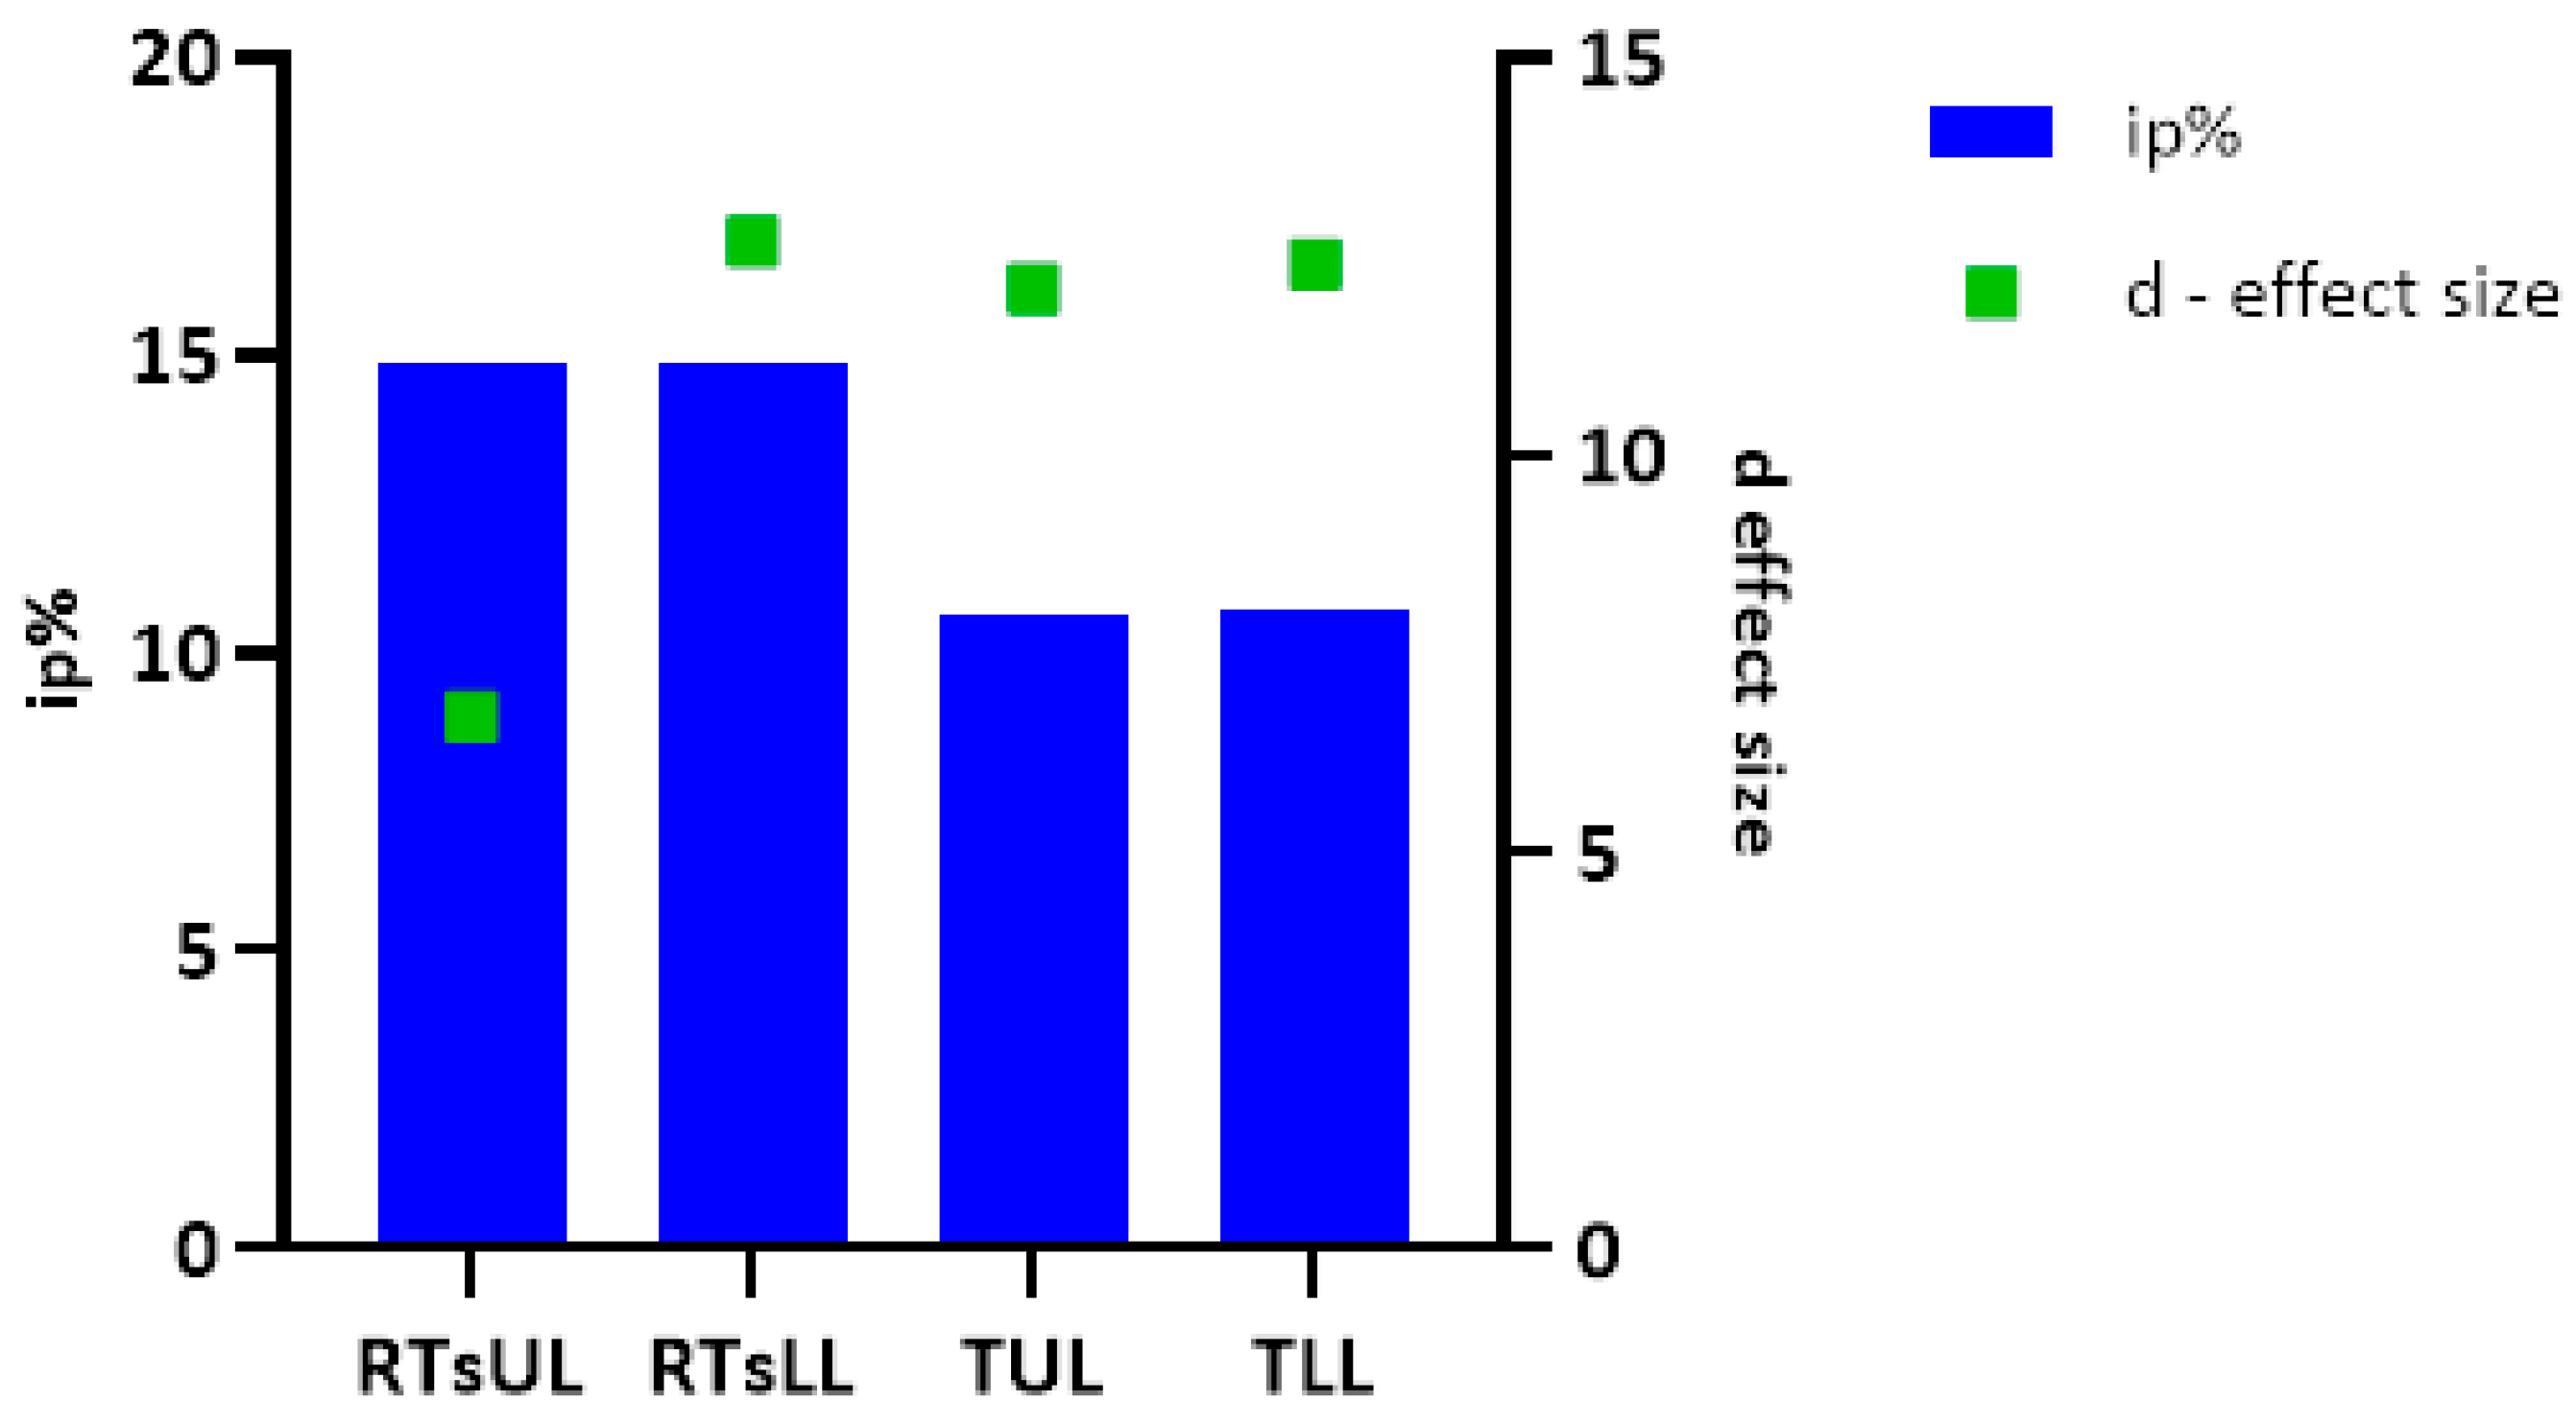
| Test | Group | Phase of Test | X ± SD | DX Post-Pre ± SD |
95% CI
Lower Upper | t | p | d | ip% |
|---|---|---|---|---|---|---|---|---|---|
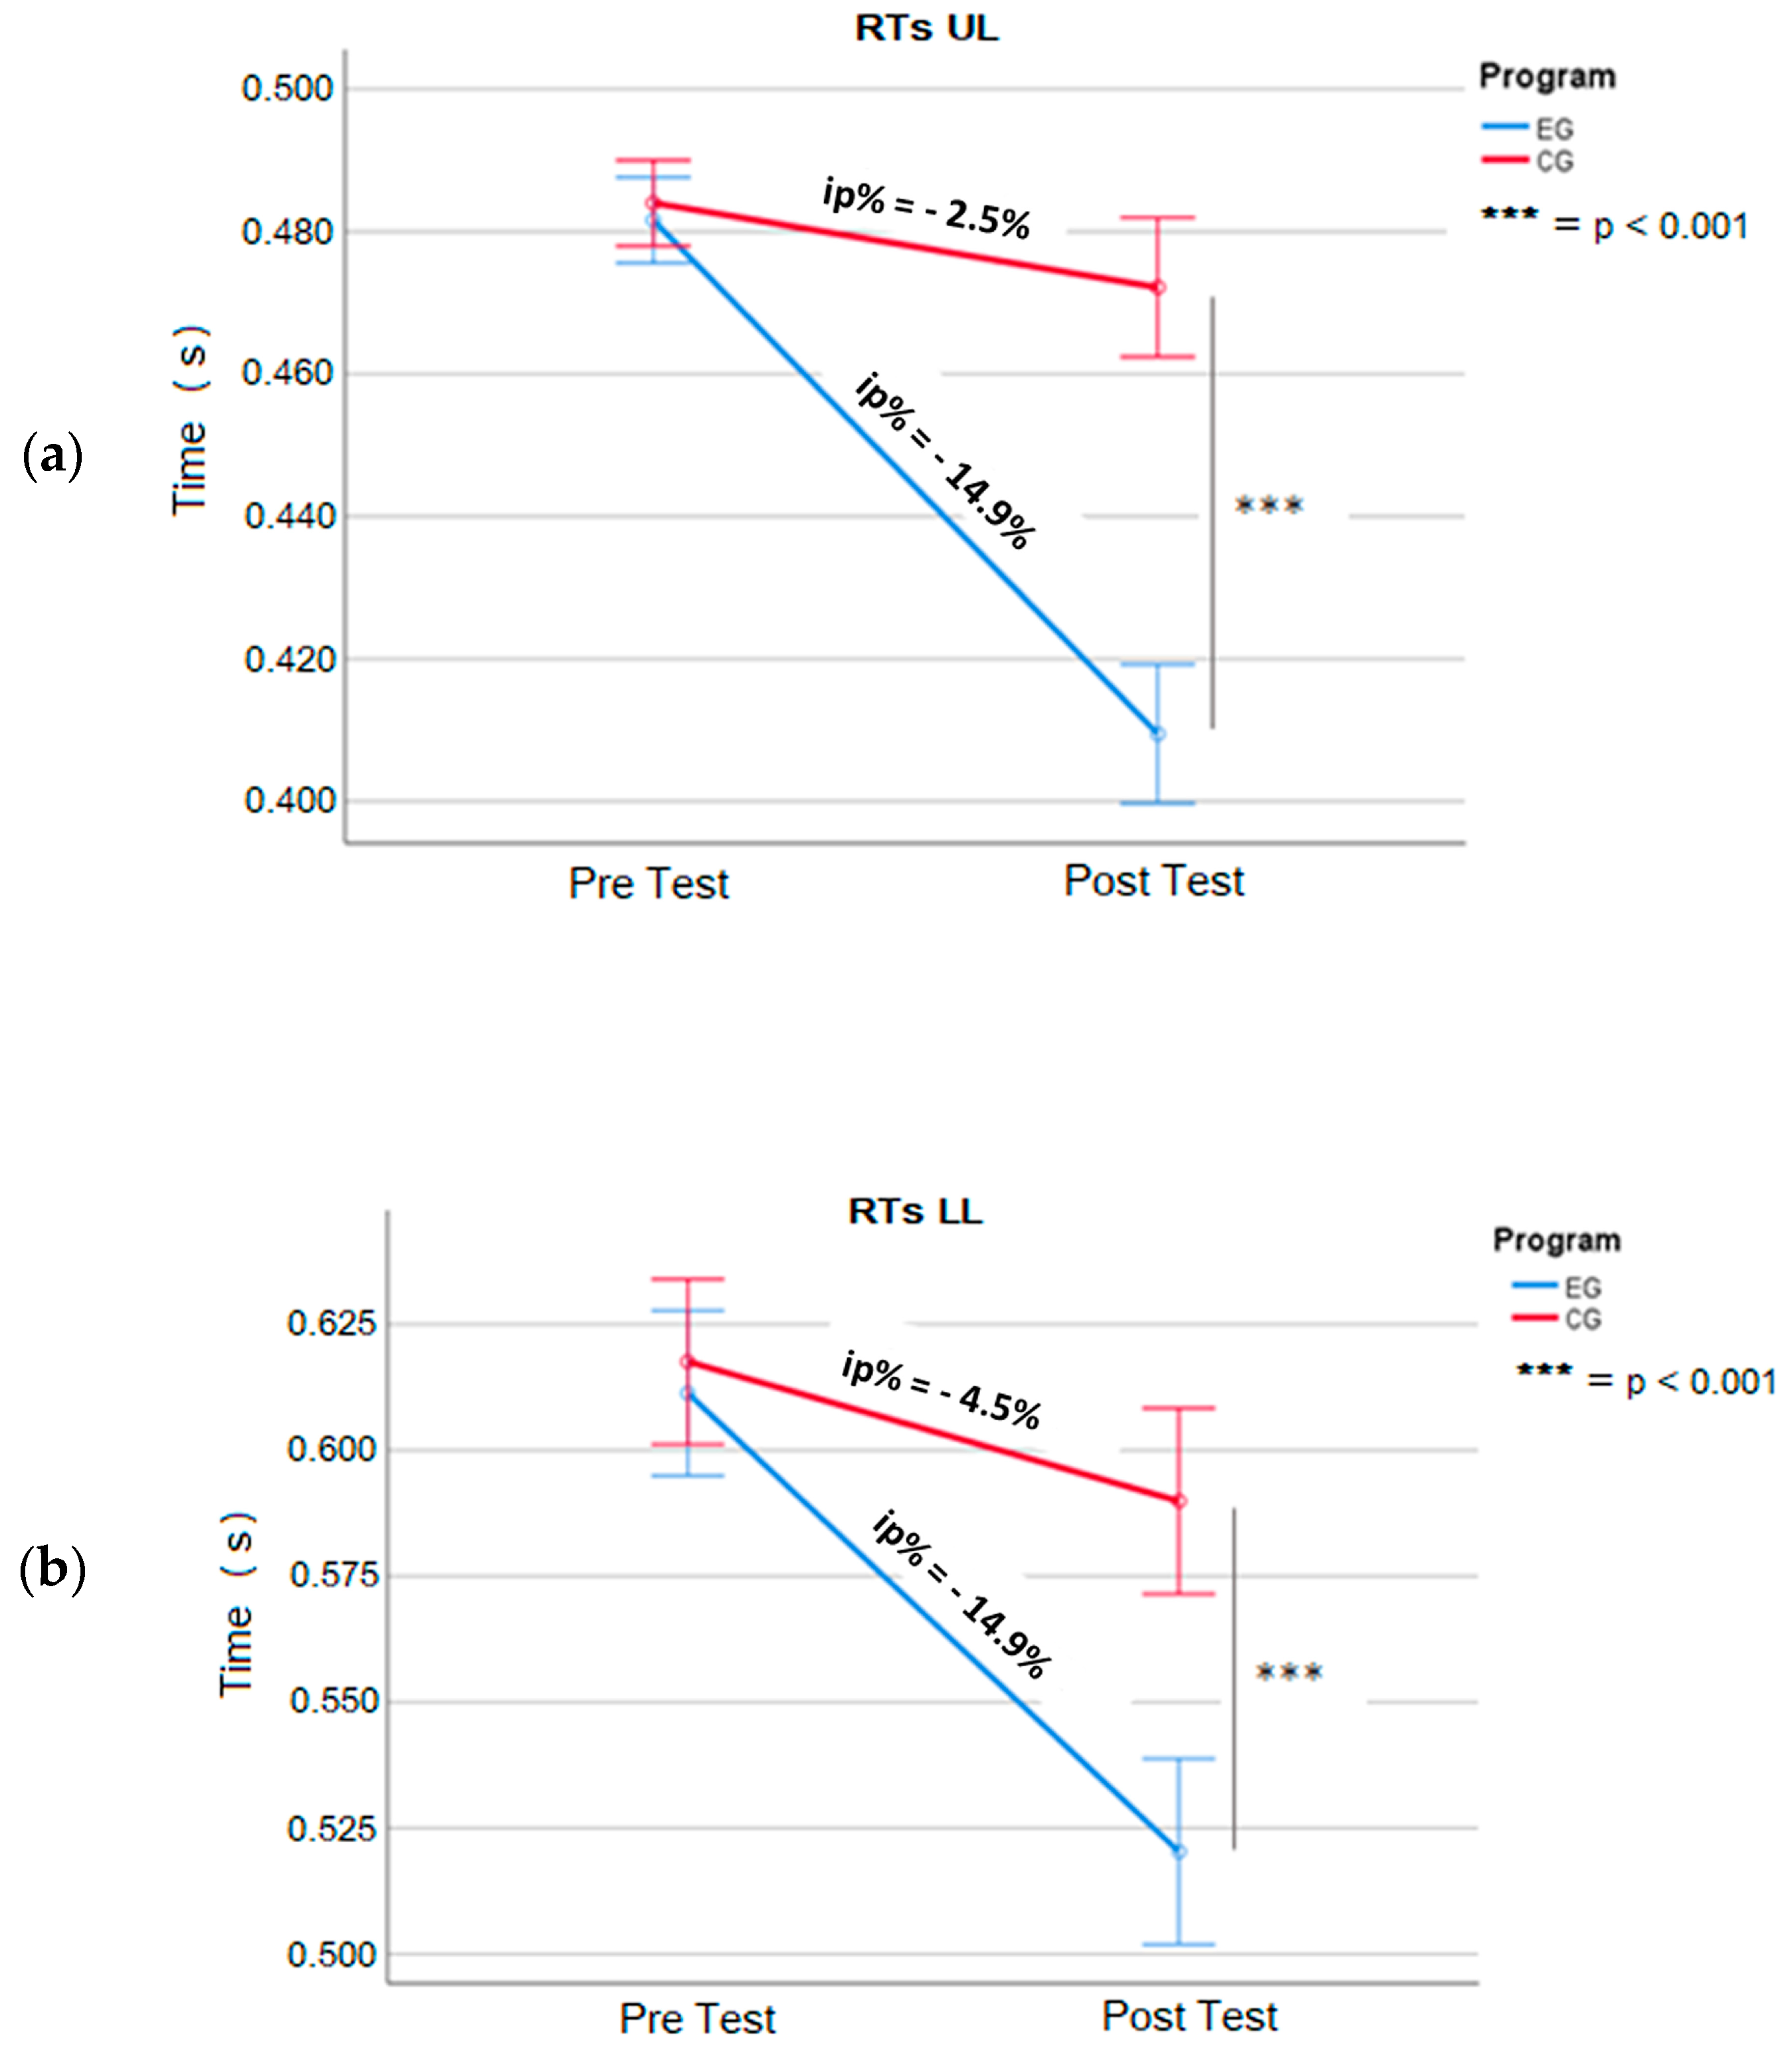
| RTsUL (s) | EG (n = 12) | pre | 0.482 ± 0.008 | 0.072 ± 0.011 | 0.065 0.079 | 23.2 | 0.000 * | 6.7 | −14.9 |
| post | 0.410 ± 0.019 | ||||||||
| CG (n = 12) | pre | 0.484 ± 0.011 | −0.012 ± 0.004 | 0.009 0.015 | 9.6 | 0.000 * | 2.8 | −2.5 | |
| post | 0.472 ± 0.013 | ||||||||
| RTsLL (s) | EG (n = 12) | pre | 0.611 ± 0.027 | −0.091 ± 0.007 | 0.086 0.096 | 44.0 | 0.000 * | 12.7 | −14.9 |
| post | 0.520 ± 0.032 | ||||||||
| CG (n = 12) | pre | 0.618 ± 0.027 | −0.028 ± 0.009 | 0.022 0.033 | 11.0 | 0.000 * | 3.2 | −4.5 | |
| post | 0.590 ± 0.029 | ||||||||
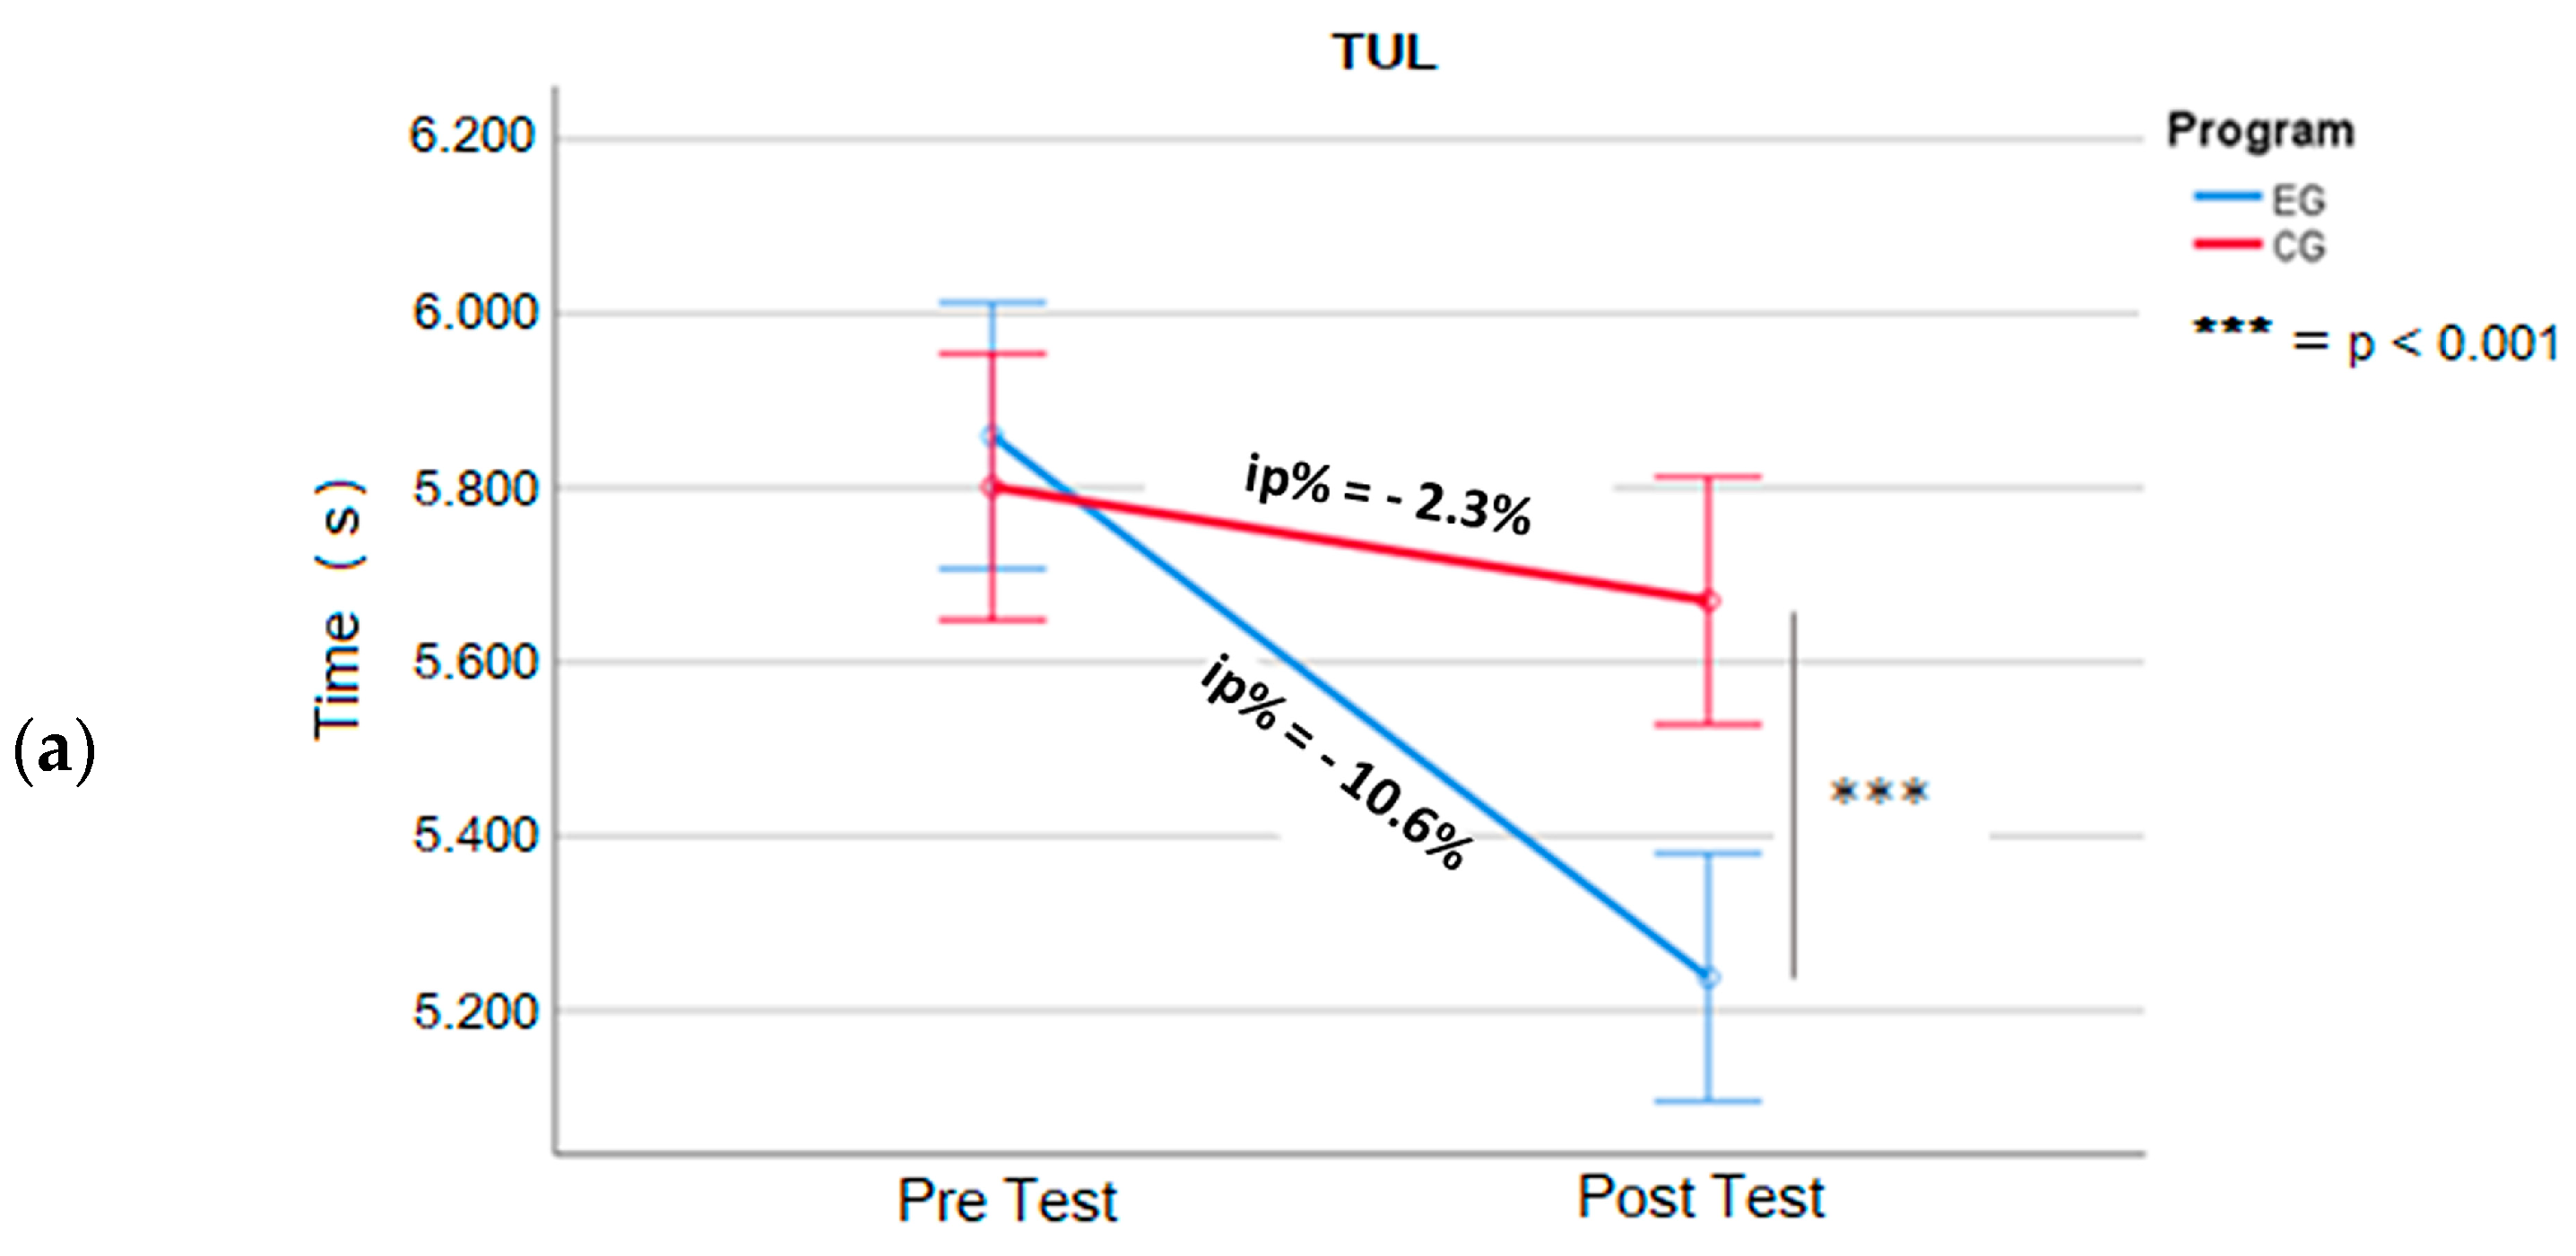
| EG (n = 12) | pre | 5.860 ± 0.244 | −0.622 ± 0.051 | 0.589 0.654 | 42.0 | 0.000 * | 12.1 | −10.6 | |
| TUL (s) | post | 5.238 ± 0.232 | |||||||
| CG (n = 12) | pre | 5.801 ± 0.266 | −0.131 ± 0.073 | 0.085 0.177 | 6.2 | 0.000 * | 1.8 | −2.3 | |
| post | 5.670 ± 0.243 | ||||||||
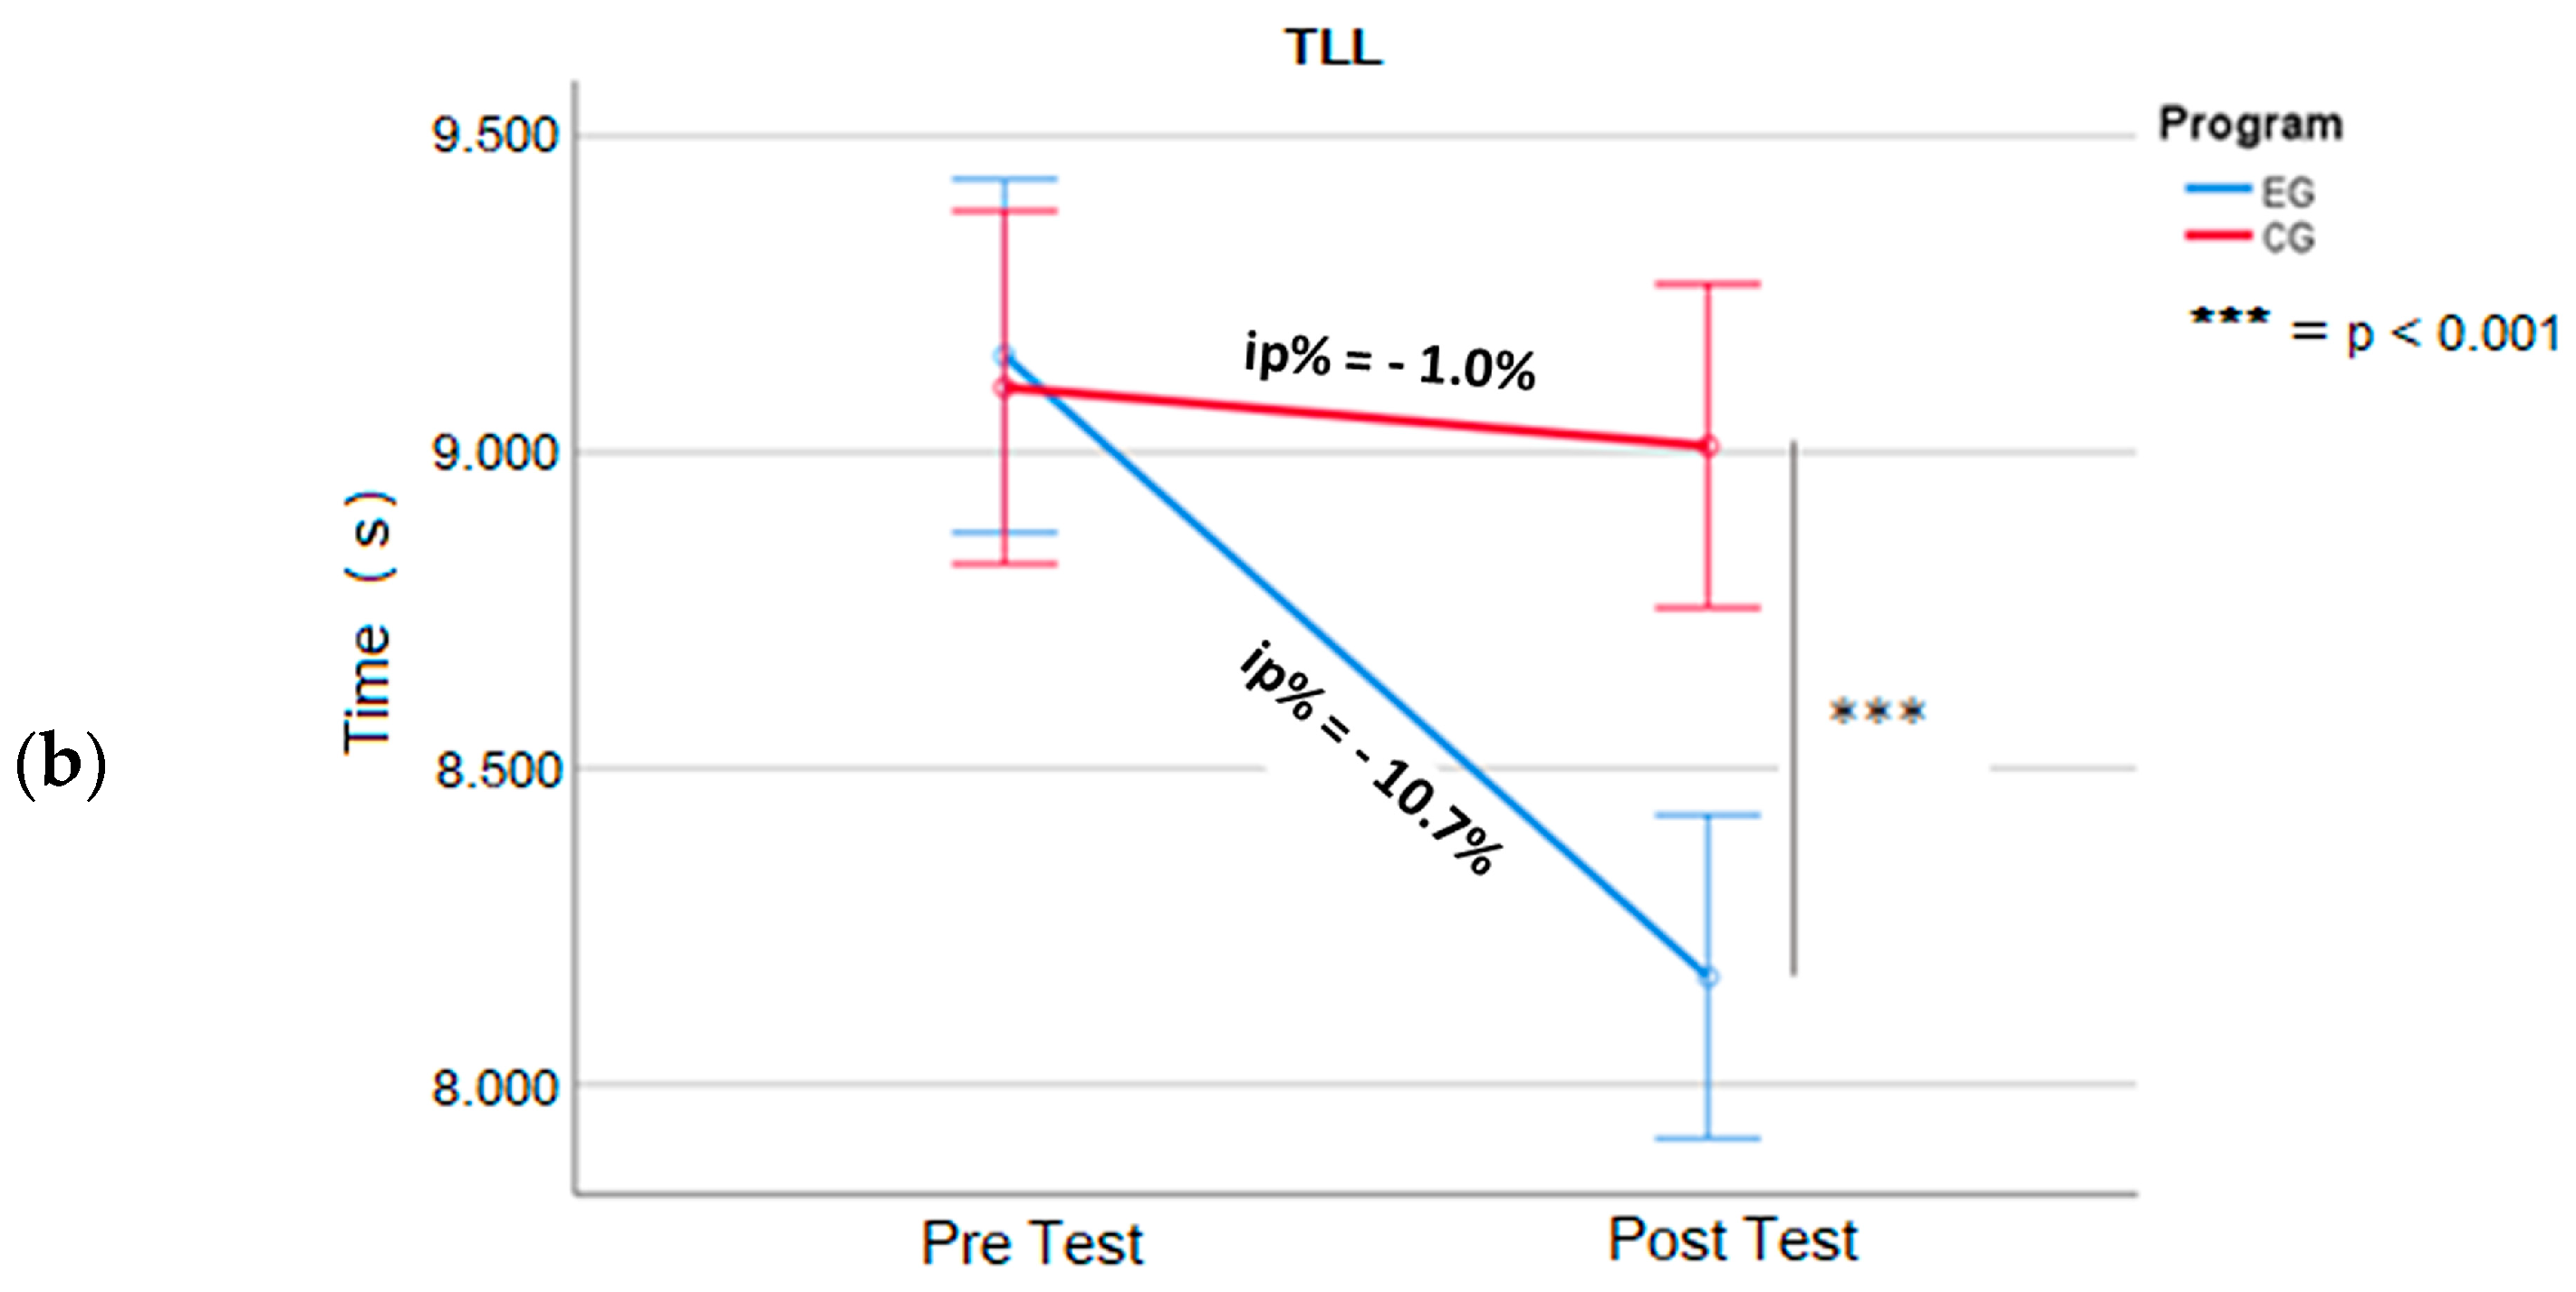
| EG (n = 12) | pre | 9.153 ± 0.489 | −0.983 ± 0.079 | 0.932 1.033 | 43.1 | 0.000 * | 12.4 | −10.7 | |
| TLL (s) | post | 8.170 ± 0.473 | |||||||
| CG (n = 12) | pre | 9.103 ± 0.444 | −0.093 ± 0.115 | 0.019 0.166 | 2.8 | 0.018 * | 0.8 | −1.0 | |
| post | 9.010 ± 0.376 |
Disclaimer/Publisher’s Note: The statements, opinions and data contained in all publications are solely those of the individual author(s) and contributor(s) and not of MDPI and/or the editor(s). MDPI and/or the editor(s) disclaim responsibility for any injury to people or property resulting from any ideas, methods, instructions or products referred to in the content. |
© 2024 by the authors. Licensee MDPI, Basel, Switzerland. This article is an open access article distributed under the terms and conditions of the Creative Commons Attribution (CC BY) license (https://creativecommons.org/licenses/by/4.0/).
Share and Cite
Mancini, N.; Di Padova, M.; Polito, R.; Mancini, S.; Dipace, A.; Basta, A.; Colella, D.; Limone, P.; Messina, G.; Monda, M.; et al. The Impact of Perception–Action Training Devices on Quickness and Reaction Time in Female Volleyball Players. J. Funct. Morphol. Kinesiol. 2024, 9, 147. https://doi.org/10.3390/jfmk9030147
Mancini N, Di Padova M, Polito R, Mancini S, Dipace A, Basta A, Colella D, Limone P, Messina G, Monda M, et al. The Impact of Perception–Action Training Devices on Quickness and Reaction Time in Female Volleyball Players. Journal of Functional Morphology and Kinesiology. 2024; 9(3):147. https://doi.org/10.3390/jfmk9030147
Chicago/Turabian StyleMancini, Nicola, Marilena Di Padova, Rita Polito, Siria Mancini, Anna Dipace, Angelo Basta, Dario Colella, Pierpaolo Limone, Giovanni Messina, Marcellino Monda, and et al. 2024. "The Impact of Perception–Action Training Devices on Quickness and Reaction Time in Female Volleyball Players" Journal of Functional Morphology and Kinesiology 9, no. 3: 147. https://doi.org/10.3390/jfmk9030147
APA StyleMancini, N., Di Padova, M., Polito, R., Mancini, S., Dipace, A., Basta, A., Colella, D., Limone, P., Messina, G., Monda, M., Monda, A., Guerriero, M. A., Messina, A., & Moscatelli, F. (2024). The Impact of Perception–Action Training Devices on Quickness and Reaction Time in Female Volleyball Players. Journal of Functional Morphology and Kinesiology, 9(3), 147. https://doi.org/10.3390/jfmk9030147