Method to Quickly Map Multifocal Pupillary Response Fields (mPRF) Using Frequency Tagging

 , , , ,
Abstract
:1. Introduction
Sustained Multifocal Pupillary Frequency Tagging (mPFT)
2. Method and Stimuli
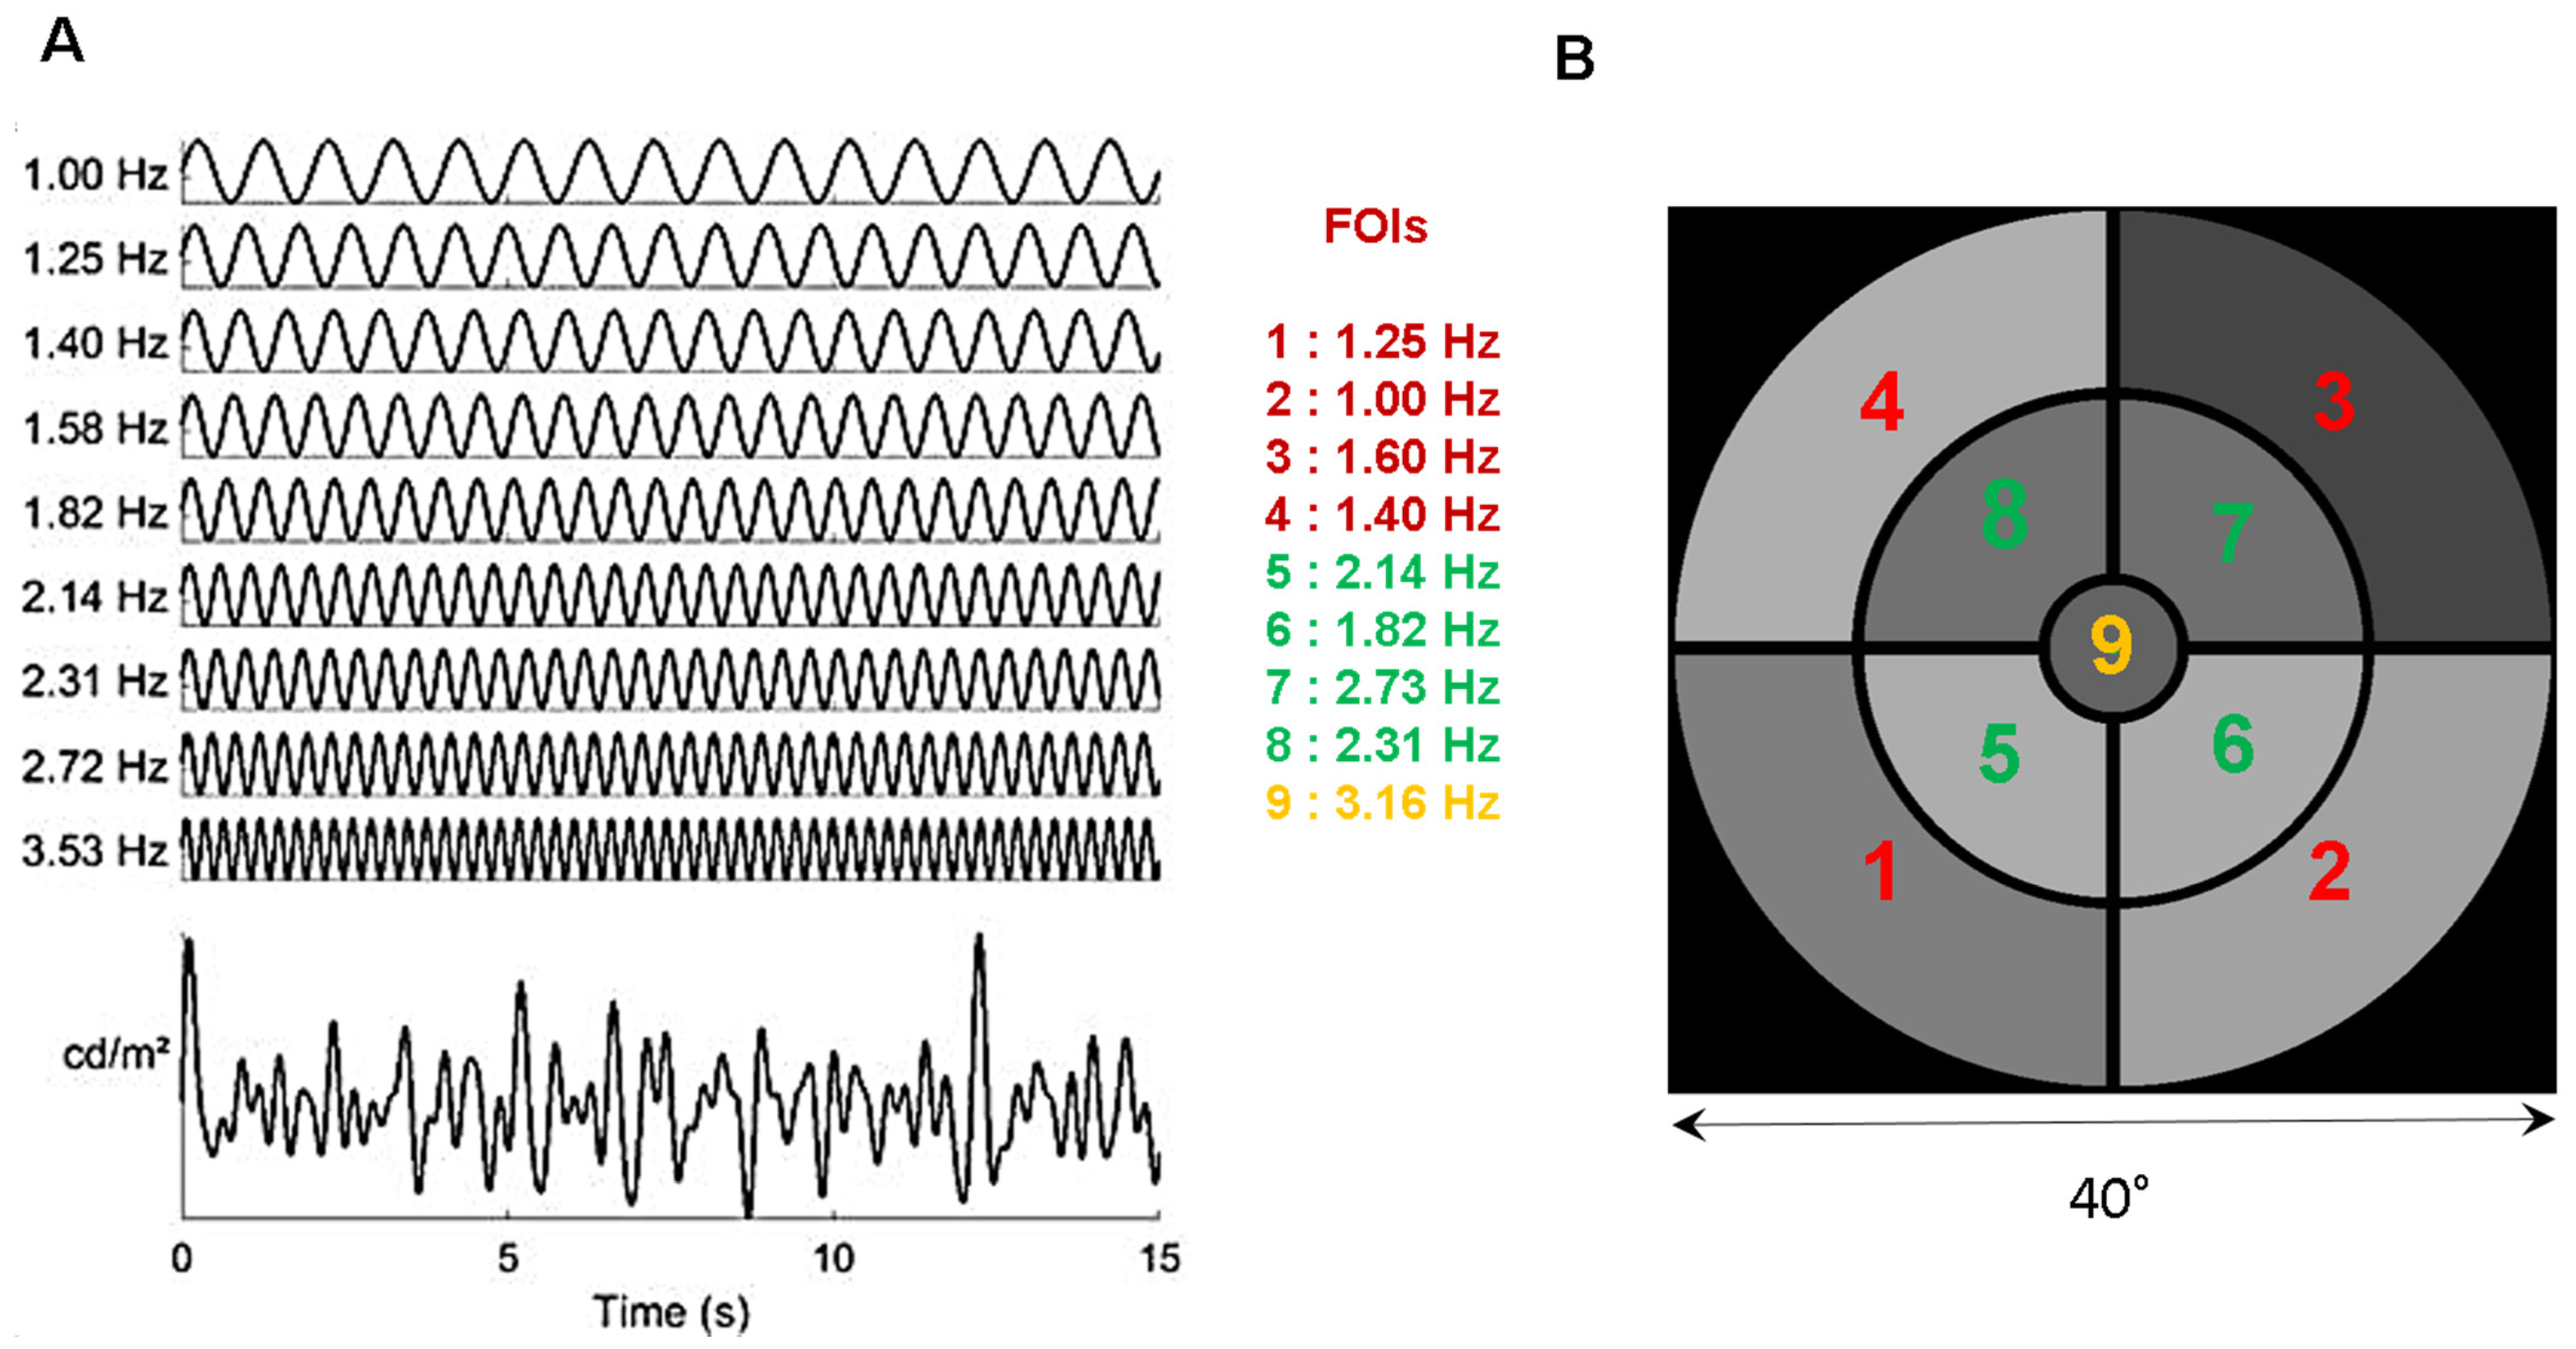
2.1. Stimulus
2.2. Apparatus
2.3. Procedure
2.4. Participants
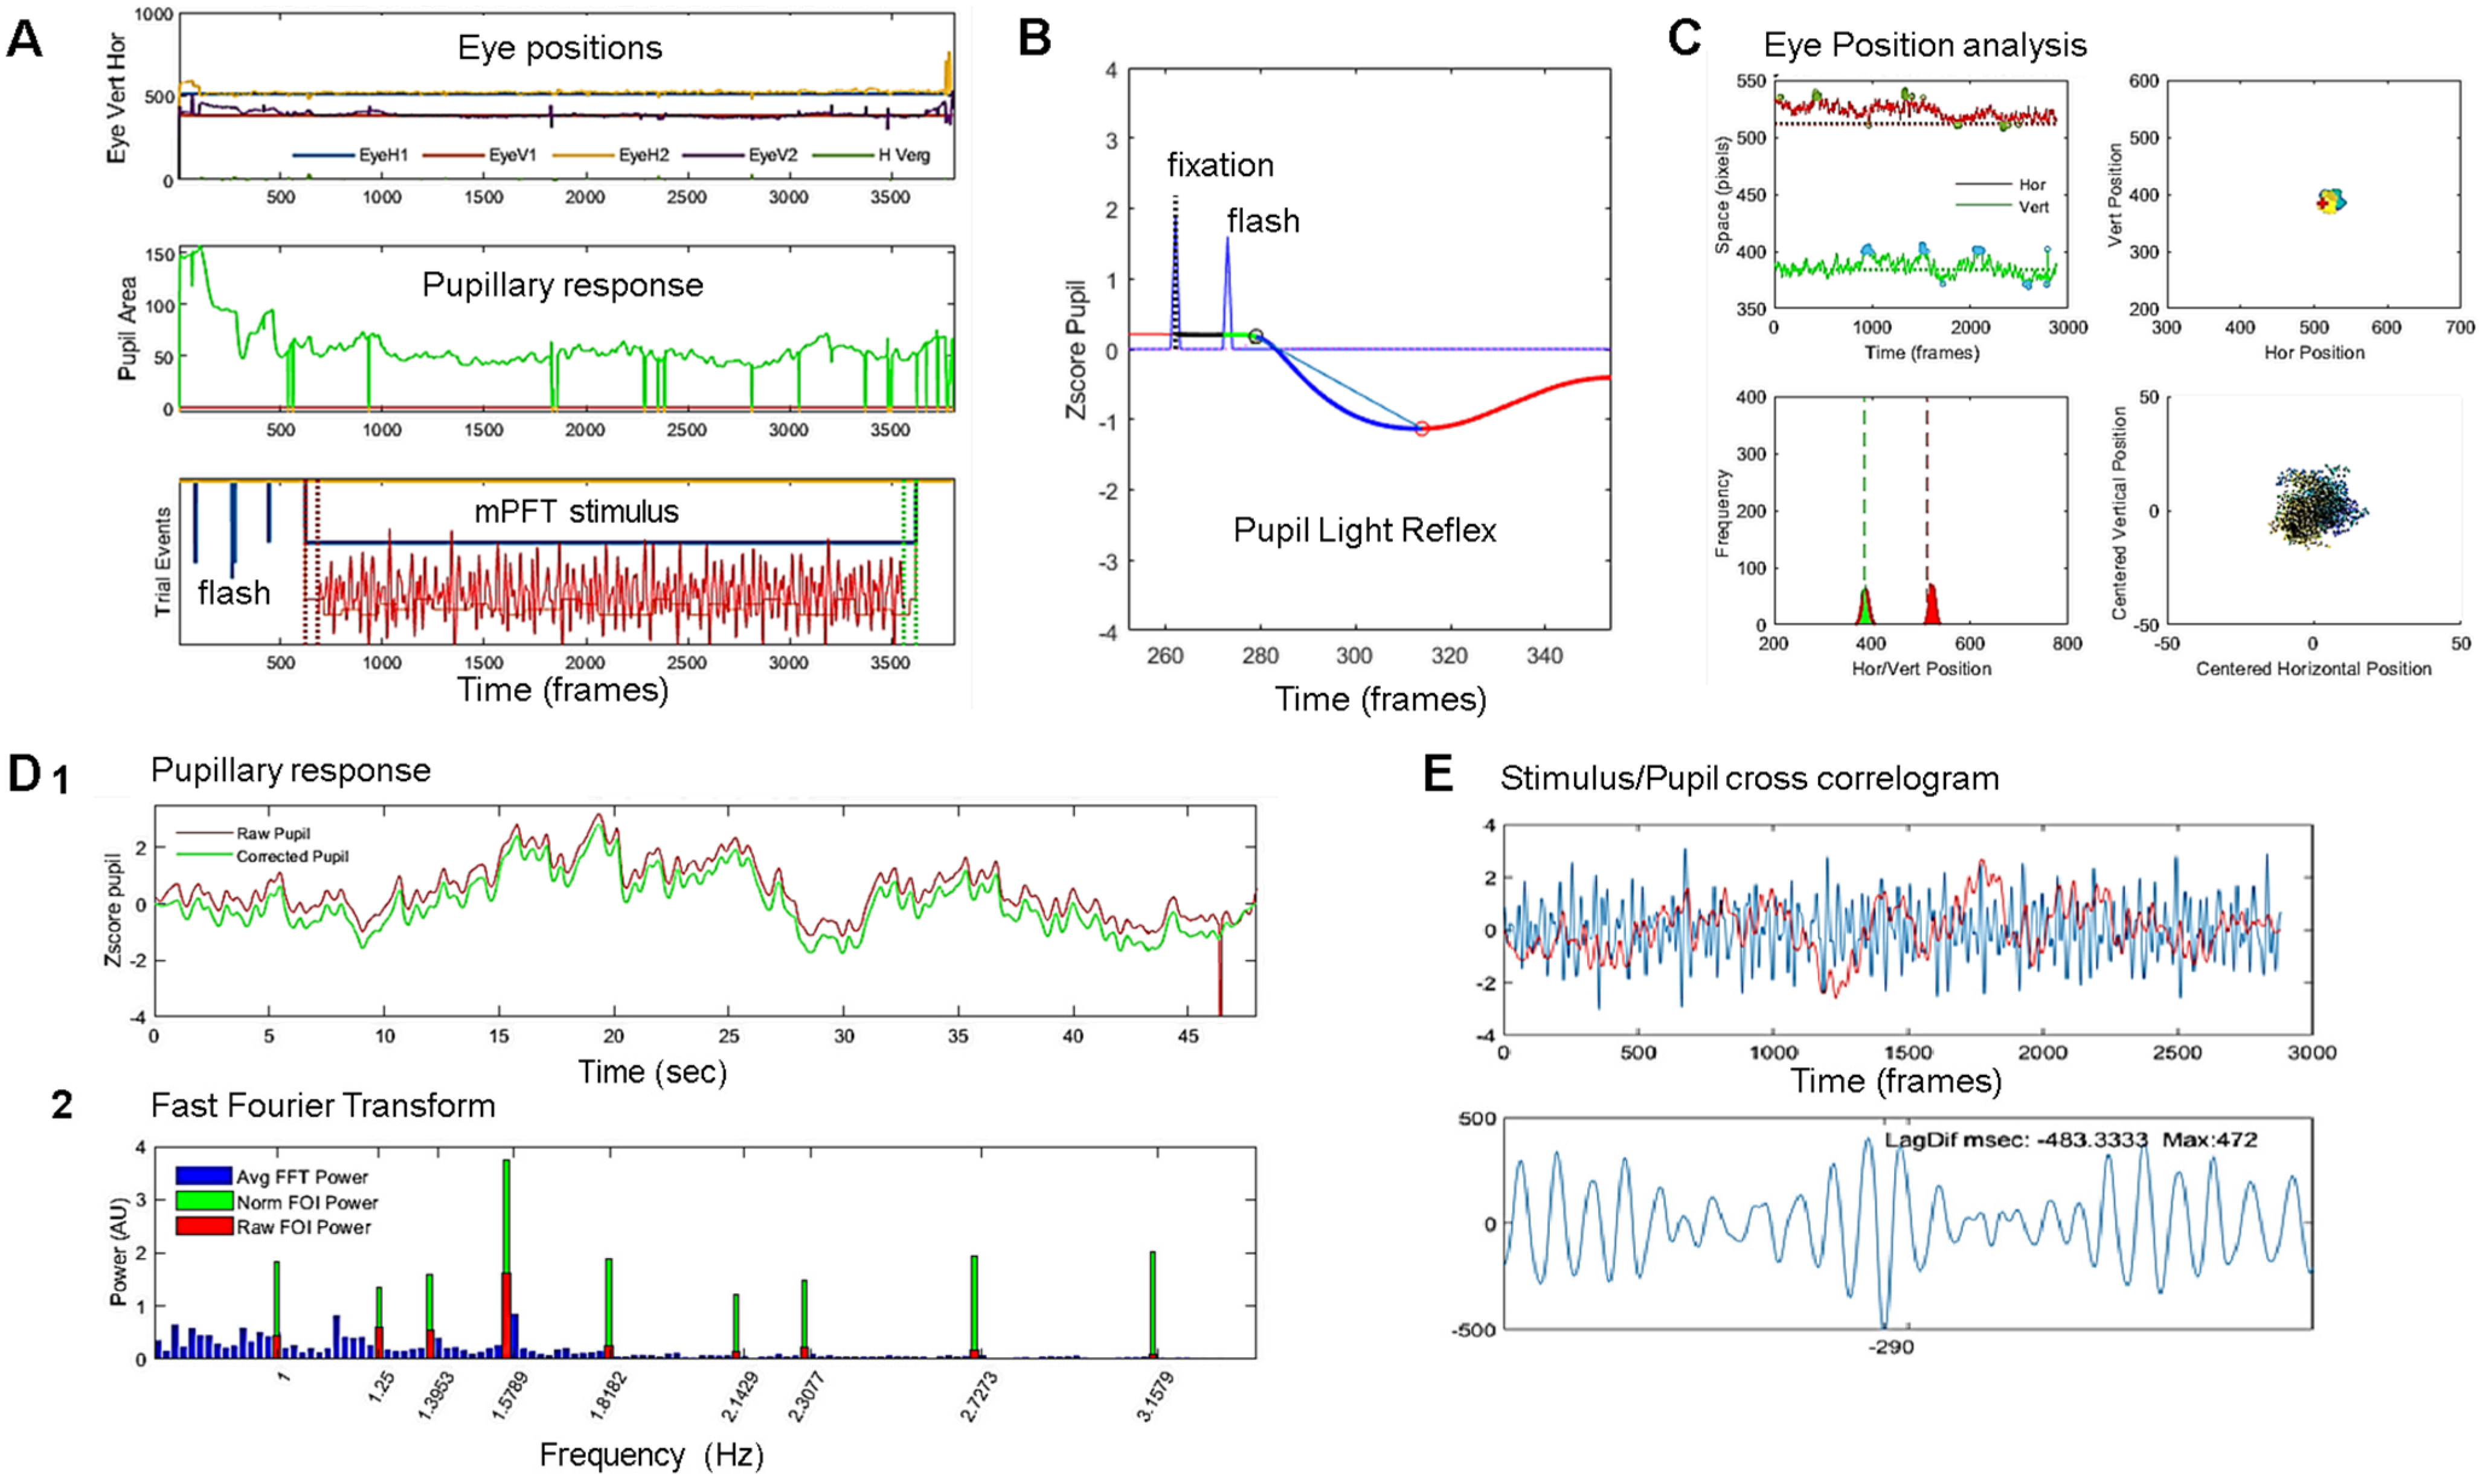
2.5. Data Analyses
2.6. Statistical Analyses
3. Results
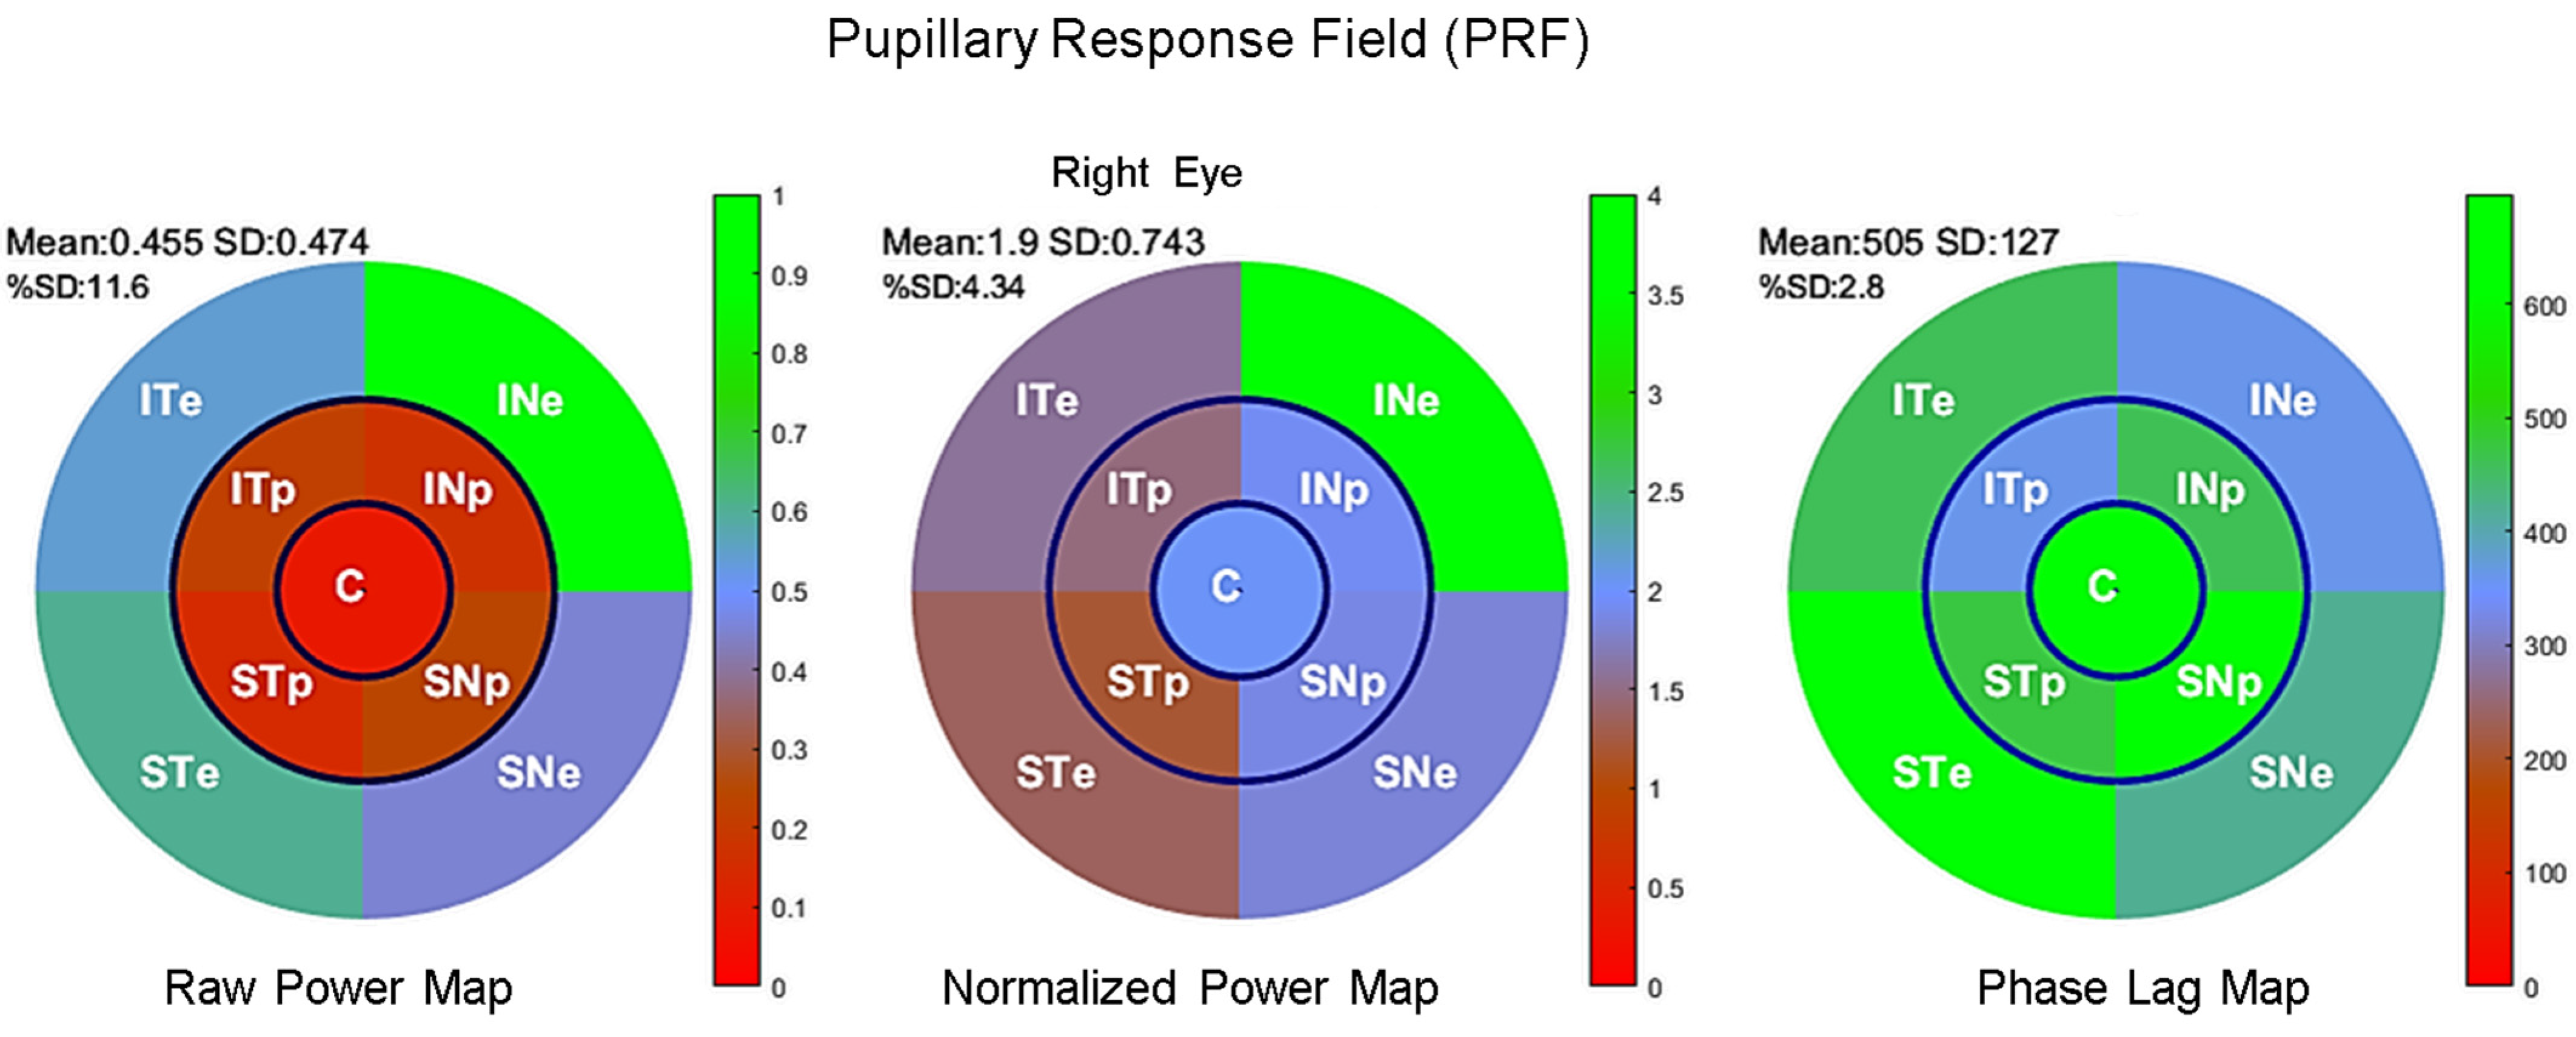
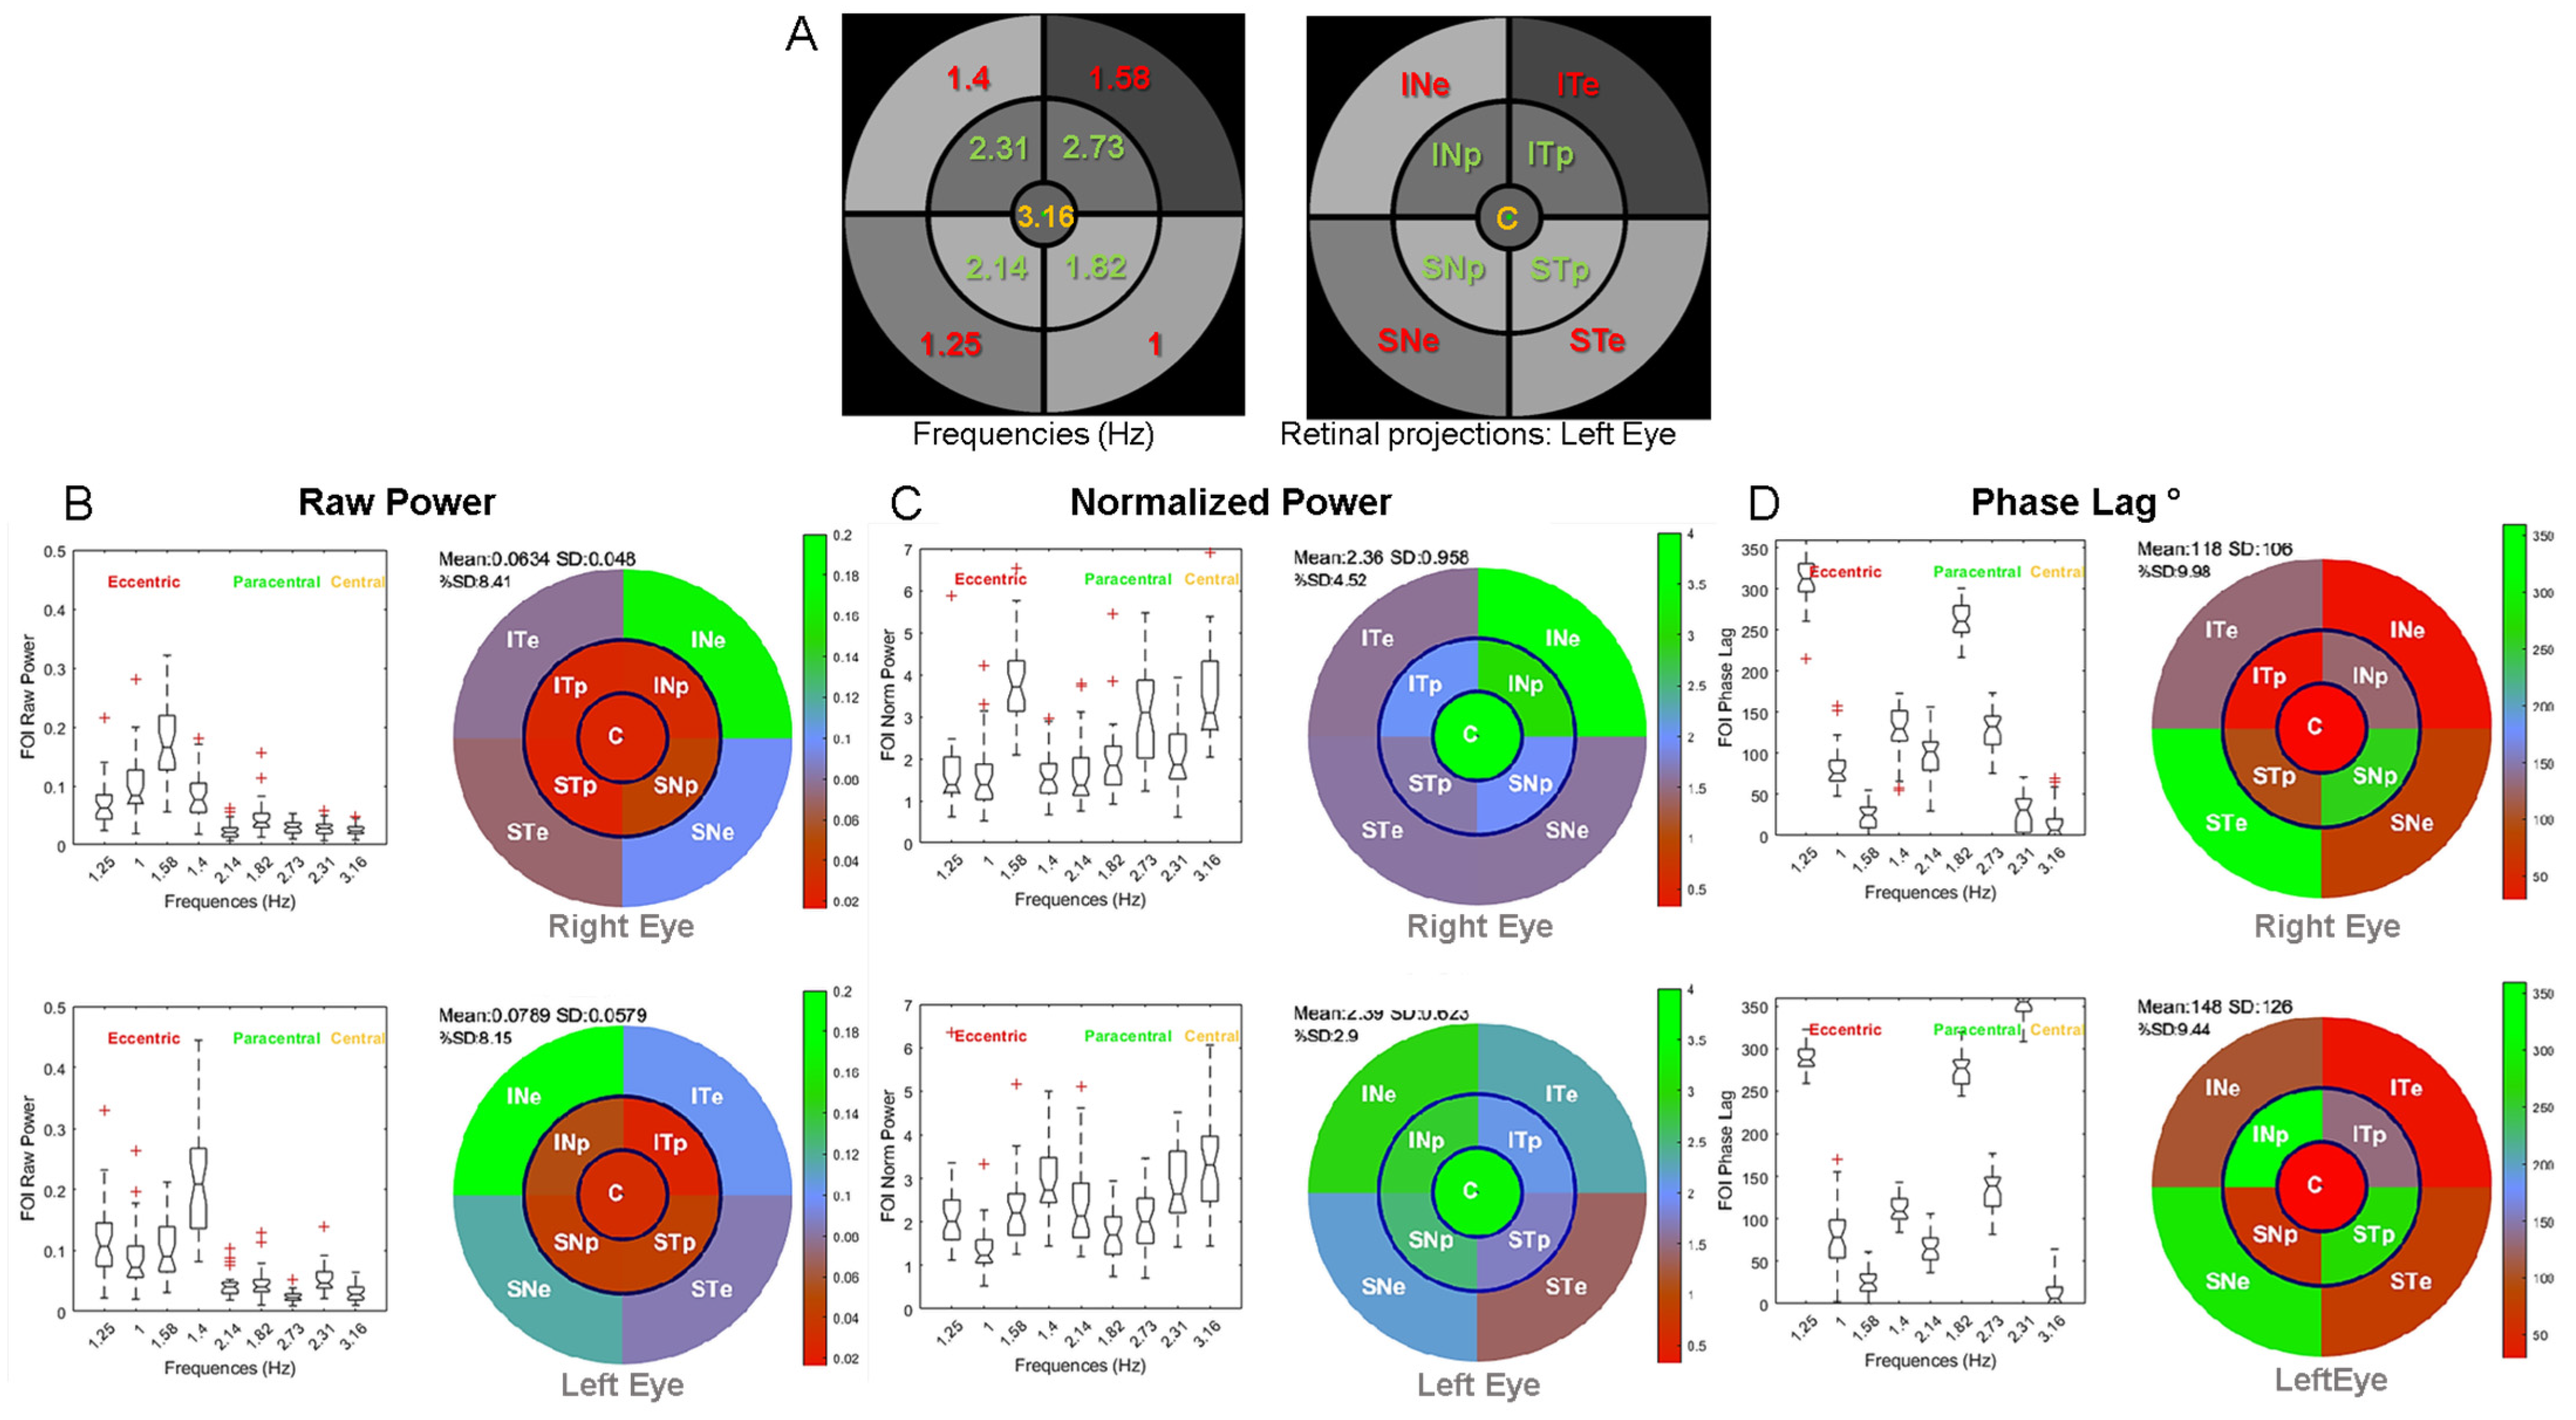
3.1. Distribution of Pupillary Spectral Power
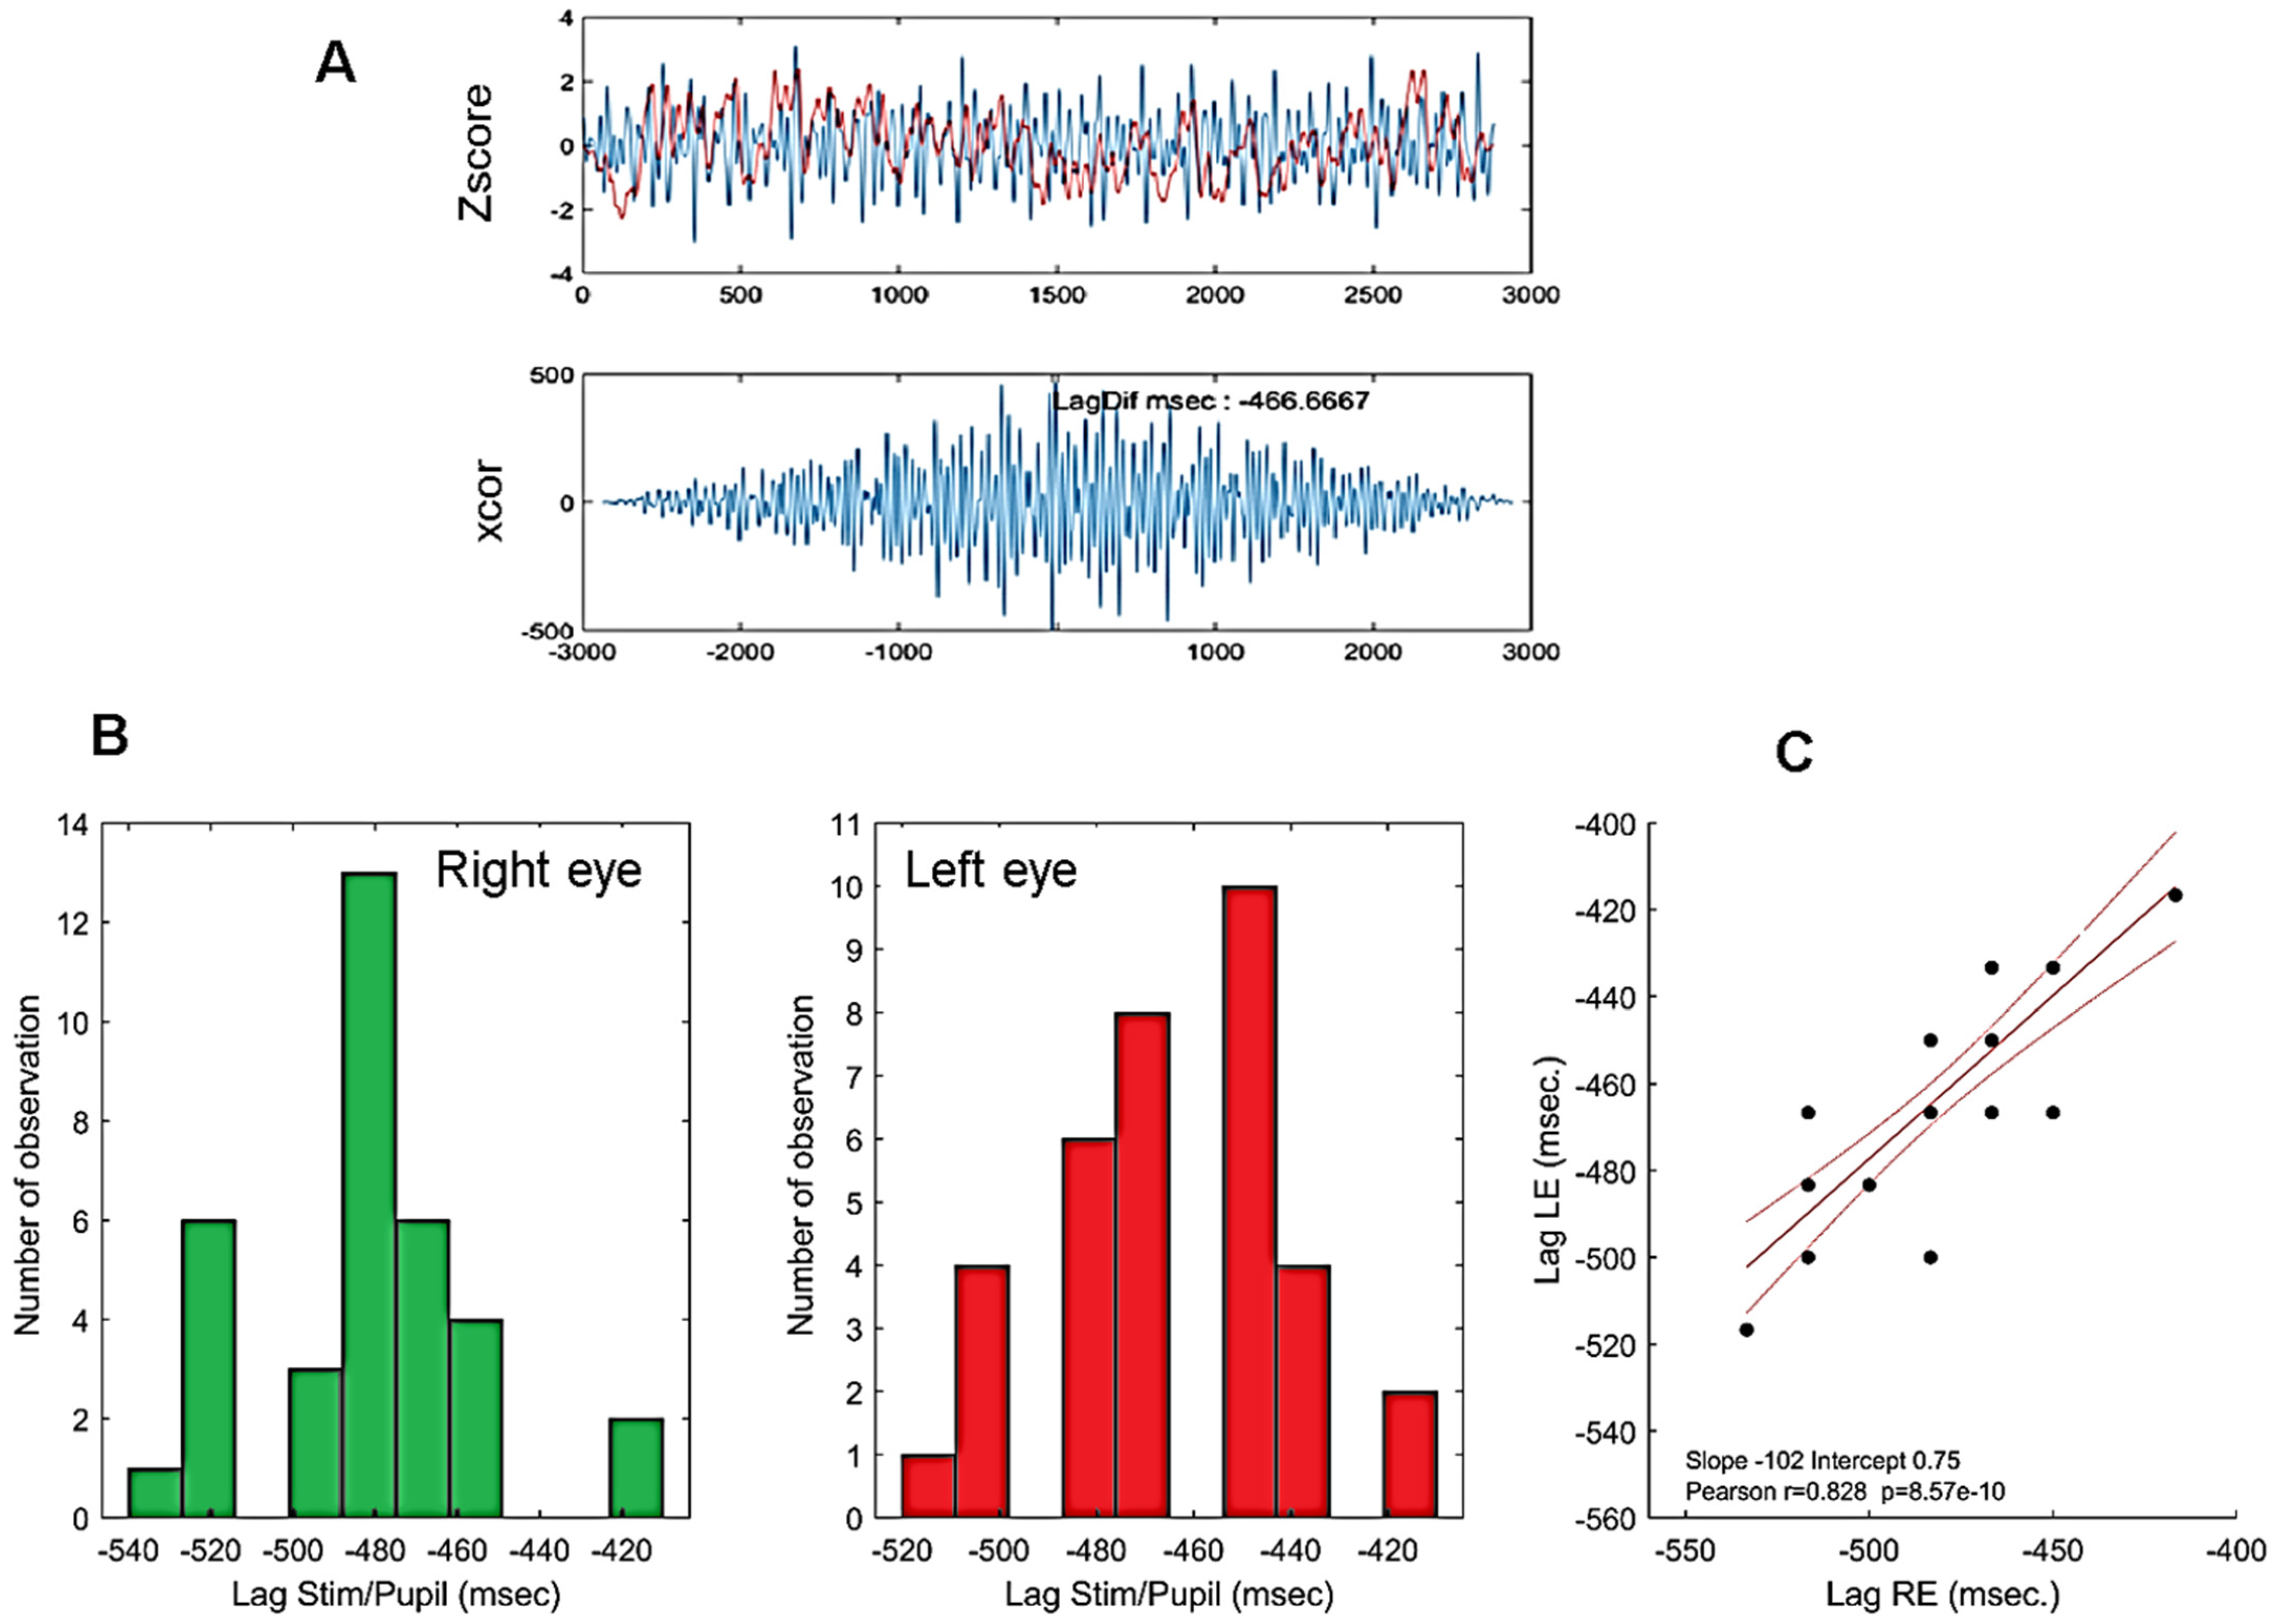
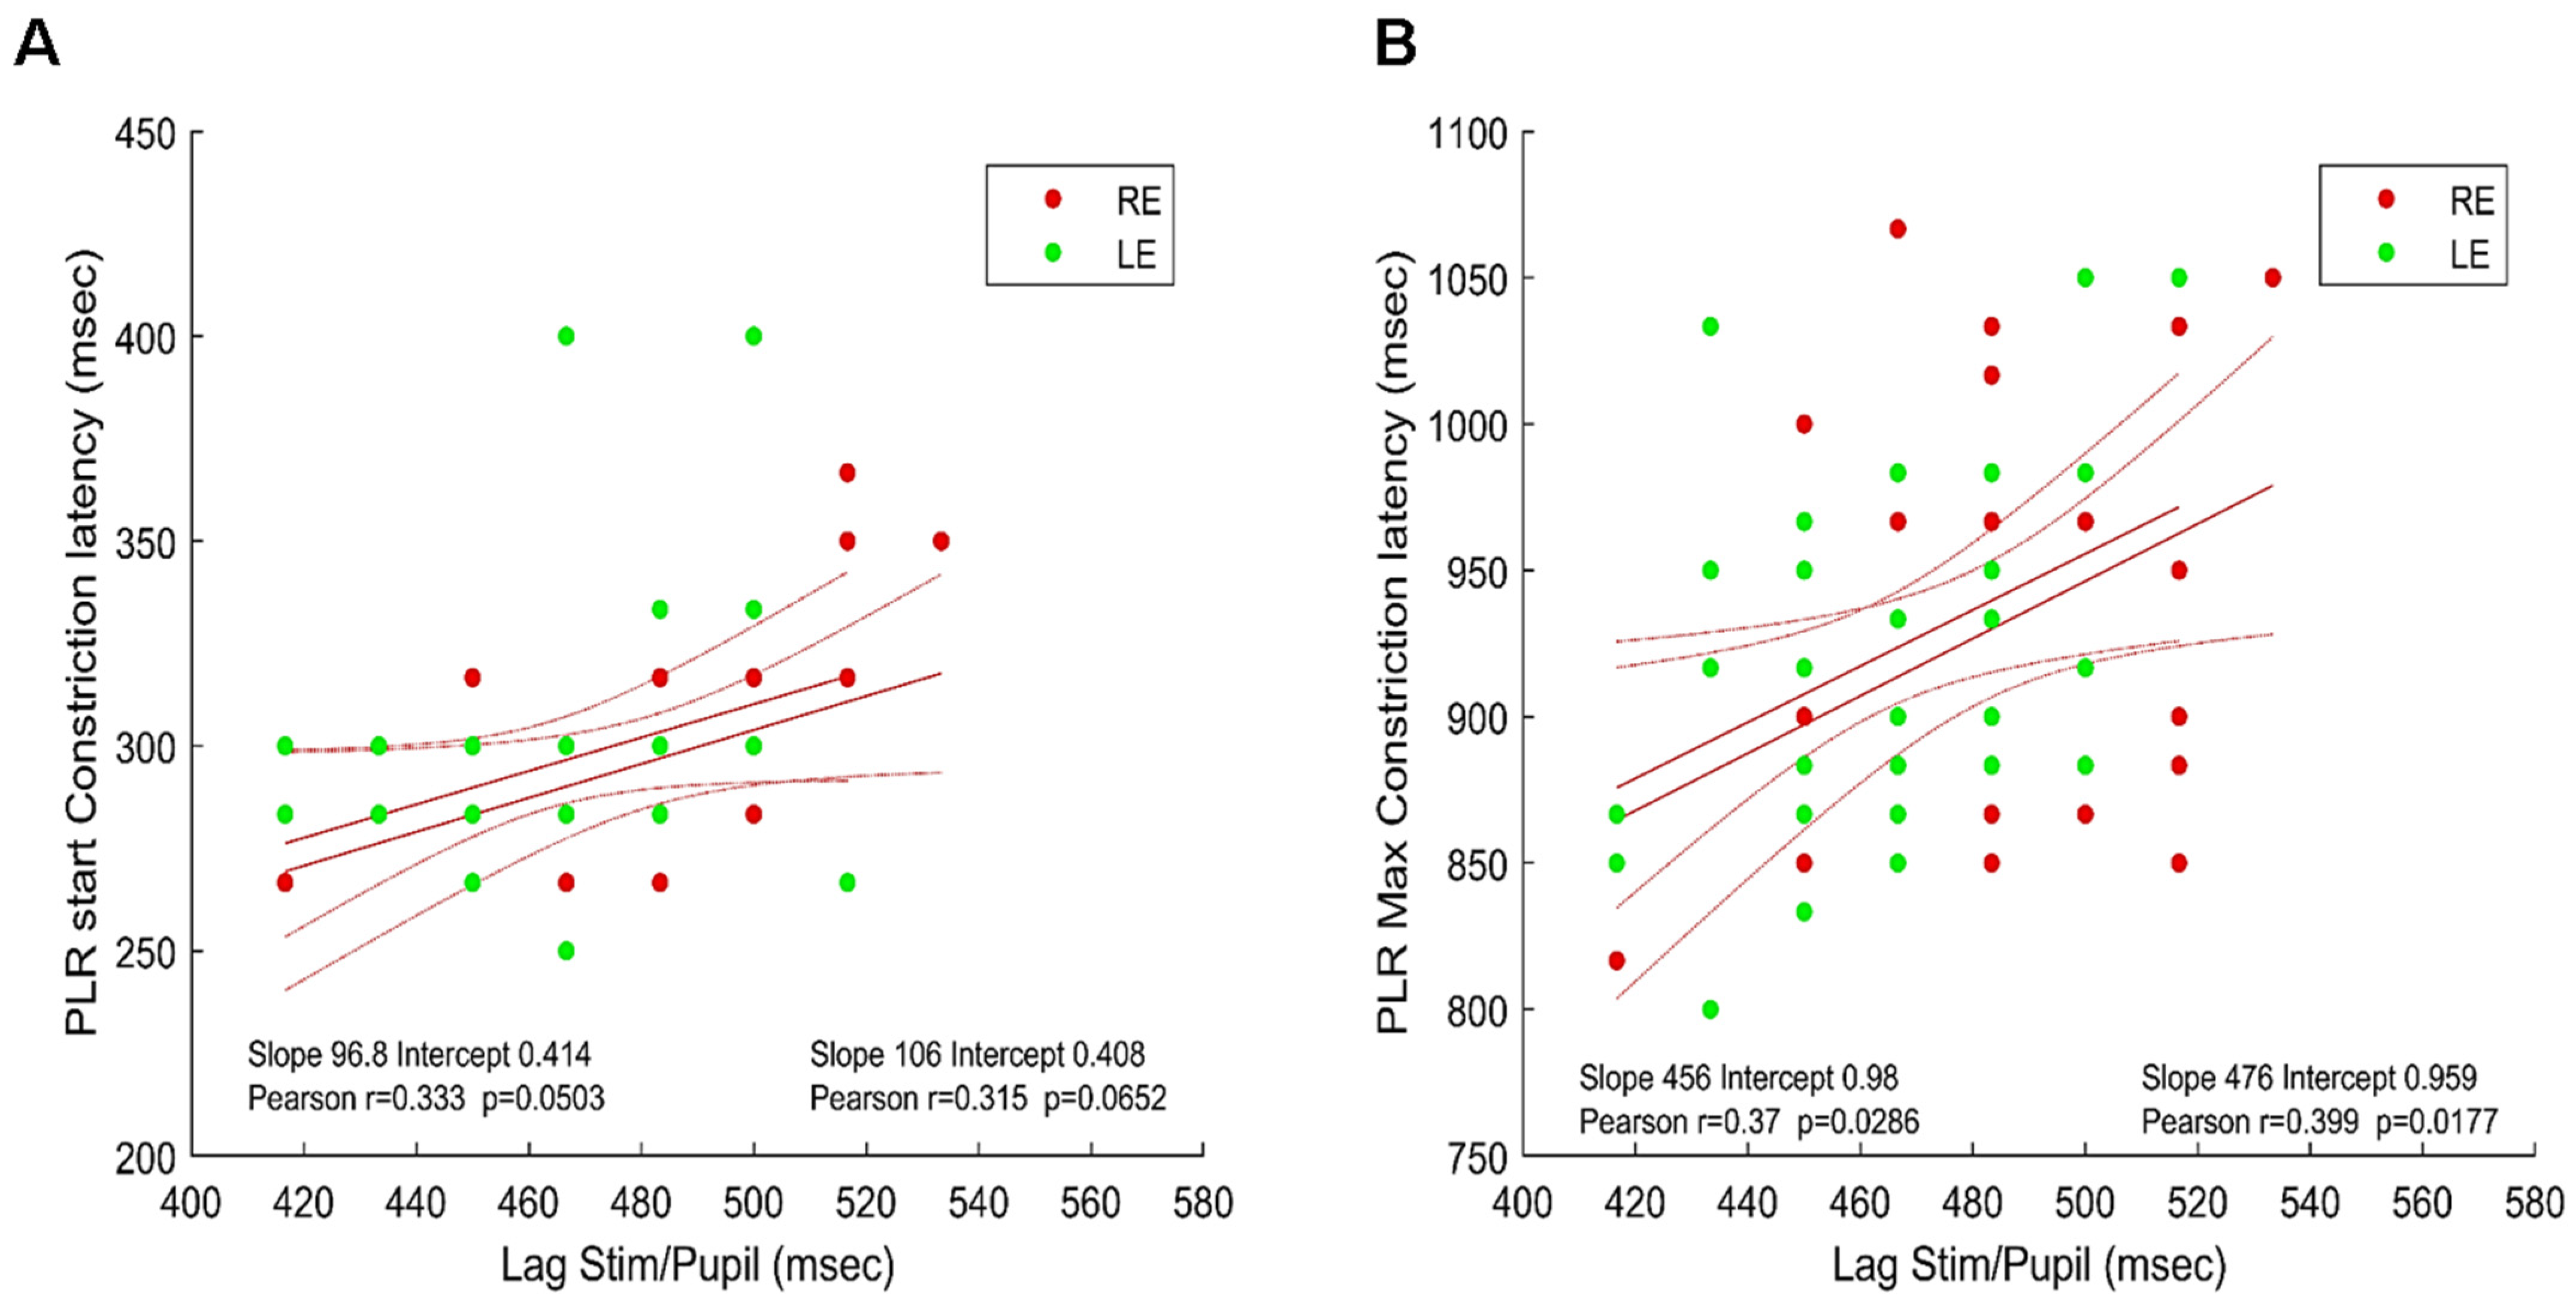
3.2. Timing of Pupillary Oscillations
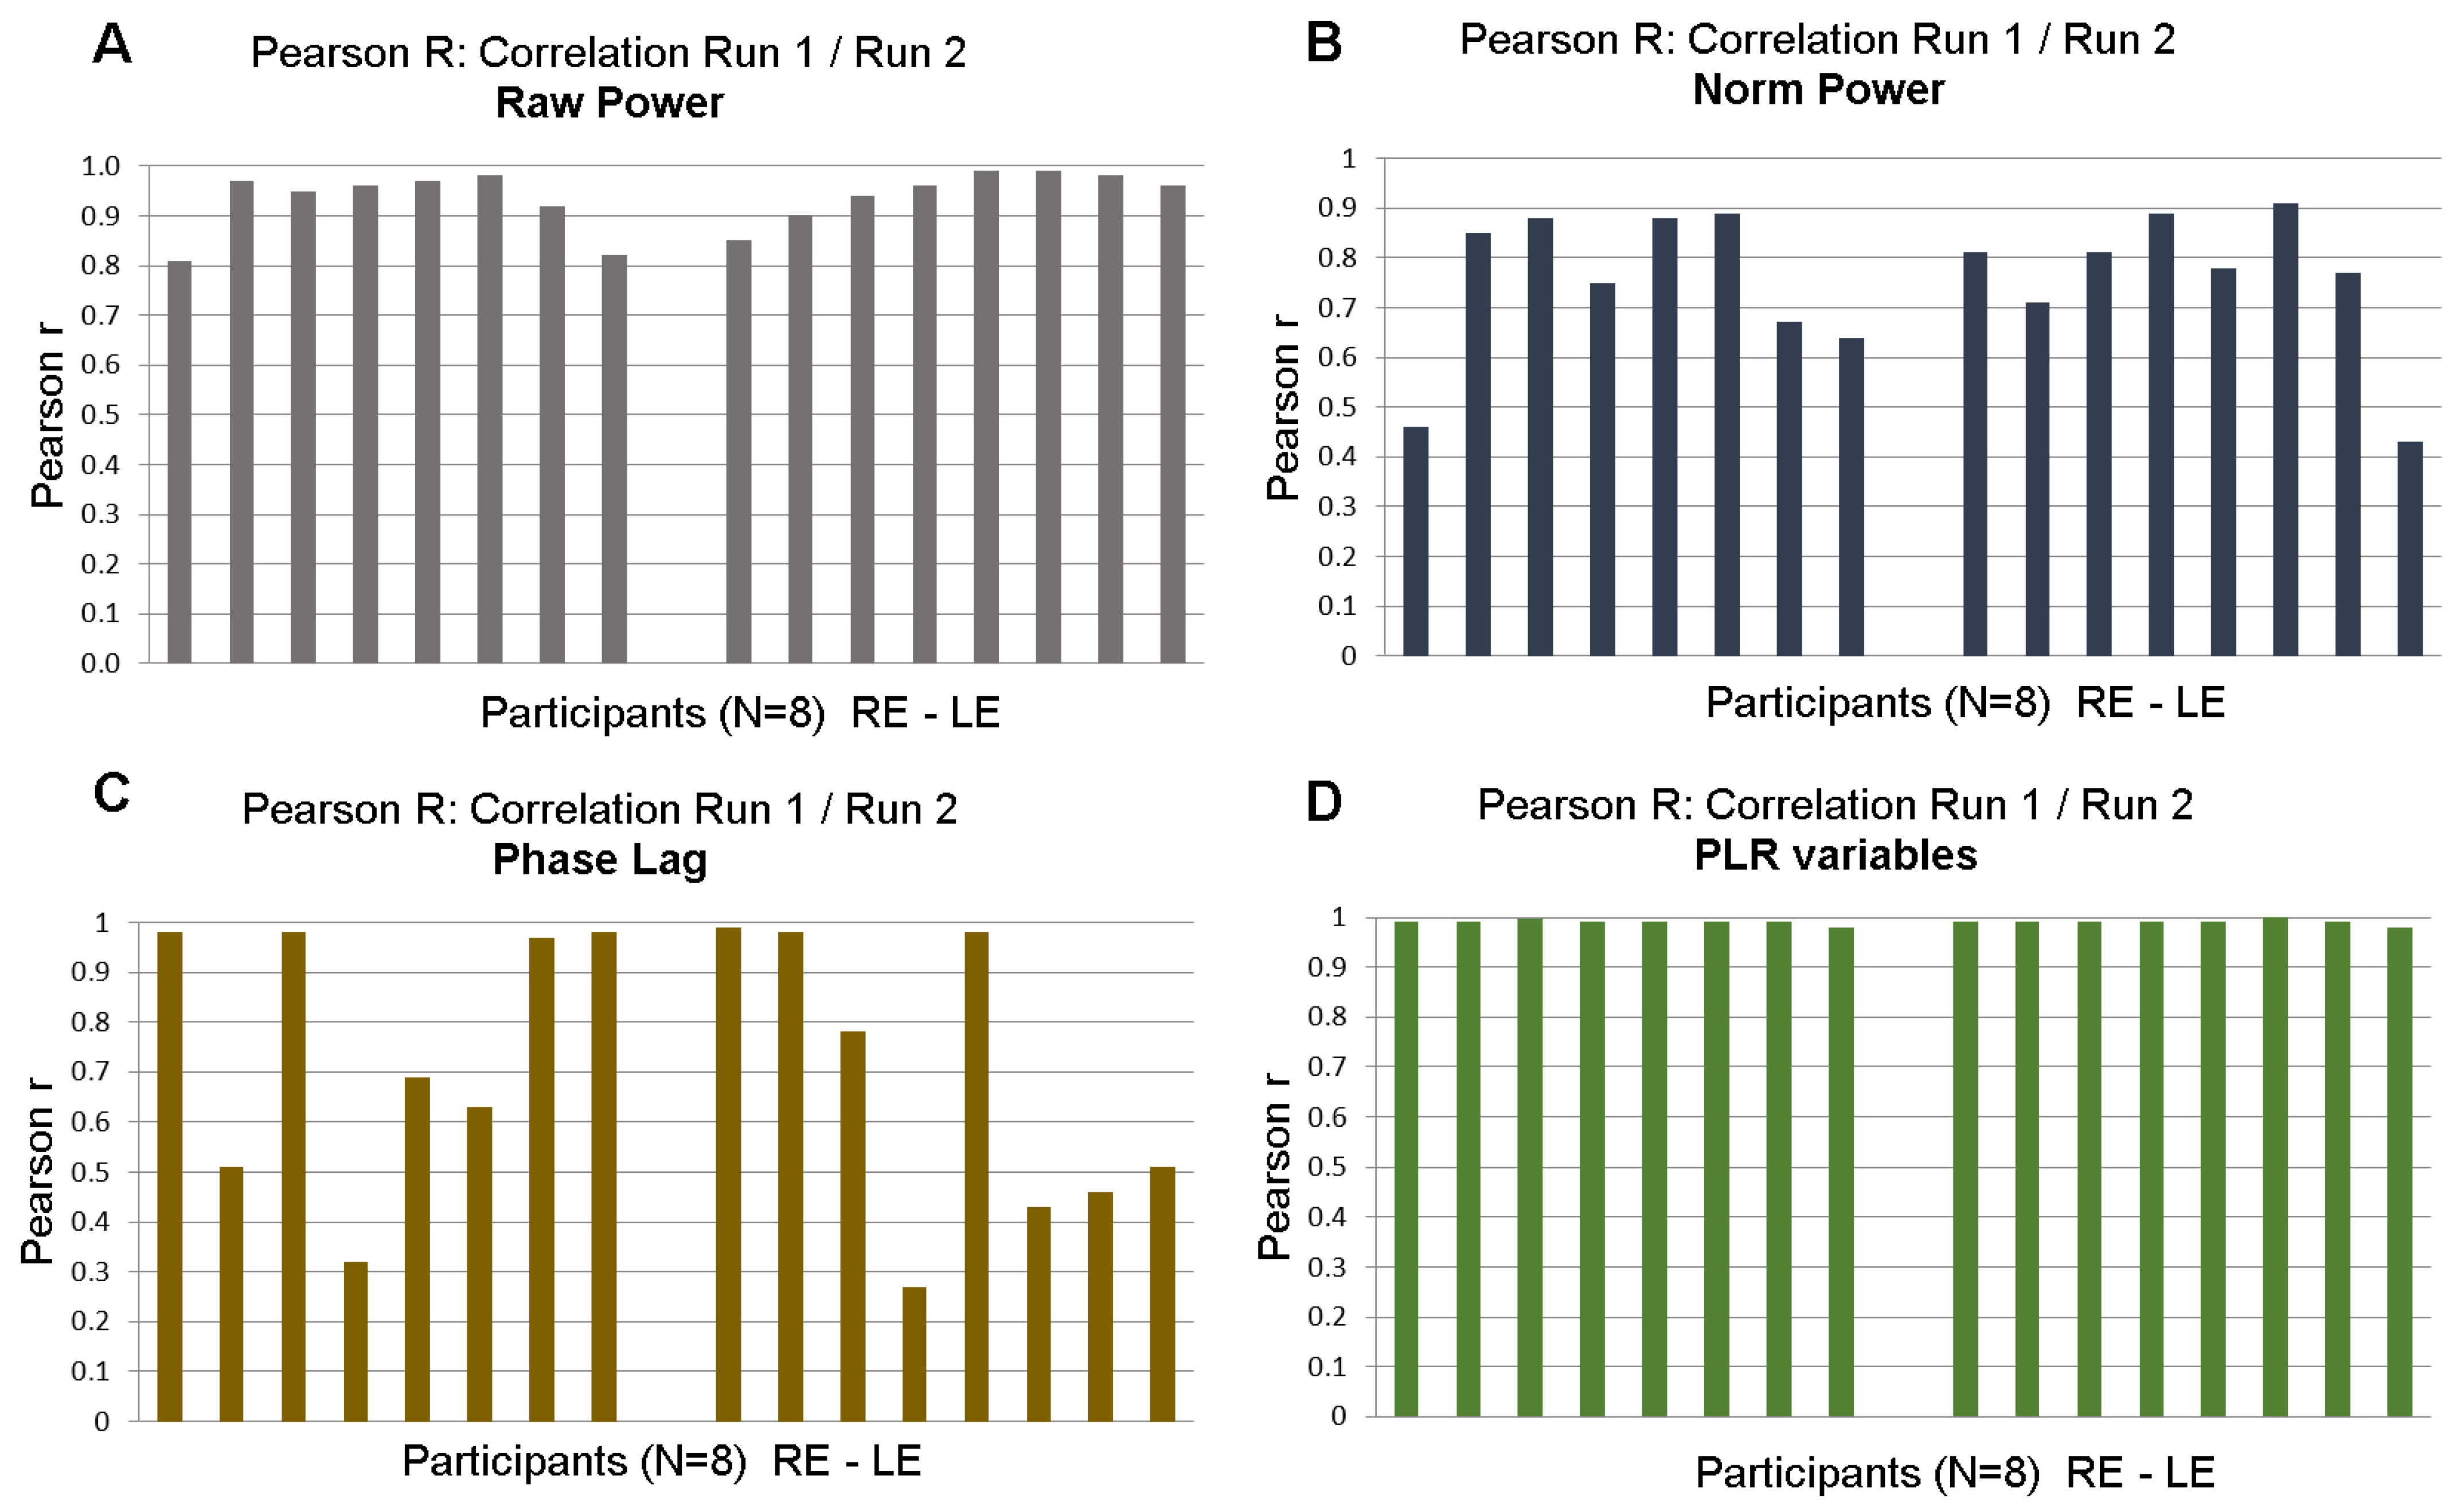
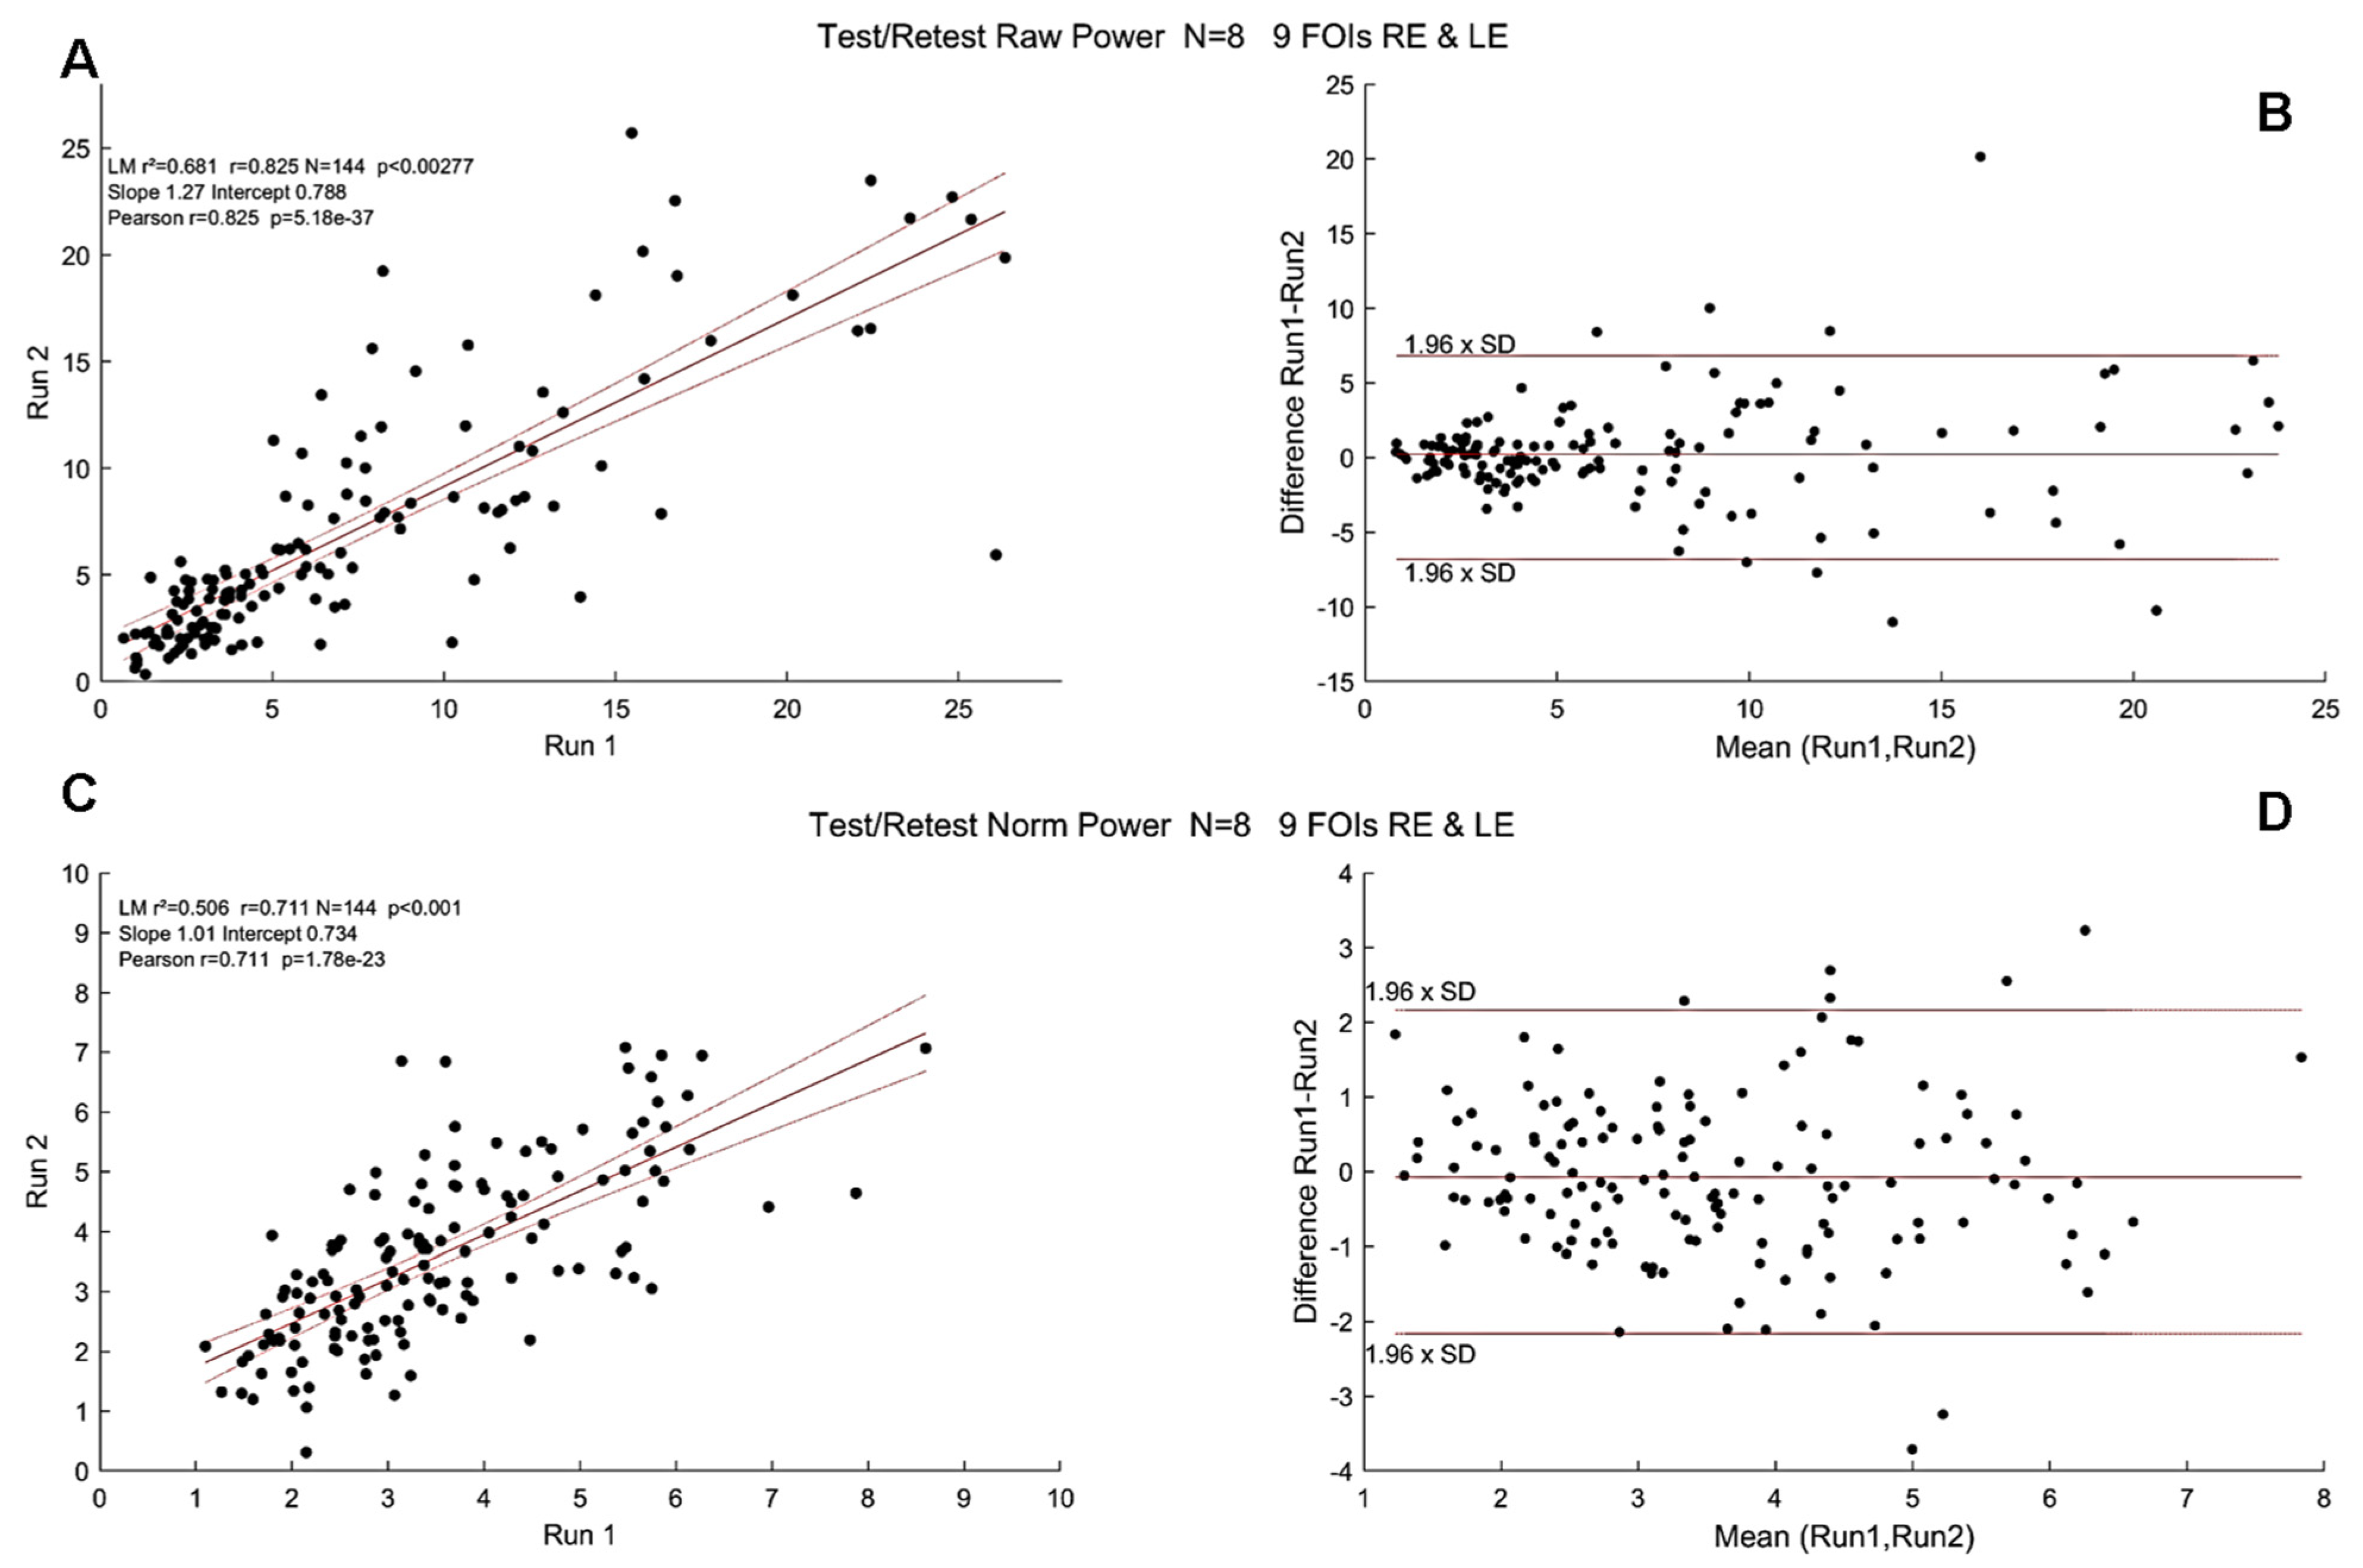
3.3. Test/Retest with mPFT
3.4. Correlations between Spectral Power and RNFL Thickness in Young Healthy Participants
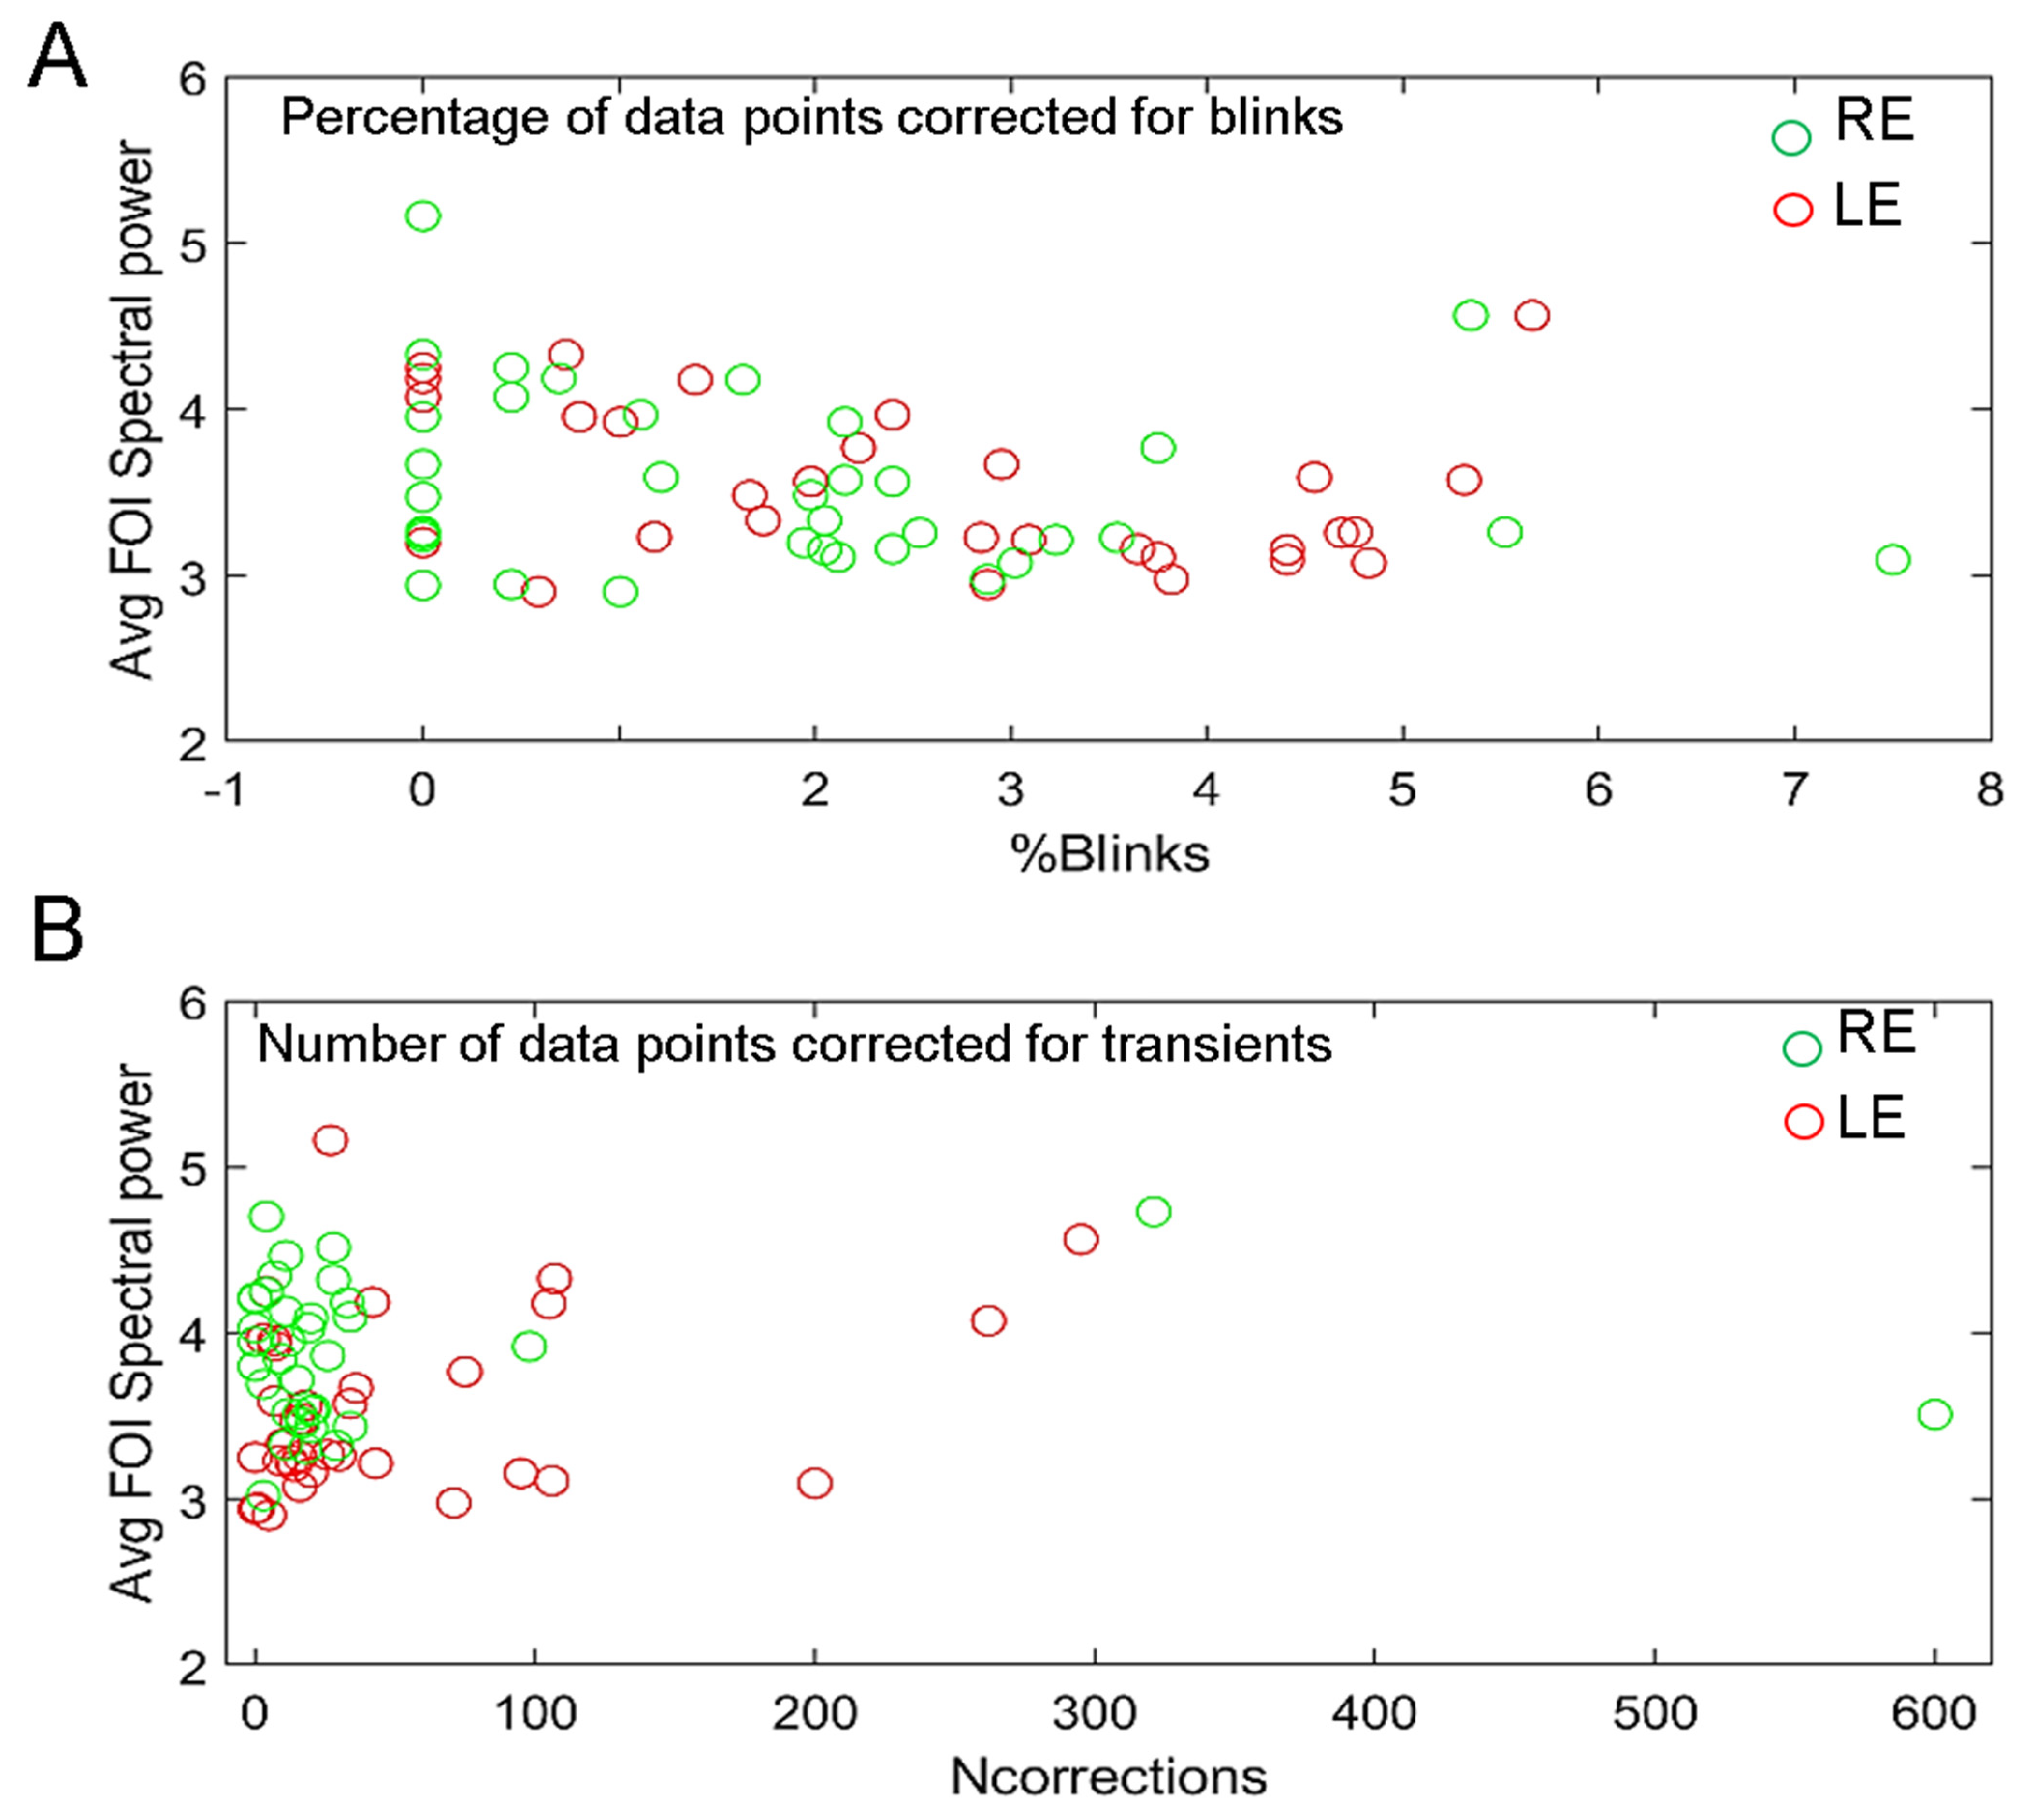
3.5. Effects of Blinks and Eye Movements and of Recording Quality
3.6. Effects of Attention on mPFT Spectral Power
3.7. mPFT and Dark Adaptation
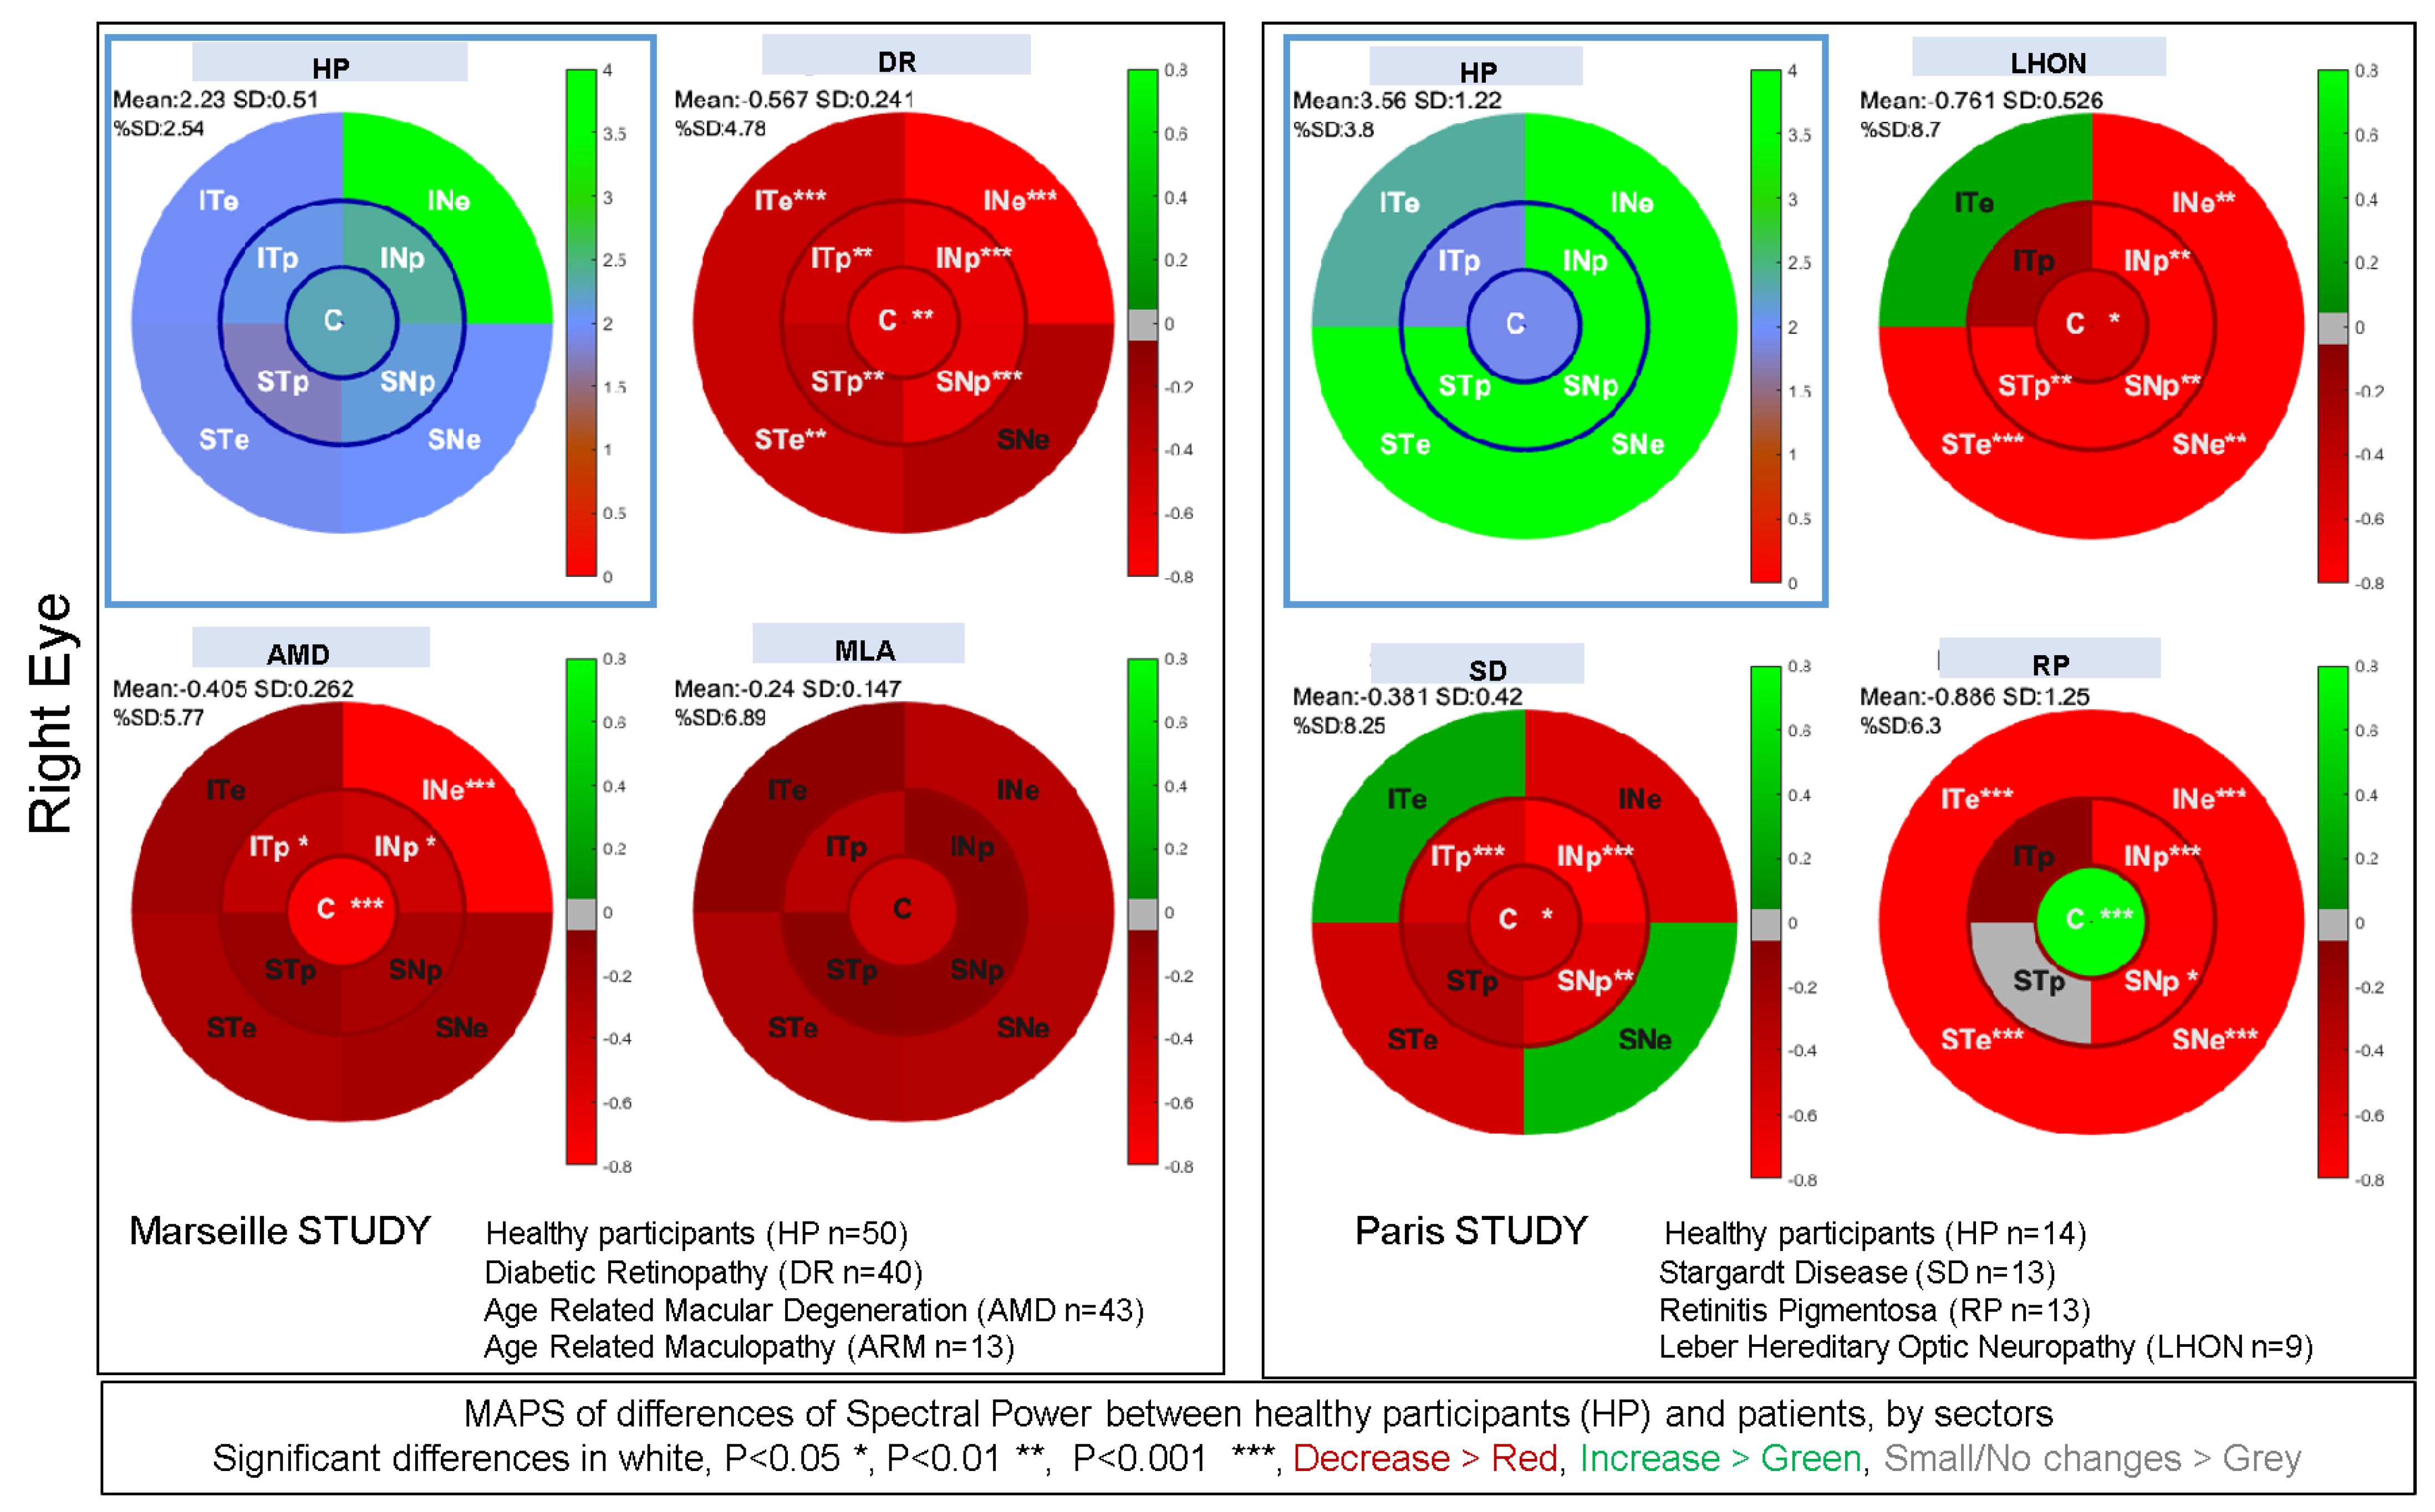
3.8. Summary of Clinical Studies Performed with mPFT
4. Discussion
4.1. Visual Field Perimetry, Pupillary Response Fields, and Structural Retinal Imaging (OCT)
4.2. Eye Trackers and Use of mPFT
4.3. Limitations and Future Directions
5. Conclusions
Supplementary Materials
Author Contributions
Funding
Institutional Review Board Statement
Informed Consent Statement
Data Availability Statement
Acknowledgments
Conflicts of Interest
References
- Szabadi, E.; Bradshaw, C.M. Autonomic pharmacology of a2-adrenoceptors. J. Psychopharmacol. 1996, 10 (Suppl. S3), 6–18. [Google Scholar]
- Provencio, I.; Rodriguez, I.R.; Jiang, G.; Hayes, W.P.; Moreira, E.F.; Rollag, M.D. A Novel Human Opsin in the Inner Retina. J. Neurosci. 2000, 20, 600–605. [Google Scholar] [CrossRef] [PubMed]
- Kahneman, D.; Beatty, J. Pupil Diameter and Load on Memory. Science 1966, 154, 1583–1585. [Google Scholar] [CrossRef] [PubMed]
- Wilhelm, H.; Wilhelm, B. Clinical Applications of Pupillography. J. Neuroophthalmol. 2003, 23, 42–49. [Google Scholar] [CrossRef] [PubMed]
- Wang, C.-A.; Munoz, D.P. A circuit for pupil orienting responses: Implications for cognitive modulation of pupil size. Curr. Opin. Neurobiol. 2015, 33, 134–140. [Google Scholar] [CrossRef] [PubMed]
- Mathôt, S. Pupillometry: Psychology, Physiology, and Function. J. Cogn. 2018, 1, 16. [Google Scholar] [CrossRef] [PubMed]
- Zele, A.J.; Gamlin, P.D. Editorial: The Pupil: Behavior, Anatomy, Physiology and Clinical Biomarkers. Front. Neurol. 2020, 11, 211. [Google Scholar] [CrossRef]
- Kelbsch, C.; Strasser, T.; Chen, Y.; Feigl, B.; Gamlin, P.D.; Kardon, R.; Peters, T.; Roecklein, K.A.; Steinhauer, S.R.; Szabadi, E.; et al. Standards in Pupillography. Front. Neurol. 2019, 10, 129. [Google Scholar] [CrossRef] [PubMed]
- Schmidt, T.M.; Chen, S.-K.; Hattar, S. Intrinsically photosensitive retinal ganglion cells: Many subtypes, diverse functions. Trends Neurosci. 2011, 34, 572–580. [Google Scholar] [CrossRef]
- Aranda, M.L.; Schmidt, T.M. Diversity of intrinsically photosensitive retinal ganglion cells: Circuits and functions. Cell. Mol. Life Sci. 2021, 78, 889–907. [Google Scholar] [CrossRef]
- Zele, A.J.; Adhikari, P.; Cao, D.; Feigl, B. Melanopsin and Cone Photoreceptor Inputs to the Afferent Pupil Light Response. Front. Neurol. 2019, 10, 529. [Google Scholar] [CrossRef] [PubMed]
- Wong, K.Y.; Dunn, F.A.; Graham, D.M.; Berson, D.M. Synaptic influences on rat ganglion-cell photoreceptors: Synaptic inputs to ganglion-cell photoreceptors. J. Physiol. 2007, 582, 279–296. [Google Scholar] [CrossRef] [PubMed]
- Wong, K.Y. The Roles of Rods, Cones, and Melanopsin in Photoresponses of M4 Intrinsically Photosensitive Retinal Ganglion Cells (ipRGCs) and Optokinetic Visual Behavior. Front. Cell. Neurosci. 2018, 12, 14. [Google Scholar]
- Contreras, E.; Nobleman, A.P.; Robinson, P.R.; Schmidt, T.M. Melanopsin phototransduction: Beyond canonical cascades. J. Exp. Biol. 2021, 224, jeb226522. [Google Scholar] [CrossRef]
- Güler, A.D.; Ecker, J.L.; Lall, G.S.; Haq, S.; Altimus, C.M.; Liao, H.-W.; Barnard, A.R.; Cahill, H.; Badea, T.C.; Zhao, H.; et al. Melanopsin cells are the principal conduits for rod–cone input to non-image-forming vision. Nature 2008, 453, 102–105. [Google Scholar] [CrossRef]
- Feigl, B.; Zele, A.J. Melanopsin-Expressing Intrinsically Photosensitive Retinal Ganglion Cells in Retinal Disease. Optom. Vis. Sci. 2014, 91, 894–903. [Google Scholar] [CrossRef] [PubMed]
- Joyce, D.S.; Feigl, B.; Kerr, G.; Roeder, L.; Zele, A.J. Melanopsin-mediated pupil function is impaired in Parkinson’s disease. Sci. Rep. 2018, 8, 7796. [Google Scholar] [CrossRef]
- Miller, S.D.; Thompson, H.S. Edge-light pupil cycle time. Br. J. Ophthalmol. 1978, 62, 495–500. [Google Scholar] [CrossRef]
- Lamirel, C.; Ajasse, S.; Moulignier, A.; Salomon, L.; Deschamps, R.; Gueguen, A.; Vignal, C.; Cochereau, I.; Lorenceau, J. A novel method of inducing endogenous pupil oscillations to detect patients with unilateral optic neuritis. PLoS ONE 2018, 13, e0201730. [Google Scholar] [CrossRef]
- Najjar, R.P.; Sharma, S.; Atalay, E.; Rukmini, A.V.; Sun, C.; Lock, J.Z.; Baskaran, M.; Perera, S.A.; Husain, R.; Lamoureux, E.; et al. Pupillary Responses to Full-Field Chromatic Stimuli Are Reduced in Patients with Early-Stage Primary Open-Angle Glaucoma. Ophthalmology 2018, 125, 1362–1371. [Google Scholar] [CrossRef]
- Naber, M.; Roelofzen, C.; Fracasso, A.; Bergsma, D.P.; van Genderen, M.; Porro, G.L.; Dumoulin, S.O. Gaze-Contingent Flicker Pupil Perimetry Detects Scotomas in Patients With Cerebral Visual Impairments or Glaucoma. Front. Neurol. 2018, 9, 558. [Google Scholar] [CrossRef] [PubMed]
- Binda, P.; Gamlin, P.D. Renewed Attention on the Pupil Light Reflex. Trends Neurosci. 2017, 40, 455–457. [Google Scholar] [CrossRef] [PubMed]
- Wilhelm, H.; Neitzel, J.; Wilhelm, B.; Beuel, S.; Ludtke, H.; Kretschmann, U.; Zrenner, E. Pupil Perimetry using M-Sequence Stimulation Technique. Investig. Ophthalmol. Vis. Sci. 2000, 41, 1229–1238. [Google Scholar]
- Maddess, T.; Bedford, S.M.; Goh, X.-L.; James, A.C. Multifocal pupillographic visual field testing in glaucoma. Clin. Experiment. Ophthalmol. 2009, 37, 678–686. [Google Scholar] [CrossRef]
- Sabeti, F.; Carle, C.F.; Nolan, C.J.; Jenkins, A.J.; James, A.C.; Baker, L.; Coombes, C.E.; Cheung, V.; Chiou, M.; Maddess, T. Multifocal pupillographic objective perimetry for assessment of early diabetic retinopathy and generalised diabetes-related tissue injury in persons with type 1 diabetes. BMC Ophthalmol. 2022, 22, 166. [Google Scholar] [CrossRef] [PubMed]
- Portengen, B.L.; Porro, G.L.; Imhof, S.M.; Naber, M. Comparison of unifocal, flicker, and multifocal pupil perimetry methods in healthy adults. J. Vis. 2022, 22, 7. [Google Scholar] [CrossRef] [PubMed]
- Hong, S.; Narkiewicz, J.; Kardon, R.H. Comparison of Pupil Perimetry and Visual Perimetry in Normal Eyes: Decibel Sensitivity and Variability. Investig. Ophthalmol. Vis. Sci. 2001, 42, 957–965. [Google Scholar]
- Crabb, D.P.; Smith, N.D.; Glen, F.C.; Burton, R.; Garway-Heath, D.F. How Does Glaucoma Look? Ophthalmology 2013, 120, 1120–1126. [Google Scholar] [CrossRef] [PubMed]
- Verghese, P.; Vullings, C.; Shanidze, N. Eye Movements in Macular Degeneration. Annu. Rev. Vis. Sci. 2021, 7, 773–791. [Google Scholar] [CrossRef]
- Lamirel, C.; Milea, D.; Cochereau, I.; Duong, M.-H.; Lorenceau, J. Impaired Saccadic Eye Movement in Primary Open-angle Glaucoma. J. Glaucoma 2014, 23, 23–32. [Google Scholar] [CrossRef]
- Ajasse, S.; Vignal-Clermont, C.; Mohand-Said, S.; Coen, C.; Romand, C.; Lorenceau, J. One minute Multiple Pupillary Frequency Tagging Test to Assess Visual Field Defects. medRxiv, 2022; preprint. [Google Scholar] [CrossRef]
- Stelandre, A.; Rouland, J.-F.; Lorenceau, J. Évaluation d’une méthode pupillométrique pour la détection du glaucome. J. Fr. Ophtalmol. 2023, 46, 475–494. [Google Scholar] [CrossRef] [PubMed]
- Ajasse, P.S. Pupillométrie Dynamique: Approches Fondamentales et Cliniques. Ph.D. Thesis, Sciences Cognitives, Sorbonne University, Paris, France, 2019. [Google Scholar]
- Clarke, R.J.; Zhang, H.; Gamlin, P.D.R. Characteristics of the Pupillary Light Reflex in the Alert Rhesus Monkey. J. Neurophysiol. 2003, 89, 3179–3189. [Google Scholar] [CrossRef] [PubMed]
- Lorenceau, J.; Humbert, R. A multipurpose software package for editing two-dimensional animated images. Behav. Res. Methods Instrum. Comput. 1990, 22, 453–465. [Google Scholar] [CrossRef]
- Ajasse, S.; Vignal-Clermont, C.; Mohand-Saïd, S.; Coen, C.; Romand, C.; Lorenceau, J. Computerized biofeedback to characterize Pupil Cycle Time (PCT) in Neuropathies and Retinopathies. medRxiv, 2022; preprint. [Google Scholar] [CrossRef]
- Berens, P. CircStat: A MATLAB Toolbox for Circular Statistics. J. Stat. Softw. 2009, 31, 1–21. [Google Scholar] [CrossRef]
- Altman, D.G.; Bland, J.M. Measurement in Medicine: The Analysis of Method Comparison Studies. The Statistician 1983, 32, 307. [Google Scholar] [CrossRef]
- Hannibal, J.; Christiansen, A.T.; Heegaard, S.; Fahrenkrug, J.; Kiilgaard, J.F. Melanopsin expressing human retinal ganglion cells: Subtypes, distribution, and intraretinal connectivity. J. Comp. Neurol. 2017, 525, 1934–1961. [Google Scholar] [CrossRef]
- Tan, L.; Kondo, M.; Sato, M.; Kondo, N.; Miyake, Y. Multifocal pupillary light response fields in normal subjects and patients with visual field defects. Vision Res. 2001, 41, 1073–1084. [Google Scholar] [CrossRef]
- Ellis, C.J. The pupillary light reflex in normal subjects. Br. J. Ophthalmol. 1981, 65, 754–759. [Google Scholar] [CrossRef] [PubMed]
- Chang, D.S.; Boland, M.V.; Arora, K.S.; Supakontanasan, W.; Chen, B.B.; Friedman, D.S. Symmetry of the Pupillary Light Reflex and Its Relationship to Retinal Nerve Fiber Layer Thickness and Visual Field Defect. Investig. Opthalmol. Vis. Sci. 2013, 54, 5596. [Google Scholar] [CrossRef]
- Gracitelli, C.P.B.; Duque-Chica, G.L.; Moura, A.L.; Nagy, B.V.; De Melo, G.R.; Roizenblatt, M.; Borba, P.D.; Teixeira, S.H.; Ventura, D.F.; Paranhos, A. A Positive Association between Intrinsically Photosensitive Retinal Ganglion Cells and Retinal Nerve Fiber Layer Thinning in Glaucoma. Investig. Ophthalmol. Vis. Sci. 2014, 55, 7997–8005. [Google Scholar] [CrossRef]
- Rukmini, A.V.; Milea, D.; Gooley, J.J. Chromatic Pupillometry Methods for Assessing Photoreceptor Health in Retinal and Optic Nerve Diseases. Front. Neurol. 2019, 10, 76. [Google Scholar] [CrossRef]
- Hupe, J.M.; Lamirel, C.; Lorenceau, J. Pupil dynamics during bistable motion perception. J. Vis. 2009, 9, 10. [Google Scholar] [CrossRef]
- Ajasse, S.; Benosman, R.B.; Lorenceau, J. Effects of pupillary responses to luminance and attention on visual spatial discrimination. J. Vis. 2018, 18, 6. [Google Scholar] [CrossRef] [PubMed]
- Beier, C.; Bocchero, U.; Levy, L.; Zhang, Z.; Jin, N.; Massey, S.C.; Ribelayga, C.P.; Martemyanov, K.; Hattar, S.; Pahlberg, J. Divergent outer retinal circuits drive image and non-image visual behaviors. Cell Rep. 2022, 39, 111003. [Google Scholar] [CrossRef]
- Bremner, F.D. Pupil assessment in optic nerve disorders. Eye 2004, 18, 1175–1181. [Google Scholar] [CrossRef] [PubMed]
- Bremner, F. Pupil evaluation as a test for autonomic disorders. Clin. Auton. Res. 2009, 19, 88–101. [Google Scholar] [CrossRef] [PubMed]
- Mylius, V.; Braune, H.J.; Schepelmann, K. Dysfunction of the pupillary light reflex following migraine headache. Clin. Auton. Res. 2003, 13, 16–21. [Google Scholar] [CrossRef]
- Howarth, P.A.; Heron, G.; Greenhouse, D.S.; Bailey, I.L.; Berman, S.M. Discomfort from glare: The role of pupillary hippus. Light Res. Technol. 1993, 25, 37–42. [Google Scholar] [CrossRef]
- Scinto, L.F.M.; Frosch, M.; Wu, C.K.; Daffner, K.R.; Gedi, N.; Geula, C. Selective cell loss in Edinger-Westphal in asymptomatic elders and Alzheimer’s patients. Neurobiol. Aging 2001, 22, 729–736. [Google Scholar] [CrossRef]
- Chougule, P.S.; Najjar, R.P.; Finkelstein, M.T.; Kandiah, N.; Milea, D. Light-Induced Pupillary Responses in Alzheimer’s Disease. Front. Neurol. 2019, 10, 360. [Google Scholar] [CrossRef]
- Hoffmann, M.B.; Bach, M.; Kondo, M.; Li, S.; Walker, S.; Holopigian, K.; Viswanathan, S.; Robson, A.G. ISCEV standard for clinical multifocal electroretinography (mfERG) (2021 update). Doc. Ophthalmol. 2021, 142, 5–16. [Google Scholar] [CrossRef] [PubMed]
- Hamedani, M.; Dulley, B.; Murdoch, I. Glaucoma and glare. Eye 2021, 35, 1741–1747. [Google Scholar] [CrossRef] [PubMed]
- Crabb, D.P.; Smith, N.D.; Rauscher, F.G.; Chisholm, C.M.; Barbur, J.L.; Edgar, D.F.; Garway-Heath, D.F. Exploring Eye Movements in Patients with Glaucoma When Viewing a Driving Scene. PLoS ONE 2010, 5, e9710. [Google Scholar] [CrossRef] [PubMed]
- Kumar, G.; Chung, S.T.L. Characteristics of Fixational Eye Movements in People With Macular Disease. Investig. Opthalmology Vis. Sci. 2014, 55, 5125. [Google Scholar] [CrossRef] [PubMed]


| Search for Publications with PubMed Using the Words: | |||||
|---|---|---|---|---|---|
| Pupillary Disease | Disease PLR | Glaucoma Pupillary | |||
| 1869–2024 | 6611 results | 1982–2024 | 2731 results | 1876–2024 | 2580 results |
| 1869–1999 | 2351 results | 1982–1999 | 14 results | 1876–1999 | 1014 results |
| 2000–2024 | 4262 results | 2000–2024 | 2717 results | 2000–2024 | 1569 results |
| pupillary retinal disease | ophthalmic pupillary | retinopathy pupillary | |||
| 1947–2024 | 2129 results | 1813–2024 | 20,971 results | 1944–2024 | 2059 results |
| 1947–1999 | 600 results | 1813–1999 | 8272 results | 1944–1999 | 593 results |
| 2000–2024 | 1530 results | 2000–2024 | 12,973 results | 2000–2024 | 1467 results |
| Variables Derived from Each Pupillary Trace Recorded during a Run (for Each Eye) | ||||||
|---|---|---|---|---|---|---|
| Pupil Light Reflex (PLR) | Global Pupillary Characteristics during mPFT Stimulation | Data Correction | Eyemovements | Raw and Normalized Spectral Power | Phase Lags | Relative Spectral Power |
| Pupil size during base line | Slope of mean pupil size over time (Pupillary Escape) | % of corrected blink data | Median vertical and horizontal positions | Raw Power values for the 9 FOIs | Phase lag values for the 9 FOIs | Left/Right Ratios by sector: 4 values |
| Start constriction latency | Mean pupil size | Number of corrected data | Number of outlier data (>2 SD from mean position Vertical & Horizontal) | Normalized Power values for the 9 FOIs | Up/Down Ratios by sector: 4 values | |
| Peak constriction | Mean amplitude of pupillary oscillations | Correlation between pupil and eye-movements (Vertical & Horizontal) | Overall Lag (crosscorrelation of stimulus and pupillary signal) | Up/Down and Left/Right Ratios 2 values | ||
| Latency of peak constriction | Standard deviation of pupillary oscillations | Peripheral/Paracentral Ratio | ||||
| Constriction speed | Central/Paracentral+Peripheral Ratio | |||||
Disclaimer/Publisher’s Note: The statements, opinions and data contained in all publications are solely those of the individual author(s) and contributor(s) and not of MDPI and/or the editor(s). MDPI and/or the editor(s) disclaim responsibility for any injury to people or property resulting from any ideas, methods, instructions or products referred to in the content. |
© 2024 by the authors. Licensee MDPI, Basel, Switzerland. This article is an open access article distributed under the terms and conditions of the Creative Commons Attribution (CC BY) license (https://creativecommons.org/licenses/by/4.0/).
Share and Cite
Lorenceau, J.; Ajasse, S.; Barbet, R.; Boucart, M.; Chavane, F.; Lamirel, C.; Legras, R.; Matonti, F.; Rateaux, M.; Rouland, J.-F.; et al. Method to Quickly Map Multifocal Pupillary Response Fields (mPRF) Using Frequency Tagging. Vision 2024, 8, 17. https://doi.org/10.3390/vision8020017
Lorenceau J, Ajasse S, Barbet R, Boucart M, Chavane F, Lamirel C, Legras R, Matonti F, Rateaux M, Rouland J-F, et al. Method to Quickly Map Multifocal Pupillary Response Fields (mPRF) Using Frequency Tagging. Vision. 2024; 8(2):17. https://doi.org/10.3390/vision8020017
Chicago/Turabian StyleLorenceau, Jean, Suzon Ajasse, Raphael Barbet, Muriel Boucart, Frédéric Chavane, Cédric Lamirel, Richard Legras, Frédéric Matonti, Maxence Rateaux, Jean-François Rouland, and et al. 2024. "Method to Quickly Map Multifocal Pupillary Response Fields (mPRF) Using Frequency Tagging" Vision 8, no. 2: 17. https://doi.org/10.3390/vision8020017