
CFD-FEM Analysis for Functionality Prediction of Multi-Gear Pumps

 , , , , and
Abstract
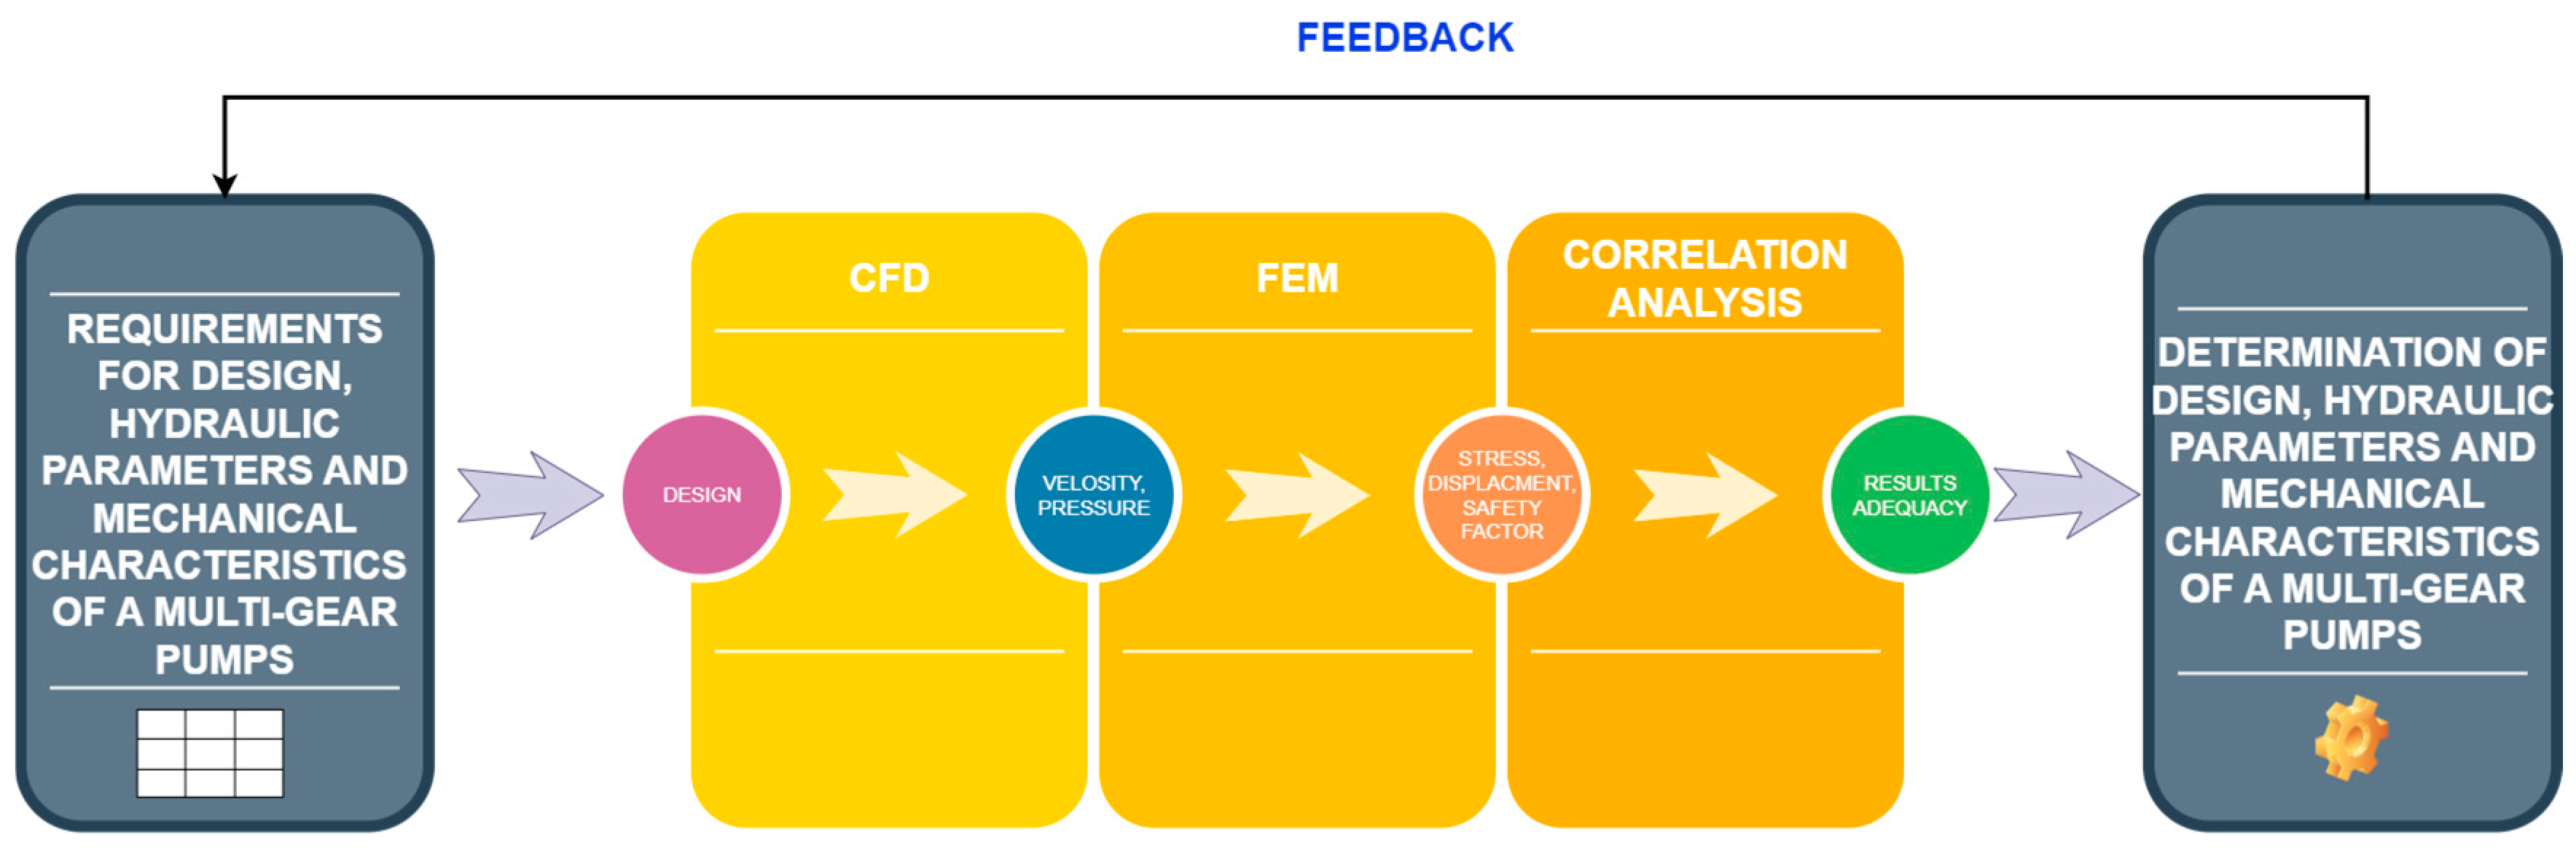
:1. Introduction
- (1)
- Calculation of geometric and energy parameters;
- (2)
- Development of design measures aimed at increasing the efficiency, uniformity of delivery, life, and serviceability of the pump;
- (3)
- Calculation of the strength of individual parts of the hydraulic machine design.
2. Materials and Methods
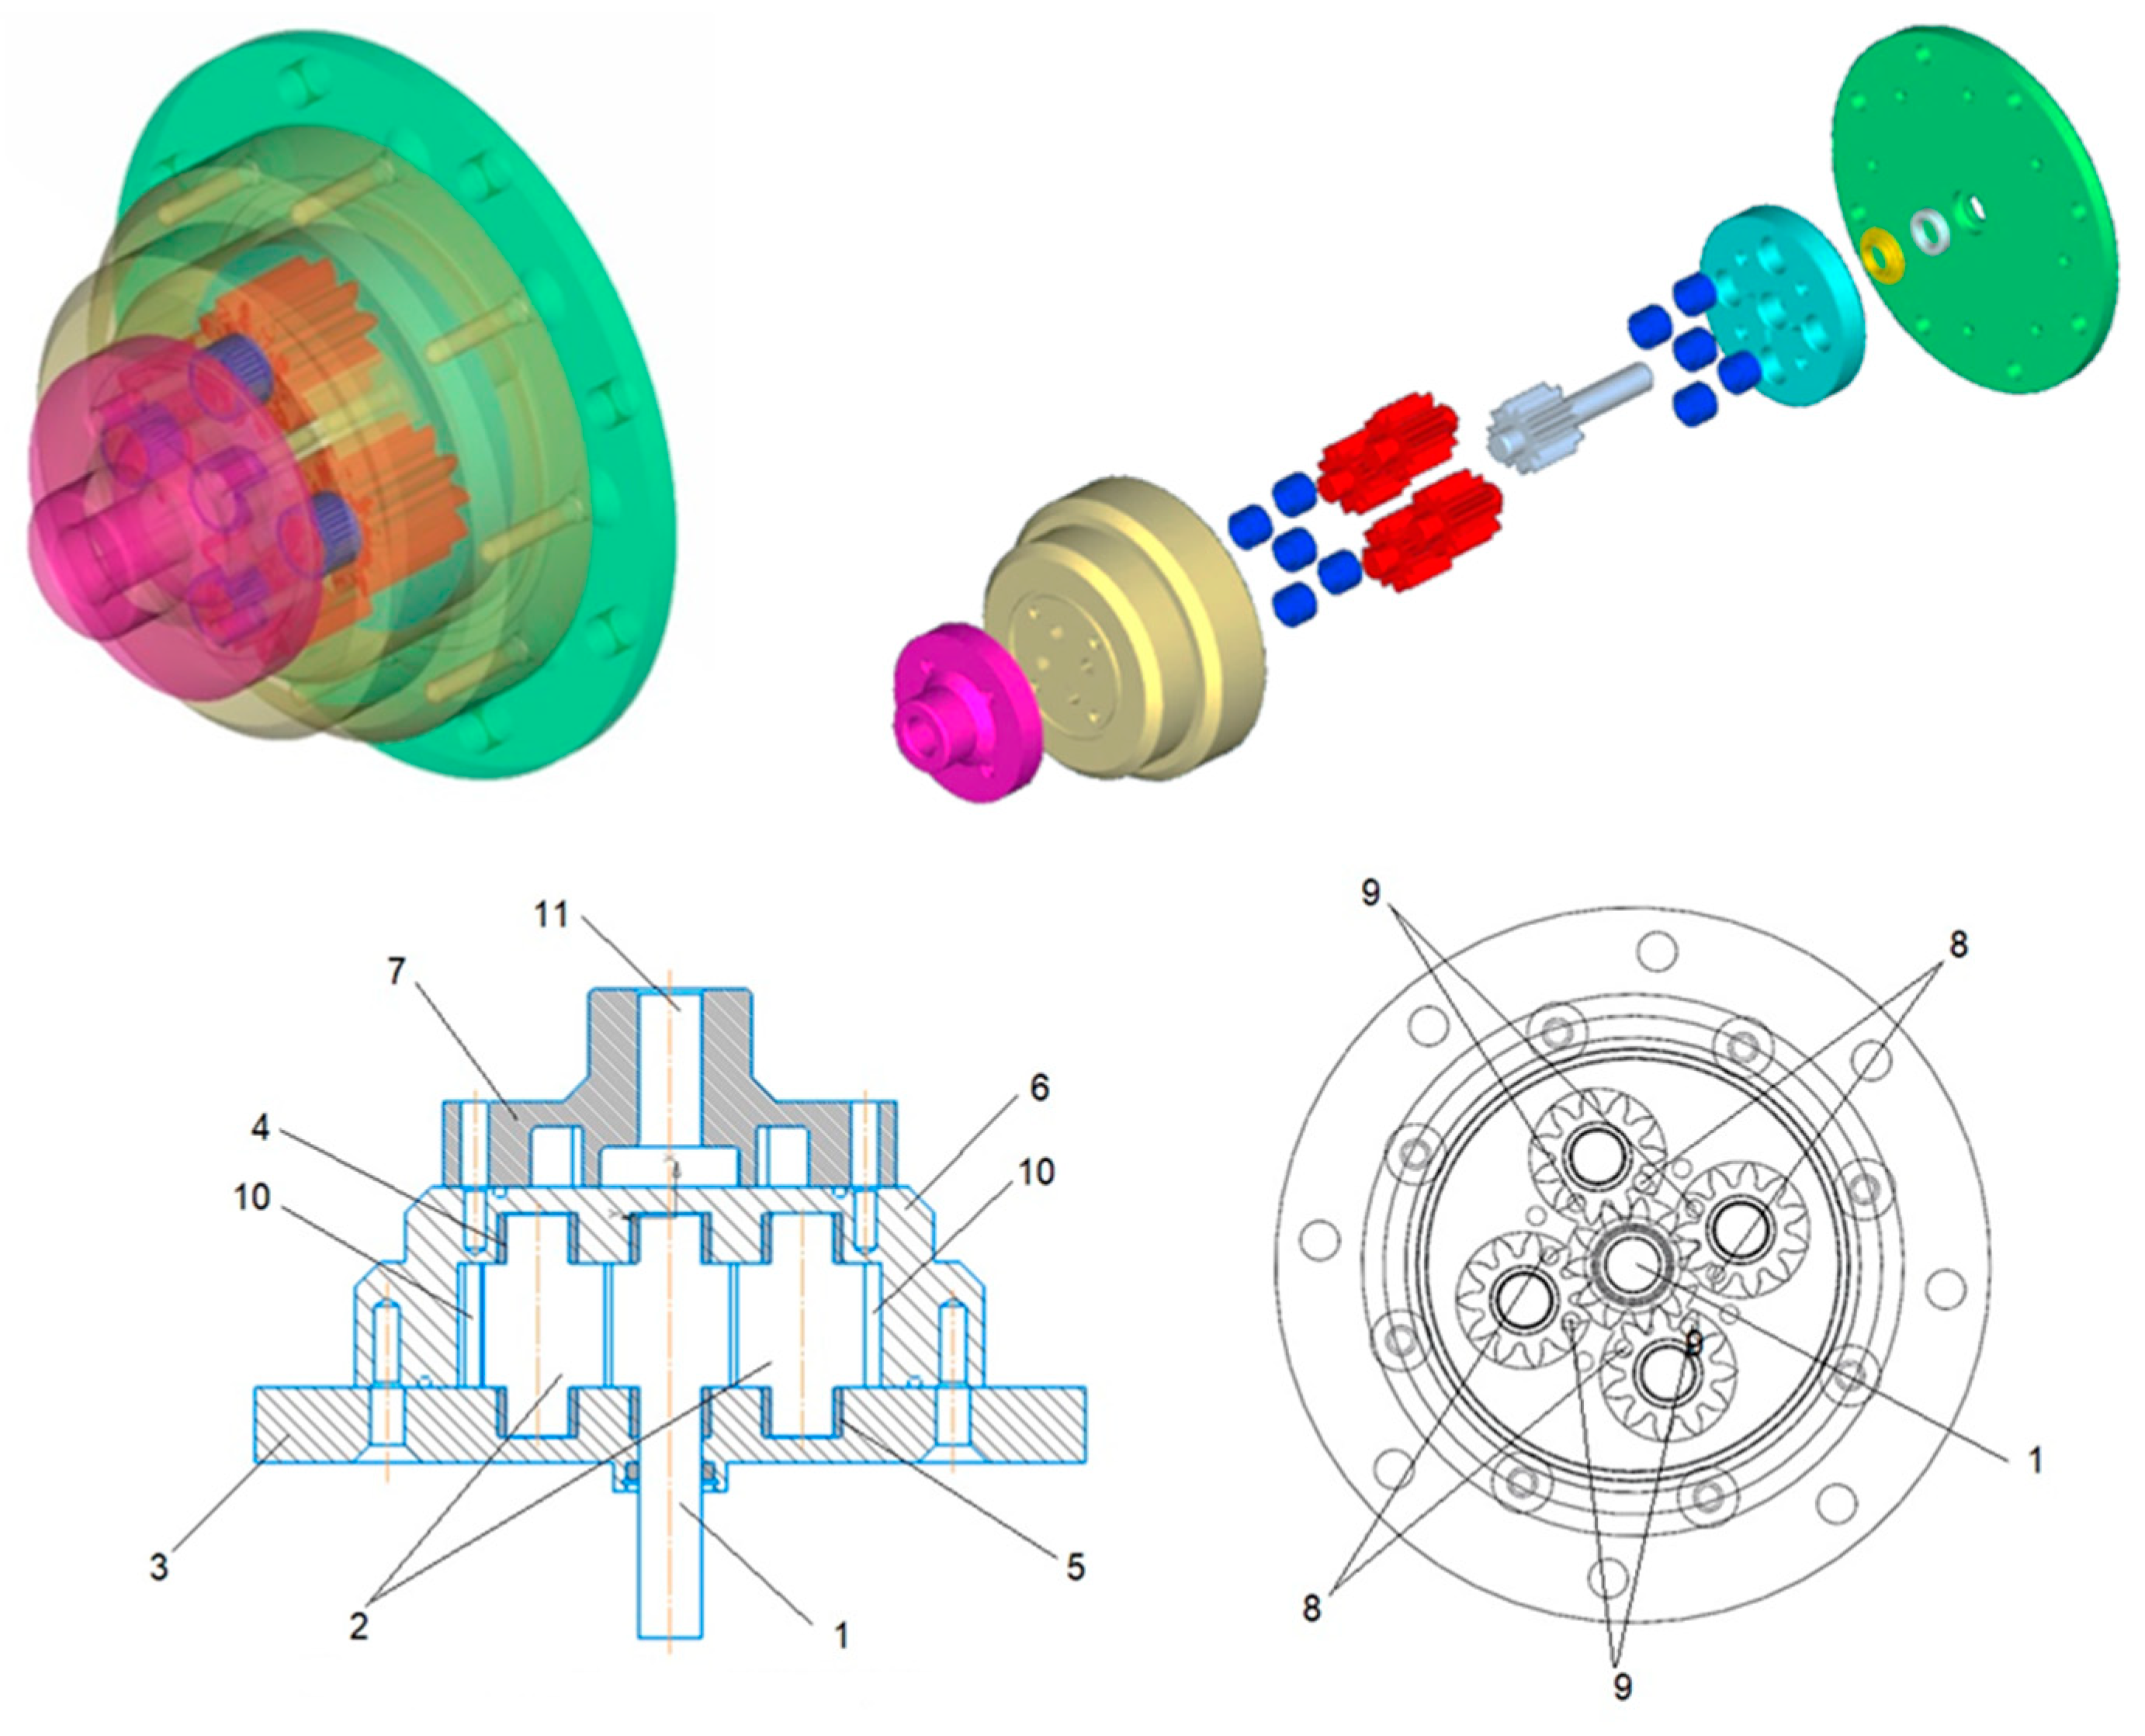
2.1. Object of Study
2.2. Geometric and Energy Parameters of the Multi-Gear Pump
2.3. Simulation Model for CFD Analysis
- (1)
- Volume flow rate of liquid at the entry Q = 0.00458 m3/s (inlet orifices 5);
- (2)
- Total inlet pressure P = 1 MPa (inlet orifices 5);
- (3)
- Full pressure at the outlet P = 10 MPa (outlet orifices 6) (Figure 2).
- (4)
- The calculation takes into account the physical properties of the VMGZ hydraulic oil (all-season thickened hydraulic oil) [28].
2.4. Stages of FEM Analysis
2.4.1. Creation of a Simulation Model
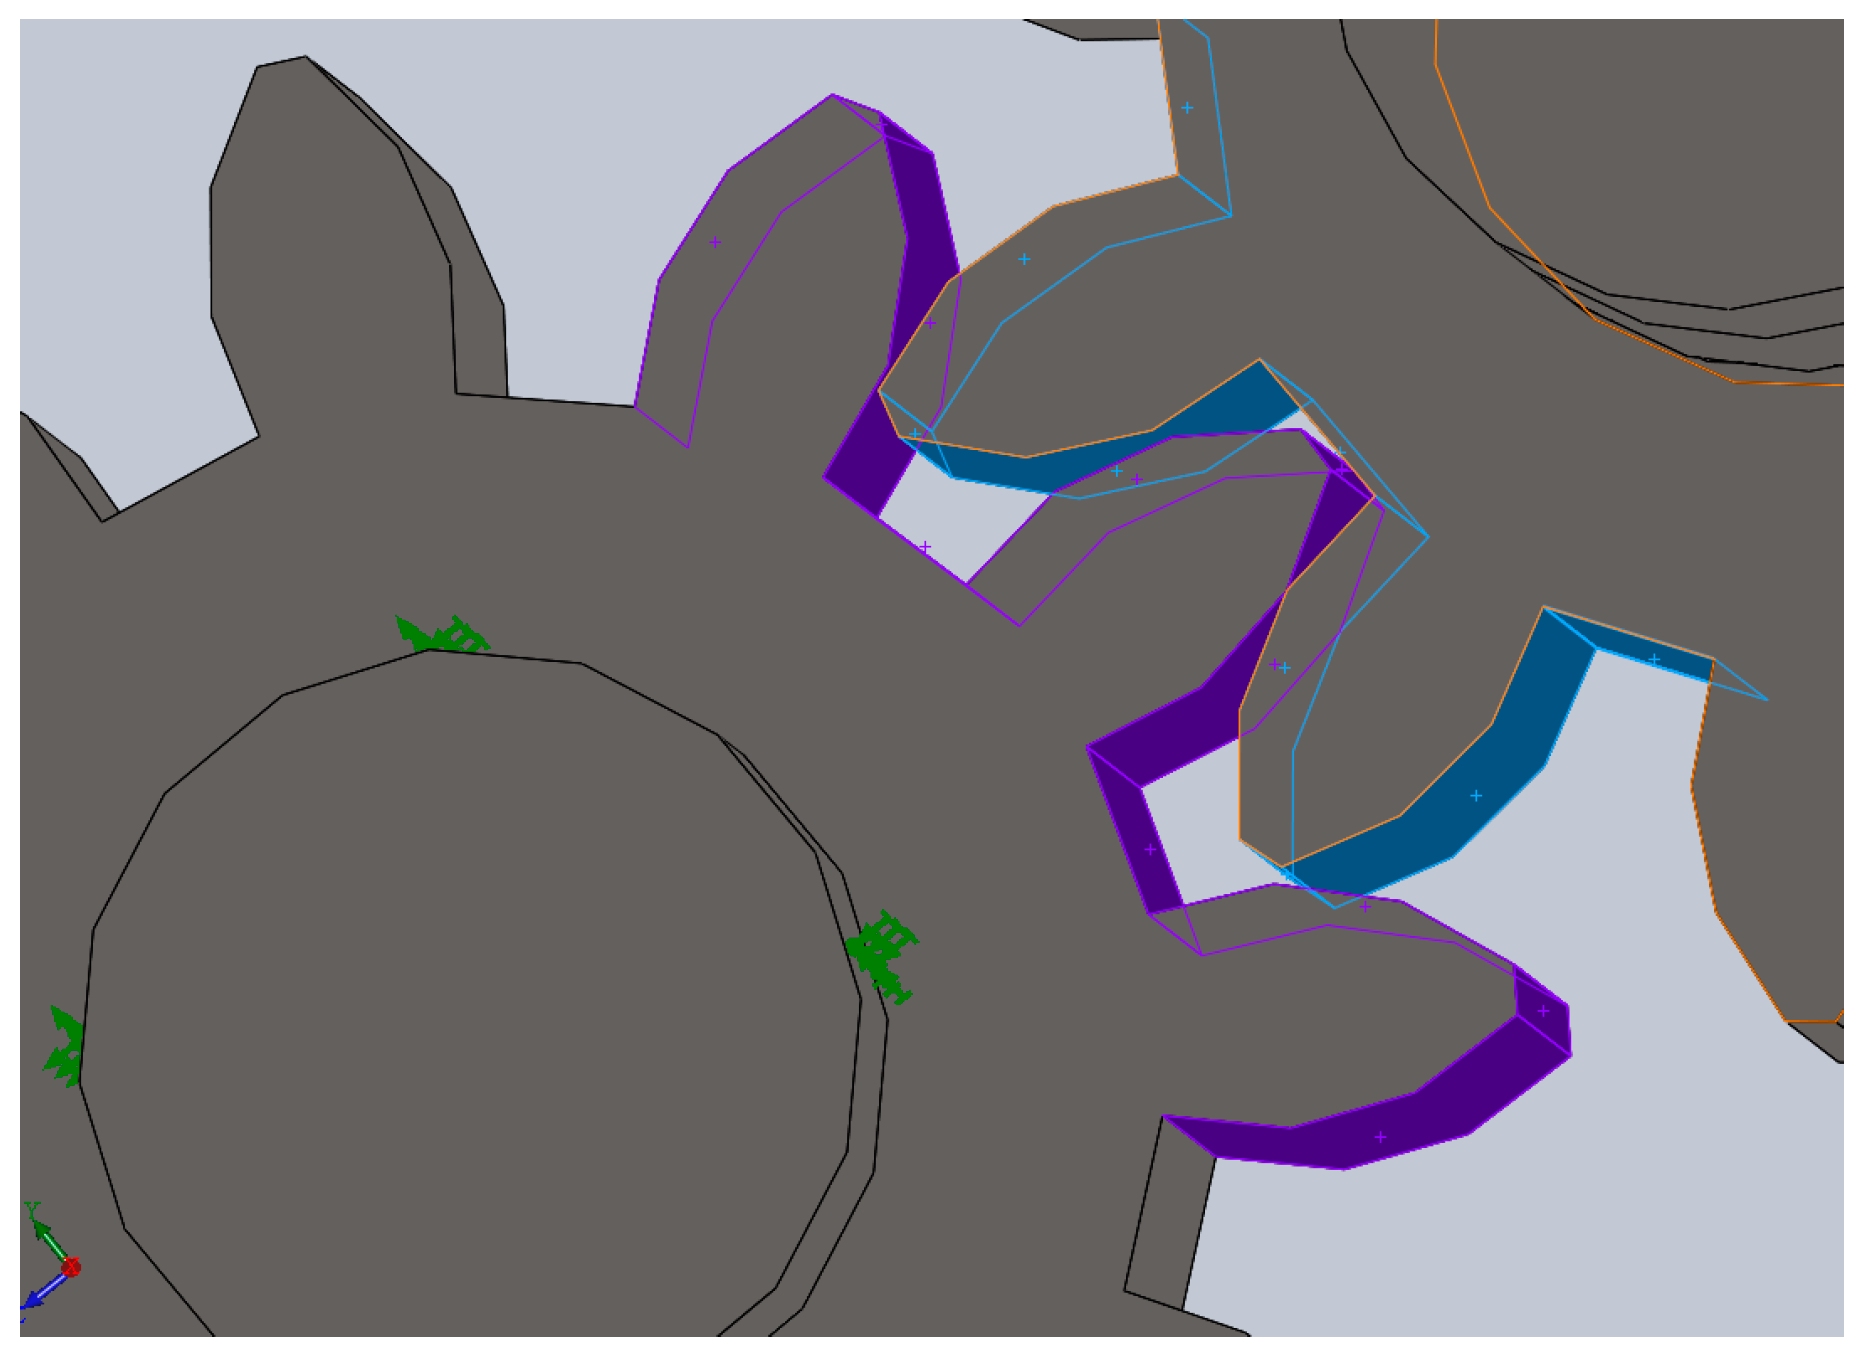
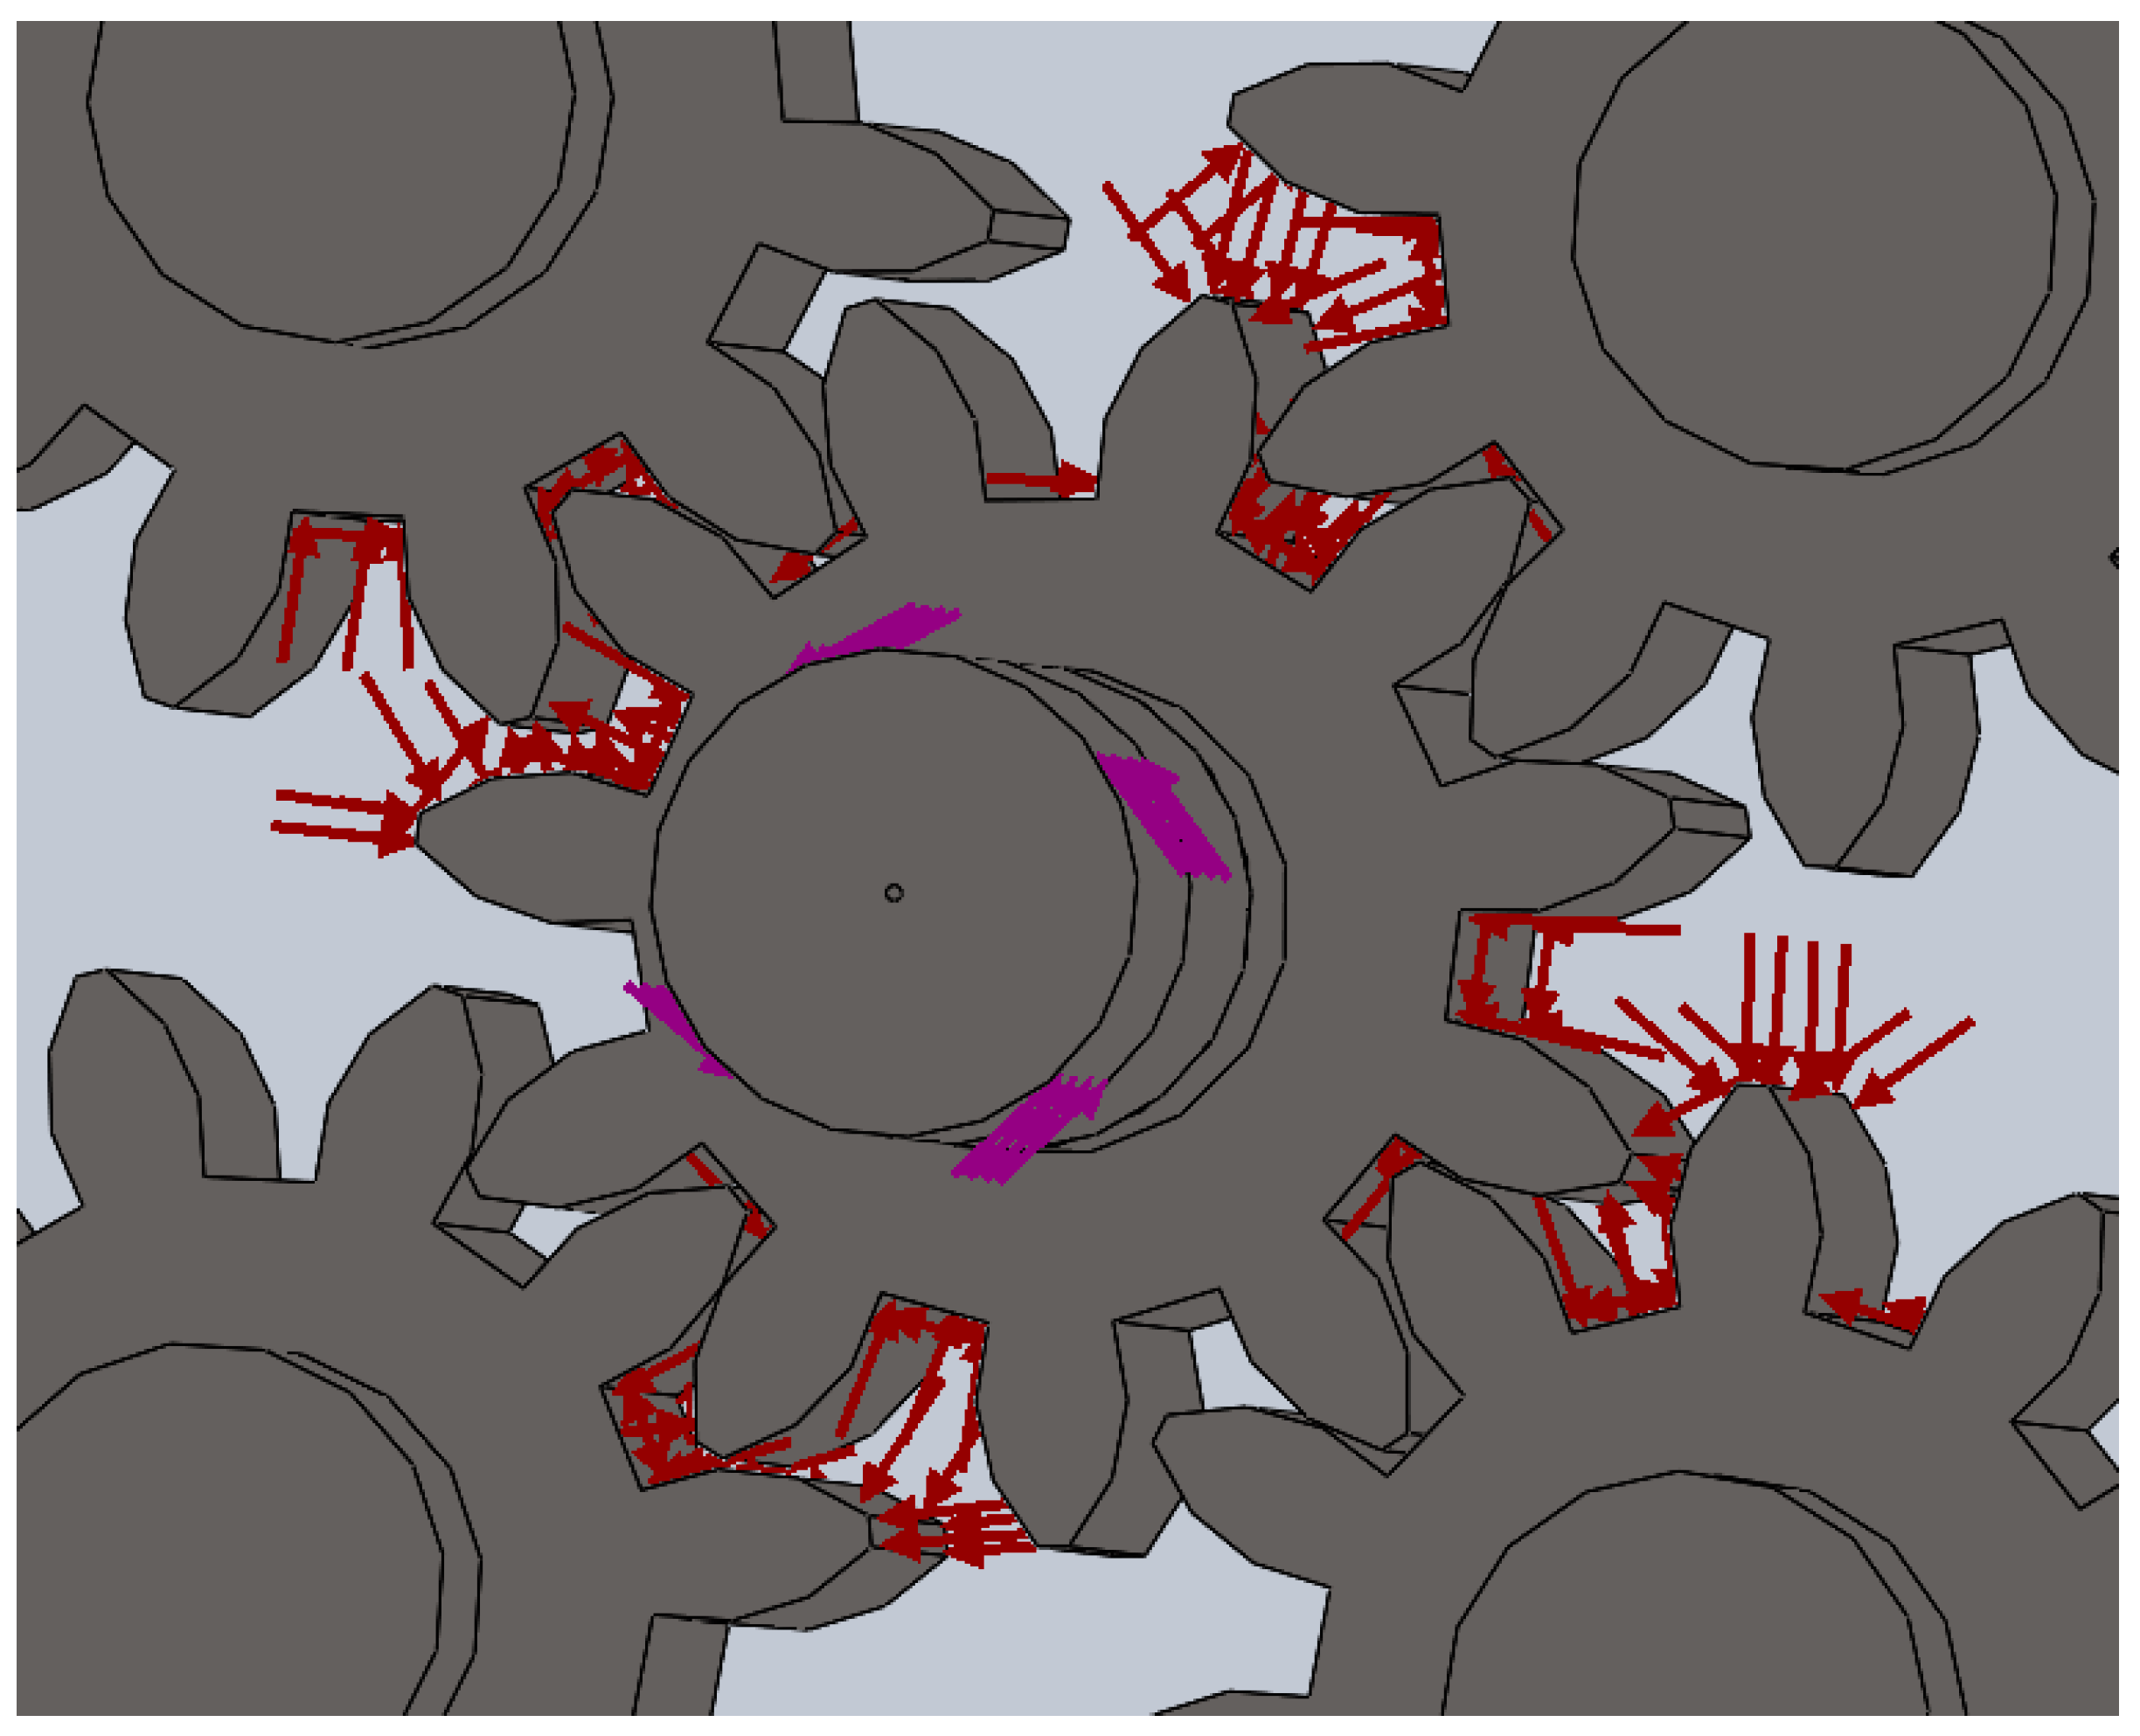
2.4.2. Establishing Contact in a Gear Mesh
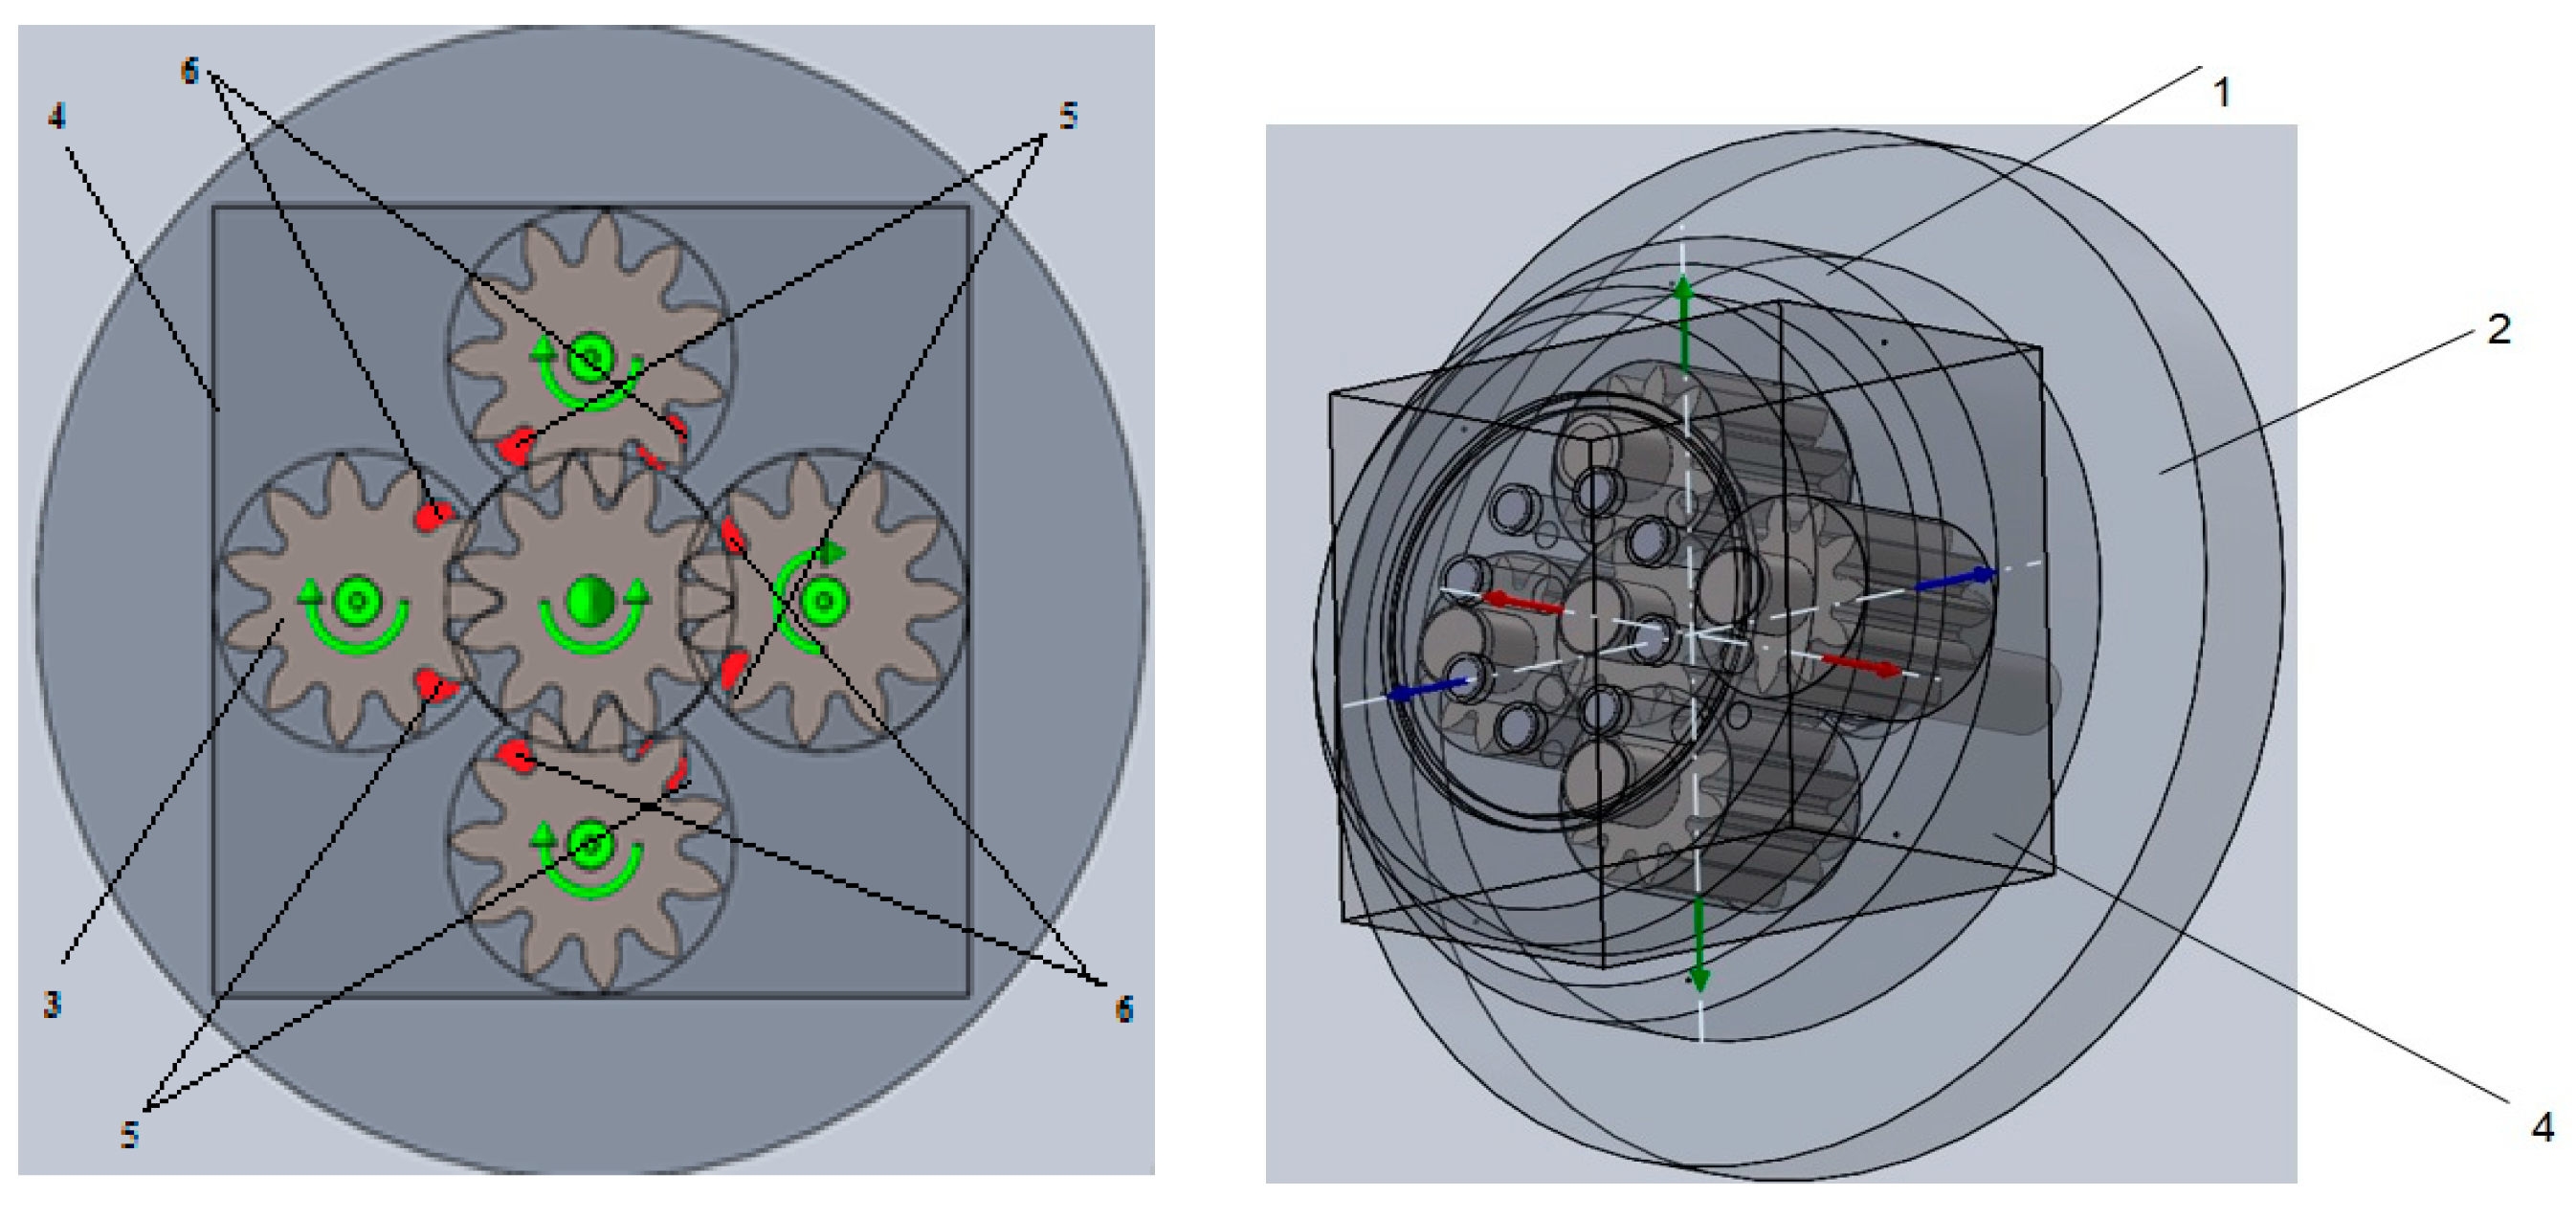
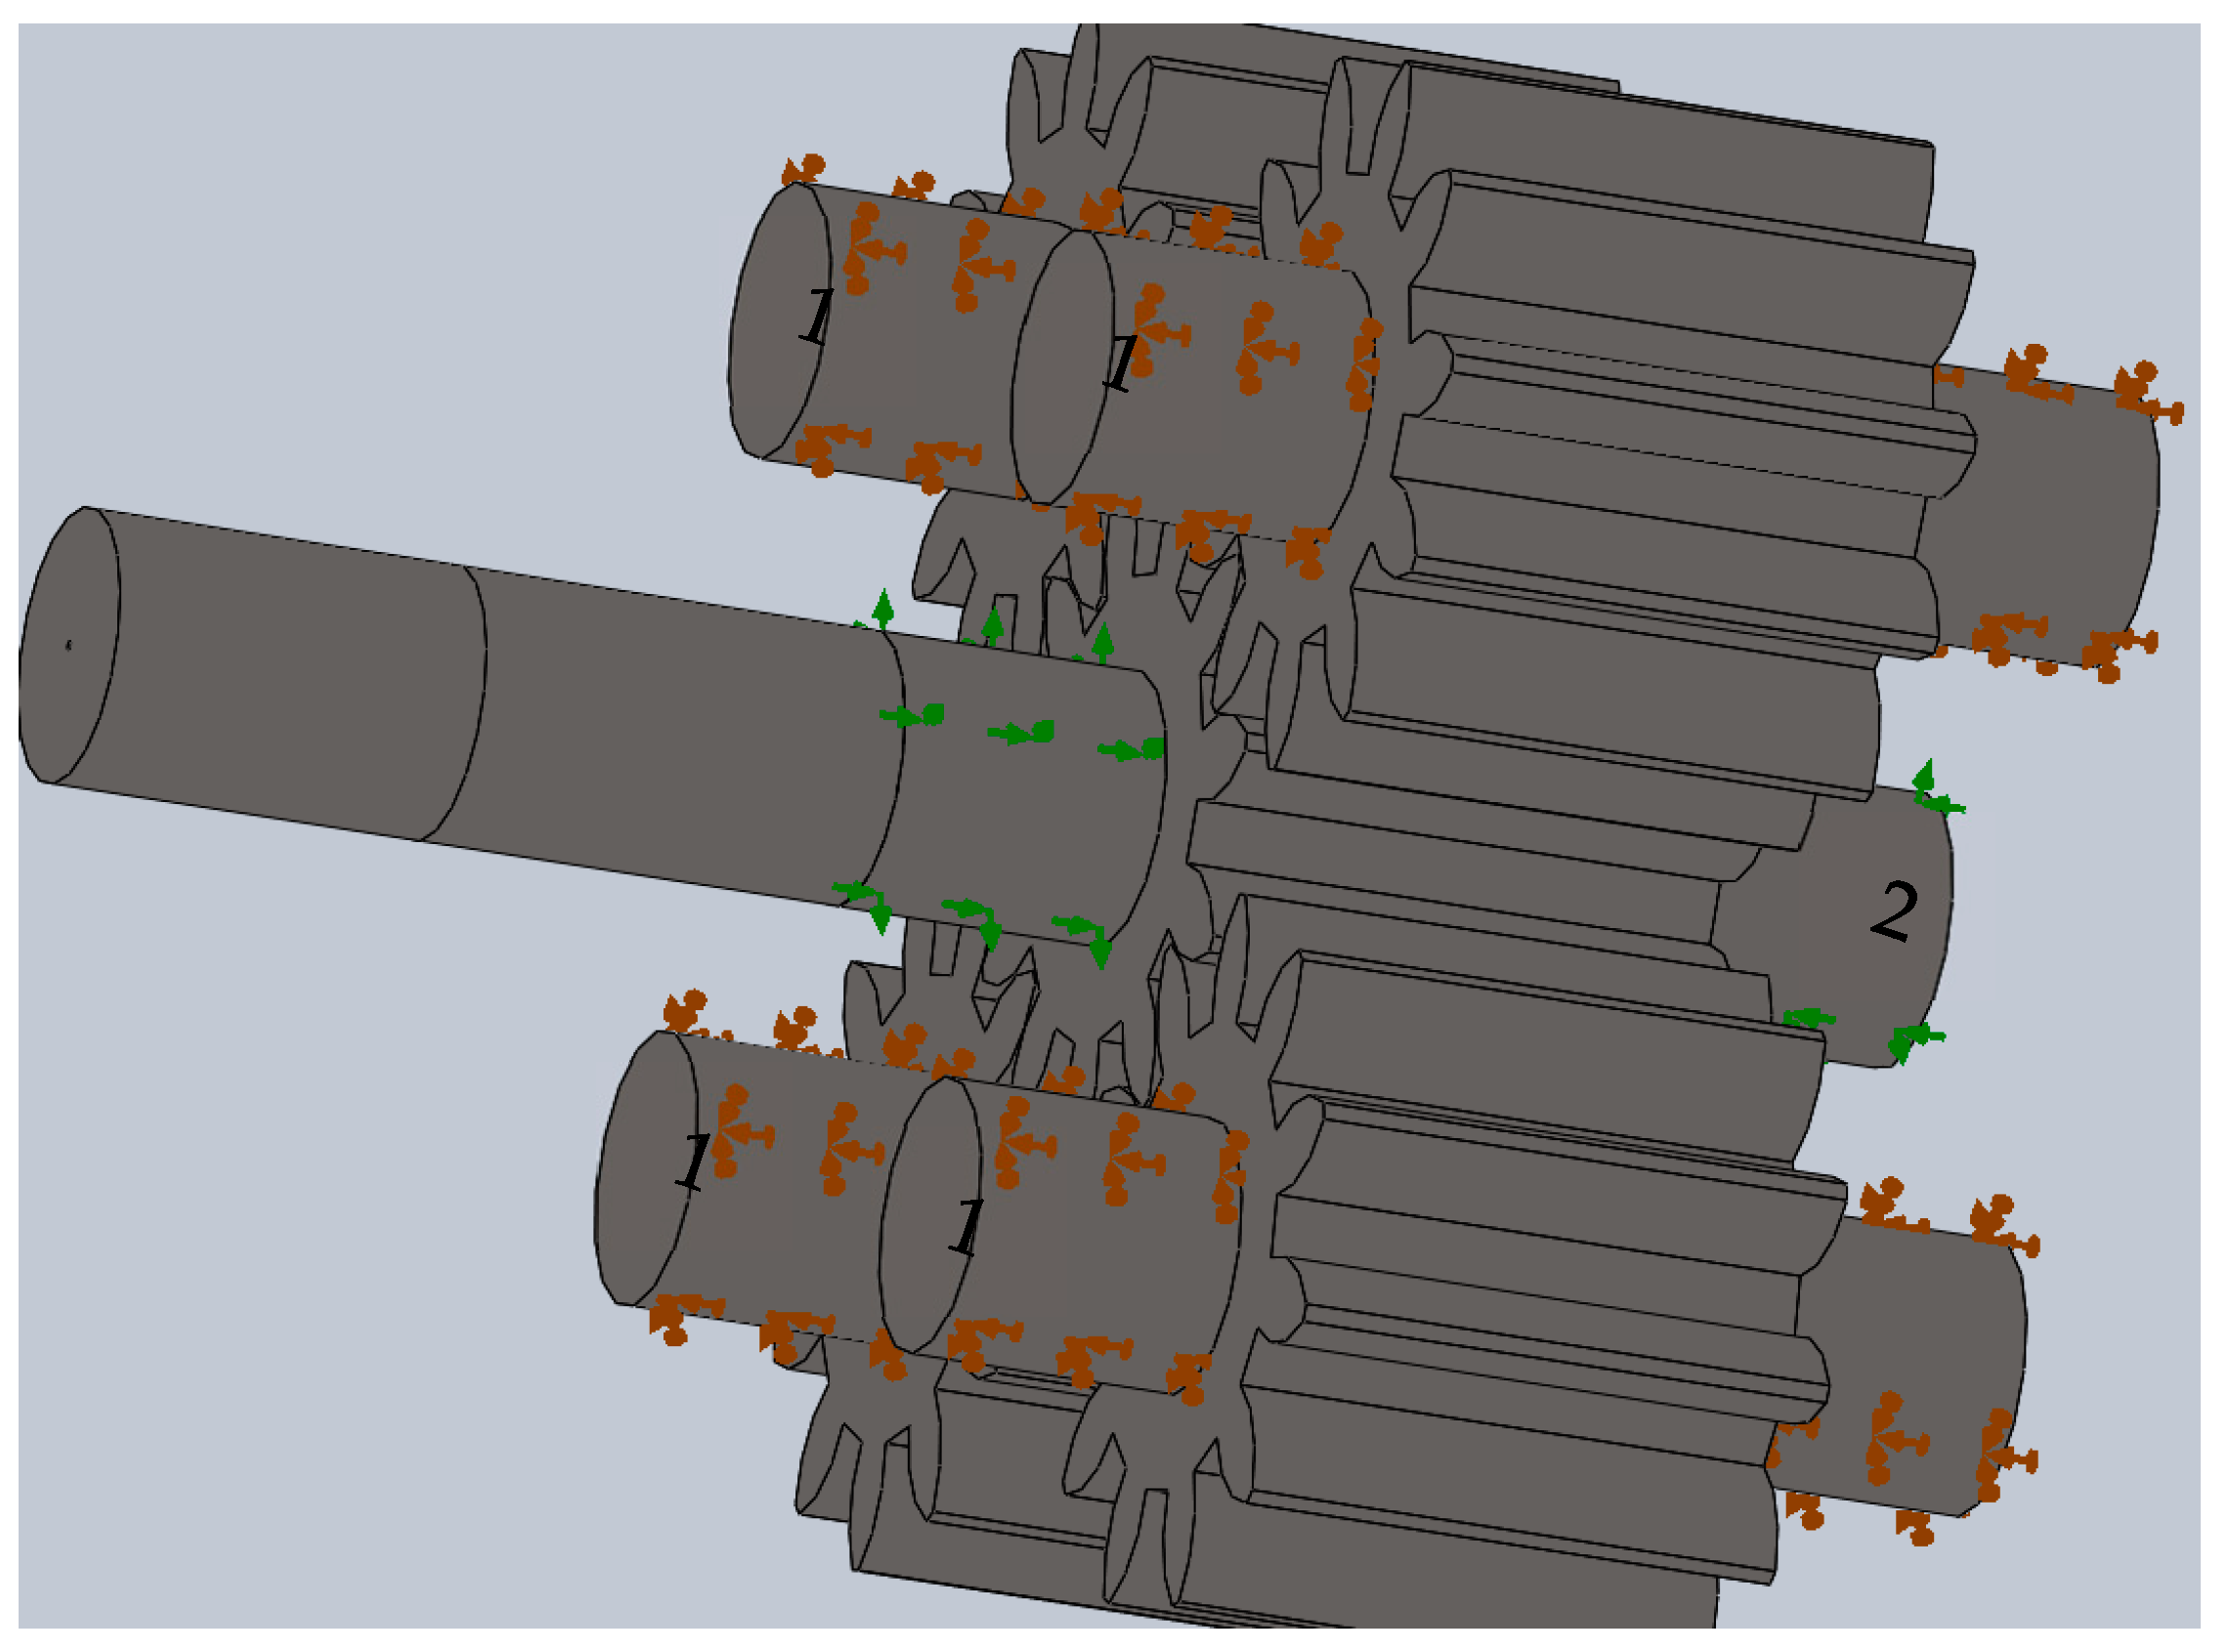
2.4.3. Selecting the Type of Fixture
2.4.4. Torque Setting
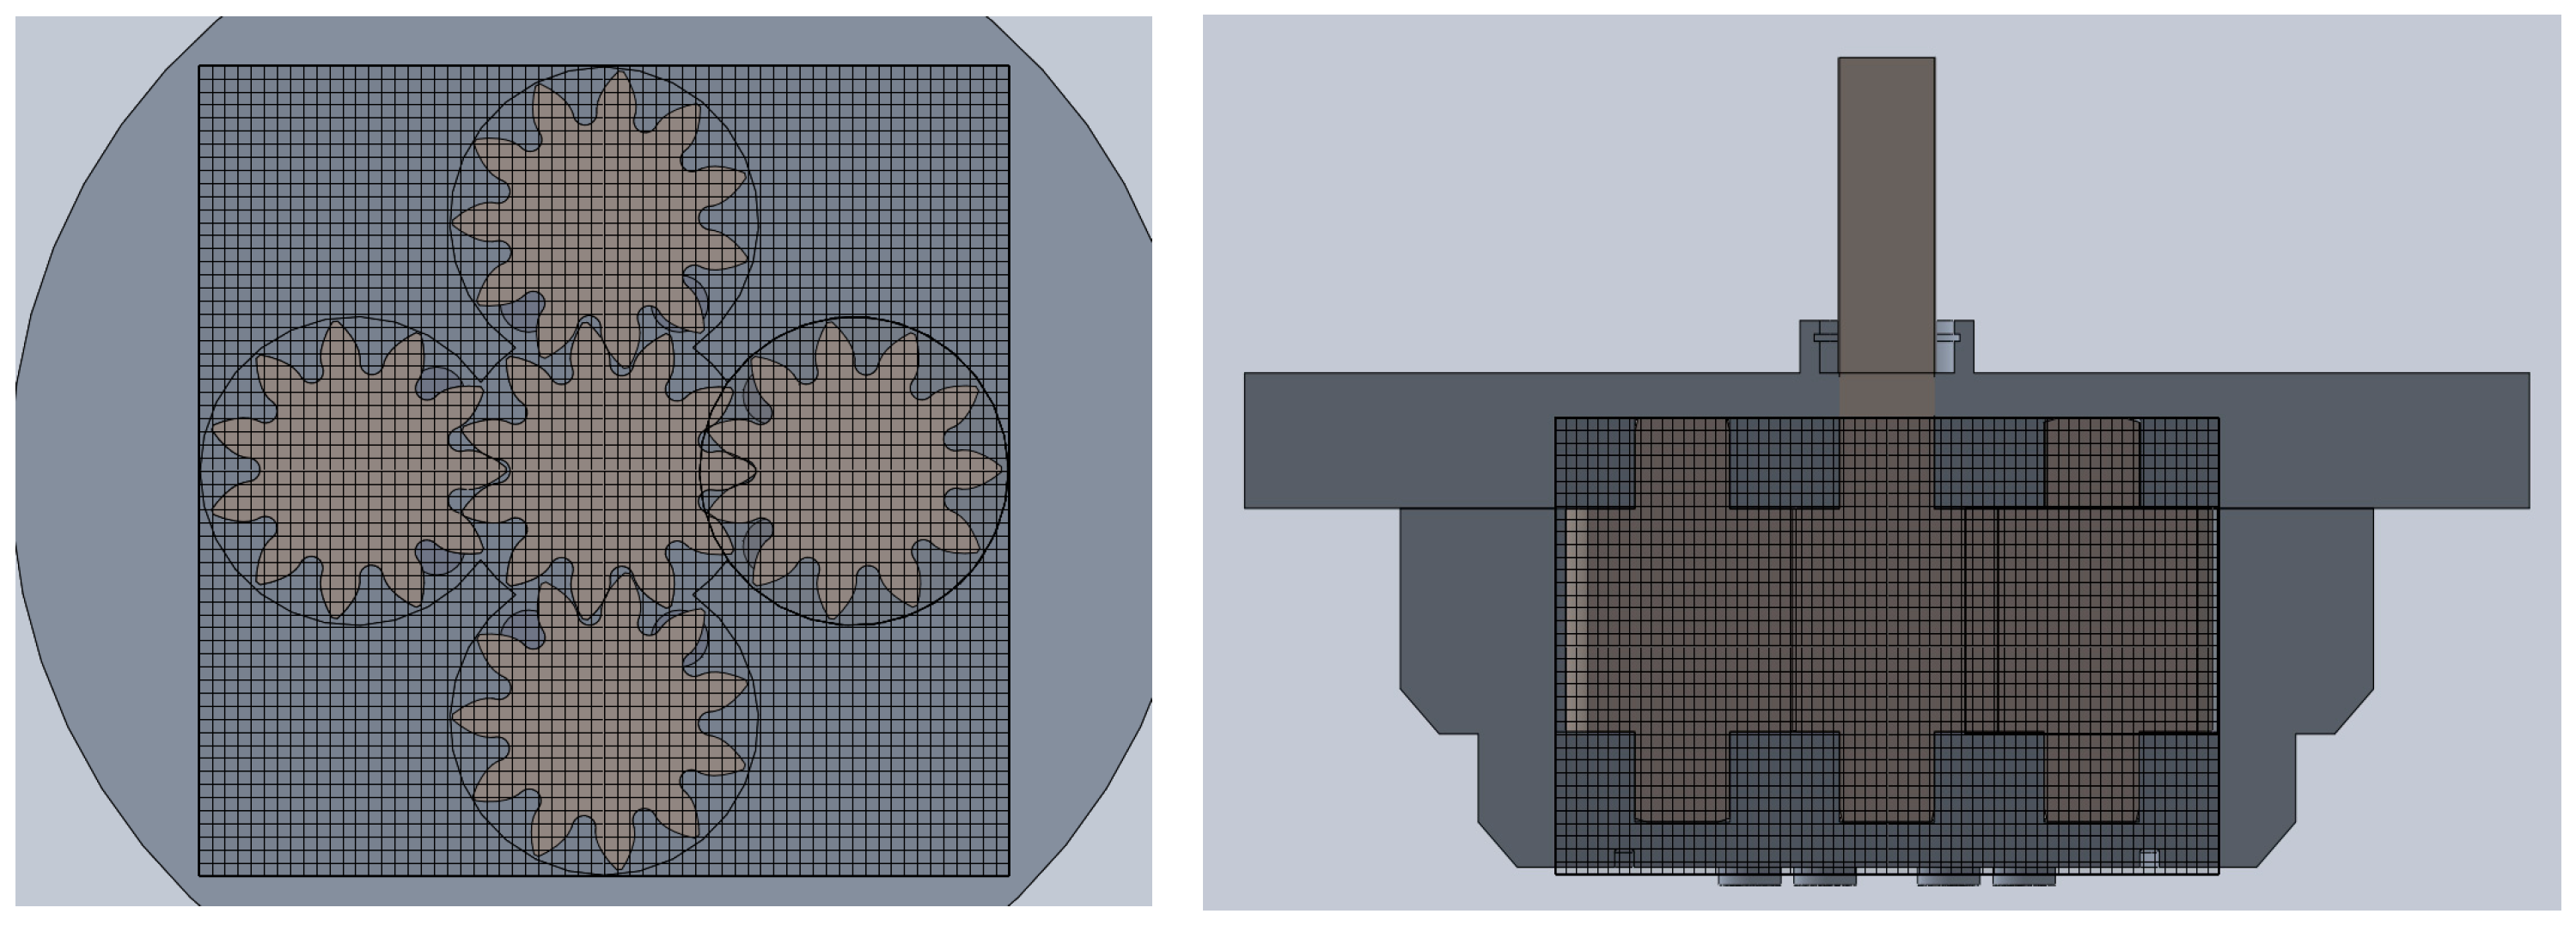
2.4.5. Grid Creation
2.4.6. Input Data for Strength Calculation
2.5. Determining the Adequacy of the Data Obtained
3. Results and Discussion
3.1. Computational Fluid Dynamics Analysis
- –
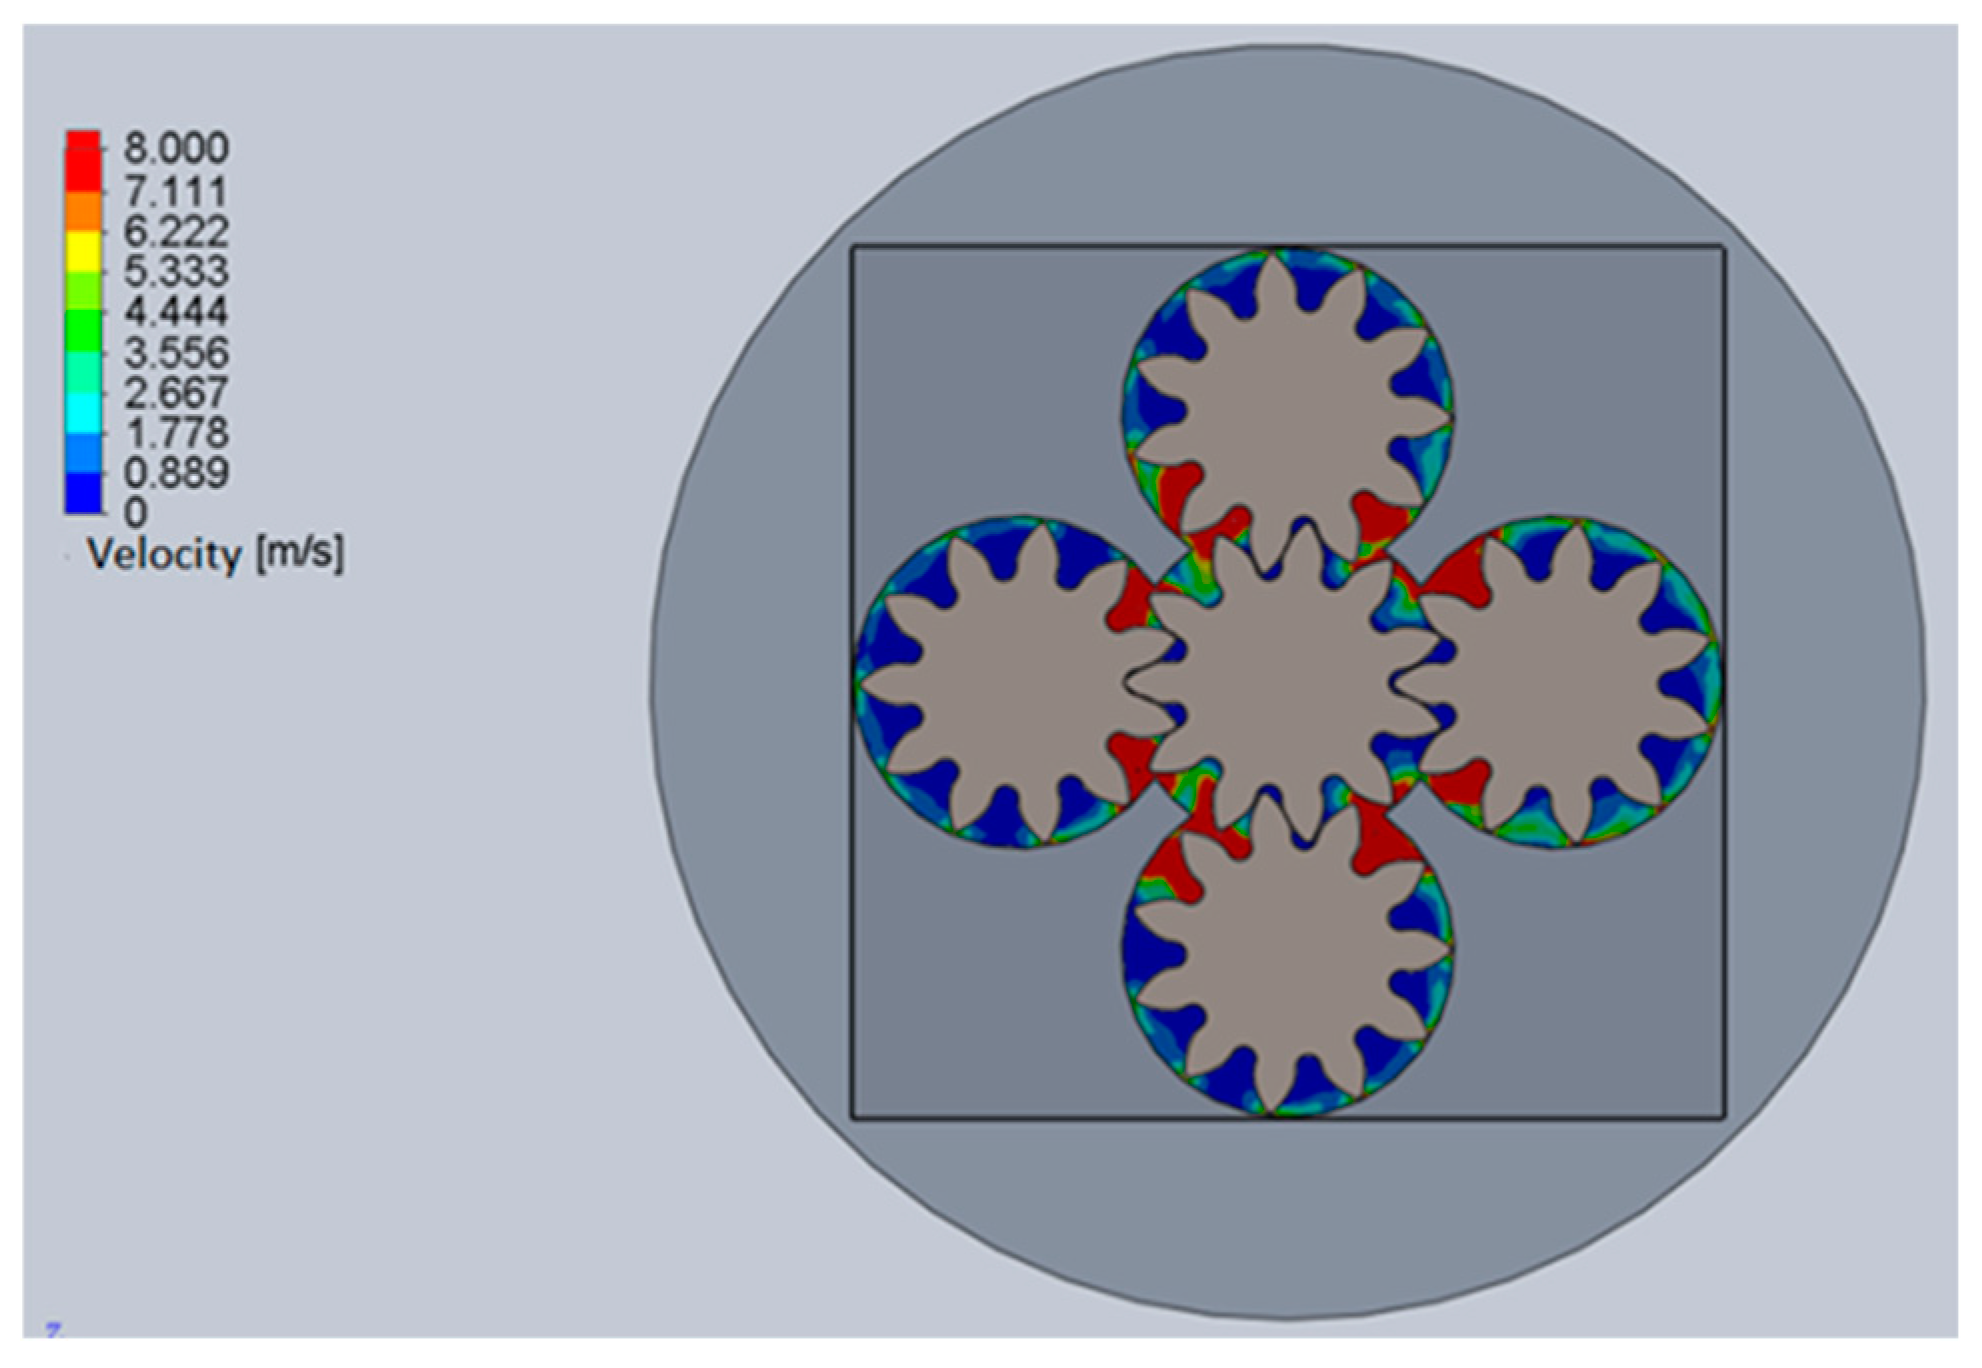
- The liquid velocity reaches the highest values (up to 8 m/s) in places of suction and discharge of liquid, caused by the change in geometric parameters of the design, for example, when liquid enters the working chamber of the pump through a narrower inlet hole with a diameter of 8 mm. The further movement of liquid in the troughs of the teeth from the inlet to the outlet holes is characterized by a decrease in velocity and reaches minimum values at the teeth legs. Between the body and the teeth of gears on the outer arc, velocity is 1.5–2.5 m/s, and in some places 5 m/s.
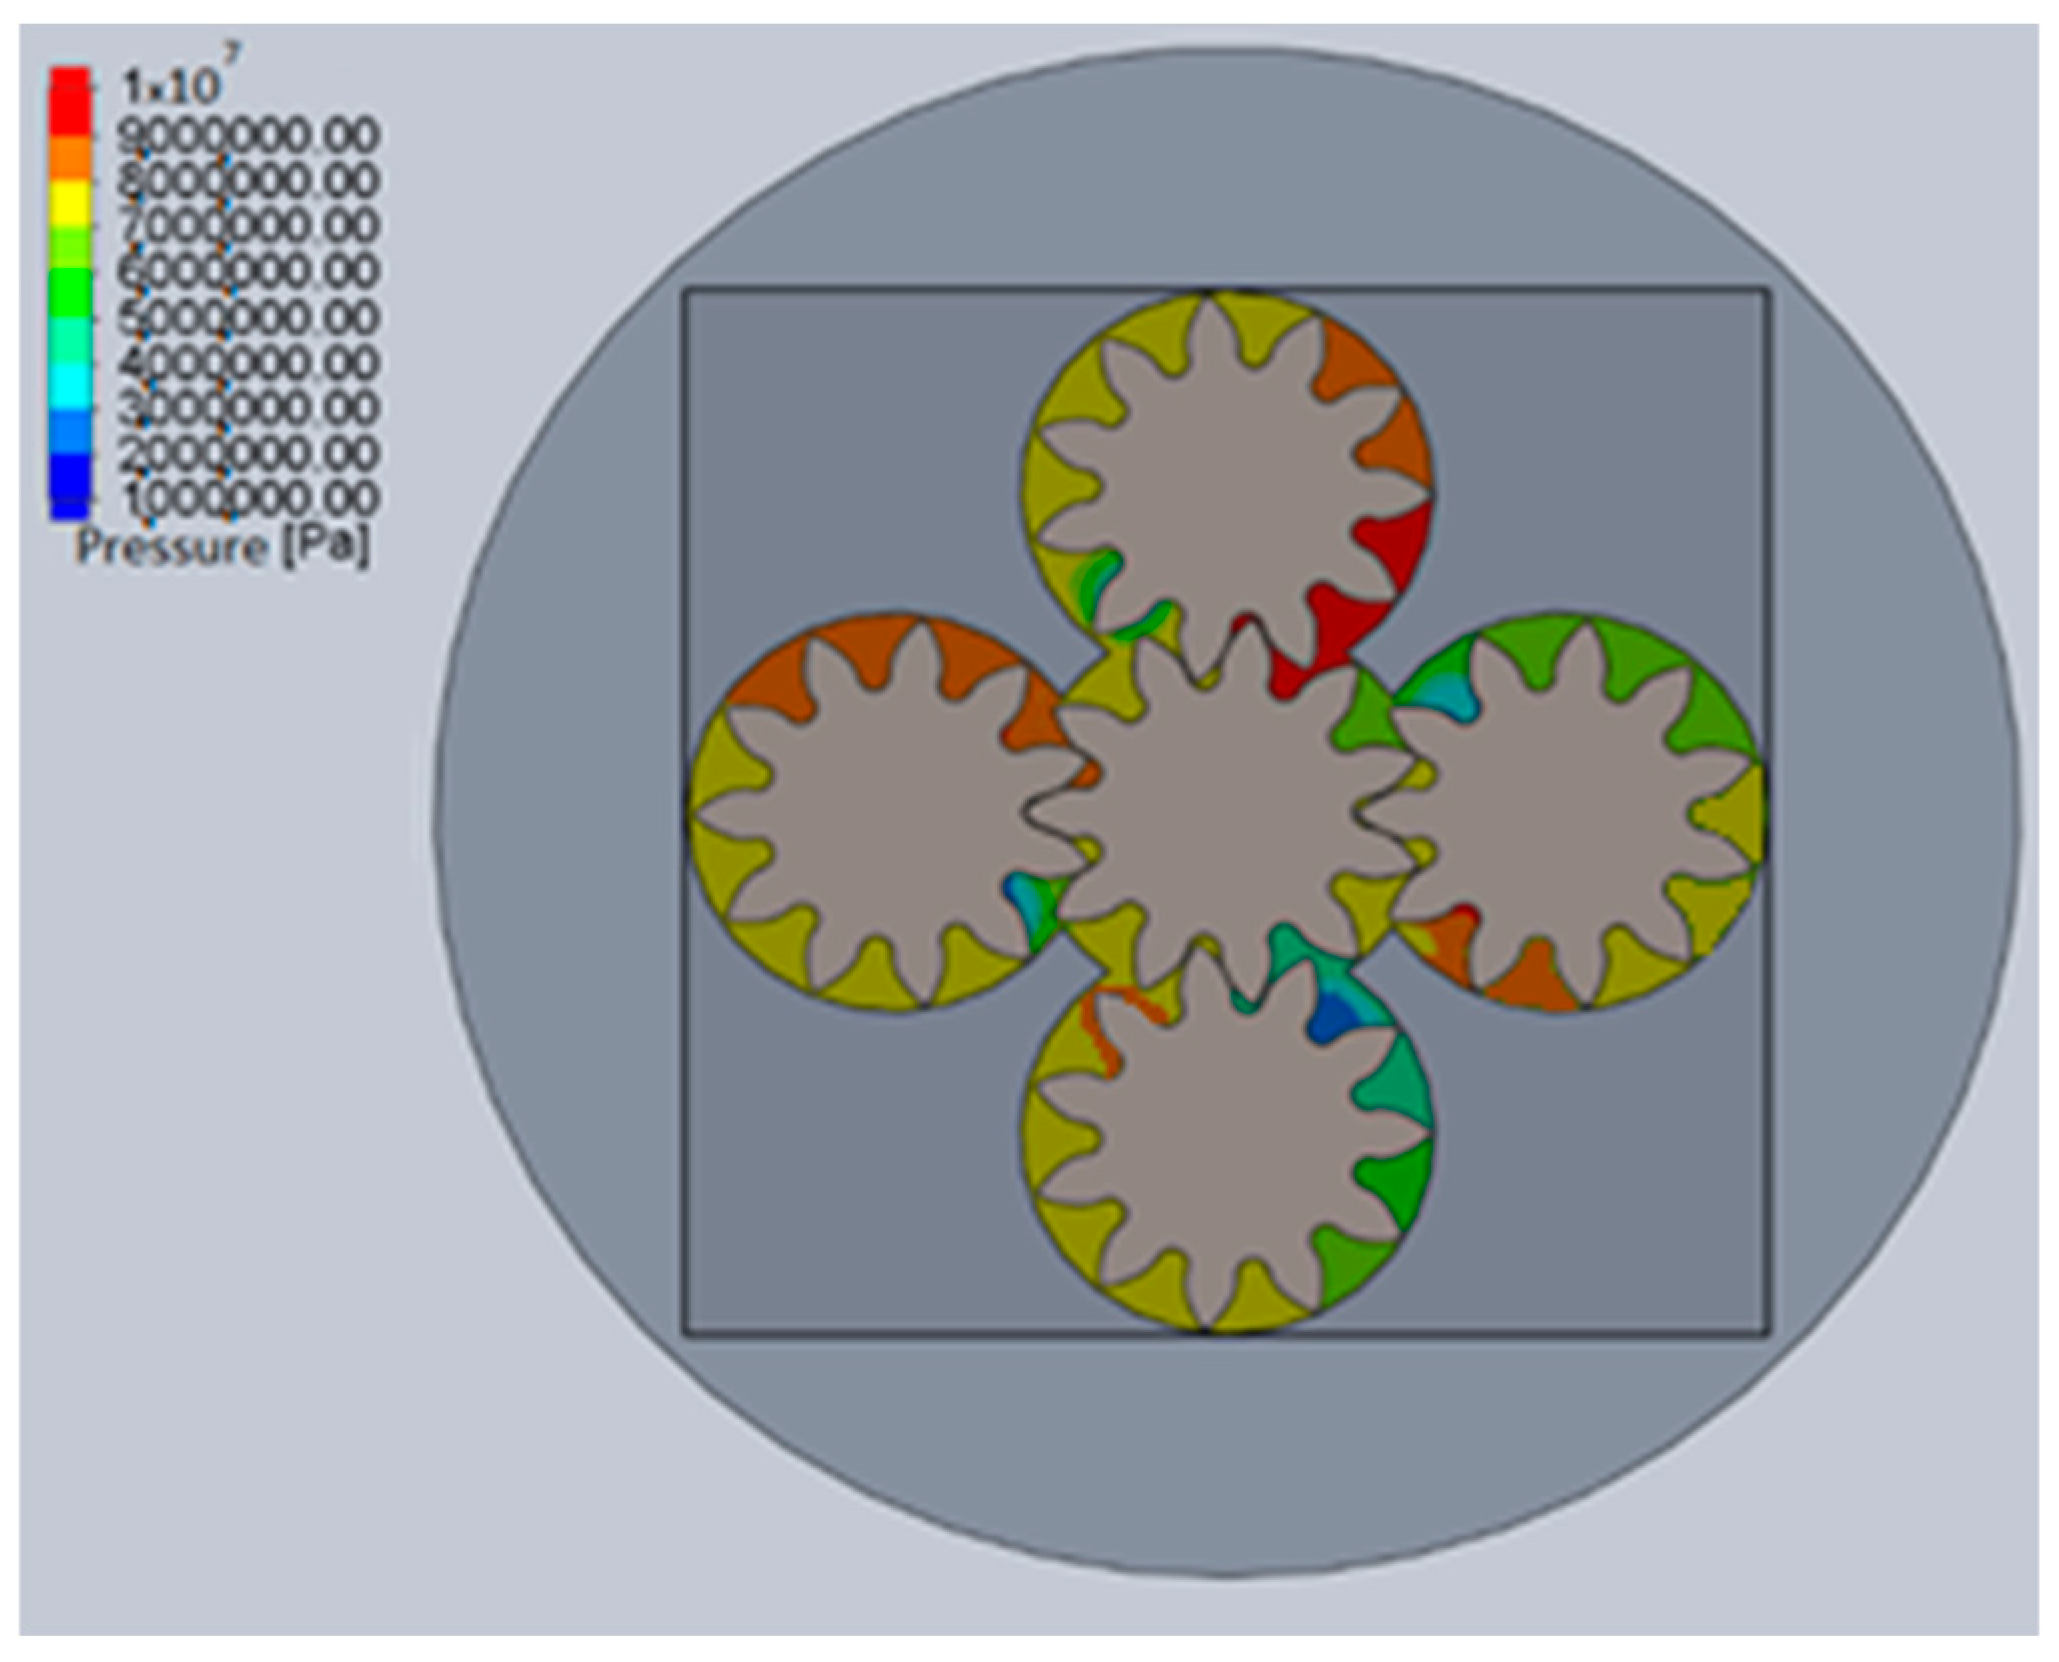
- –
- On the pressure change curve, areas of low pressure are marked in blue, characterizing the process of suction of the liquid. Here, the pressure value is 1 MPa. The red color represents areas of high pressure, where the pressure value varies in the range of 9–10 MPa, and characterizes the liquid injection into the pressure line. The distribution of pressure values in the working chambers of the driven gears is different, which is due to the different degrees of opening of the input and outlet openings. It is worth noting the presence of high pressure (10 MPa) in the gear meshes of the multi-gear pump, which can lead to fluid locking and jamming of the pump. To avoid this process, grooves must be provided to drain the locked liquid in the gear hydraulic machine.
3.2. Finite Element Method Analysis
3.3. Determination of Dependence Between Investigated Strength Parameters
4. Conclusions
- (1)
- As a result of CFD analysis, the character of the pump liquid flow in the working chamber is established; the distribution diagrams of the liquid velocity and pressure in the pump were determined. The maximum velocity values occur in the places of inlet and outlet holes in the pump casing and reach 8 m/s. In the existing gap between the casing and the gear teeth, the velocity value reaches 5 m/s. The pump pressure distribution curve allows us to determine the change in pressure from the suction area (low-pressure area) to the discharge area (high-pressure area). It should be noted that the amount of pressure of the liquid located in the cavities between the teeth is different in all four gears, which is due to the unequal degree of opening of the inlet and outlet ports. When the outlet pressure was from 6 to 20 MPa, it was found that the pressure distribution diagram has the same form, which suggests the possibility of the five-gear pump operating at high-pressure values.
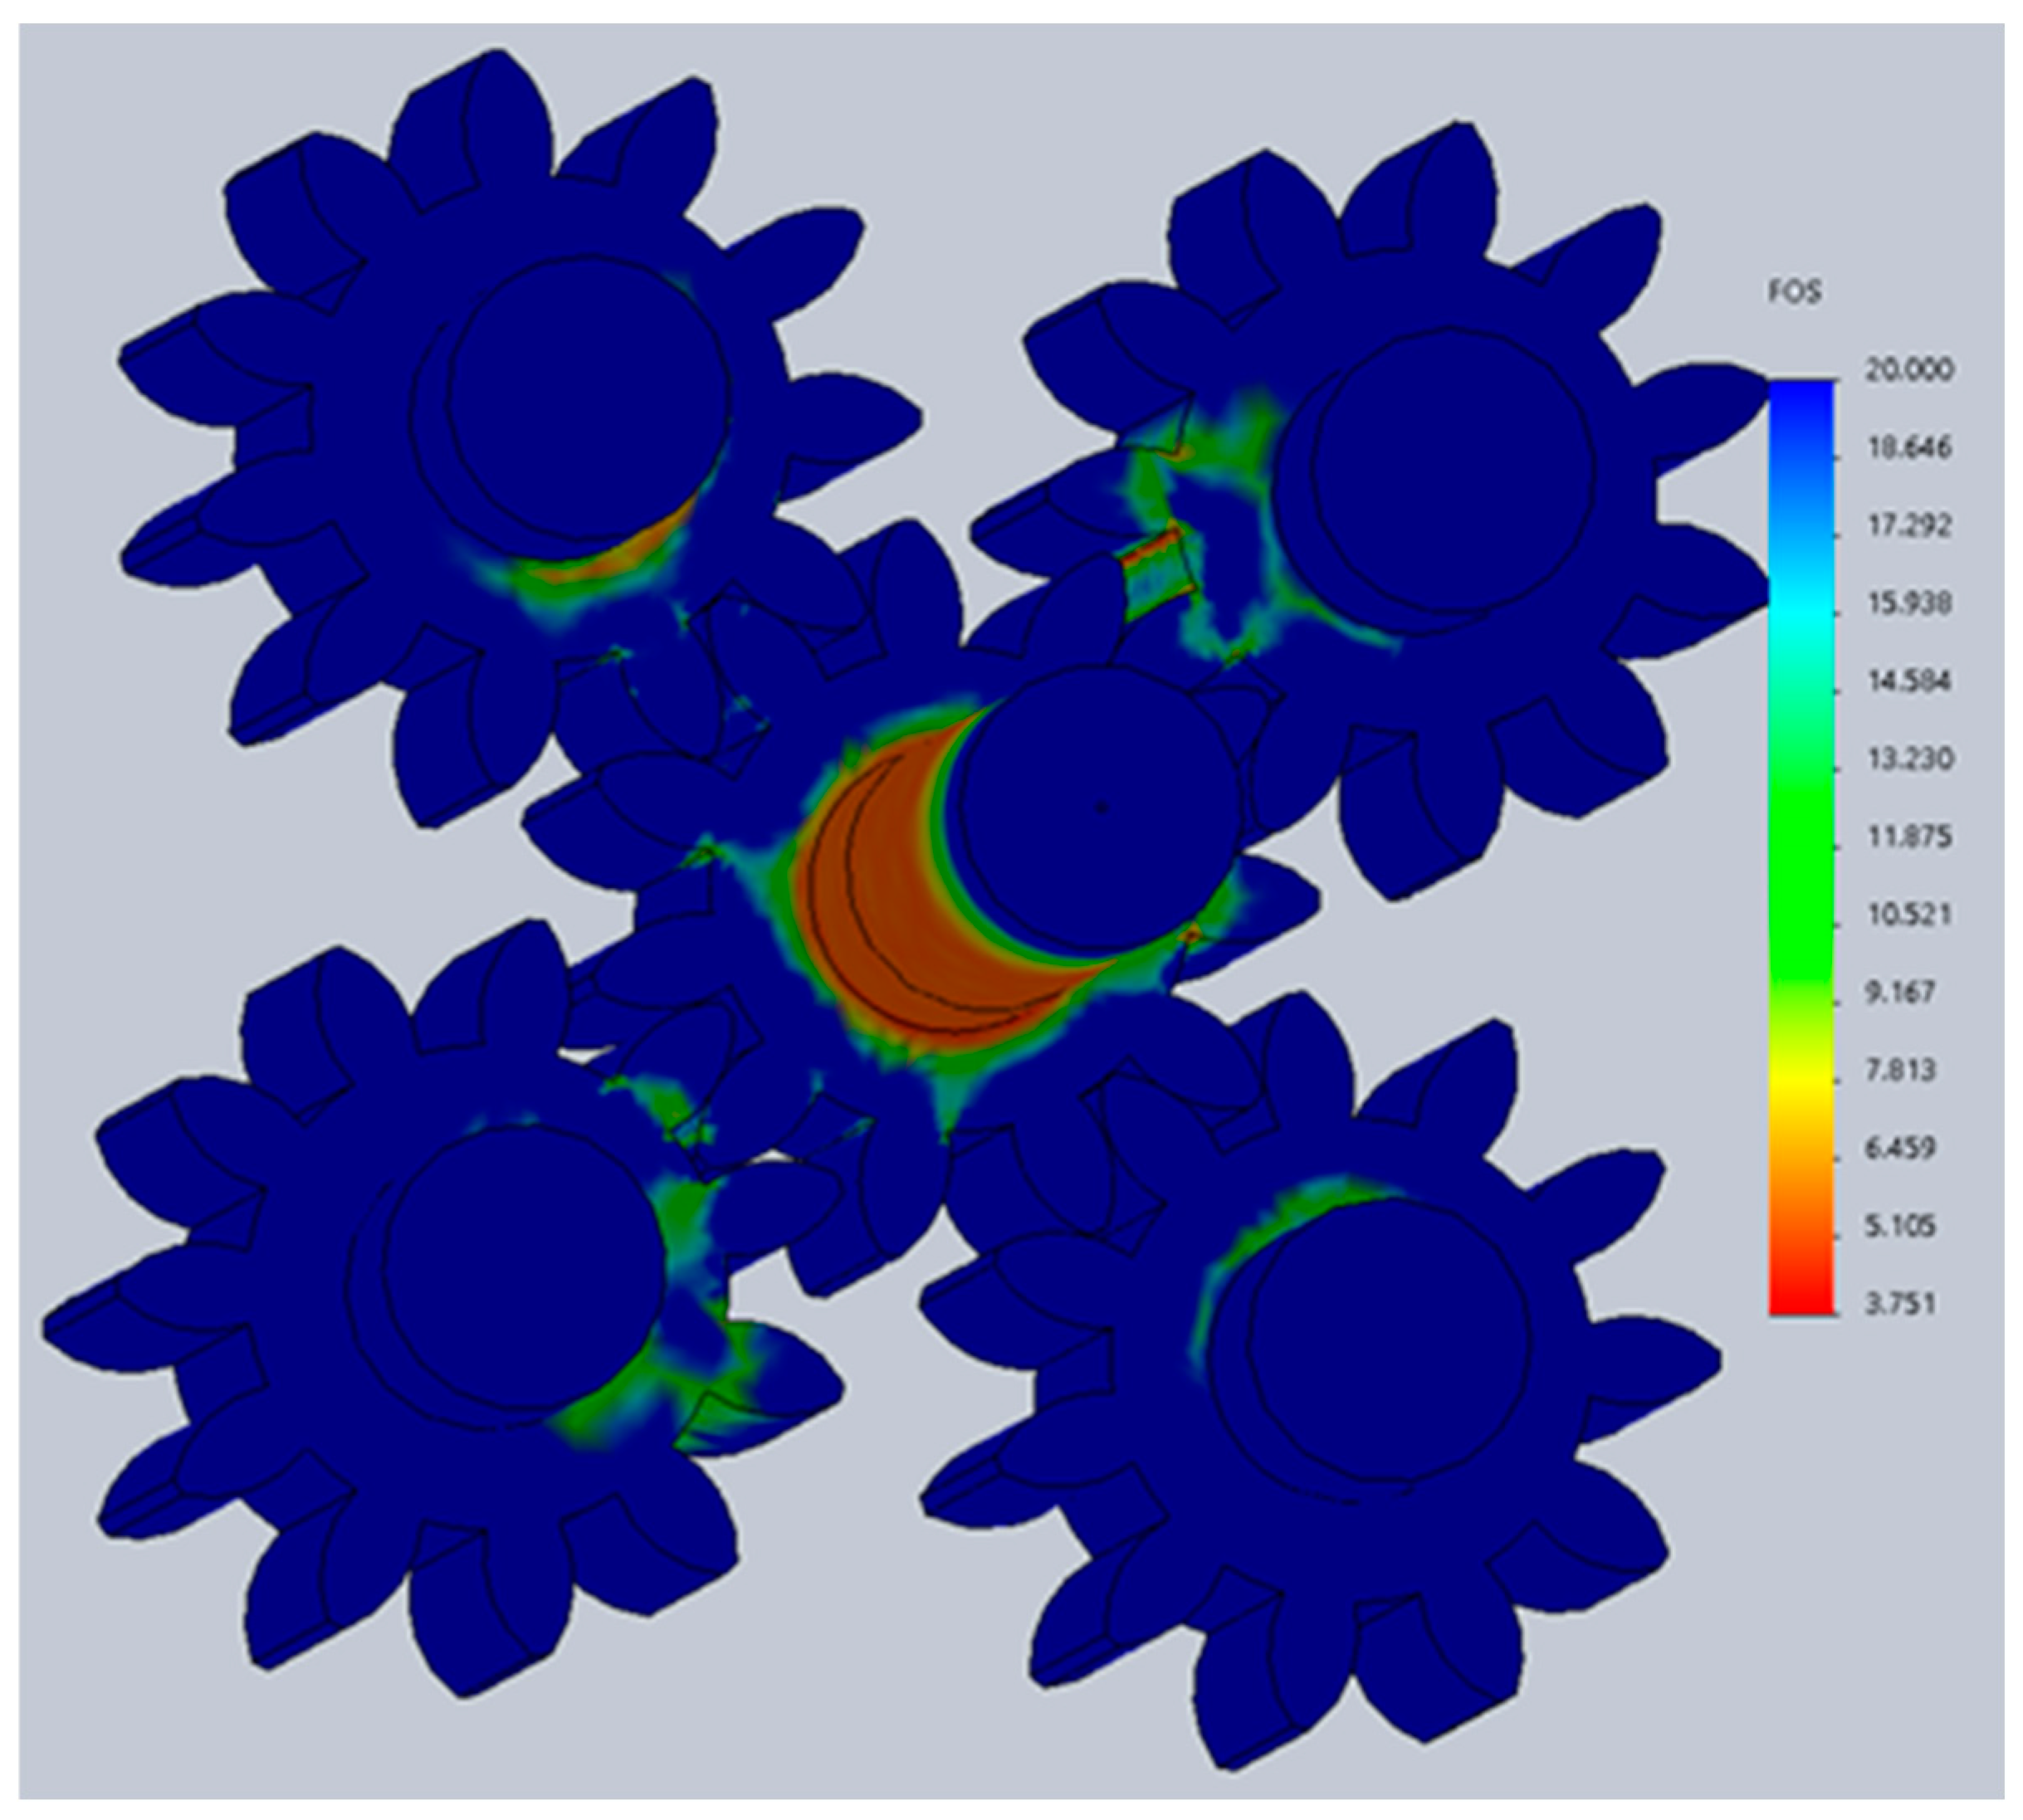
- (2)
- As a result of the FEM analysis, the most-loaded elements in the gear engagement of the pump were determined: the junction of the shaft with the drive gear and the gear teeth involved in the engagement. With an increase in torque, the stresses on the shaft increase and reach a maximum value of 519.6 MPa at a torque of M = 500 N·m. The magnitude of the stresses on the gear teeth decreases from 135.2 to 75.5 MPa. When the pressure increases to 20 MPa, the magnitude of the stresses on the gear teeth, on the contrary, has greater values (250.5 MPa) compared to the shaft (226.2 MPa).
- (3)
- The selected material is 30XGSA steel, suitable for the manufacture of gearing elements since the stress values resulting from various loads do not exceed its yield strength.
- (4)
- Based on the results of calculating the safety factor ks for this pump design, the maximum possible torque on the shaft M = 350 N·m is determined.
- (5)
- Mathematical models for the dependence of equivalent voltages on the technological parameters of a five-stage pump are adequate, and the approximation accuracy is within 5–7%.
Author Contributions
Funding
Data Availability Statement
Conflicts of Interest
References
- Choudhuri, K.; Biswas, N.; Mandal, S.K.; Mitra, C.; Biswas, S. A numerical study of an external gear pump operating under different conditions. Mater. Today Proc. 2022, 12, 1–10. [Google Scholar] [CrossRef]
- Pawar, A.; Manne, V.H.B.; Vacca, A.; Rigosi, M. Analysis of torque efficiency of External Gear Machines considering gear teeth roughness. Mech. Mach. Theory 2024, 199, 105675. [Google Scholar] [CrossRef]
- Rituraj, F.; Vacca, A. External gear pumps operating with non-Newtonian fluids: Modelling and experimental validation. Mech. Syst. Signal Process. 2018, 106, 284–302. [Google Scholar] [CrossRef]
- Xu, W.; Wang, Z.; Zhou, Z.; Sun, C.; Zhang, J.; Yan, R.; Chen, X. An advanced pressure pulsation model for external gear pump. Mech. Syst. Signal Process. 2023, 187, 109943. [Google Scholar] [CrossRef]
- Zeleny, Z.; Vodicka, V.; Novotny, V.; Mascuch, J. Gear pump for low power output ORC—An efficiency analysis. Energy Procedia 2017, 129, 1002–1009. [Google Scholar] [CrossRef]
- Kravchenko, I.N.; Velichko, S.A.; Martynov, A.V.; Barmina, O.V.; Apatenko, A.S.; Sevryugina, N.S. Evaluation of the Operational Reliability of Gear Hydraulic Pumps Repaired Using the Electric Spark Processing Method. J. Mach. Manuf. Reliab. 2023, 52, 220–226. [Google Scholar] [CrossRef]
- Zhao, X.; Vacca, A. Theoretical Investigation into the Ripple Source of External Gear Pumps. Energies 2019, 12, 535. [Google Scholar] [CrossRef]
- Egbe, E.A.P. Design Analysis and Testing of a Gear Pump. Res. Inven. Int. J. Eng. Sci. 2013, 3, 1–7. [Google Scholar]
- Osinski, P. Modelling and Design of Gear Pumps with Modified Tooth Profile; Lambert Press: Saarbruken, Germany, 2014; 156p. [Google Scholar]
- Zhang, X.; Liu, P.; Wei, W.; Li, H.; Tian, G. Design and simulation analysis of a new type of multi-gear pump. In Civil, Architecture and Environmental Engineering, Proceedings of the International Conference ICCAE, Taipei, Taiwan, 4–6 November 2016, 1st ed.; CRC Press: Boca Raton, FL, USA, 2017. [Google Scholar] [CrossRef]
- Mitov, A.; Nikolov, N.; Nedelchev, K.; Kralov, I. CFD Modeling and Experimental Validation of the Flow Processes of an External Gear Pump. Processes 2024, 12, 261. [Google Scholar] [CrossRef]
- Jędraszczyk, P.; Fiebig, W. CFD Model of an External Gear Pump. In Proceedings of the 13th International Scientific Conference, RESRB 2016, Wrocław, Polska, 22–24 June 2016; Lecture Notes in Mechanical Engineering. Rusiński, E., Pietrusiak, D., Eds.; Springer: Cham, Switzerland, 2016. [Google Scholar] [CrossRef]
- Močilana, M.; Husárb, Š.; Labajc, J.; Žmindáka, M. Non-stationary CFD simulation of a gear pump. Procedia Eng. 2017, 177, 532–539. [Google Scholar] [CrossRef]
- Romanenko, I.; Martseniuk, Y.; Bilohub, O. Modeling the Meshing Procedure of the External Gear Fuel Pump Using a CFD Tool. Computation 2022, 10, 114. [Google Scholar] [CrossRef]
- Corvaglia, A.; Rundo, M.; Casoli, P.; Lettini, A. Evaluation of Tooth Space Pressure and Incomplete Filling in External Gear Pumps by Means of Three-Dimensional CFD Simulations. Energies 2021, 14, 342. [Google Scholar] [CrossRef]
- Agrawal, A.P.; Ali, S.; Rathore, S. Finite element stress analysis for shape optimization of spur gear using ANSYS. Mater. Today Proc. 2022, 64, 1147–1152. [Google Scholar] [CrossRef]
- Emma Frosina, E.; Senatore, A.; Rigosi, M. Study of a High-Pressure External Gear Pump with a Computational Fluid Dynamic Modeling Approach. Energies 2017, 10, 1113. [Google Scholar] [CrossRef]
- Ghazaly, N.M.; Kamel, A.A.; Mousa, M.O. Influence of misalignment and backlash on spur gear using FEM. Int. J. Mech. Prod. Eng. 2014, 2, 66–69. [Google Scholar]
- Ghionea, I.; Ghionea, A.; Constantin, G.; Stryczek, J.; Biernacki, K.; Krawczyk, J. Designing Gear Pump Bodies Using FEM. In Proceedings of the 14th International Scientific Conference: Computer Aided Engineering; Springer: Berlin/Heidelberg, Germany, 2019; pp. 767–783. [Google Scholar]
- Rao, P.S.; Vamsi, C. Contact Stress and Shear Stress Analysis of Spur Gear Using ANSYS and Theoretical. Int. J. Mod. Stud. Mech. Eng. (IJMSME) 2016, 2, 9–14. [Google Scholar] [CrossRef]
- Devan, P.D.; Muruganantham, V.R. Determination of Natural Frequencies of Spur Gear in Portal Axle Gearbox. Int. J. Innov. Technol. Explor. Eng. (IJITEE) 2019, 8, 422–426. [Google Scholar]
- Prabhakaran, S.; Balaji, D.S.; Kumar, R.P. Bending stress analysis of a spur gear for material steel 15NI2CR1MO28. ARPN J. Eng. Appl. Sci. 2017, 12, 5636–5641. [Google Scholar]
- Rao, P.S.; Sriraj, N.; Farookh, M. Contact Stress Analysis of Spur Gear for Different Materials using ANSYS and Hertz Equation. Int. J. Mod. Stud. Mech. Eng. (IJMSME) 2015, 1, 45–52. [Google Scholar]
- Nirmal, K.G.; Dewangan, M.K. Structural Analysis of Bevel Gear using ANSYS. JETIR 2021, 8, 66–70. [Google Scholar]
- Ferrari, C.; Morselli, S.; Miccoli, G.; Hamiche, K. Integrated CFD-FEM approach for external gear pump vibroacoustic field prediction. Front. Mech. Eng. 2024, 10, 1298260. [Google Scholar] [CrossRef]
- Zharkevich, O.; Nikonova, T.; Gierz, Ł.; Berg, A.; Berg, A.; Zhunuspekov, D.; Warguła, Ł.; Łykowski, W.; Fryczy’nski, K. Parametric Optimization of a New Gear Pump Casing Based on Weight Using a Finite Element Method. Appl. Sci. 2023, 13, 12154. [Google Scholar] [CrossRef]
- Gierz, Ł.; Fryczynksi, K.; Łykowski, K.; Wargula, Ł.; Wieczorek, B. Quasi-Planetary Gear Pump. Patent Application of the Patent Office of the Republic of Poland No. P.446435, 19 October 2023. [Google Scholar]
- GOST 17479.3-85 Hydraulic Oils. Available online: https://www.russiangost.com/p-16159-gost-174793-85.aspx (accessed on 20 September 2024.).
- Aggarwal, R.; Ranganathan, P. Common pitfalls in statistical analysis: The use of correlation techniques. Perspect. Clin. Res. 2016, 7, 187–190. [Google Scholar] [CrossRef] [PubMed]
- Zharkevich, O.; Nikonova, T.; Gierz, L.; Reshetnikova, O.; Berg, A.; Warguła, Ł.; Berg, A.; Wieczorek, B.; Łykowski, W.; Nurzhanova, O. Improving the Design of a Multi-Gear Pump Switchgear Using CFD Analysis. Appl. Sci. 2024, 14, 5394. [Google Scholar] [CrossRef]
- Rawlings, J.; Pantula, S.; Dickey, D. Applied Regression Analysis a Research Tool Textbook Springer Texts in Statistics (STS); Springer: Berlin/Heidelberg, Germany, 1998; 456p. [Google Scholar]
- Zaid, M.A. Correlation and Regression Analysis: Textbook; The Statistical, Economic and Social Research and Training Centre for Islamic Countries: Ankara, Turkey, 2015; 33p. [Google Scholar]
- Freund, R.J.; Wilson, W.J.; Sa, P. Regression Analysis, 2nd ed.; Imprint—Academic Press: Cambridge, MA, USA, 2006; 480p. [Google Scholar]
- Zharkevich, O.; Nurzhanova, O.; Zhunuspekov, D.; Naboko, Y.; Buzauova, T.; Abdugaliyeva, G.; Mateshov, A.; Bessonov, A. Determination of Optimal Hardfacing Modes for Recovering Electric Motor Shafts. Teh. Vjesn. 2023, 30, 951–957. [Google Scholar]
- Wazzan, S.; Ozalan, N.U. Exploring the Symmetry of Curvilinear Regression Models for Enhancing the Analysis of Fibrates Drug Activity through Molecular Descriptors. Symmetry 2023, 15, 1160. [Google Scholar] [CrossRef]
- Ott, R.L. An Introduction to Statistical Methods and Data Analysis; Brooks/Cole, Cengage Learning; Duxbury Pr: Boston, MA, USA, 2010; 1279p. [Google Scholar]
- Liu, H.; Yuan, Y.; Wang, G.; Xu, W.; Zhao, L.; Li, J. An advanced variable selection method based on information gain and Fisher criterion reselection iteration for multivariate calibration. Chemom. Intell. Lab. Syst. 2023, 235, 104796. [Google Scholar] [CrossRef]
- Herza, J.; Ashley, M.; Thorp, J. Factor of Safety?-Do we use it correctly? In Proceedings of the ANCOLD Conference, Hobart, Australia, 26–27 October 2017. [Google Scholar]


| № | Parameter Name | Designation | Measurement Unit | Value |
|---|---|---|---|---|
| Geometric parameters | ||||
| 1 | Tooth module | m | mm | 5 |
| 2 | Number of gear teeth | z | - | 11 |
| 3 | Dividing diameter of the gear | d | mm | 55 |
| 4 | Diameter of the circumference of the gear projections | df | mm | |
| 5 | Center distance | a | mm | 55 |
| 6 | Gear width | b | mm | 50 |
| 7 | Working capacity | q | m3 | 275 |
| Energy parameters | ||||
| 8 | Revolutions | n | r/min | 1000 |
| 9 | Productivity | Q | m3/s | 0.00458 |
| 10 | Discharge pressure | Pd | MPa | up to 16 |
| 11 | Suction pressure | Ps | MPa | 0.5 |
| 12 | Dynamic viscosity coefficient | µ | Pa·s | 0.00861 |
| Material | Yield Stress | Linear Expansion Coefficient | Modulus of Elasticity | Poisson’s Ratio | Density |
|---|---|---|---|---|---|
| Steel 30XGSA | 760 MPa | 12.3 × 10⁻⁶ 1/°C | 211 GPa | 0.3 | 7850 kg/m3 |
| № Experience | Discharge Pressure P, MPa | Torque on Shaft M, N·m |
|---|---|---|
| Series 1 | ||
| 1 | 6 | 200 |
| 2 | 8 | |
| 3 | 10 | |
| 4 | 12 | |
| 5 | 14 | |
| 6 | 16 | |
| 7 | 18 | |
| 8 | 20 | |
| Series 2 | ||
| 9 | 12 | 100 |
| 10 | 150 | |
| 11 | 200 | |
| 12 | 250 | |
| 13 | 300 | |
| 14 | 350 | |
| 15 | 400 | |
| 16 | 500 | |
Disclaimer/Publisher’s Note: The statements, opinions and data contained in all publications are solely those of the individual author(s) and contributor(s) and not of MDPI and/or the editor(s). MDPI and/or the editor(s) disclaim responsibility for any injury to people or property resulting from any ideas, methods, instructions or products referred to in the content. |
© 2024 by the authors. Licensee MDPI, Basel, Switzerland. This article is an open access article distributed under the terms and conditions of the Creative Commons Attribution (CC BY) license (https://creativecommons.org/licenses/by/4.0/).
Share and Cite
Zharkevich, O.; Reshetnikova, O.; Nikonova, T.; Berg, A.; Berg, A.; Zhunuspekov, D.; Nurzhanova, O. CFD-FEM Analysis for Functionality Prediction of Multi-Gear Pumps. Designs 2024, 8, 115. https://doi.org/10.3390/designs8060115
Zharkevich O, Reshetnikova O, Nikonova T, Berg A, Berg A, Zhunuspekov D, Nurzhanova O. CFD-FEM Analysis for Functionality Prediction of Multi-Gear Pumps. Designs. 2024; 8(6):115. https://doi.org/10.3390/designs8060115
Chicago/Turabian StyleZharkevich, Olga, Olga Reshetnikova, Tatyana Nikonova, Alexandra Berg, Andrey Berg, Darkhan Zhunuspekov, and Oxana Nurzhanova. 2024. "CFD-FEM Analysis for Functionality Prediction of Multi-Gear Pumps" Designs 8, no. 6: 115. https://doi.org/10.3390/designs8060115
APA StyleZharkevich, O., Reshetnikova, O., Nikonova, T., Berg, A., Berg, A., Zhunuspekov, D., & Nurzhanova, O. (2024). CFD-FEM Analysis for Functionality Prediction of Multi-Gear Pumps. Designs, 8(6), 115. https://doi.org/10.3390/designs8060115