

Comparative Analysis of Rubberized Asphalt and Traditional Asphalt: Performance, Economic, and Environmental Impacts in Life Cycle

Abstract
1. Introduction
2. Research Purpose
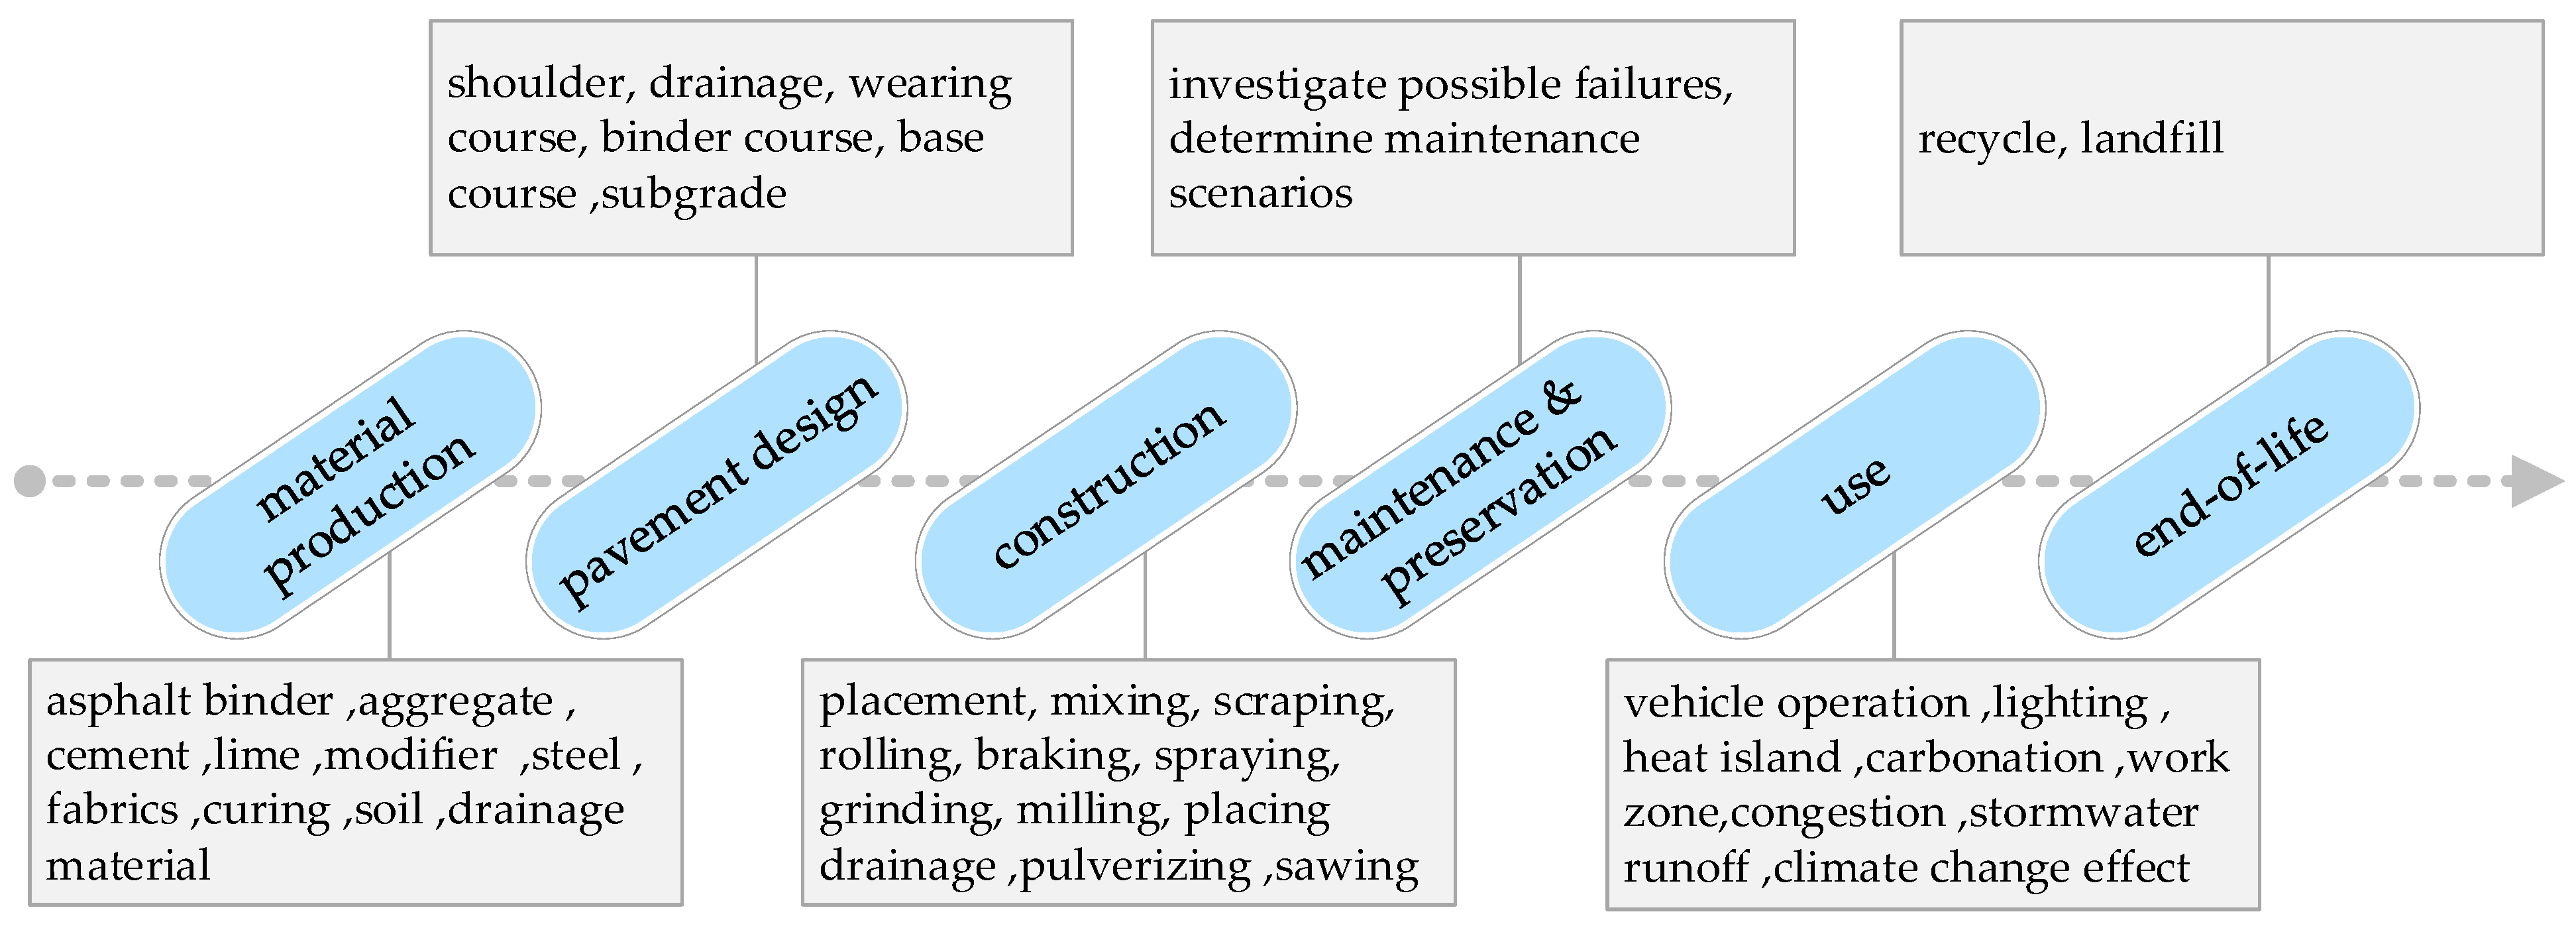
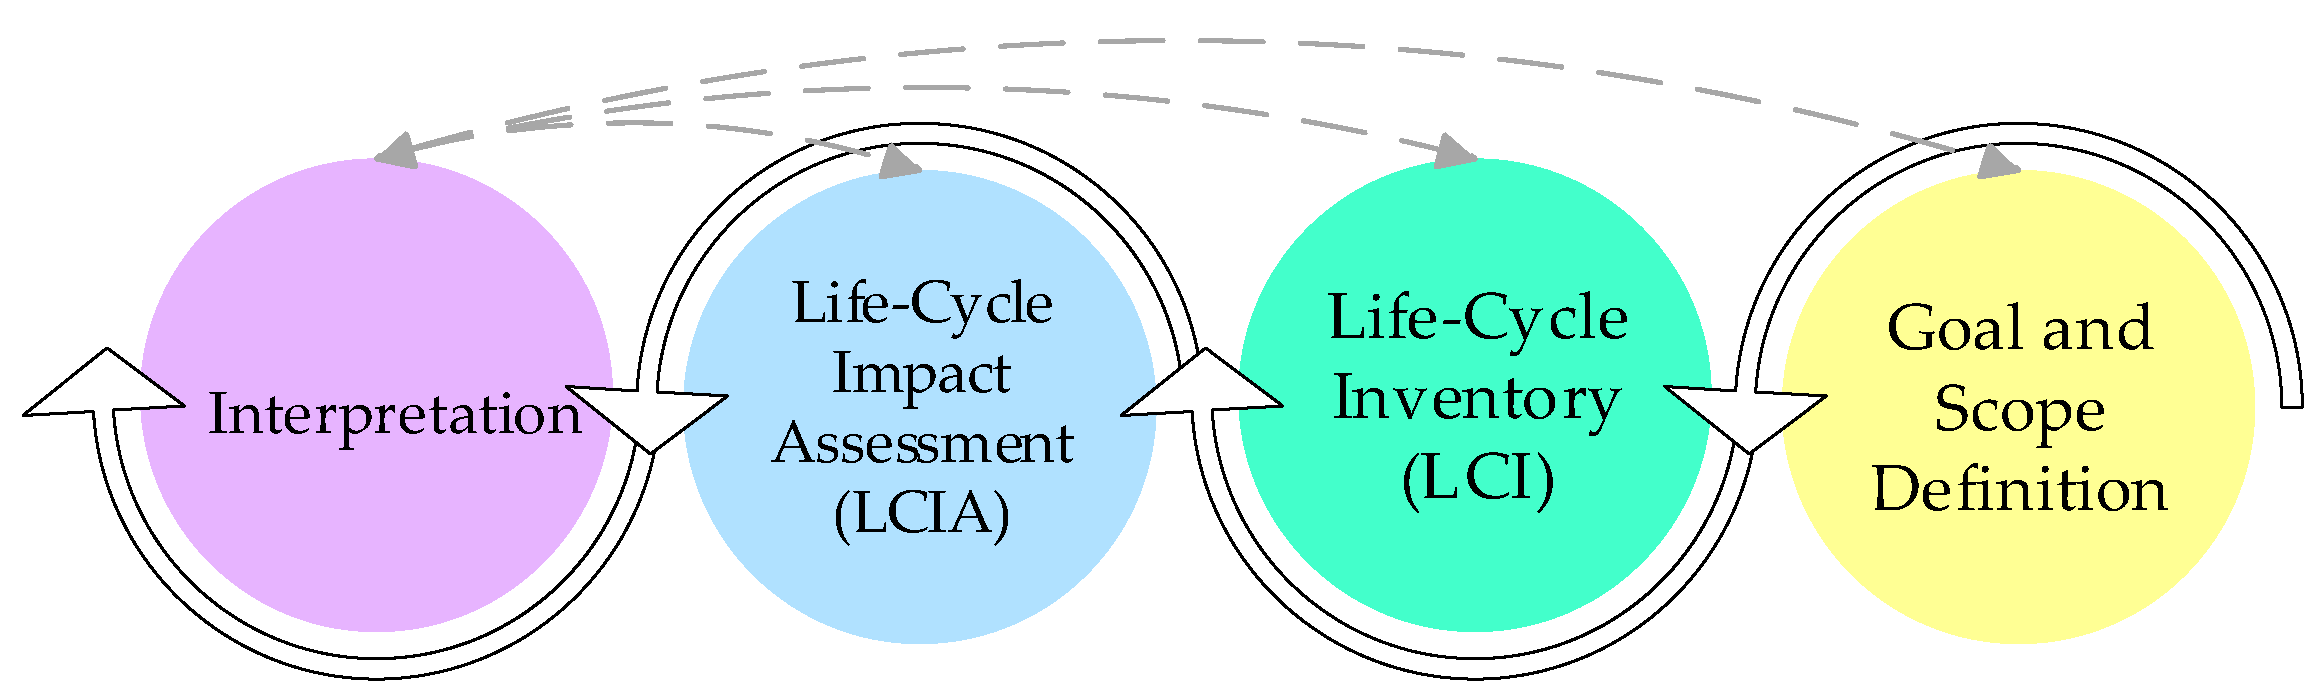
3. Life Cycle Assessment Framework
- Cradle-to-grave LCAs with complete life cycle stages included in the system boundary.
- Cradle-to-gate LCAs with options (which include the production stage and selected further life cycle stages).
- Cradle-to-laid (also referred to as “cradle-to-end of construction”) LCAs with the construction stage added to the system boundary.
- Specific parts of the life cycle (e.g., waste management, components of a product, or use stage).
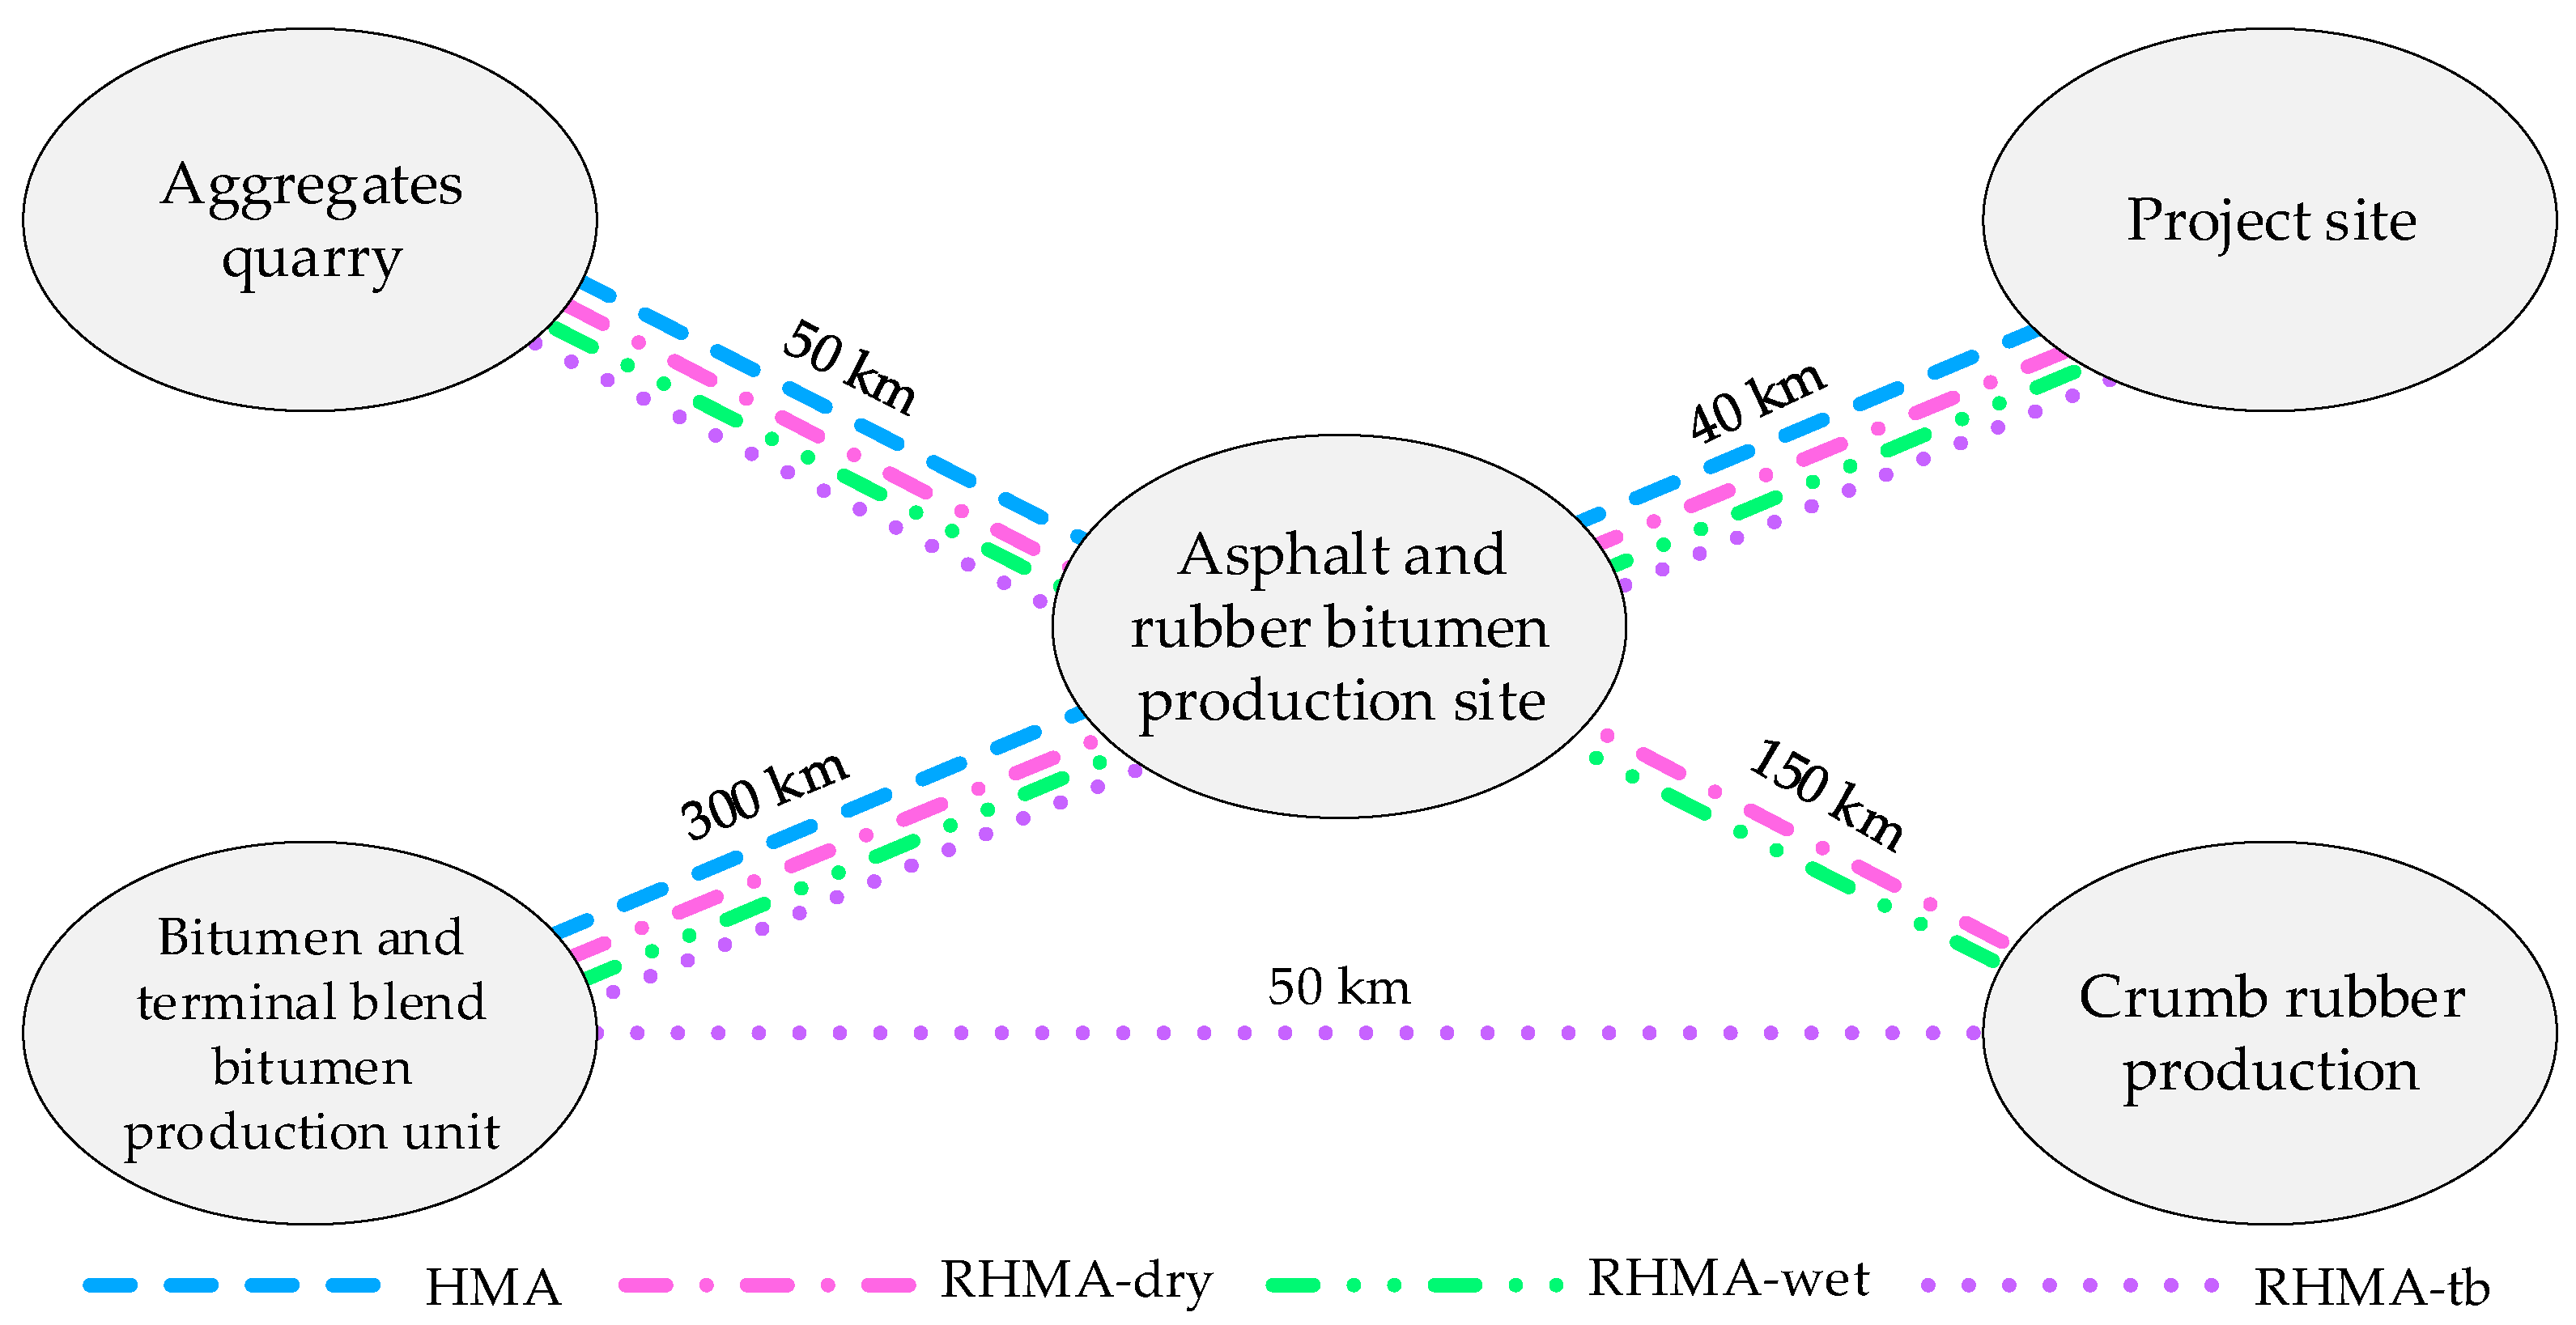
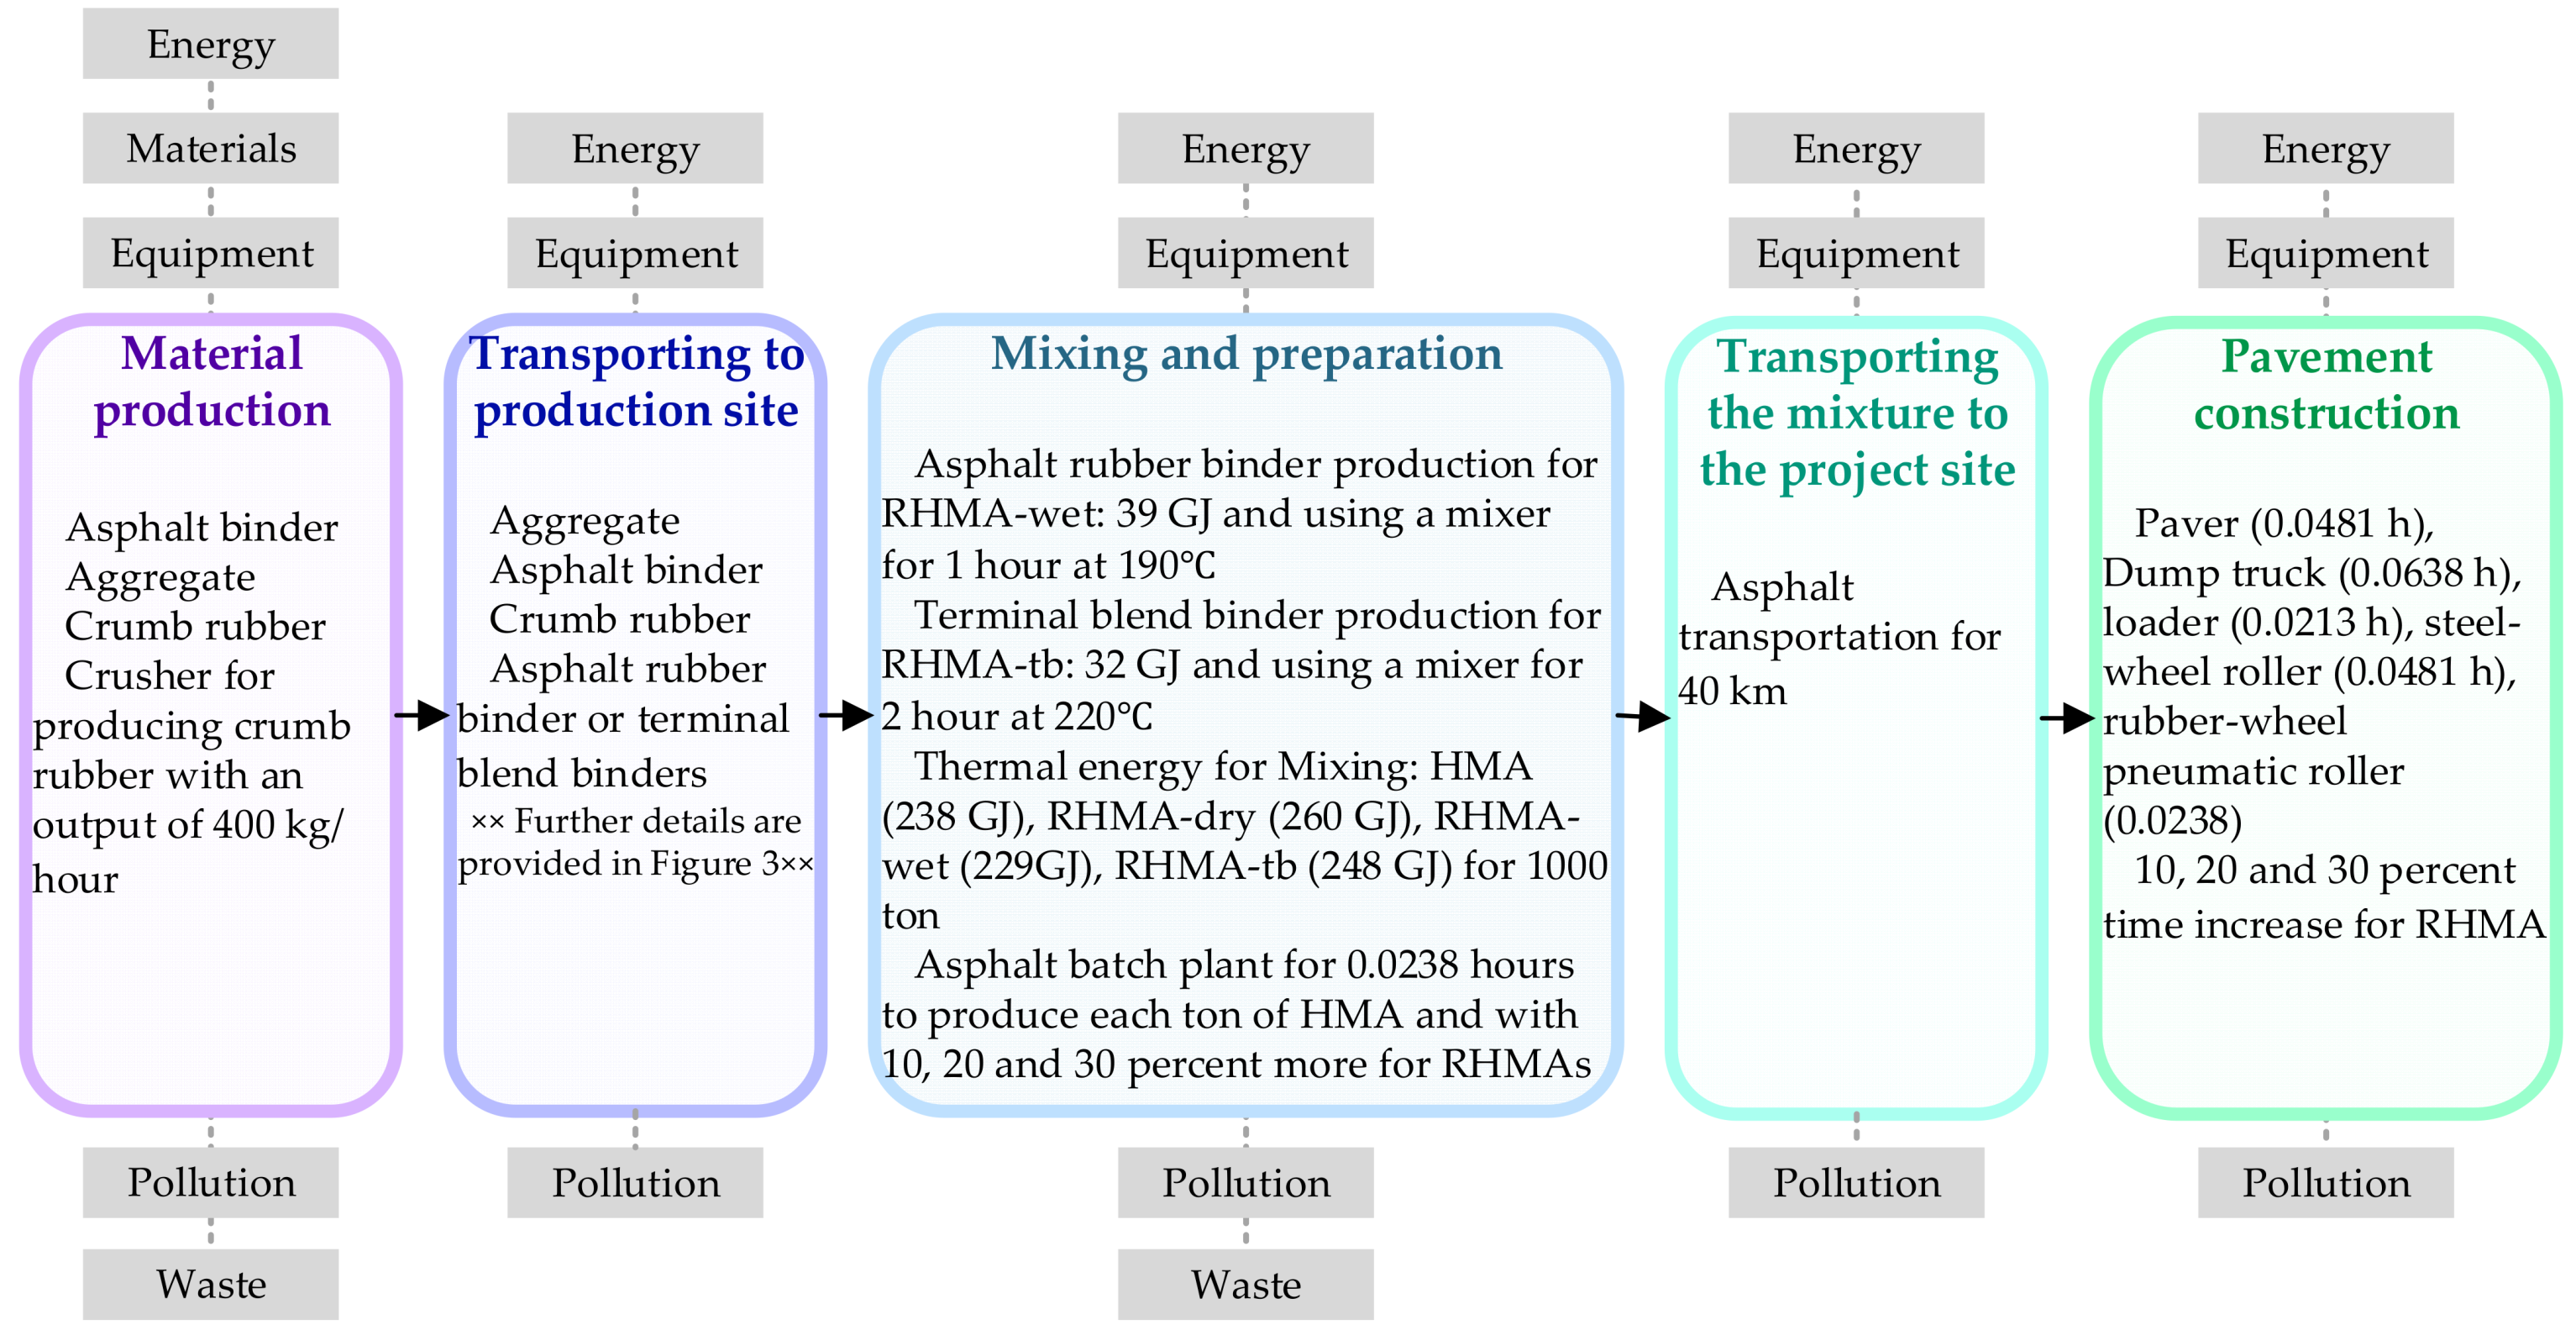
4. Life Cycle Inventory
- TE is the thermal energy (MJ/ton mixture) necessary to produce one ton of asphalt mixture;
- mi is the mass of aggregates of fraction i (Table 1);
- Ci is the specific heat capacity coefficient of aggregate fraction i (0.74 );
- M is the total number of aggregate fractions;
- tmix is the mixing temperature of an asphalt mixture;
- t0 is the ambient temperature (15 °C);
- mbit is the mass of the asphalt binder (Table 1);
- Cbit is the specific heat capacity coefficient of the asphalt binder (2.093 );
- Wi is the water content of the aggregates of fraction i (0.3);
- Cw is the specific heat capacity coefficient of water (4.1855 );
- Lv is the latent heat required to evaporate water (2256 kJ/kg);
- Cvap is the specific heat capacity coefficient of water vapor (1.83 kJ/kg); and
- CL is the casing losses factor (0.27).
5. Result and Discussion
5.1. Performance Evaluation
5.2. Economic Evaluation
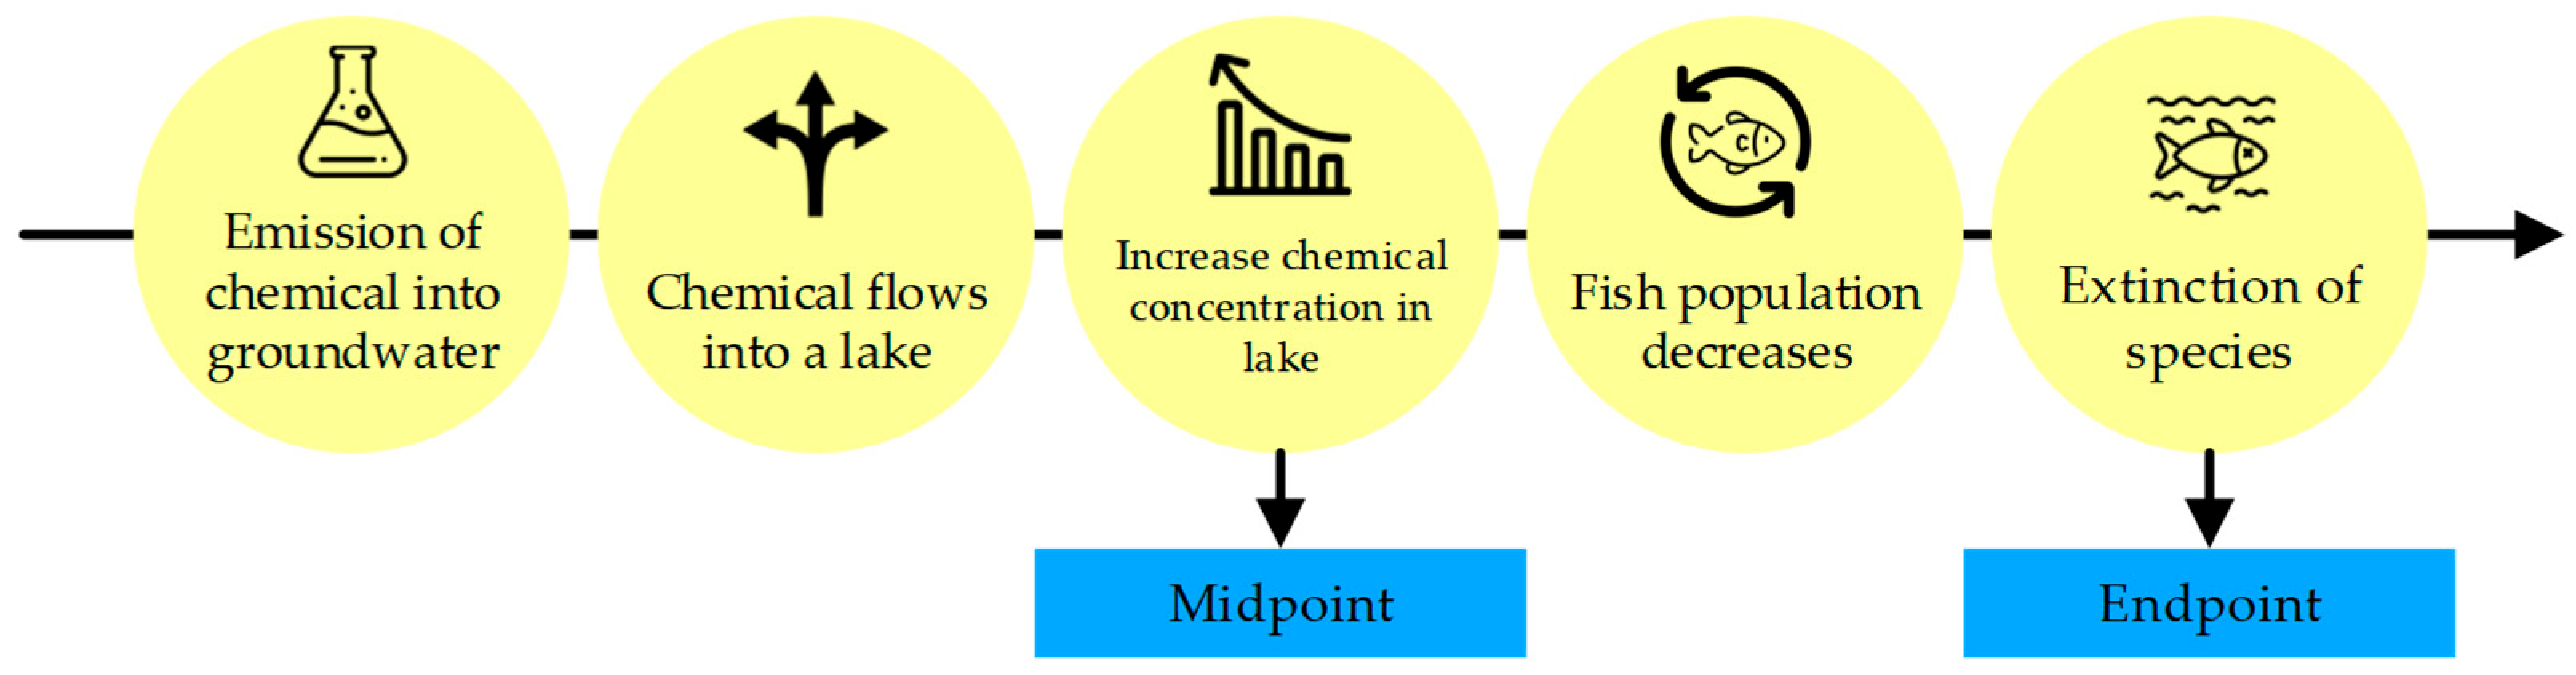
5.3. Environmental Impact Evaluation
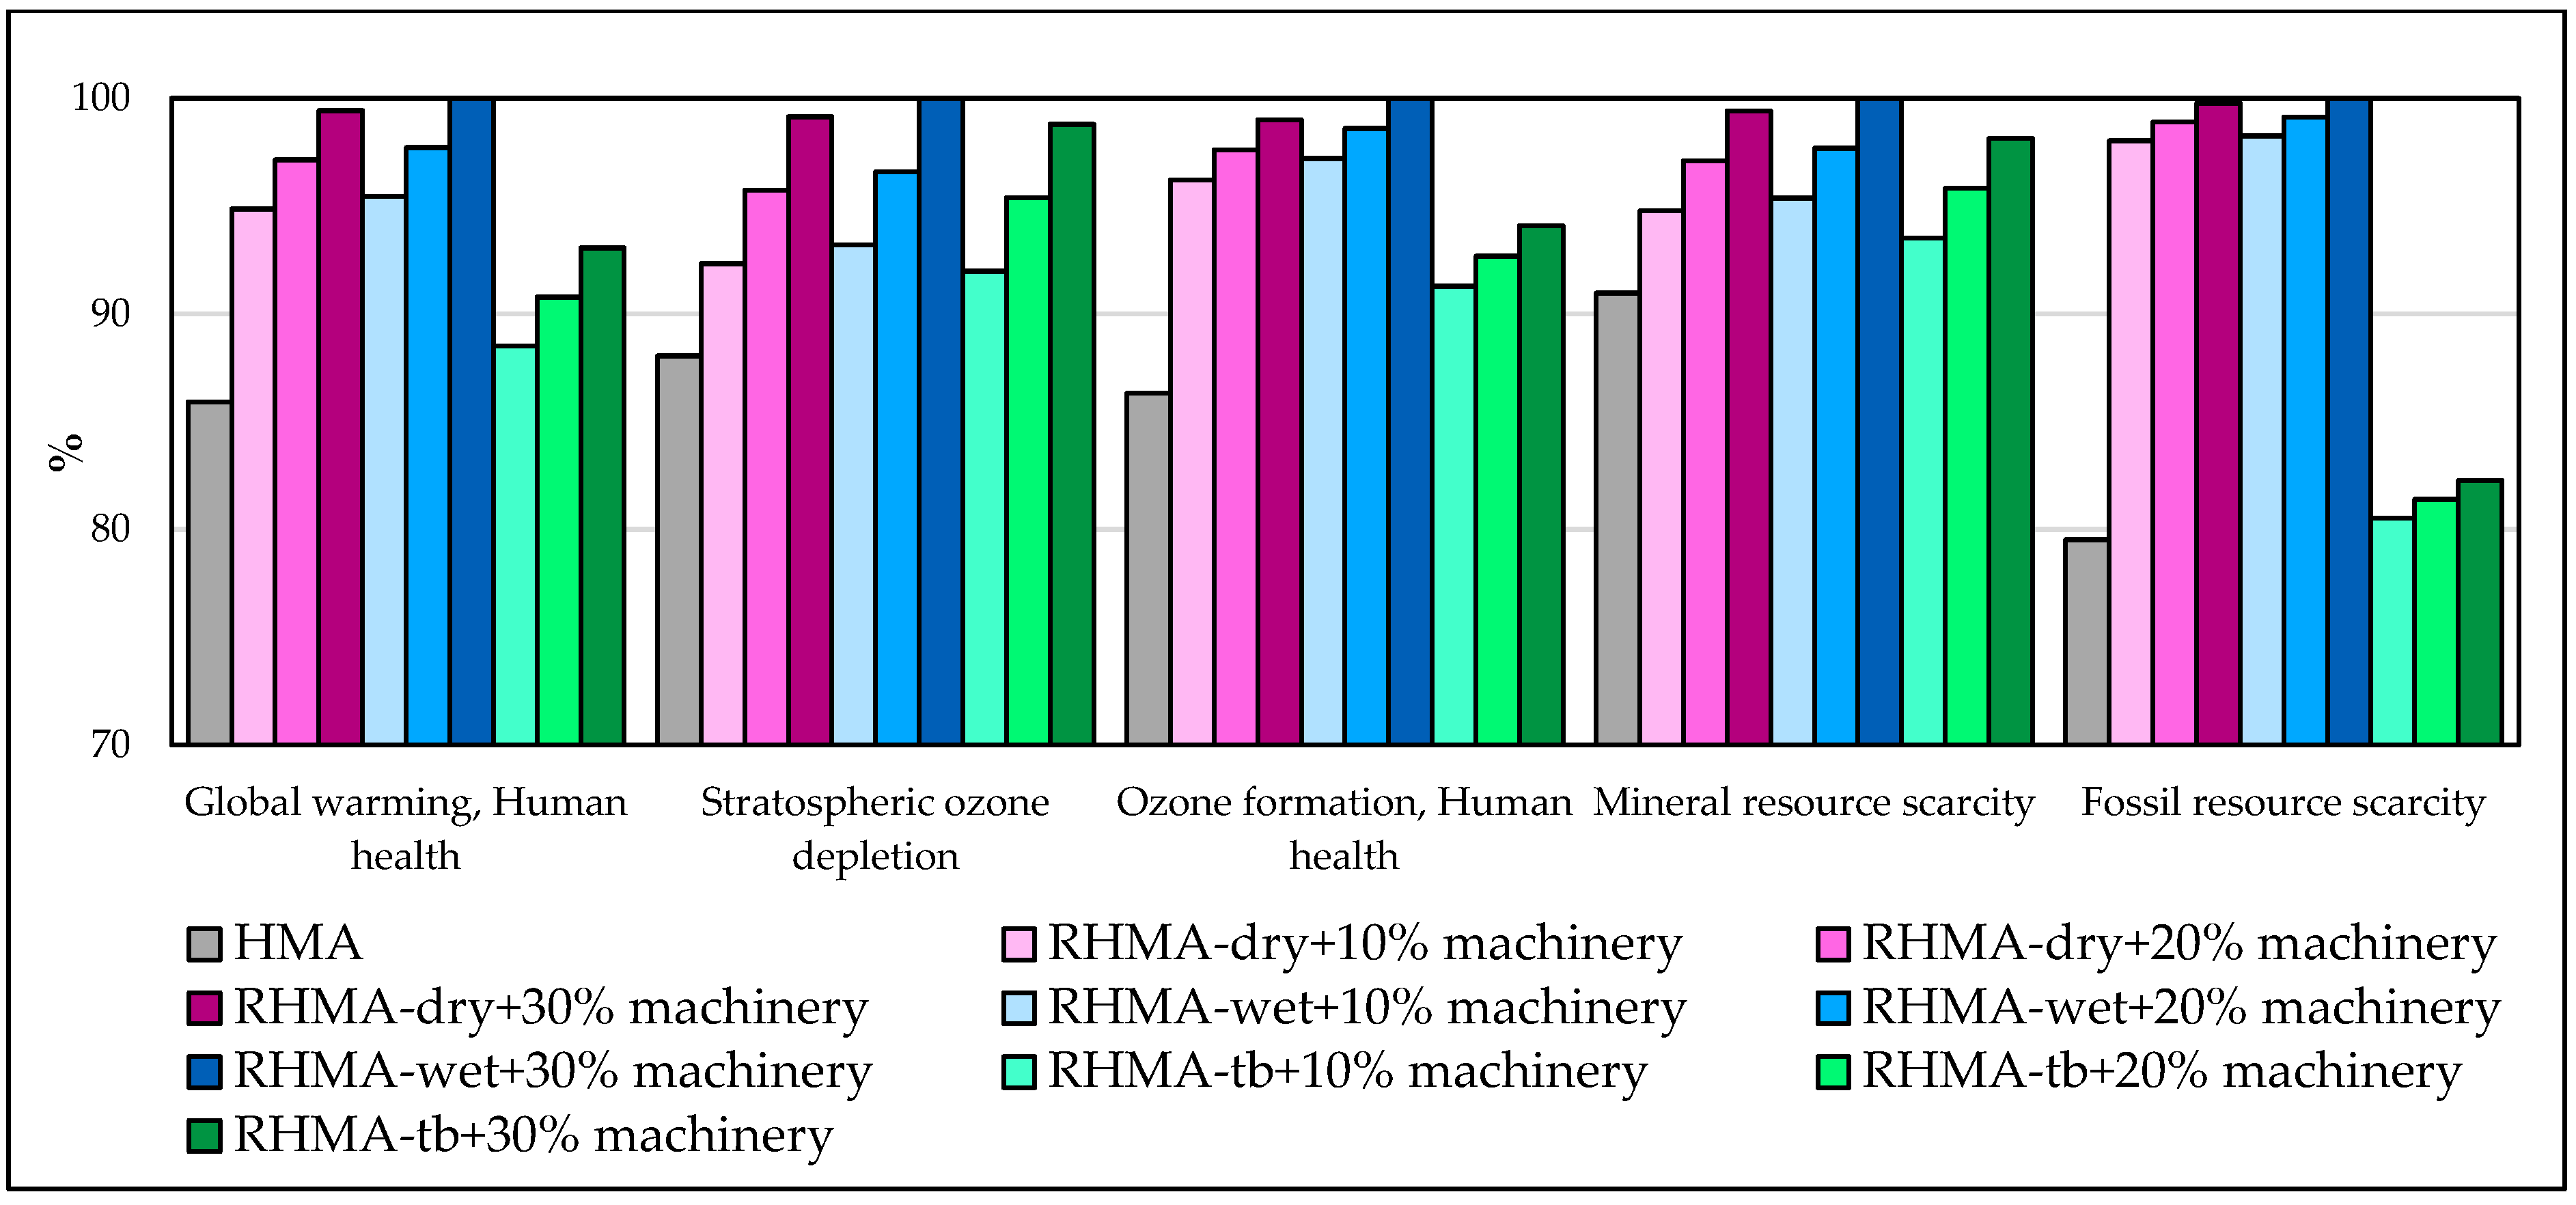
5.3.1. Result of Characterization
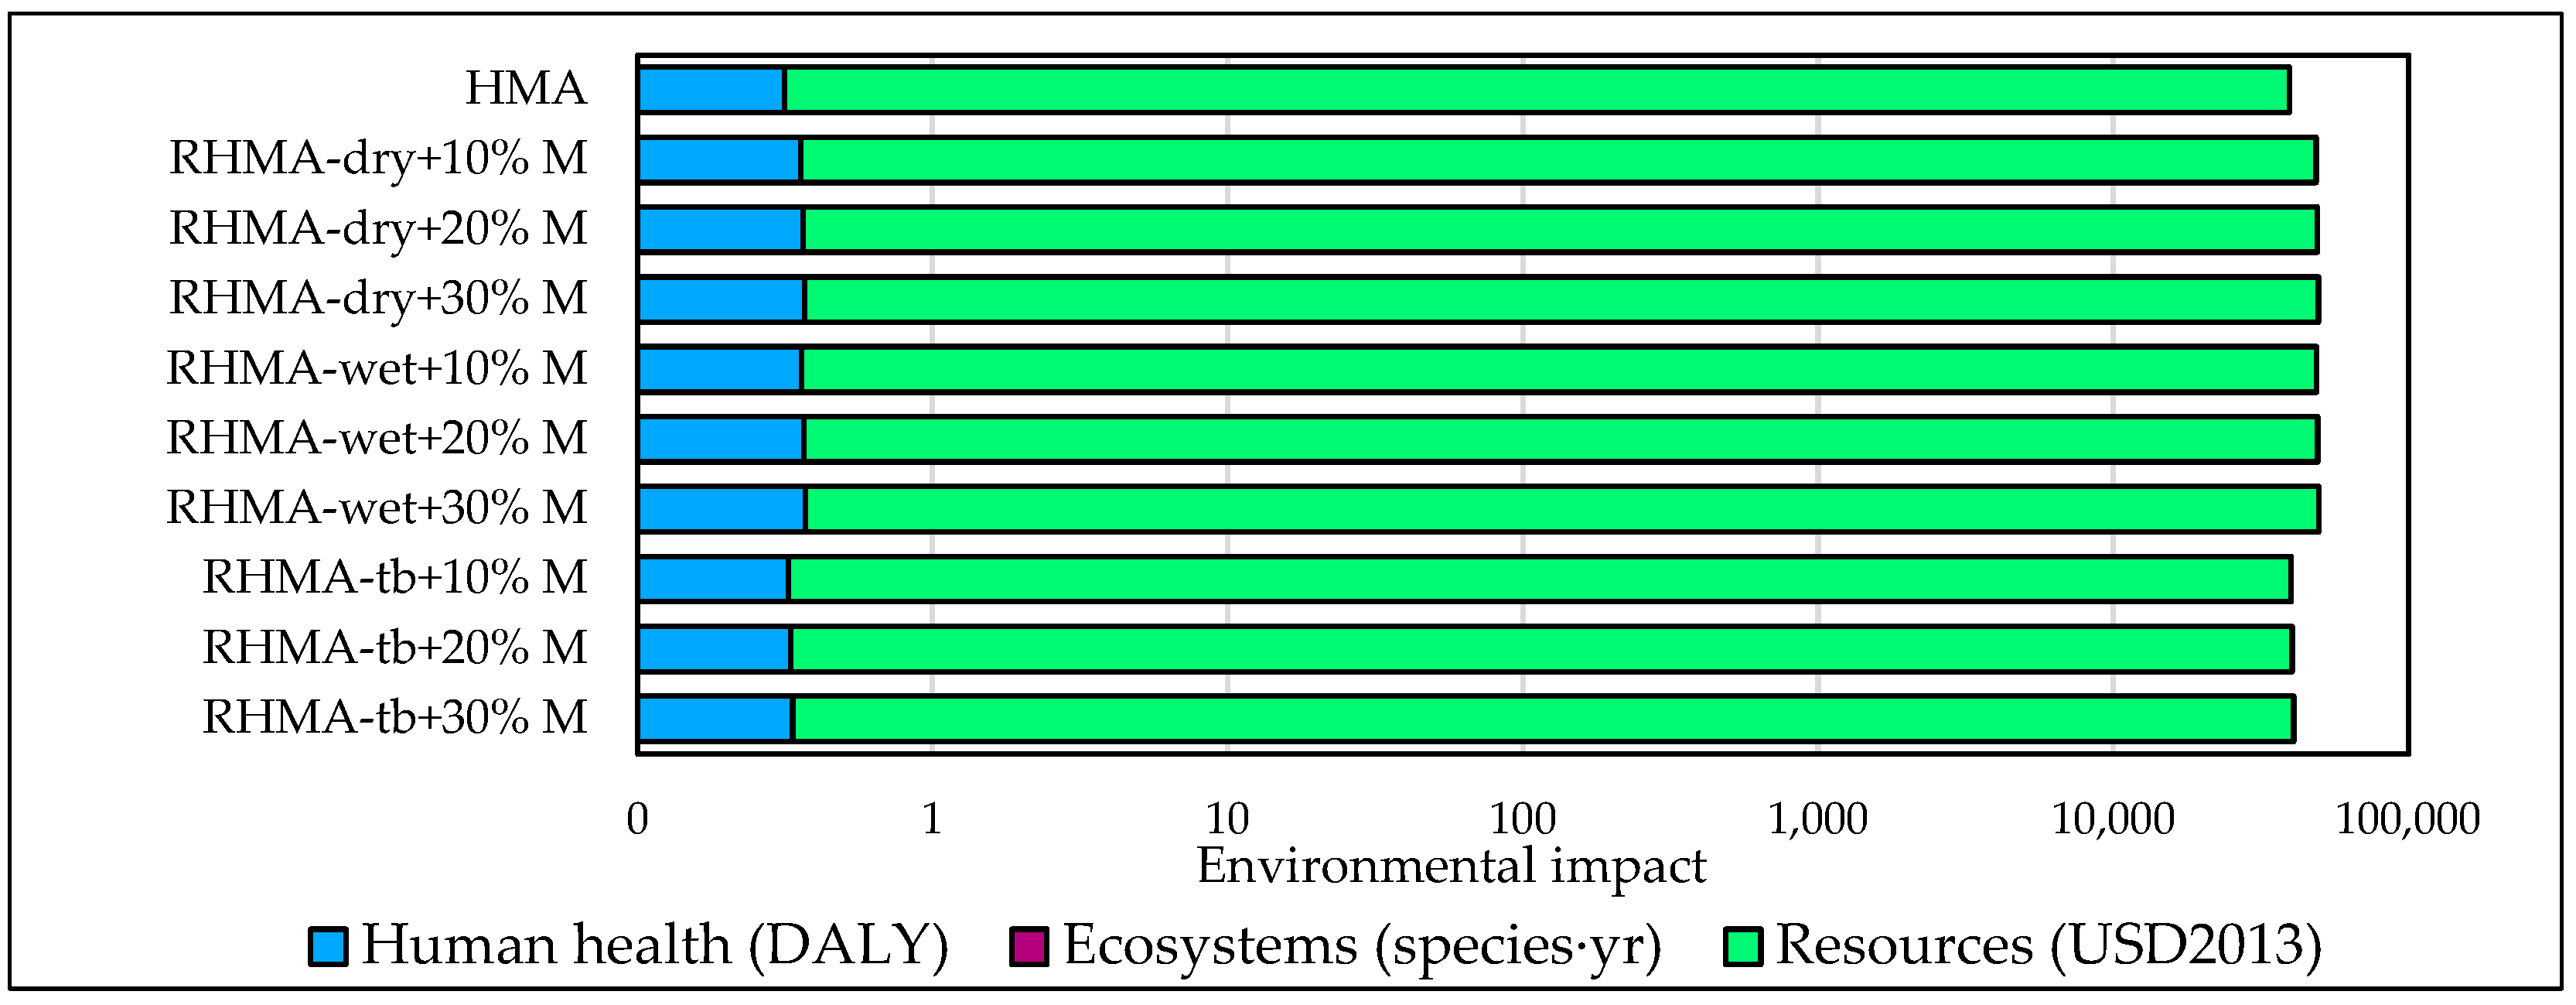
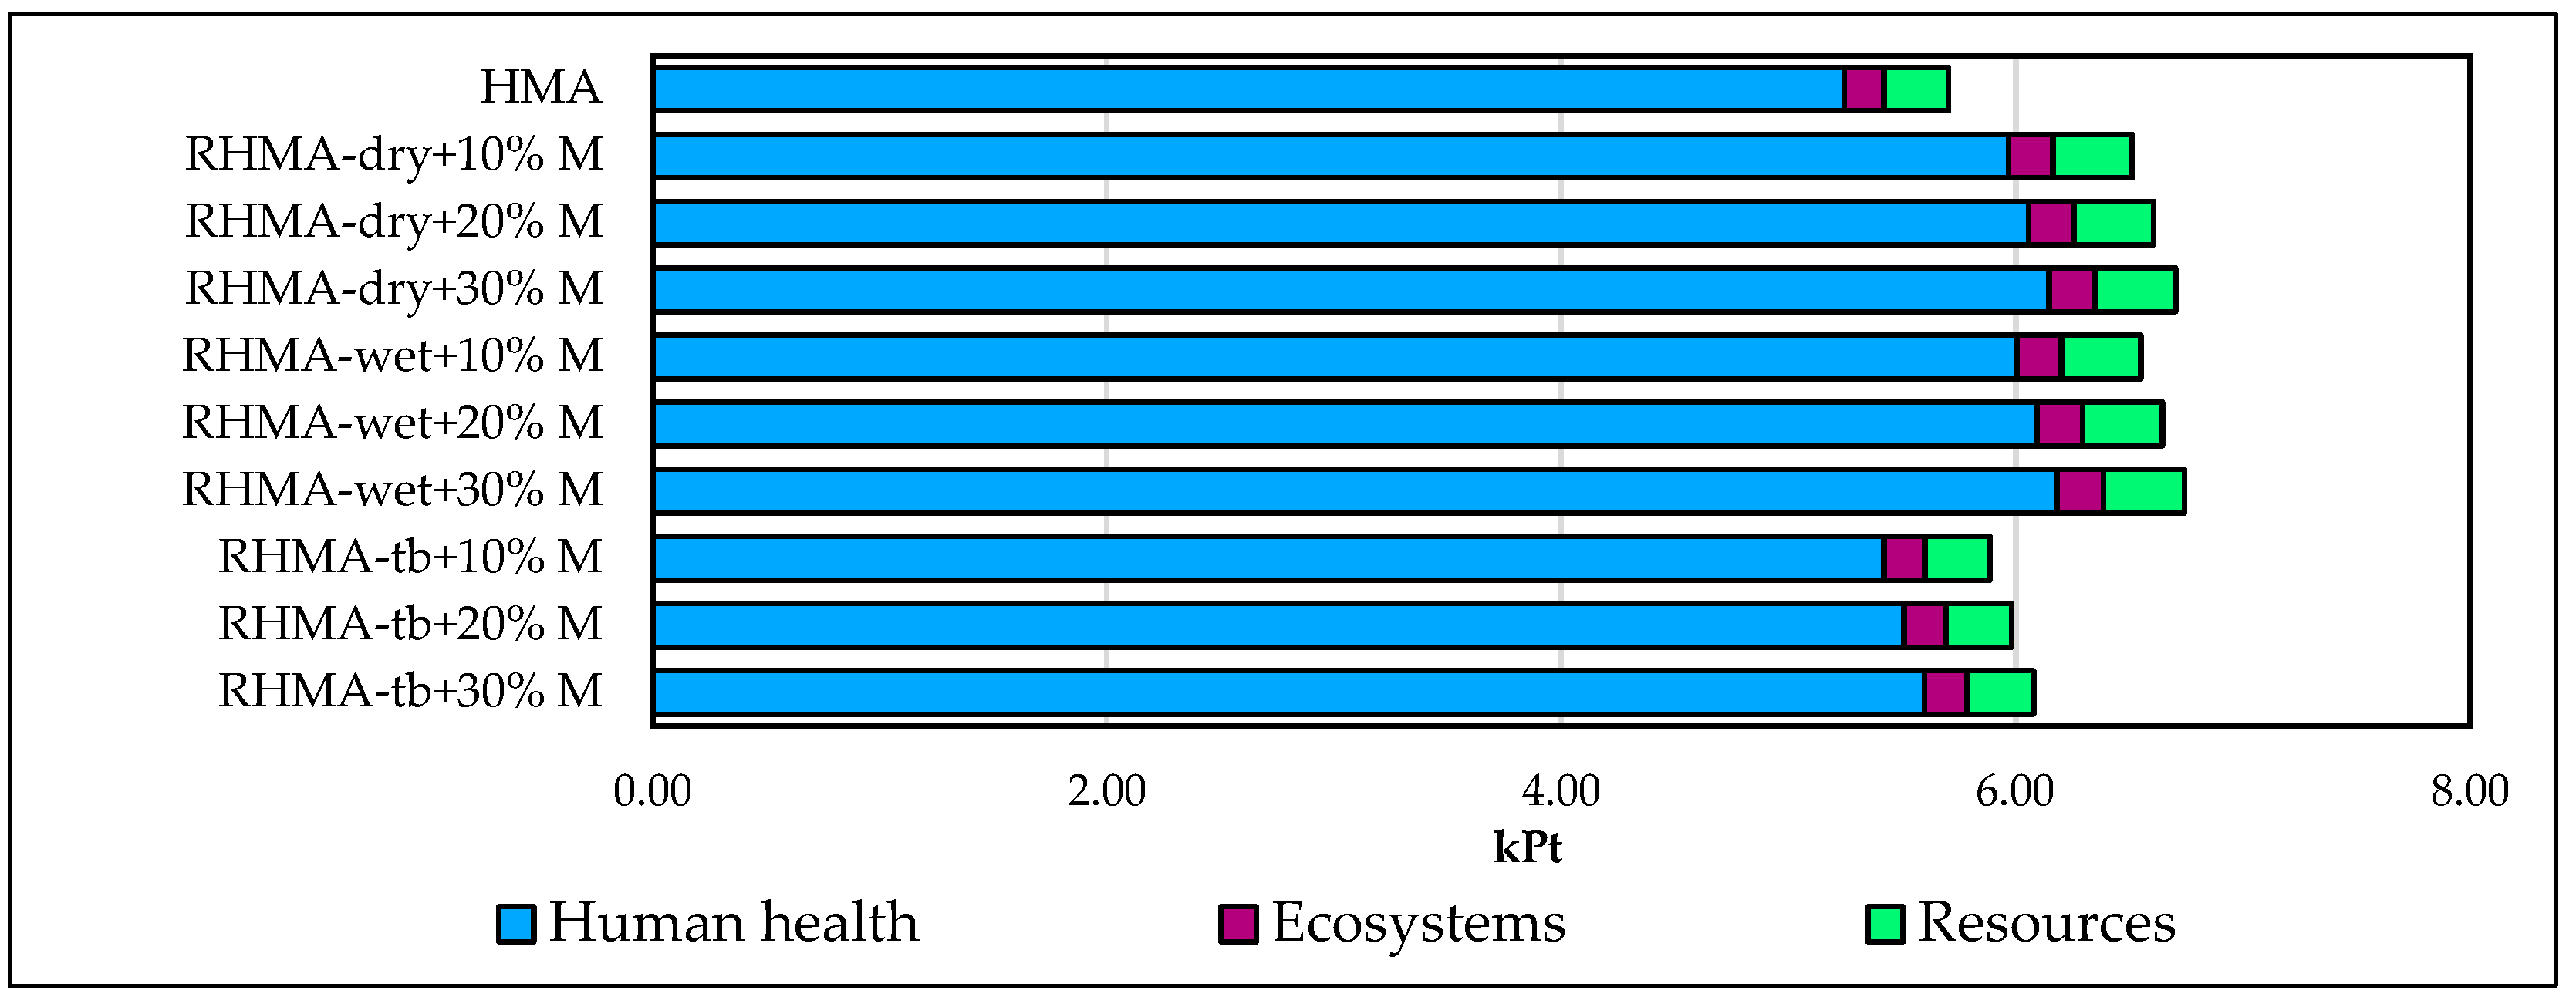
5.3.2. Result of Impact Assessment
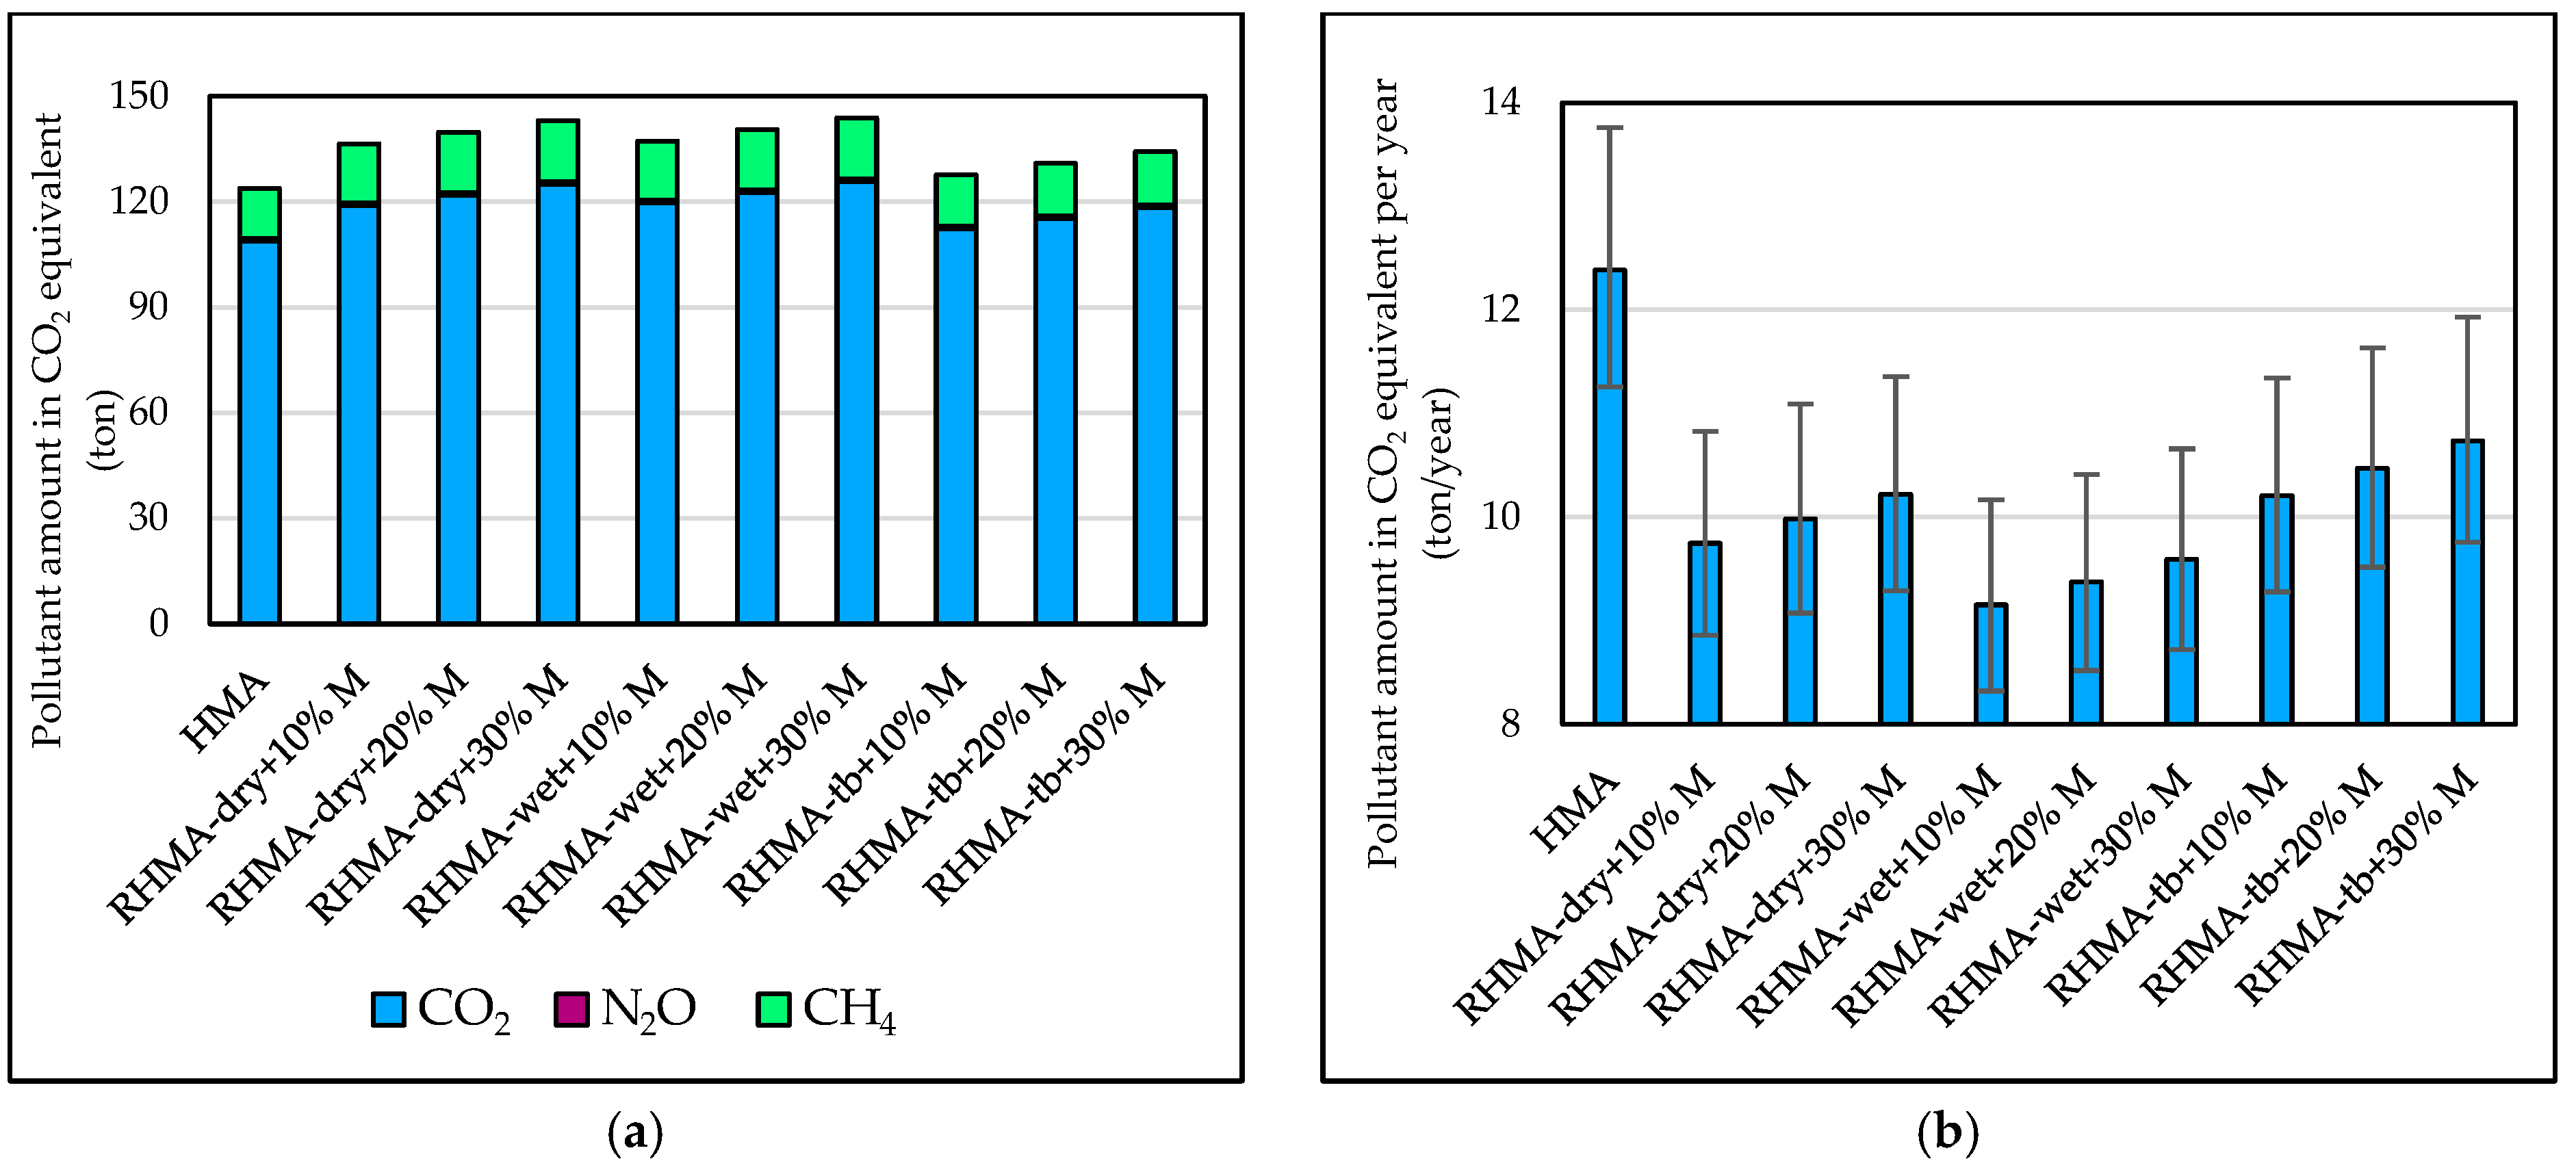
5.3.3. Emission
5.4. Multi-Factor Ranking
- Scenario 1: Equal weight for the three categories
- Scenario 2: 60% performance, 20% economic, and 20% environmental impact
- Scenario 3: 40% performance, 40% economic, and 20% environmental impact
- Scenario 4: 40% performance, 20% economic, and 40% environmental impact
6. Conclusions
- Performance Scores: RHMA-tb, RHMA-wet, and RHMA-dry samples scored 100, 96.7, and 92.2, respectively, compared to HMA’s score of 73.3, indicating superior performance in cracking, rutting, stripping, and moisture sensitivity.
- Production Costs: RHMA-tb+10%M mix was the most suitable option, with only a 5% higher cost than producing 1000 tons of HMA mix. The cost rose by approximately 1% for every 10% increase in machine usage time. Rubberized asphalt mixes from dry and wet processes were the most expensive, incurring approximately 13% higher costs, considering a 30% increase in machine usage time.
- Economic Viability: Using the EUAC approach, RHMA-wet was identified as the most economically viable due to its superior long-term performance and lifespan. RHMA-wet+10%M achieved a score of 100 (21% higher than HMA), followed by other rubberized asphalt mixes with scores of around 96. A 10% increase in machine usage time resulted in a 1% decrease in the mix’s score. The confidence intervals for lifespan performance were calculated at ±10% and ±5%.
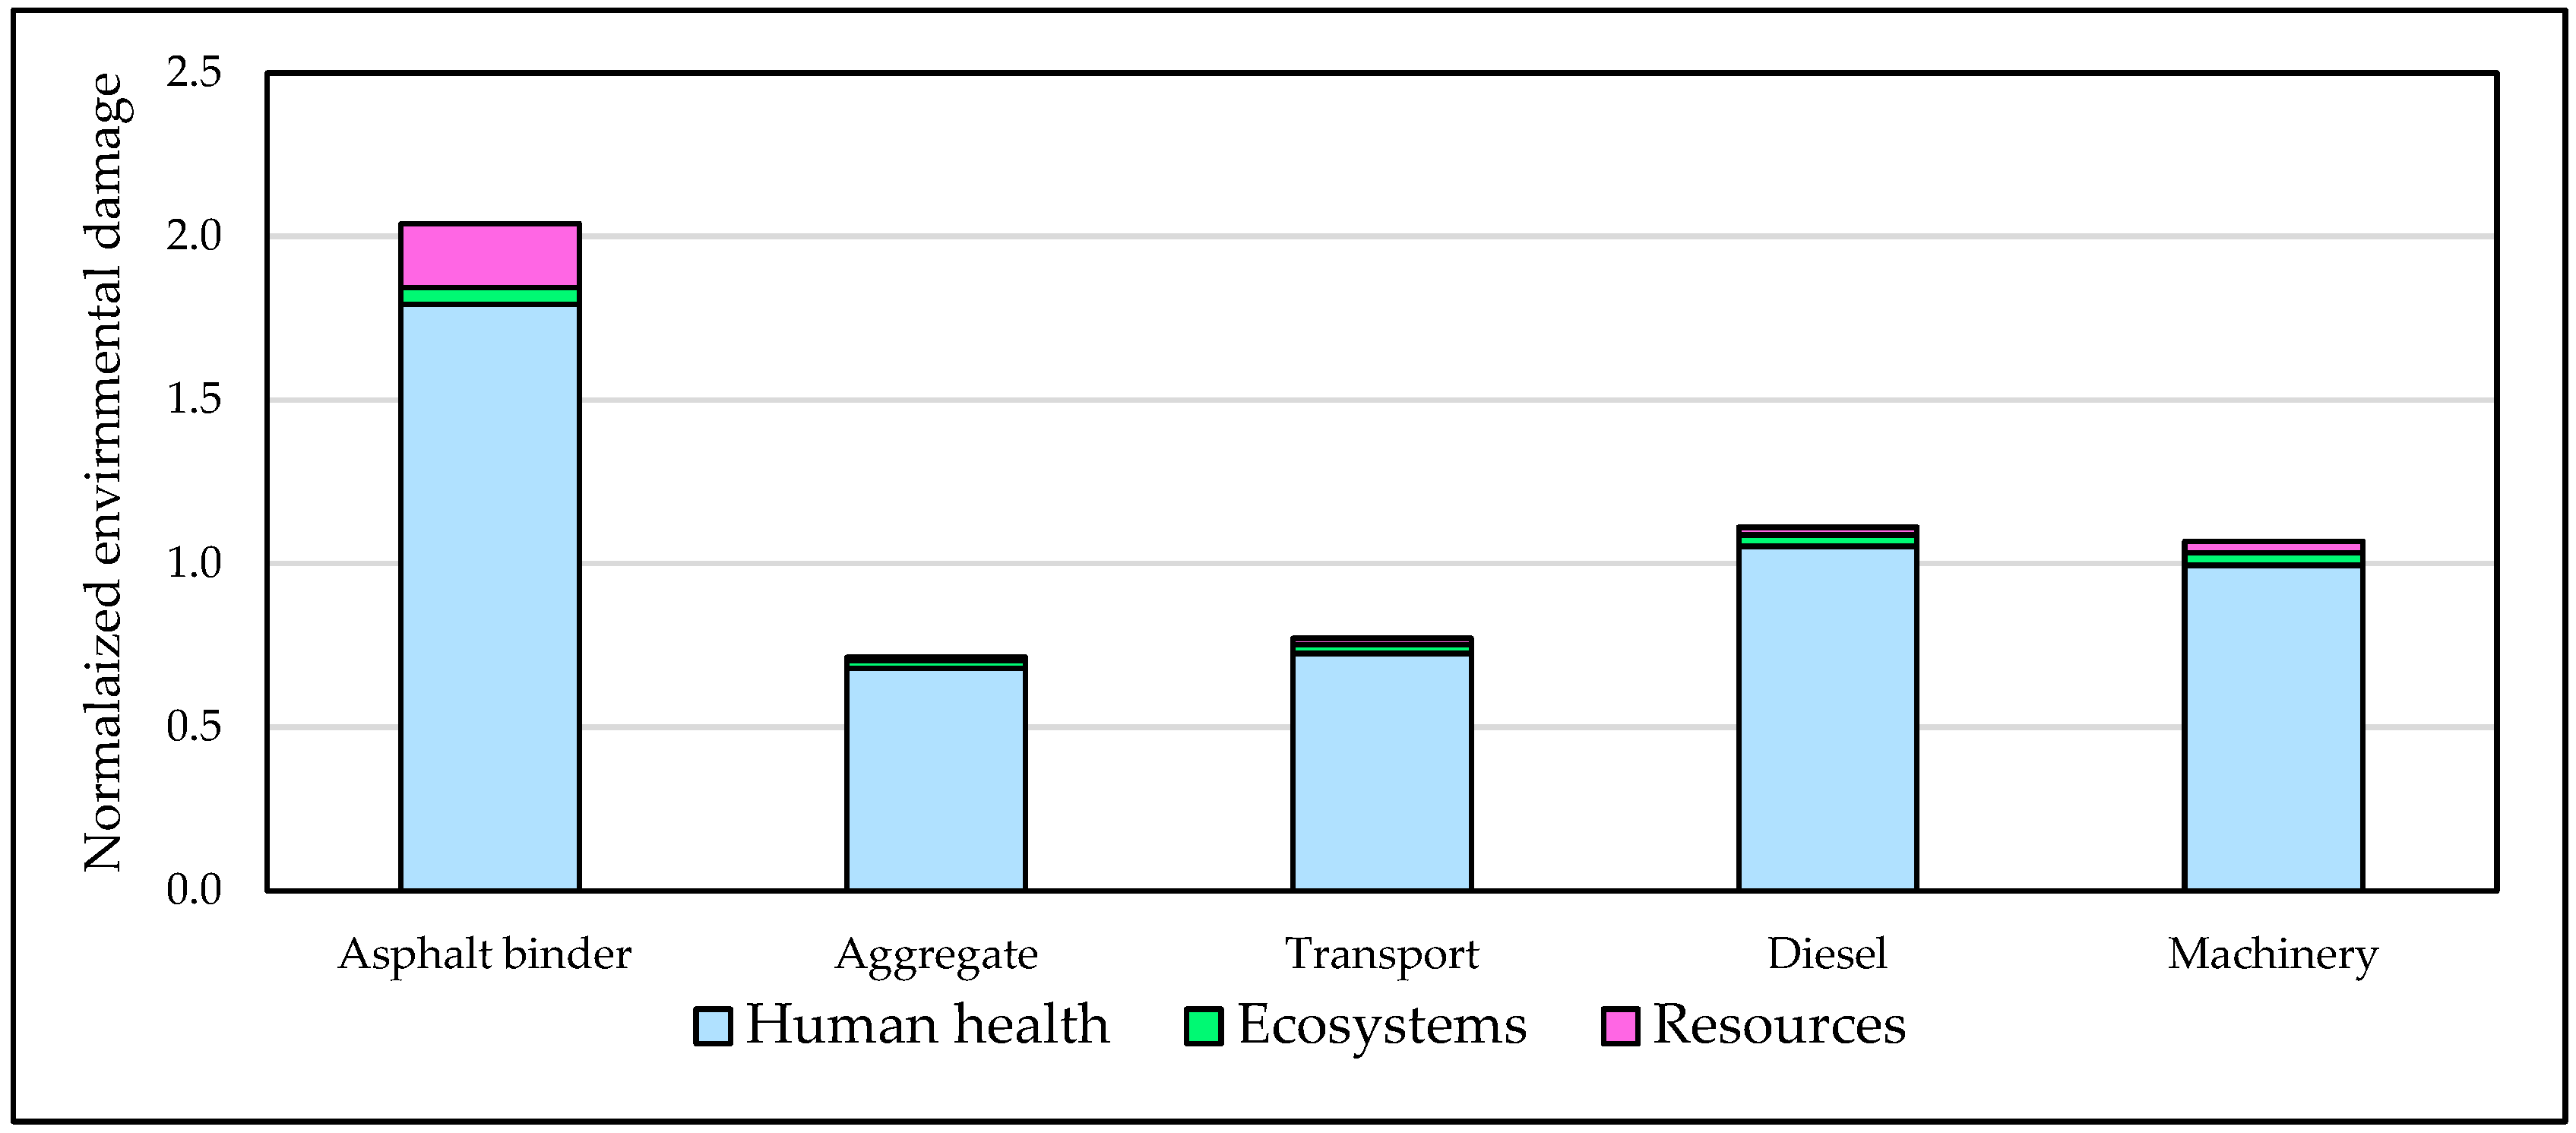
- Environmental Impacts: The environmental assessments began with the characterization phase, examining 23 impact categories. Wet- and dry-process mixes showed the highest impacts (normalized values 94–97), RHMA-tb had slightly lower impacts (~90), and HMA had the lowest impact (~88). The higher mixing temperatures and binder content in rubberized mixes led to greater environmental effects.
- Impact Assessment: The endpoint method categorized the results into human health, ecosystems, and resources, showing consistent patterns and rankings with the characterization phase.
- GHG Emissions: Considering the expected lifespan for each of the mixtures, HMA production generated 12.4 tons of CO2 equivalents per 1000 tons per year of its lifespan. In comparison, RHMA-wet, RHMA-dry, and RHMA-tb produced 9.2, 9.7, and 10.2 tons per year of their lifespans, respectively. The emissions increased by approximately 0.2 tons of CO2 equivalents annually for every 10% increase in machine usage time.
- Ranking: The ranking of asphalt mixtures in various scenarios showed that rubberized asphalt prepared with asphalt rubber binder took first place due to its high scores in most scenarios. The rubberized asphalt mixture prepared with the terminal blend binder also received a high score in scenarios where the weight of mixture performance score was significant.
7. Limitations and Recommendations
Author Contributions
Funding
Data Availability Statement
Conflicts of Interest
Appendix A

| Code | Description | Unit | Unit Price (X) | Quantity | Total Price (X) |
|---|---|---|---|---|---|
| 150605 | Preparation and execution of asphalt concrete using crushed river materials (for topeka layer), graded from 0 to 19 mm, per 1 cm thickness. | m2 | 2.085 × 10⁻⁵ | 42.55 | 8.872 × 10⁻⁴ |
| 150702 | Additional cost to 150605 when mountain aggregates are used instead of river materials. | m2 | 4.664 × 10⁻⁷ | 42.55 | 1.985 × 10⁻⁵ |
| 150801 | Additional cost for the excess amount of asphalt binder compared to the values stated in this source, per square meter of asphalt, for each centimeter of asphalt thickness. | m2 | 1.334 × 10⁻⁶ | 0.46 | 6.070 × 10⁻⁷ |
| 200516 | Transport of aggregate from the mine to the asphalt production site. | m3∙km | 1.847 × 10⁻⁶ | 24.68 | 4.559 × 10⁻⁵ |
| 200517 | Transport of asphalt mixture from the batching plant to the implementation site. | m3∙km | 2.220 × 10⁻⁶ | 16.60 | 3.685 × 10⁻⁵ |
| 200607 | Transport of asphalt binder with a tanker truck. | ton∙km | 6.903 × 10⁻⁷ | 14.31 | 9.879 × 10⁻⁶ |
| Total | 1.000 × 10⁻³ | ||||
| Code | Description | Unit | Unit Price (X) | +10%M | +20%M | +30%M | |||
|---|---|---|---|---|---|---|---|---|---|
| Quantity | Total Price (X) | Quantity | Total Price (X) | Quantity | Total Price (X) | ||||
| 150605 | Preparation and execution of asphalt concrete using crushed river materials (for topeka layer), graded from 0 to 19 mm, per 1 cm thickness. | m2 | 2.085 × 10⁻⁵ | 42.55 | 8.872 × 10⁻⁴ | 42.55 | 8.872 × 10⁻⁴ | 42.55 | 8.872 × 10⁻⁴ |
| 150702 | Additional cost to 150605 when mountain aggregates are used instead of river materials. | m2 | 4.664 × 10⁻⁷ | 42.55 | 1.985 × 10⁻⁵ | 42.55 | 1.985 × 10⁻⁵ | 42.55 | 1.985 × 10⁻⁵ |
| * 151210 | Additional cost for a 10% increase in machine usage time. | m2 | 2.383 × 10⁻⁷ | 42.55 | 1.014 × 10⁻⁵ | - | - | - | - |
| * 151220 | Additional cost for a 20% increase in machine usage time. | m3∙km | 4.766 × 10⁻⁷ | - | - | 42.55 | 2.028 × 10⁻⁵ | - | - |
| * 151230 | Additional cost for a 30% increase in machine usage time. | m3∙km | 7.150 × 10⁻⁷ | - | - | - | - | 42.55 | 3.042 × 10⁻⁵ |
| * 151201 | Additional cost for using crumb rubber in the asphalt mix using the dry method. | ton∙km | 1.852 × 10⁻⁶ | 42.55 | 7.881 × 10⁻⁵ | 42.55 | 7.881 × 10⁻⁵ | 42.55 | 7.881 × 10⁻⁵ |
| 150801 | Additional cost for the excess amount of asphalt binder compared to the values stated in this source, per square meter of asphalt, for each centimeter of asphalt thickness. | m2 | 1.334 × 10⁻⁶ | 4.45 | 5.93 × 10⁻⁶ | 4.45 | 5.936 × 10⁻⁶ | 4.45 | 5.936 × 10⁻⁶ |
| 200516 | Transport of aggregate from the mine to the asphalt production site. | m3∙km | 1.847 × 10⁻⁶ | 23.87 | 4.410 × 10⁻⁵ | 23.87 | 4.410 × 10⁻⁵ | 23.87 | 4.410 × 10⁻⁵ |
| 200517 | Transport of asphalt mixture from the batching plant to the implementation site. | m3∙km | 2.220 × 10⁻⁶ | 16.60 | 3.685 × 10⁻⁵ | 16.60 | 3.685 × 10⁻⁵ | 16.60 | 3.685 × 10⁻⁵ |
| 200606 | Transportation of asphalt binder using a double-walled tanker. | ton∙km | 1.082 × 10⁻⁶ | 18.90 | 2.045 × 10⁻⁵ | 18.90 | 2.045 × 10⁻⁵ | 18.90 | 2.045 × 10⁻⁵ |
| * 200810 | Transportation of crumb rubber. | ton∙km | 1.399 × 10⁻⁶ | 2.10 | 2.939 × 10⁻⁶ | 2.10 | 2.939 × 10⁻⁶ | 2.10 | 2.939 × 10⁻⁶ |
| Total | 1.106 × 10⁻³ | 1.116 × 10⁻³ | 1.127 × 10⁻³ | ||||||
| Code | Description | Unit | Unit Price (X) | +10%M | +20%M | +30%M | |||
|---|---|---|---|---|---|---|---|---|---|
| Quantity | Total Price (X) | Quantity | Total Price (X) | Quantity | Total Price (X) | ||||
| 150605 | Preparation and execution of asphalt concrete using crushed river materials (for topeka layer), graded from 0 to 19 mm, per 1 cm thickness. | m2 | 2.085 × 10⁻⁵ | 42.55 | 8.872 × 10⁻⁴ | 42.55 | 8.872 × 10⁻⁴ | 42.55 | 8.872 × 10⁻⁴ |
| 150702 | Additional cost to 150605 when mountain aggregates are used instead of river materials. | m2 | 4.664 × 10⁻⁷ | 42.55 | 1.985 × 10⁻⁵ | 42.55 | 1.985 × 10⁻⁵ | 42.55 | 1.985 × 10⁻⁵ |
| * 151210 | Additional cost for a 10% increase in machine usage time. | m2 | 2.383 × 10⁻⁷ | 42.55 | 1.014 × 10⁻⁵ | - | - | - | - |
| * 151220 | Additional cost for a 20% increase in machine usage time. | m3∙km | 4.766 × 10⁻⁷ | - | - | 42.55 | 2.028 × 10⁻⁵ | - | - |
| * 151230 | Additional cost for a 30% increase in machine usage time. | m3∙km | 7.150 × 10⁻⁷ | - | - | - | - | 42.55 | 3.042 × 10⁻⁵ |
| * 151202 | Additional cost for using crumb rubber in the asphalt mix using the wet method. | m2 | 1.856 × 10⁻⁶ | 42.55 | 7.897 × 10⁻⁵ | 42.55 | 7.897 × 10⁻⁵ | 42.55 | 7.897 × 10⁻⁵ |
| 150801 | Additional cost for the excess amount of asphalt binder compared to the values stated in this source, per square meter of asphalt, for each centimeter of asphalt thickness. | m2 | 1.334 × 10⁻⁶ | 4.45 | 5.936 × 10⁻⁶ | 4.45 | 5.936 × 10⁻⁶ | 4.45 | 5.936 × 10⁻⁶ |
| 200516 | Transport of aggregate from the mine to the asphalt production site. | m3∙km | 1.847 × 10⁻⁶ | 23.87 | 4.410 × 10⁻⁵ | 23.87 | 4.410 × 10⁻⁵ | 23.87 | 4.410 × 10⁻⁵ |
| 200517 | Transport of asphalt mixture from the batching plant to the implementation site. | m3∙km | 2.220 × 10⁻⁶ | 16.60 | 3.685 × 10⁻⁵ | 16.60 | 3.685 × 10⁻⁵ | 16.60 | 3.685 × 10⁻⁵ |
| 200606 | Transportation of asphalt binder using a double-walled tanker. | ton∙km | 1.082 × 10⁻⁶ | 18.90 | 2.045 × 10⁻⁵ | 18.90 | 2.045 × 10⁻⁵ | 18.90 | 2.045 × 10⁻⁵ |
| * 200810 | Transportation of crumb rubber. | ton∙km | 1.399 × 10⁻⁶ | 2.10 | 2.939 × 10⁻⁶ | 2.10 | 2.939 × 10⁻⁶ | 2.10 | 2.939 × 10⁻⁶ |
| Total | 1.106 × 10⁻³ | 1.117 × 10⁻³ | 1.127 × 10⁻³ | ||||||
| Code | Description | Unit | Unit Price (X) | +10%M | +20%M | +30%M | |||
|---|---|---|---|---|---|---|---|---|---|
| Quantity | Total Price (X) | Quantity | Total Price (X) | Quantity | Total Price (X) | ||||
| 150605 | Preparation and execution of asphalt concrete using crushed river materials (for topeka layer), graded from 0 to 19 mm, per 1 cm thickness. | m2 | 2.085 × 10⁻⁵ | 42.55 | 8.872 × 10⁻⁴ | 42.55 | 8.872 × 10⁻⁴ | 42.55 | 8.872 × 10⁻⁴ |
| 150702 | Additional cost to 150605 when mountain aggregates are used instead of river materials. | m2 | 4.664 × 10⁻⁷ | 42.55 | 1.985 × 10⁻⁵ | 42.55 | 1.985 × 10⁻⁵ | 42.55 | 1.985 × 10⁻⁵ |
| * 151210 | Additional cost for a 10% increase in machine usage time | m2 | 2.383 × 10⁻⁷ | 42.55 | 1.014 × 10⁻⁵ | - | - | - | - |
| * 151220 | Additional cost for a 20% increase in machine usage time | m3∙km | 4.766 × 10⁻⁷ | - | - | 42.55 | 2.028 × 10⁻⁵ | - | - |
| * 151230 | Additional cost for a 30% increase in machine usage time | m3∙km | 7.150 × 10⁻⁷ | - | - | - | - | 42.55 | 3.042 × 10⁻⁵ |
| * 151203 | Additional cost for using crumb rubber in the asphalt mix using the terminal blend method. | m2 | 7.174 × 10⁻⁷ | 42.55 | 3.053 × 10⁻⁵ | 42.55 | 3.053 × 10⁻⁵ | 42.55 | 3.053 × 10⁻⁵ |
| 150801 | Additional cost for the excess amount of asphalt binder compared to the values stated in this source, per square meter of asphalt, for each centimeter of asphalt thickness. | m2 | 1.334 × 10⁻⁶ | 0.46 | 6.070 × 10⁻⁷ | 0.46 | 6.070 × 10⁻⁷ | 0.46 | 6.070 × 10⁻⁷ |
| 200516 | Transport of aggregate from the mine to the asphalt production site. | m3∙km | 1.847 × 10⁻⁶ | 24.54 | 4.534 × 10⁻⁵ | 24.54 | 4.534 × 10⁻⁵ | 24.54 | 4.534 × 10⁻⁵ |
| 200517 | Transport of asphalt mixture from the batching plant to the implementation site. | m3∙km | 2.220 × 10⁻⁶ | 16.60 | 3.685 × 10⁻⁵ | 16.60 | 3.685 × 10⁻⁵ | 16.60 | 3.685 × 10⁻⁵ |
| 200606 | Transportation of asphalt binder using a double-walled tanker. | ton∙km | 1.082 × 10⁻⁶ | 14.31 | 1.549 × 10⁻⁵ | 14.31 | 1.549 × 10⁻⁵ | 14.31 | 1.549 × 10⁻⁵ |
| * 200810 | Transportation of crumb rubber. | ton∙km | 1.399 × 10⁻⁶ | 0.27 | 3.708 × 10⁻⁷ | 0.27 | 3.708 × 10⁻⁷ | 0.27 | 3.708 × 10⁻⁷ |
| Total | 1.046 × 10⁻³ | 1.057 × 10⁻³ | 1.067 × 10⁻³ | ||||||
References
- Ghabchi, R.; Arshadi, A.; Zaman, M.; March, F. Technical Challenges of Utilizing Ground Tire Rubber in Asphalt Pavements in the United States. Materials 2021, 14, 4482. [Google Scholar] [CrossRef] [PubMed]
- Li, J.; Santos, J.; Vargas-Farias, A.; Castro-Fresno, D.; Xiao, F. Prospective LCA of valorizing end-of-life tires in asphalt mixtures with emerging pretreatment technologies of crumb rubber. Resour. Conserv. Recycl. 2024, 210, 107828. [Google Scholar] [CrossRef]
- Praticò, F.G.; Giunta, M.; Mistretta, M.; Gulotta, T.M. Energy and Environmental Life Cycle Assessment of Sustainable Pavement Materials and Technologies for Urban Roads. Sustainability 2020, 12, 704. [Google Scholar] [CrossRef]
- Siverio Lima, M.S.; Makoundou, C.; Sangiorgi, C.; Gschösser, F. Life Cycle Assessment of Innovative Asphalt Mixtures Made with Crumb Rubber for Impact-Absorbing Pavements. Sustainability 2022, 14, 14798. [Google Scholar] [CrossRef]
- Nascimento, F.; Gouveia, B.; Dias, F.; Ribeiro, F.; Silva, M.A. A method to select a road pavement structure with life cycle assessment. J. Clean. Prod. 2020, 271, 122210. [Google Scholar] [CrossRef]
- Xie, Z.; Shen, J. Performance properties of rubberized stone matrix asphalt mixtures produced through different processes. Constr. Build. Mater. 2016, 104, 230–234. [Google Scholar] [CrossRef]
- Chavez, F.; Marcobal, J.; Gallego, J. Laboratory evaluation of the mechanical properties of asphalt mixtures with rubber incorporated by the wet, dry, and semi-wet process. Constr. Build. Mater. 2019, 205, 164–174. [Google Scholar] [CrossRef]
- Bilema, M.; Yuen, C.W.; Alharthai, M.; Al-Saffar, Z.H.; Al-Sabaeei, A.; Yusoff, N.I.M. A Review of Rubberised Asphalt for Flexible Pavement Applications: Production, Content, Performance, Motivations and Future Directions. Sustainability 2023, 15, 14481. [Google Scholar] [CrossRef]
- Picado-Santos, L.G.; Capitão, S.D.; Neves, J. Crumb rubber asphalt mixtures: A literature review. Constr. Build. Mater. 2020, 247, 118577. [Google Scholar] [CrossRef]
- Harvey, J.; Meijer, J.; Ozer, H.; Al-Qadi, I.L.; Saboori, A. Pavement Life-Cycle Assessment Framework; Federal Highway Administration (FHWA): Washington, DC, USA, 2016. [Google Scholar]
- Wang, H.; Liu, X.; Apostolidis, P.; Scarpas, T. Review of warm mix rubberized asphalt concrete: Towards a sustainable paving technology. J. Clean. Prod. 2018, 177, 302–314. [Google Scholar] [CrossRef]
- Hassan, N.A.; Airey, G.; Jaya, R.P.; Mashros, N.; Aziz, M.M.A. A Review of Crumb Rubber Modification in Dry Mixed Rubberised Asphalt Mixtures. J. Teknol. 2014, 70, 127–134. [Google Scholar] [CrossRef]
- Caltrans. Standard Plans, Standard Specifications, and Contract Item Codes; California Department of Transportation: Sacramento, CA, USA, 2023. [Google Scholar]
- Gibson, N.; Qi, X.; Shenoy, A.; Al-Khateeb, G.; Kutay, M.E.; Andriescu, A.; Stuart, K.; Youtcheff, J.; Harman, T. Performance Testing for Superpave and Structural Validation; Federal Highway Administration Research and Technology; Federal Highway Administration: Washington, DC, USA, 2012. [Google Scholar]
- Asphalt Institute. Asphalt Mix Design Method (MS-2); Asphalt Institute: Lexington, KY, USA, 2014. [Google Scholar]
- West, R.C.; Watson, D.E.; Turner, P.A.; Casola, J.R. Mixing and Compaction Temperatures of Asphalt Binders in Hot-Mix Asphalt; National Cooperative Highway Research Program Report 648; Transportation Research Board: Washington, DC, USA, 2010. [Google Scholar] [CrossRef]
- Vandewalle, D.; Antunes, V.; Neves, J.; Freire, A.C. Assessment of Eco-Friendly Pavement Construction and Maintenance Using Multi-Recycled RAP Mixtures. Recycling 2020, 5, 17. [Google Scholar] [CrossRef]
- Safaeldeen, G.I.; Al-Mansob, R.A.; Al-Sabaeei, A.M.; Yusoff, N.I.M.; Ismail, A.; Tey, W.Y.; Azahar, W.N.A.W.; Ibrahim, A.N.H.; Jassam, T.M. Investigating the Mechanical Properties and Durability of Asphalt Mixture Modified with Epoxidized Natural Rubber (ENR) under Short and Long-Term Aging Conditions. Polymers 2022, 14, 4726. [Google Scholar] [CrossRef] [PubMed]
- Ghafari, S.; Moghadas Nejad, F. Crack propagation characterization of crumb rubber modified asphalt concrete using J-R curves. Theor. Appl. Fract. Mech. 2022, 117, 103156. [Google Scholar] [CrossRef]
- Jin, D.; Boateng, K.A.; Ge, D.; Che, T.; Yin, L.; Harrall, W.; You, Z. A case study of the comparison between rubberized and polymer modified asphalt on heavy traffic pavement in wet and freeze environment. Case Stud. Constr. Mater. 2023, 18, e01847. [Google Scholar] [CrossRef]
- Mamlouk, M.; Mobasher, B. Cracking Resistance of Asphalt Rubber Mix Versus Hot-Mix Asphalt. Int. J. Road Mater. Pavement Des. V 2004, 5, 435–452. [Google Scholar] [CrossRef]
- Yan, C.; Yuan, L.; Yu, X.; Ji, S.; Zhou, Z. Characterizing the fatigue resistance of multiple modified asphalts using time sweep test, LAS test and elastic recovery test. Constr. Build. Mater. 2022, 322, 125806. [Google Scholar] [CrossRef]
- Hu, J.; Zhang, L.; Zhang, X.; Guo, Y.; Yu, X. Comparative evaluation of moisture susceptibility of modified/foamed asphalt binders combined with different types of aggregates using surface free energy approach. Constr. Build. Mater. 2020, 256, 119429. [Google Scholar] [CrossRef]
- Milad, A.; Babalghaith, A.M.; Al-Sabaeei, A.M.; Dulaimi, A.; Ali, A.; Reddy, S.S.; Bilema, M.; Yusoff, N.I.M. A Comparative Review of Hot and Warm Mix Asphalt Technologies from Environmental and Economic Perspectives: Towards a Sustainable Asphalt Pavement. Int. J. Environ. Res. Public Health 2022, 19, 14863. [Google Scholar] [CrossRef] [PubMed]
- Rath, P. State of Knowledge Report on Rubber Modified Asphalt; U.S. Tire Manufacturers Association: Washington, DC, USA, 2021. [Google Scholar]
- Newnan, D.G.; Eschenbach, T.G.; Lavelle, J.P. Engineering Economic Analysis; Oxford University Press: Oxford, UK, 2004. [Google Scholar]
- Meijer, E. Making LCA Results Count. Available online: https://pre-sustainability.com/articles/consider-your-audience-when-doing-lca/ (accessed on 12 December 2024).
- Vega, A.D.L.; Santos, J.; Martinez-Arguelles, G. Life cycle assessment of hot mix asphalt with recycled concrete aggregates for road pavements construction. Int. J. Pavement Eng. 2022, 23, 923–936. [Google Scholar] [CrossRef]
- Ma, F.; Dong, W.; Fu, Z.; Wang, R.; Huang, Y.; Liu, J. Life cycle assessment of greenhouse gas emissions from asphalt pavement maintenance: A case study in China. J. Clean. Prod. 2021, 288, 125595. [Google Scholar] [CrossRef]
- United States Environmental Protection Agency. Greenhouse Gas Equivalencies Calculator (Online Calculator). Available online: https://www.epa.gov/energy/greenhouse-gas-equivalencies-calculator (accessed on 12 December 2024).
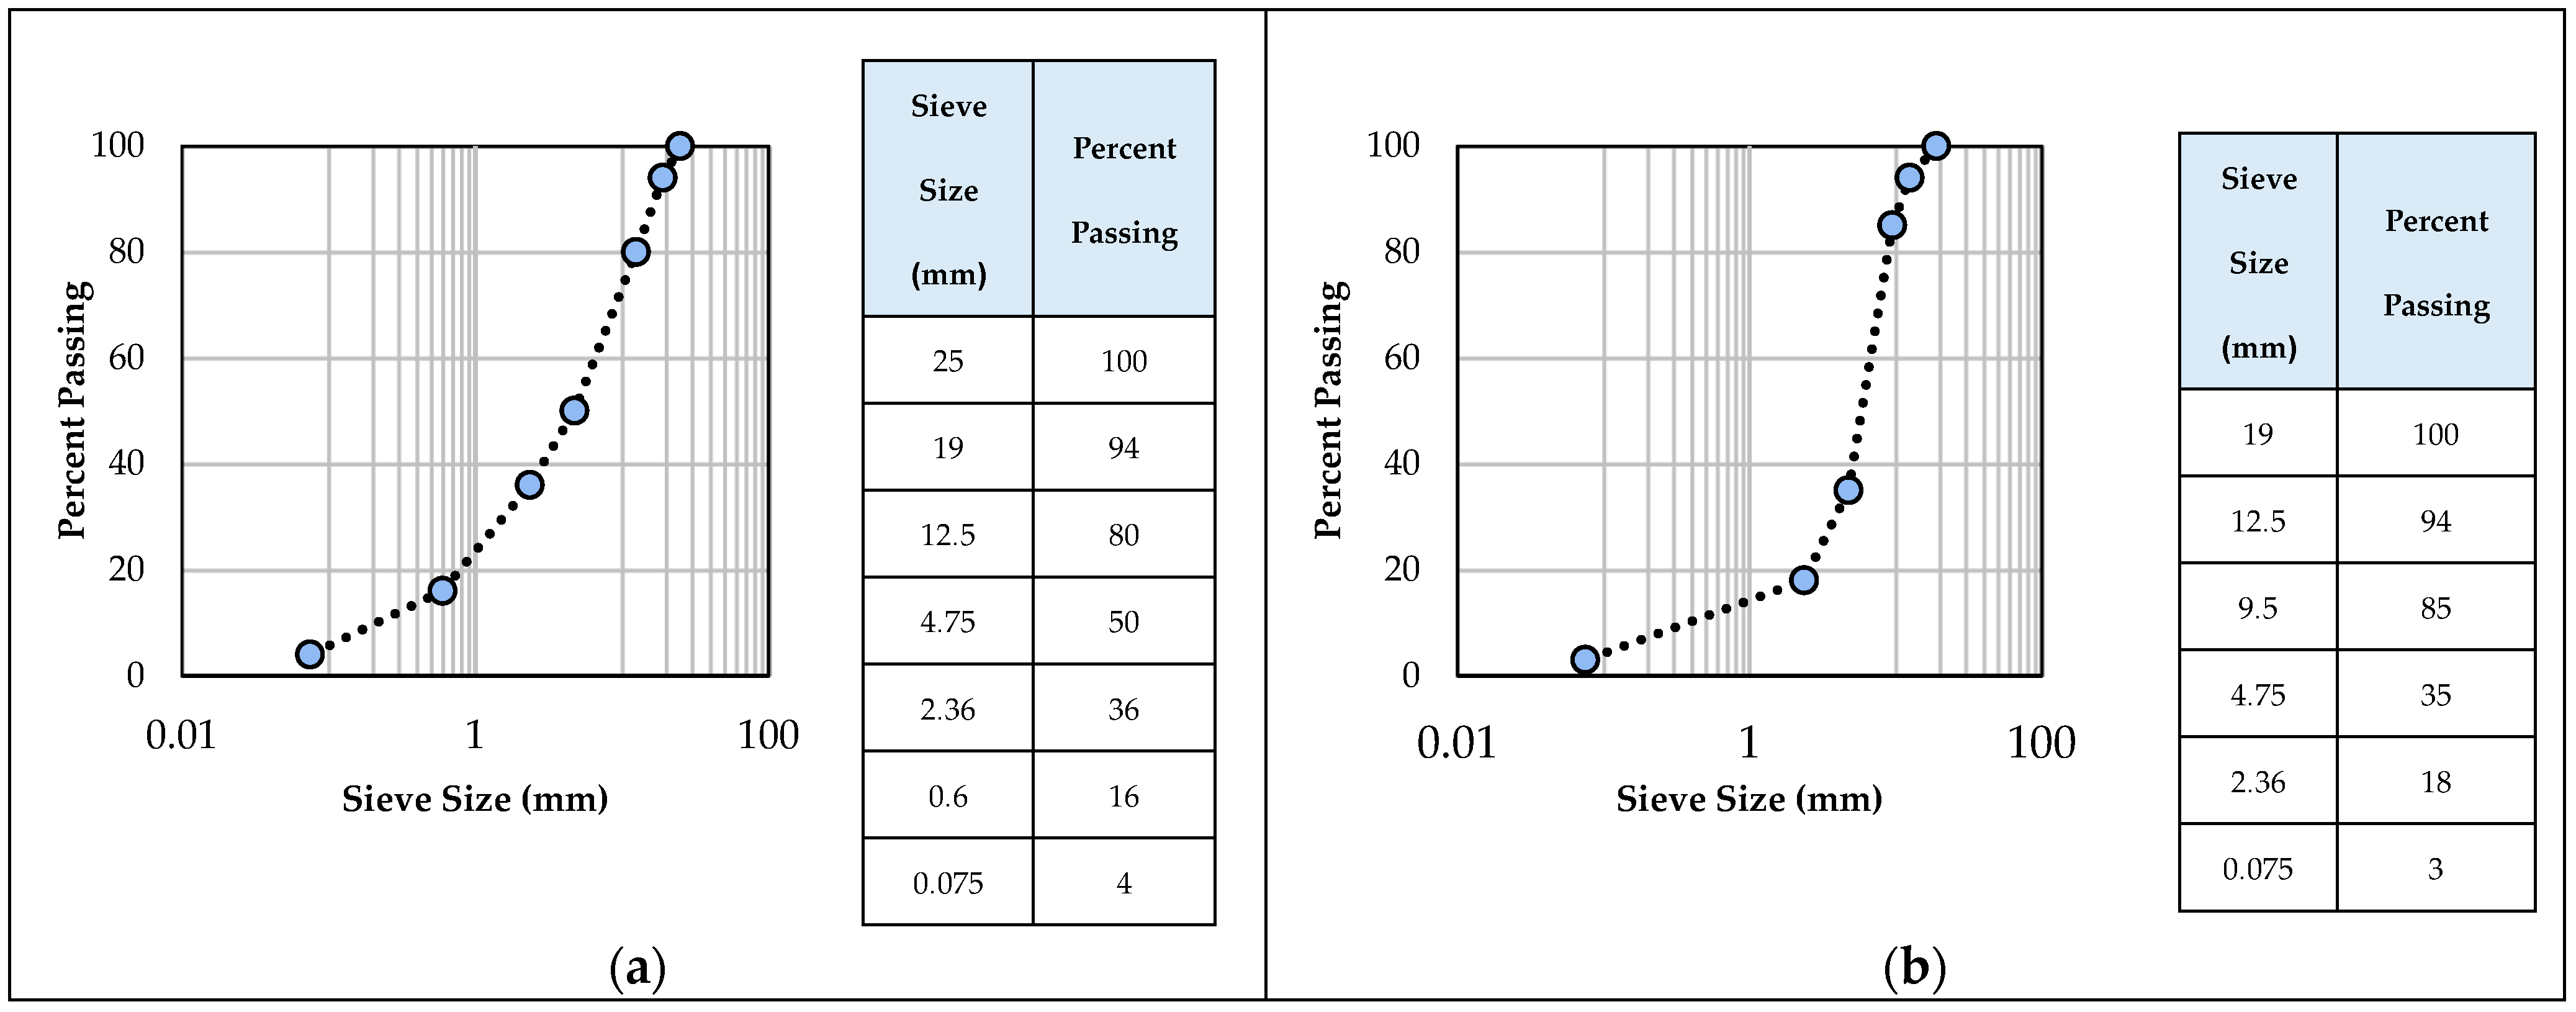


| Mixture Title | Gravel (kg) | Sand (kg) | Filler (kg) | Asphalt Binder (kg) | Crumb Rubber (kg) | ||
|---|---|---|---|---|---|---|---|
| Quantity | Description | Quantity | Description | ||||
| HMA | 473.5 | 435.62 | 37.88 | 53.00 | 5.3% by weight of the mixture | - | - |
| RHMA-dry | 595.4 | 293.12 | 27.48 | 70.00 | 7% by weight of the mixture | 14 | 20% by weight of the binder |
| RHMA-wet | 595.4 | 293.12 | 27.48 | 70.00 | 7% by weight of the mixture | 14 | 20% by weight of the binder |
| RHMA-tb | 473.5 | 435.62 | 37.88 | 53.00 | 5.3% by weight of the mixture | 5.3 | 10% by weight of the binder |
| Mixture Type | Cracking | Fatigue | Rutting | Moisture Sensitivity | Lifetime | Sum | Normalized | ||||
|---|---|---|---|---|---|---|---|---|---|---|---|
| Score | Score out of 25 | Score | Score out of 25 | Score | Score out of 25 | Score | Score out of 25 | Score | |||
| HMA | 1 | 20.8 | 1.0 | 12.5 | 1 | 16.7 | 1 | 21.7 | 1 | 71.7 | 73.3 |
| RHMA-dry | 1.2 | 25.0 | 1.7 | 21.3 | 1.2 | 20.0 | 1.1 | 23.9 | 1.4 | 90.2 | 92.2 |
| RHMA-wet | 1.2 | 25.0 | 1.7 | 21.3 | 1.4 | 23.3 | 1.15 | 25.0 | 1.5 | 94.6 | 96.7 |
| RHMA-tb | 1.2 | 25.0 | 2.0 | 25.0 | 1.5 | 25.0 | 1.05 | 22.8 | 1.25 | 97.8 | 100.0 |
| Mixture Title | Production Cost (X) | Equivalent Uniform Annual Cost (X) | Score | ||||
|---|---|---|---|---|---|---|---|
| −10% | −5% | Average Lifetime | 5% | 10% | |||
| HMA | 1.000 | 0.174 | 0.168 | 0.163 | 0.158 | 0.154 | 89.4 |
| RHMA-dry+10% M * | 1.106 | 0.158 | 0.154 | 0.150 | 0.147 | 0.144 | 96.9 |
| RHMA-dry+20% M | 1.116 | 0.160 | 0.155 | 0.152 | 0.148 | 0.145 | 96.0 |
| RHMA-dry+30% M | 1.127 | 0.161 | 0.157 | 0.153 | 0.149 | 0.146 | 95.1 |
| RHMA-wet+10% M | 1.106 | 0.153 | 0.149 | 0.145 | 0.142 | 0.140 | 100.0 |
| RHMA-wet+20% M | 1.117 | 0.154 | 0.150 | 0.147 | 0.144 | 0.141 | 99.1 |
| RHMA-wet+30% M | 1.127 | 0.156 | 0.152 | 0.148 | 0.145 | 0.142 | 98.2 |
| RHMA-tb+10% M | 1.046 | 0.159 | 0.154 | 0.150 | 0.147 | 0.143 | 96.8 |
| RHMA-tb+20% M | 1.057 | 0.161 | 0.156 | 0.152 | 0.148 | 0.145 | 95.9 |
| RHMA-tb+30% M | 1.067 | 0.162 | 0.157 | 0.153 | 0.149 | 0.146 | 94.9 |
| Impact Category | HMA | RHMA-dry+10%M | RHMA-dry+20% M | RHMA-dry+30% M | RHMA-wet+10% M | RHMA-wet+20% M | RHMA-wet+30% M | RHMA-tb+10% M | RHMA-tb+20% M | RHMA-tb+30% M |
|---|---|---|---|---|---|---|---|---|---|---|
| Global warming, human health | 85.9 | 94.9 | 97.1 | 99.4 | 95.4 | 97.7 | 100.0 | 88.5 | 90.8 | 93.1 |
| Global warming, terrestrial ecosystems | 85.9 | 94.9 | 97.1 | 99.4 | 95.4 | 97.7 | 100.0 | 88.5 | 90.8 | 93.1 |
| Global warming, freshwater ecosystems | 85.9 | 94.9 | 97.1 | 99.4 | 95.4 | 97.7 | 100.0 | 88.5 | 90.8 | 93.1 |
| Stratospheric ozone depletion | 88.0 | 92.3 | 95.7 | 99.1 | 93.2 | 96.6 | 100.0 | 92.0 | 95.4 | 98.8 |
| Ionizing radiation | 90.8 | 97.3 | 98.5 | 99.7 | 97.6 | 98.8 | 100.0 | 91.9 | 93.1 | 94.3 |
| Ozone formation, human health | 86.3 | 96.2 | 97.6 | 99.0 | 97.2 | 98.6 | 100.0 | 91.3 | 92.7 | 94.1 |
| Fine particulate matter formation | 83.6 | 97.5 | 98.4 | 99.3 | 98.2 | 99.1 | 100.0 | 87.0 | 87.9 | 88.8 |
| Ozone formation, terrestrial ecosystems | 86.2 | 96.2 | 97.6 | 99.0 | 97.2 | 98.6 | 100.0 | 91.1 | 92.5 | 93.9 |
| Terrestrial acidification | 82.0 | 97.9 | 98.7 | 99.5 | 98.4 | 99.2 | 100.0 | 84.4 | 85.2 | 86.0 |
| Freshwater eutrophication | 89.8 | 97.0 | 98.4 | 99.7 | 97.4 | 98.7 | 100.0 | 91.1 | 92.4 | 93.7 |
| Marine eutrophication | 85.2 | 95.8 | 97.7 | 99.5 | 96.3 | 98.2 | 100.0 | 87.3 | 89.1 | 91.0 |
| Terrestrial ecotoxicity | 95.1 | 98.4 | 99.1 | 99.8 | 98.6 | 99.3 | 100.0 | 95.7 | 96.4 | 97.1 |
| Freshwater ecotoxicity | 84.9 | 98.8 | 99.3 | 99.9 | 98.9 | 99.4 | 100.0 | 85.4 | 85.9 | 86.5 |
| Marine ecotoxicity | 85.5 | 98.6 | 99.2 | 99.8 | 98.8 | 99.4 | 100.0 | 86.1 | 86.7 | 87.3 |
| Human carcinogenic toxicity | 90.0 | 94.6 | 97.0 | 99.4 | 95.2 | 97.6 | 100.0 | 92.6 | 95.0 | 97.4 |
| Human non-carcinogenic toxicity | 82.0 | 99.3 | 99.6 | 99.9 | 99.4 | 99.7 | 100.0 | 82.3 | 82.6 | 82.9 |
| Land use | 95.8 | 97.6 | 98.7 | 99.7 | 97.9 | 99.0 | 100.0 | 96.7 | 97.8 | 98.8 |
| Mineral resource scarcity | 91.0 | 94.8 | 97.1 | 99.4 | 95.4 | 97.7 | 100.0 | 93.5 | 95.8 | 98.1 |
| Fossil resource scarcity | 79.5 | 98.0 | 98.9 | 99.8 | 98.3 | 99.1 | 100.0 | 80.5 | 81.4 | 82.3 |
| Water consumption, human health | 100.0 | 80.5 | 80.7 | 80.8 | 80.6 | 80.7 | 80.8 | 99.6 | 99.8 | 99.9 |
| Water consumption, terrestrial ecosystem | 99.7 | 81.1 | 81.3 | 81.6 | 81.2 | 81.4 | 81.6 | 99.5 | 99.8 | 100.0 |
| Water consumption, aquatic ecosystems | 98.2 | 84.7 | 85.5 | 86.2 | 84.9 | 85.6 | 86.4 | 98.6 | 99.3 | 100.0 |
| Mixture Title | Pollutant (kg) | Pollutant in CO2 Equivalent (ton) | Pollutant in CO2 Equivalent Per Year (ton/Year) | Score | ||||||
|---|---|---|---|---|---|---|---|---|---|---|
| CO2 | N2O | CH4 | −10% | −5% | Average Lifetime | 5% | 10% | |||
| HMA | 108,789.9 | 2.7 | 511.1 | 123.8 | 13.8 | 13 | 12.4 | 11.8 | 11.3 | 73.9 |
| RHMA-dry+10% M | 118,849.5 | 2.9 | 601.4 | 136.5 | 10.8 | 10.3 | 9.7 | 9.3 | 8.9 | 93.9 |
| RHMA-dry+20% M | 121,881.7 | 3.0 | 609.9 | 139.8 | 11.1 | 10.5 | 10.0 | 9.5 | 9.1 | 91.7 |
| RHMA-dry+30% M | 124,928.8 | 3.1 | 618.5 | 143.1 | 11.4 | 10.8 | 10.2 | 9.7 | 9.3 | 89.6 |
| RHMA-wet+10% M | 119,610.0 | 2.9 | 603.6 | 137.3 | 10.2 | 9.6 | 9.2 | 8.7 | 8.3 | 100.0 |
| RHMA-wet+20% M | 122,642.3 | 3.0 | 612.1 | 140.6 | 10.4 | 9.9 | 9.4 | 8.9 | 8.5 | 97.7 |
| RHMA-wet+30% M | 125,689.3 | 3.1 | 620.6 | 143.9 | 10.7 | 10.1 | 9.6 | 9.1 | 8.7 | 95.4 |
| RHMA-tb+10% M | 112,232.4 | 2.9 | 521.0 | 127.6 | 11.3 | 10.7 | 10.2 | 9.7 | 9.3 | 89.7 |
| RHMA-tb+20% M | 115,264.6 | 3.0 | 529.5 | 130.9 | 11.6 | 11.0 | 10.5 | 10.0 | 9.5 | 87.4 |
| RHMA-tb+30% M | 118,311.7 | 3.1 | 538.0 | 134.2 | 11.9 | 11.3 | 10.7 | 10.2 | 9.8 | 85.3 |
| Mixture Title | Performance Score | Economic Score | Env. Score | Scenario 1 | Scenario 2 | Scenario 3 | Scenario 4 |
|---|---|---|---|---|---|---|---|
| HMA | 73.3 | 89.4 | 73.9 | 78.9 | 76.7 | 79.9 | 76.8 |
| RHMA-dry+10% M | 92.2 | 96.9 | 93.9 | 94.3 | 93.5 | 94.4 | 93.8 |
| RHMA-dry+20% M | 92.2 | 96.0 | 91.7 | 93.3 | 92.8 | 93.6 | 92.7 |
| RHMA-dry+30% M | 92.2 | 95.1 | 89.6 | 92.3 | 92.2 | 92.8 | 91.7 |
| RHMA-wet+10% M | 96.7 | 100.0 | 100.0 | 98.9 | 98.0 | 98.7 | 98.7 |
| RHMA-wet+20% M | 96.7 | 99.1 | 97.7 | 97.8 | 97.4 | 97.8 | 97.6 |
| RHMA-wet+30% M | 96.7 | 98.2 | 95.4 | 96.8 | 96.7 | 97.0 | 96.5 |
| RHMA-tb+10% M | 100.0 | 96.8 | 89.7 | 95.5 | 97.3 | 96.6 | 95.2 |
| RHMA-tb+20% M | 100.0 | 95.9 | 87.4 | 94.4 | 96.7 | 95.8 | 94.1 |
| RHMA-tb+30% M | 100.0 | 94.9 | 85.3 | 93.4 | 96.0 | 95.0 | 93.1 |
Disclaimer/Publisher’s Note: The statements, opinions and data contained in all publications are solely those of the individual author(s) and contributor(s) and not of MDPI and/or the editor(s). MDPI and/or the editor(s) disclaim responsibility for any injury to people or property resulting from any ideas, methods, instructions or products referred to in the content. |
© 2025 by the authors. Licensee MDPI, Basel, Switzerland. This article is an open access article distributed under the terms and conditions of the Creative Commons Attribution (CC BY) license (https://creativecommons.org/licenses/by/4.0/).
Share and Cite
Labbafi, F.; Alavi, M.Z.; Saadat, F. Comparative Analysis of Rubberized Asphalt and Traditional Asphalt: Performance, Economic, and Environmental Impacts in Life Cycle. Infrastructures 2025, 10, 34. https://doi.org/10.3390/infrastructures10020034
Labbafi F, Alavi MZ, Saadat F. Comparative Analysis of Rubberized Asphalt and Traditional Asphalt: Performance, Economic, and Environmental Impacts in Life Cycle. Infrastructures. 2025; 10(2):34. https://doi.org/10.3390/infrastructures10020034
Chicago/Turabian StyleLabbafi, Fateme, Mohammad Zia Alavi, and Farnaz Saadat. 2025. "Comparative Analysis of Rubberized Asphalt and Traditional Asphalt: Performance, Economic, and Environmental Impacts in Life Cycle" Infrastructures 10, no. 2: 34. https://doi.org/10.3390/infrastructures10020034
APA StyleLabbafi, F., Alavi, M. Z., & Saadat, F. (2025). Comparative Analysis of Rubberized Asphalt and Traditional Asphalt: Performance, Economic, and Environmental Impacts in Life Cycle. Infrastructures, 10(2), 34. https://doi.org/10.3390/infrastructures10020034