
Impact of Concrete Sealer and Salt Usage on Concrete Bridge Deck Condition and Life Cycle Cost


Abstract
1. Introduction
2. Data Collection
3. Machine Learning Model for Predicting Deck Condition
3.1. Random Forest Algorithm
3.2. Model Development and Verification
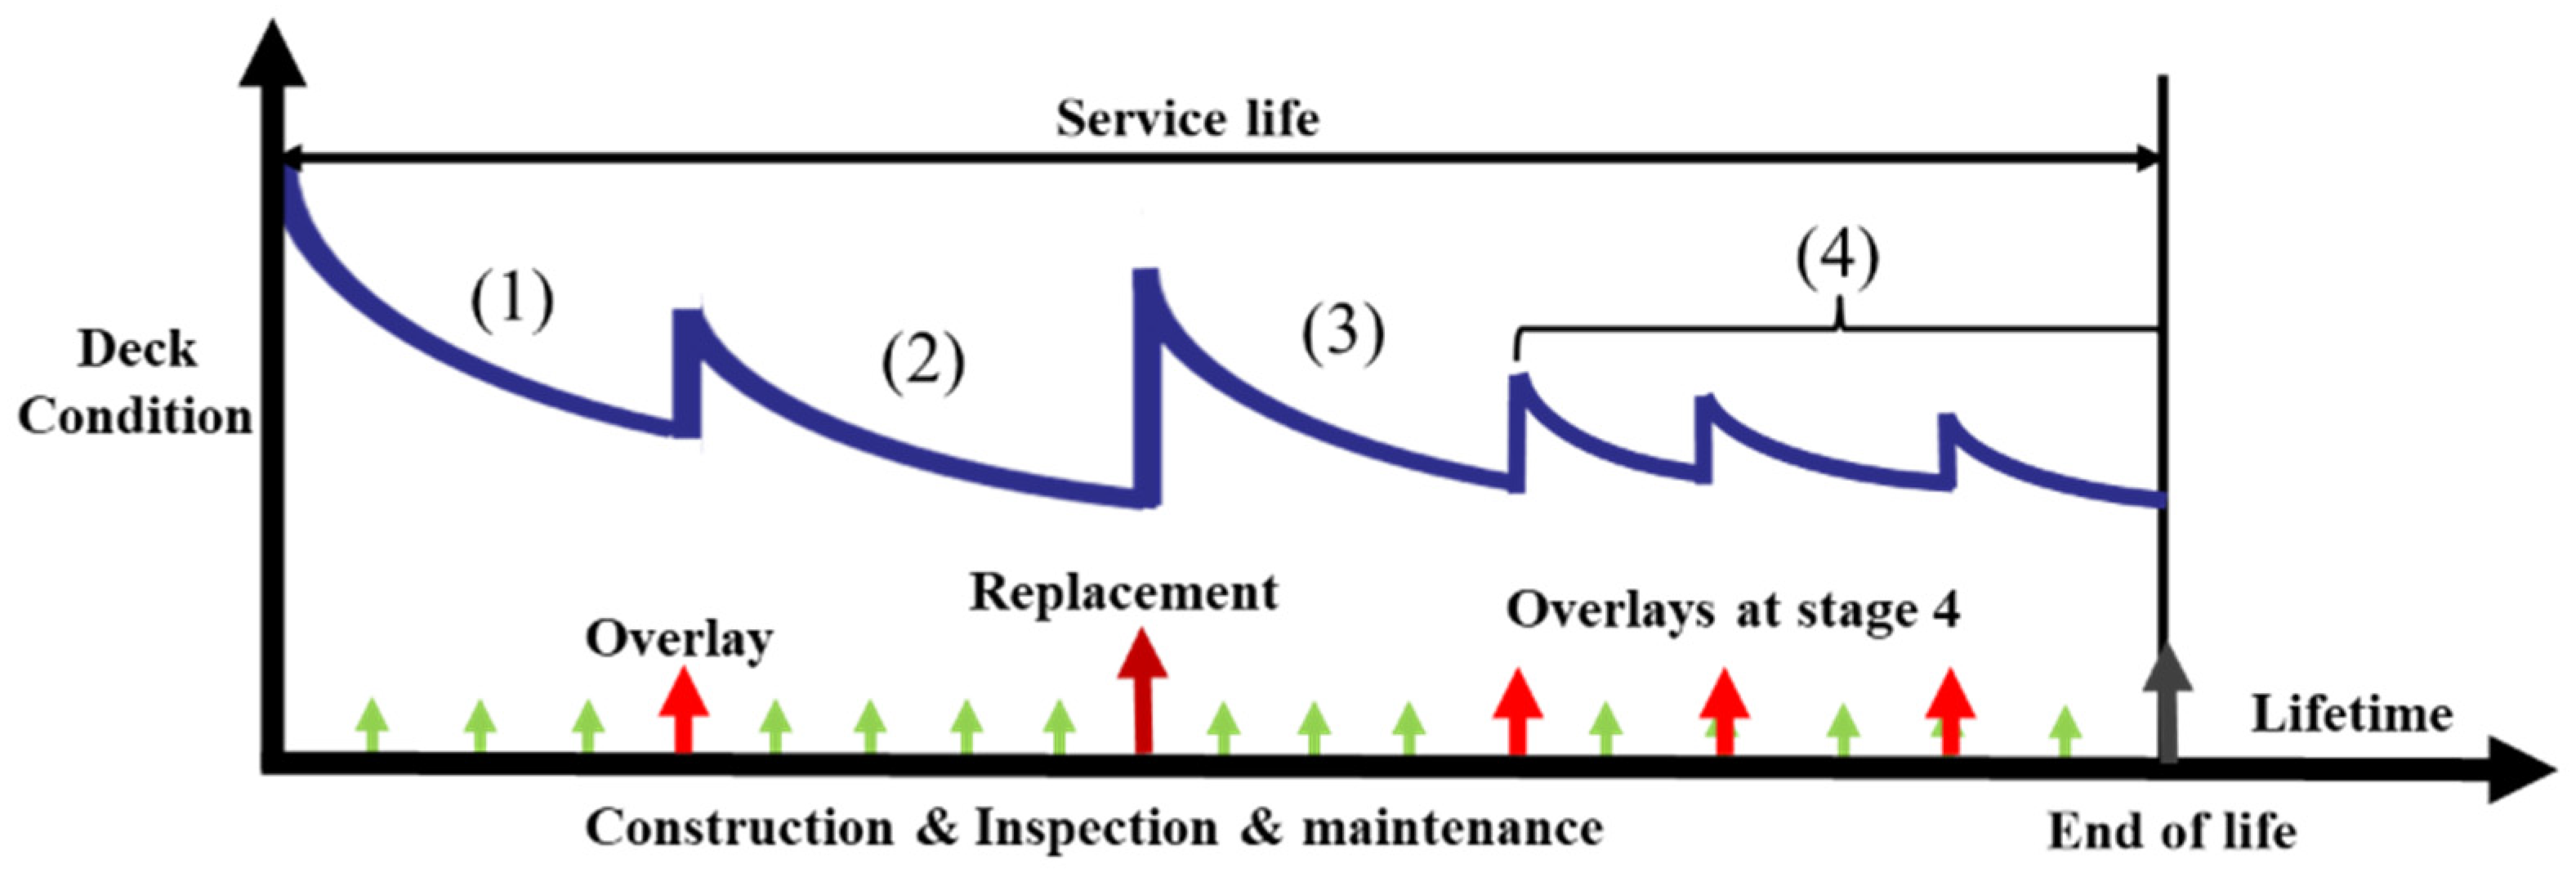
- (1)
- Stage 1 is the period from initial construction to the first overlay activity.
- (2)
- Stage 2 is the period from deck overlay to the first deck replacement.
- (3)
- Stage 3 is the period from the first deck replacement to the next overlay.
- (4)
- Stage 4 covers the rest of the period until the end of service life, which may contain multiple overlay activities.
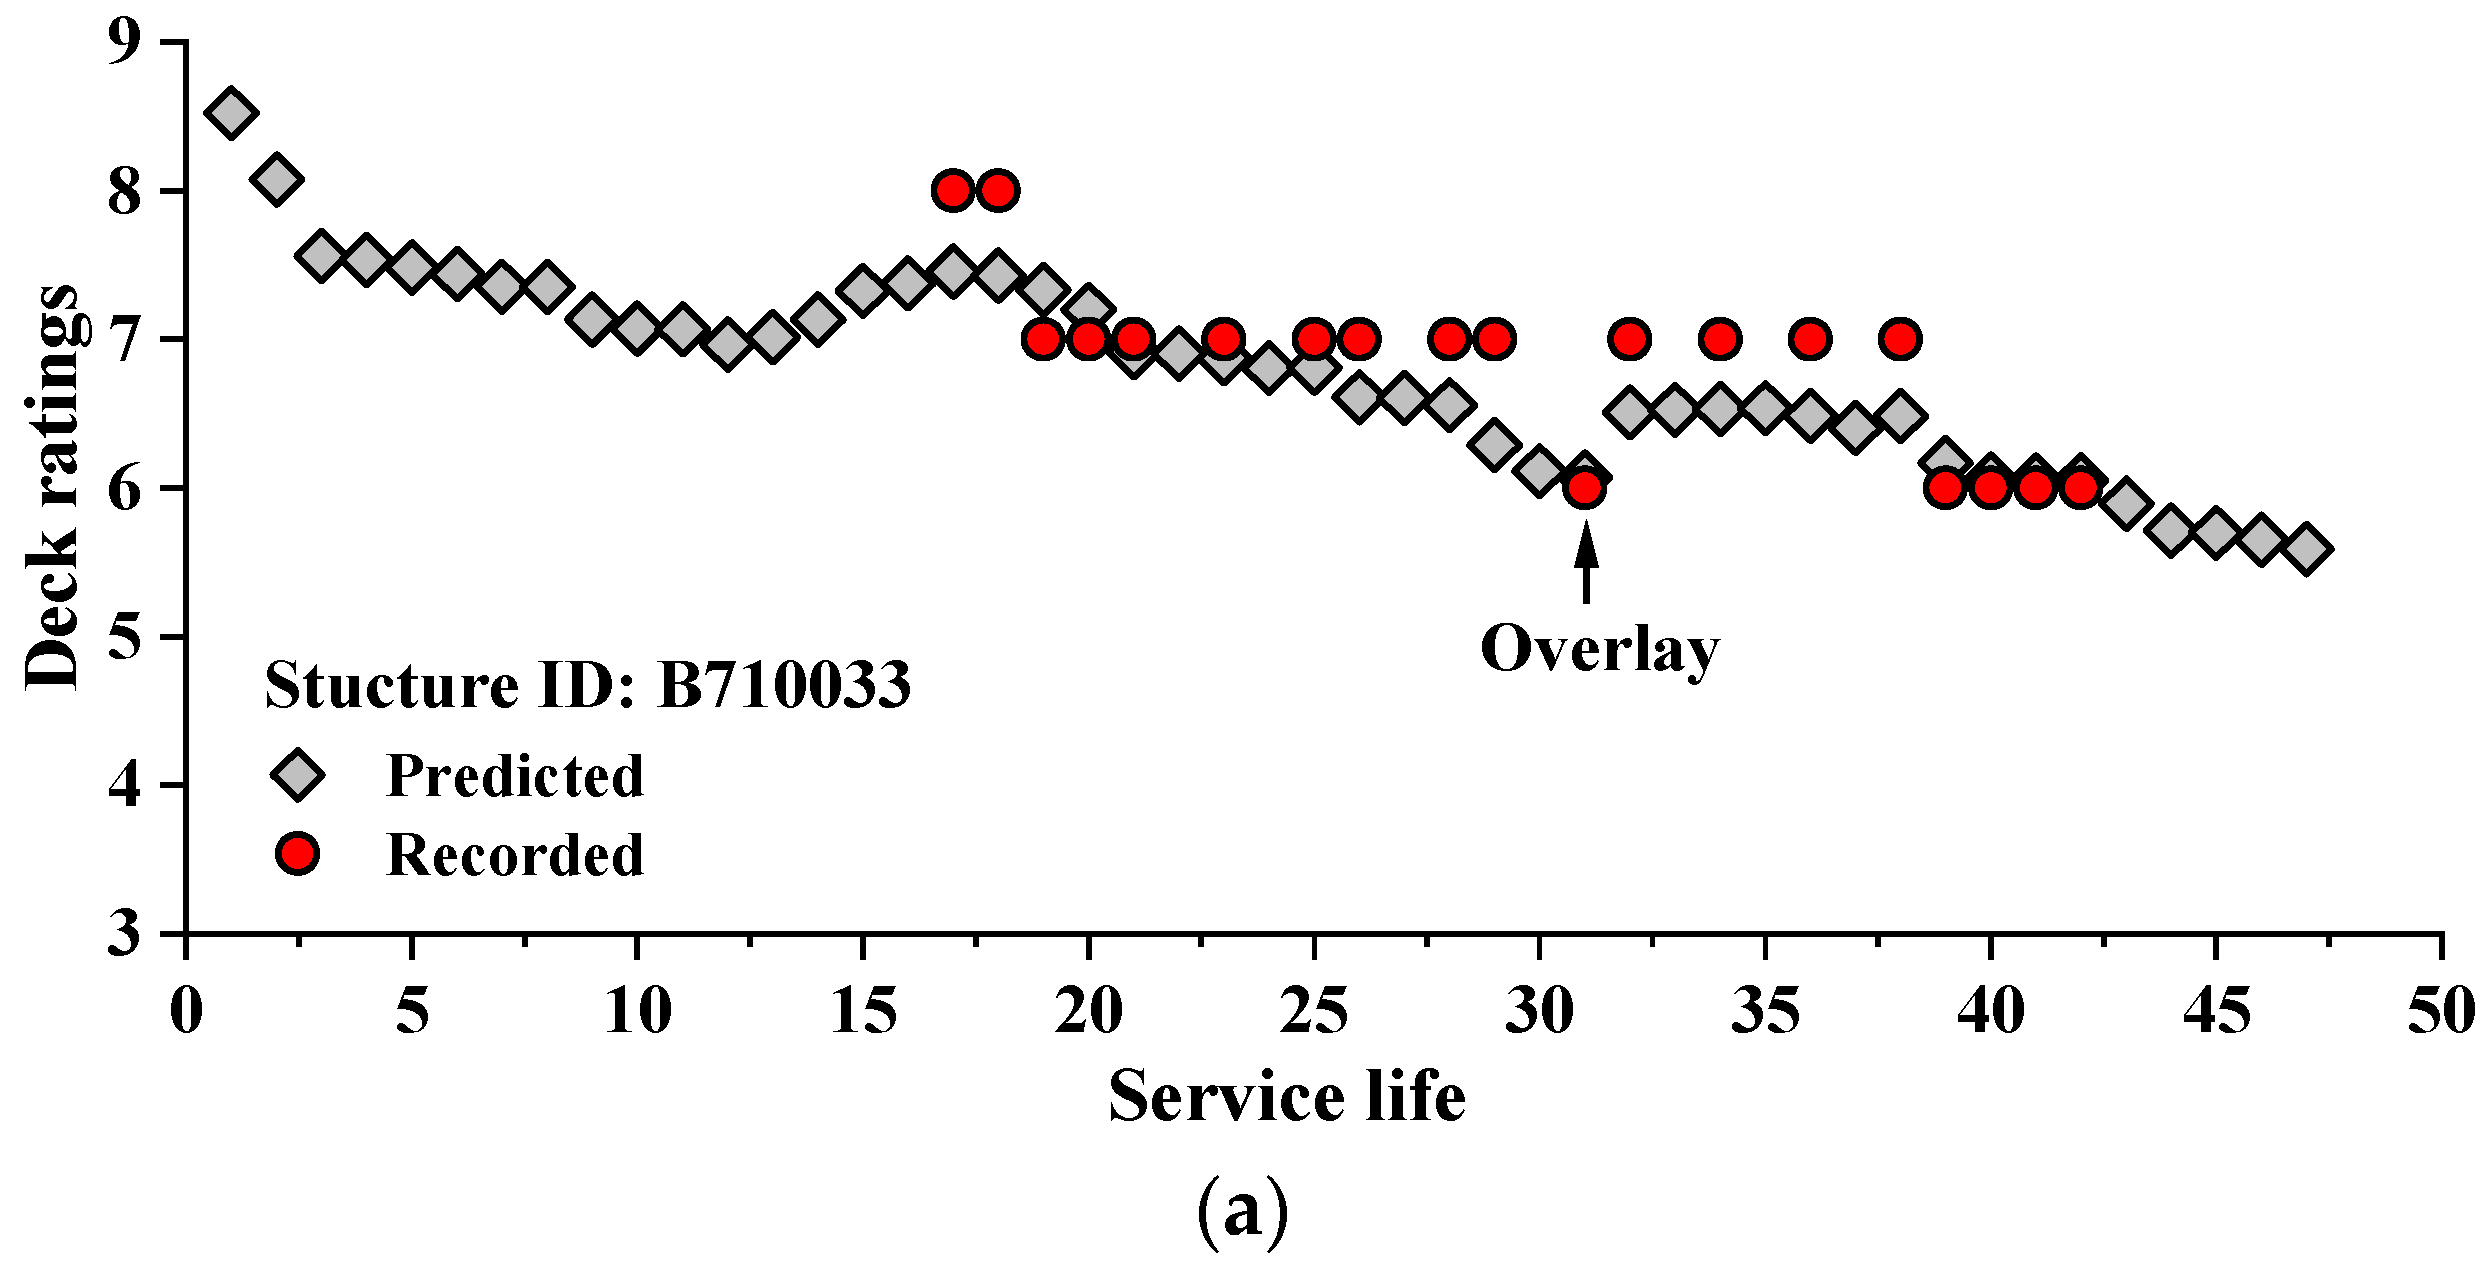
3.3. Prediction of Bridge Deck Condition
4. Life Cycle Cost Analysis
4.1. Orthogonal Analysis of Factors Affecting Deck Rating
4.2. LCCA Parameters and Results
5. Conclusions
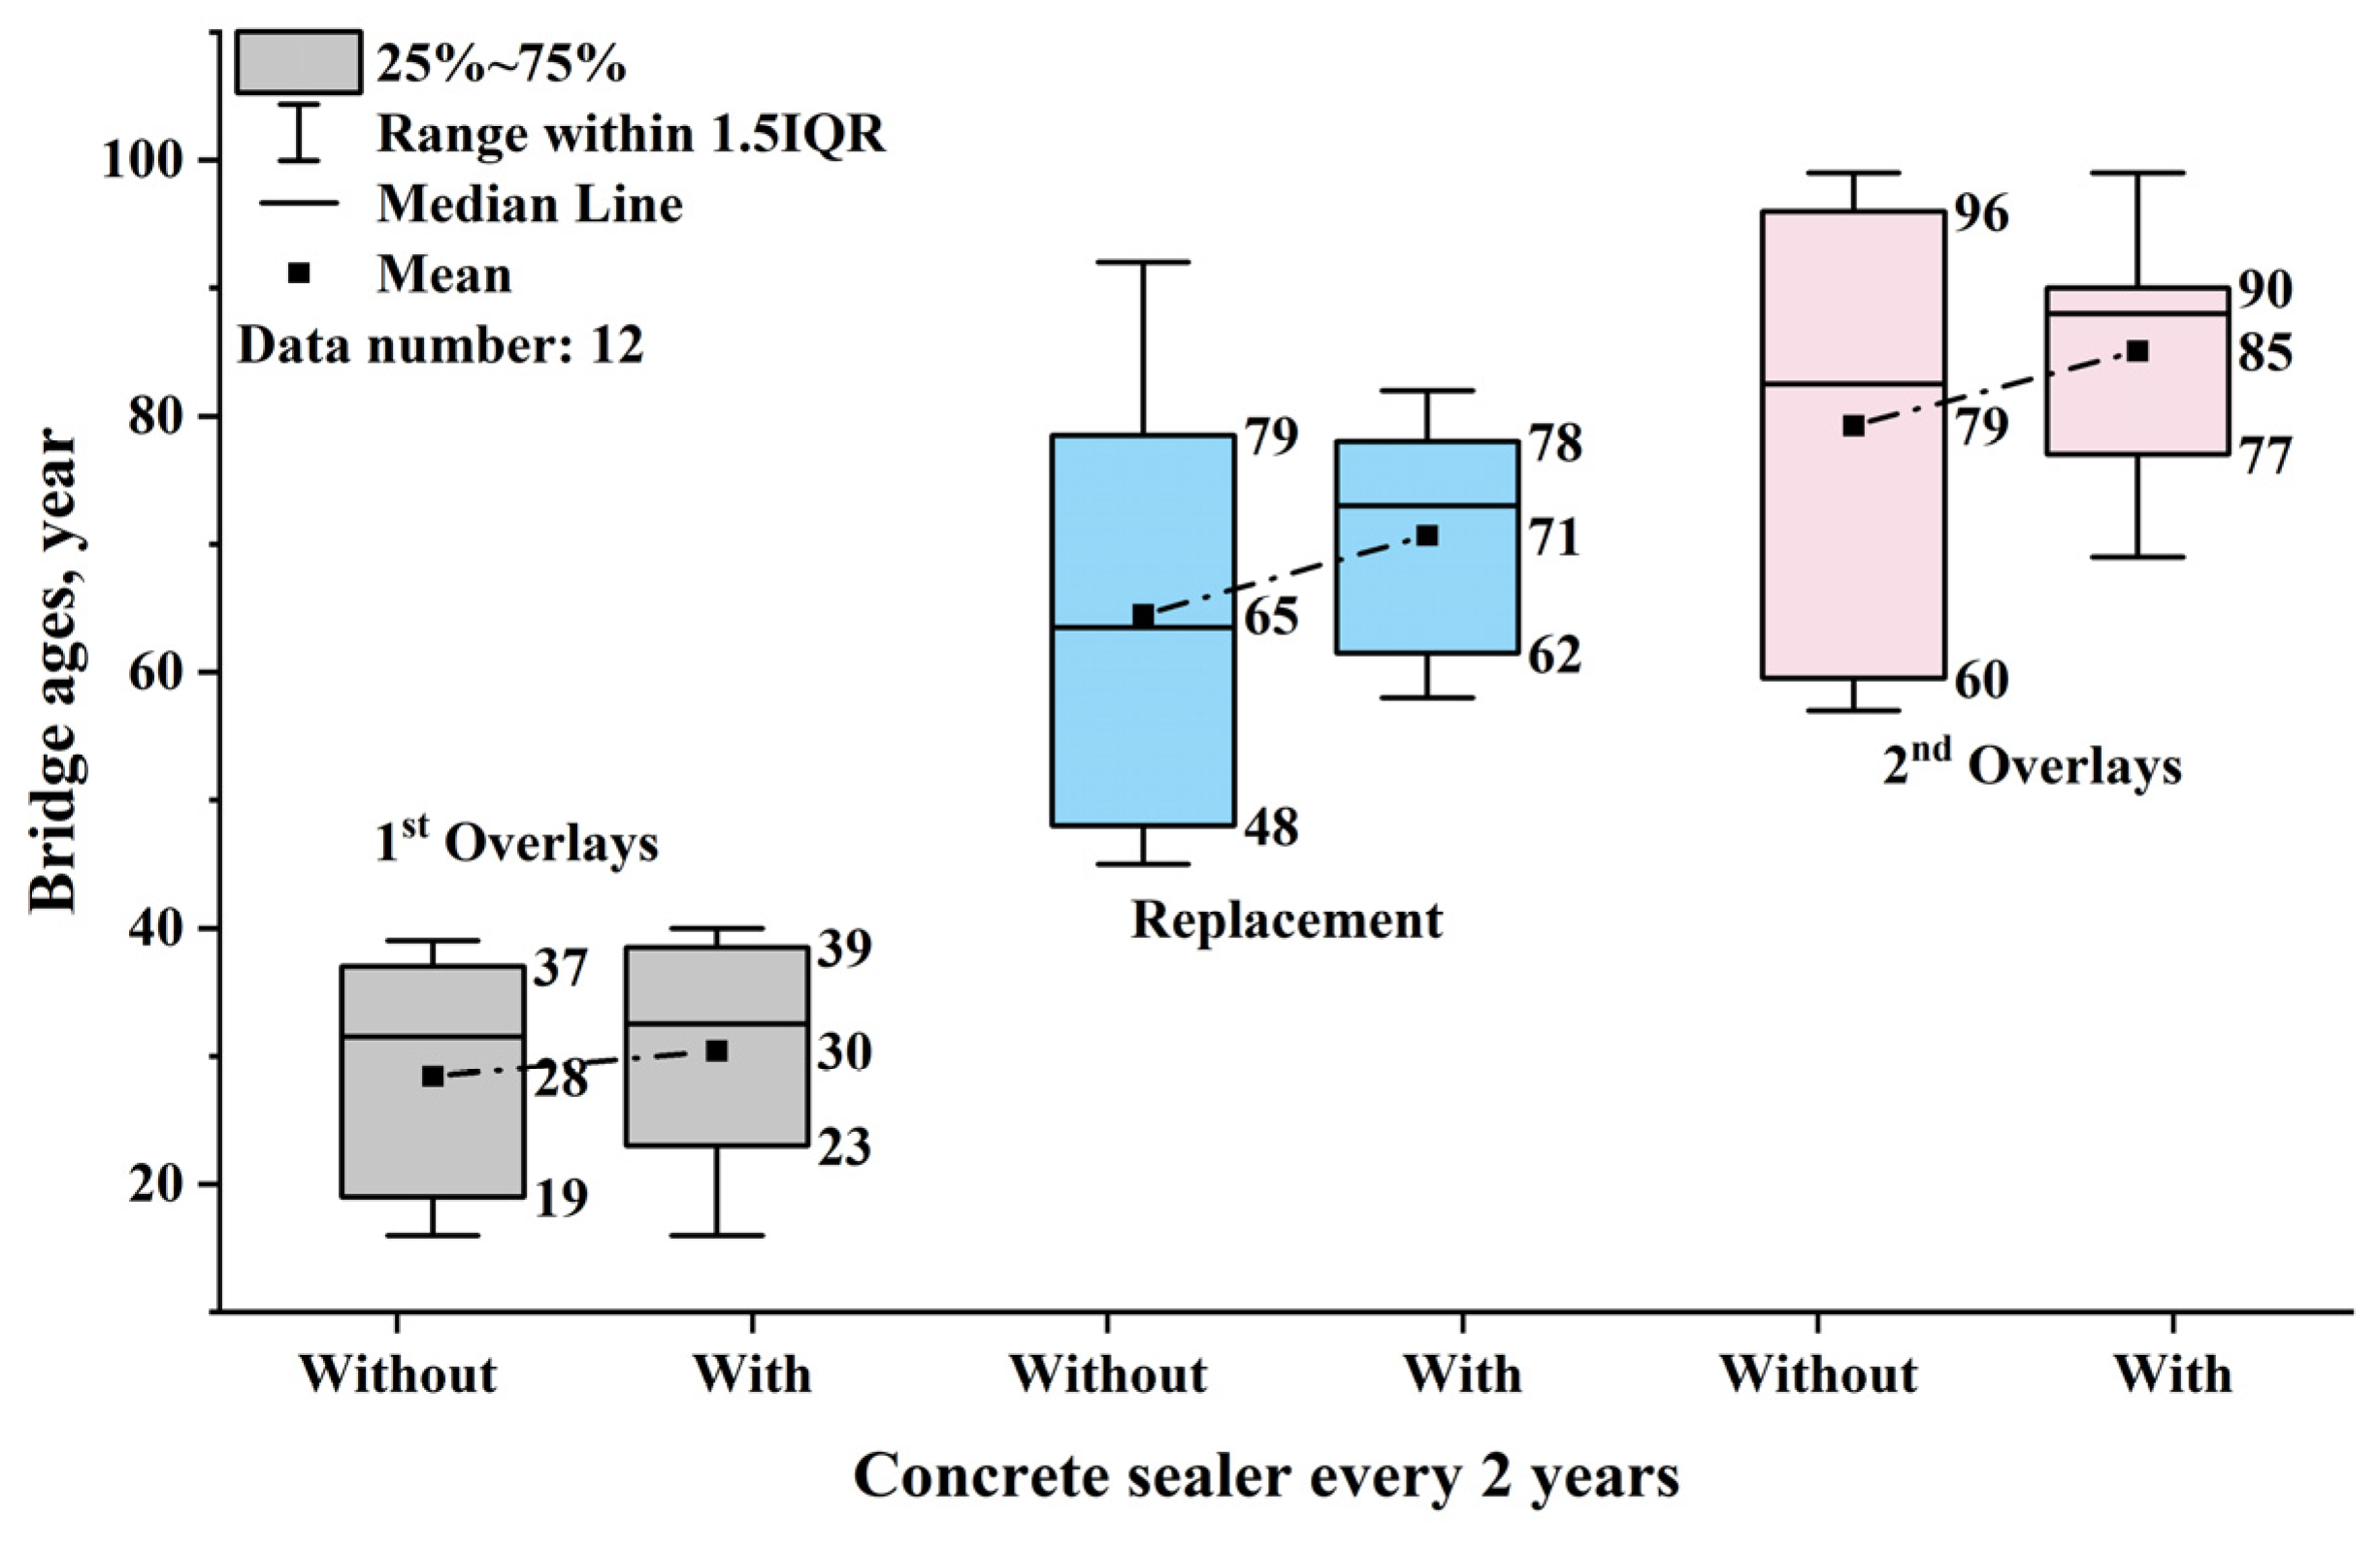
- The deck maintenance history shows that the average bridge age at deck overlay and deck replacement is around 25 and 50 years, respectively. Deck overlay can improve deck condition from an average rating of 6.3 to 7.1, and deck replacement can efficiently recover deck condition from an average rating of 5.3 to 8.5.
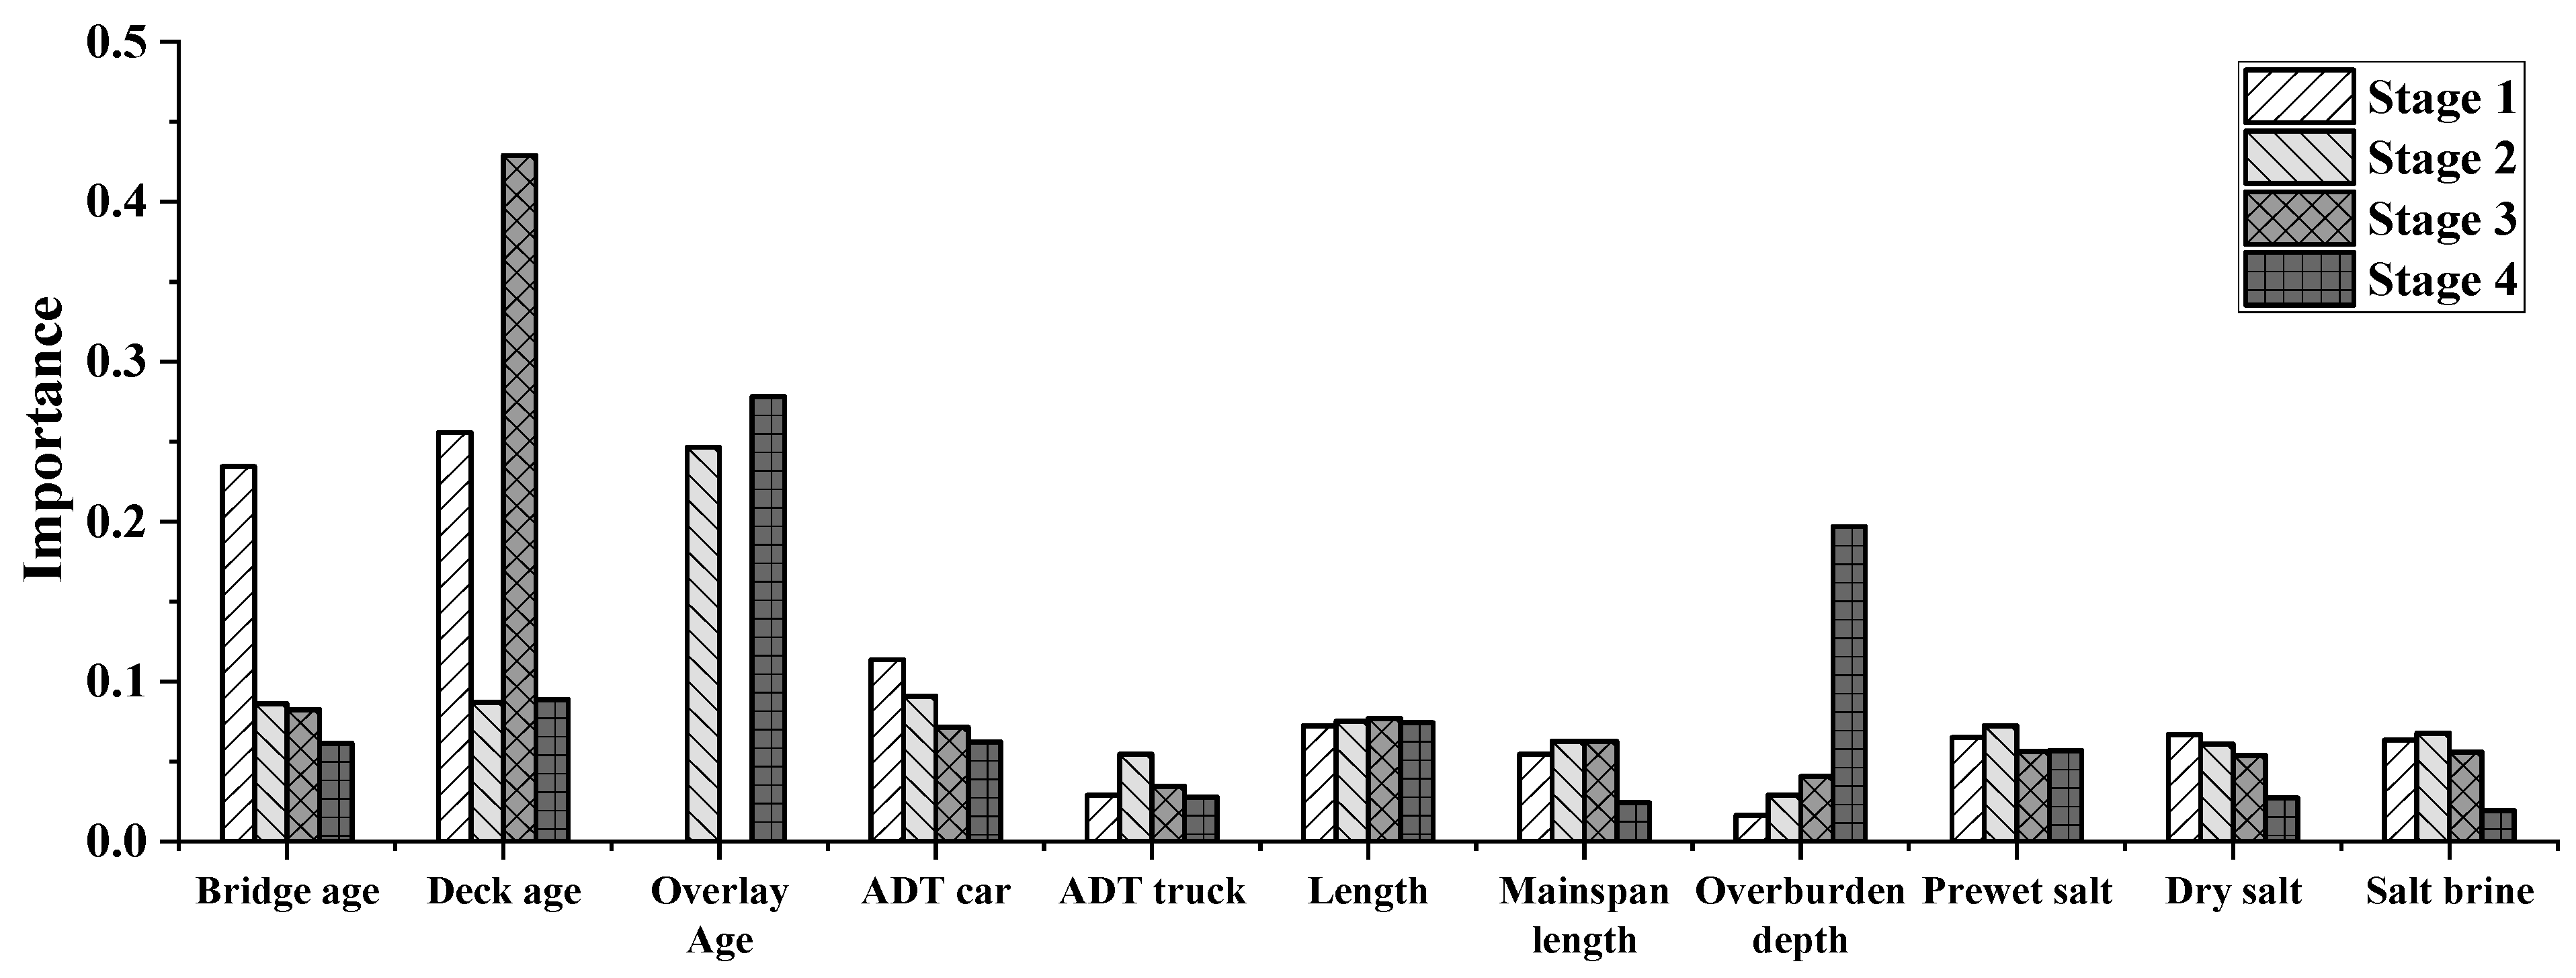
- Random Forest models were developed to predict bridge deck ratings at different stages separated by deck overlays and reconstruction. All the models show good accuracy with R-square values of 0.72–0.93. Bridge age and deck age presented the highest importance among all factors, followed by average daily traffic. The importance of the three types of salt usage is similar.
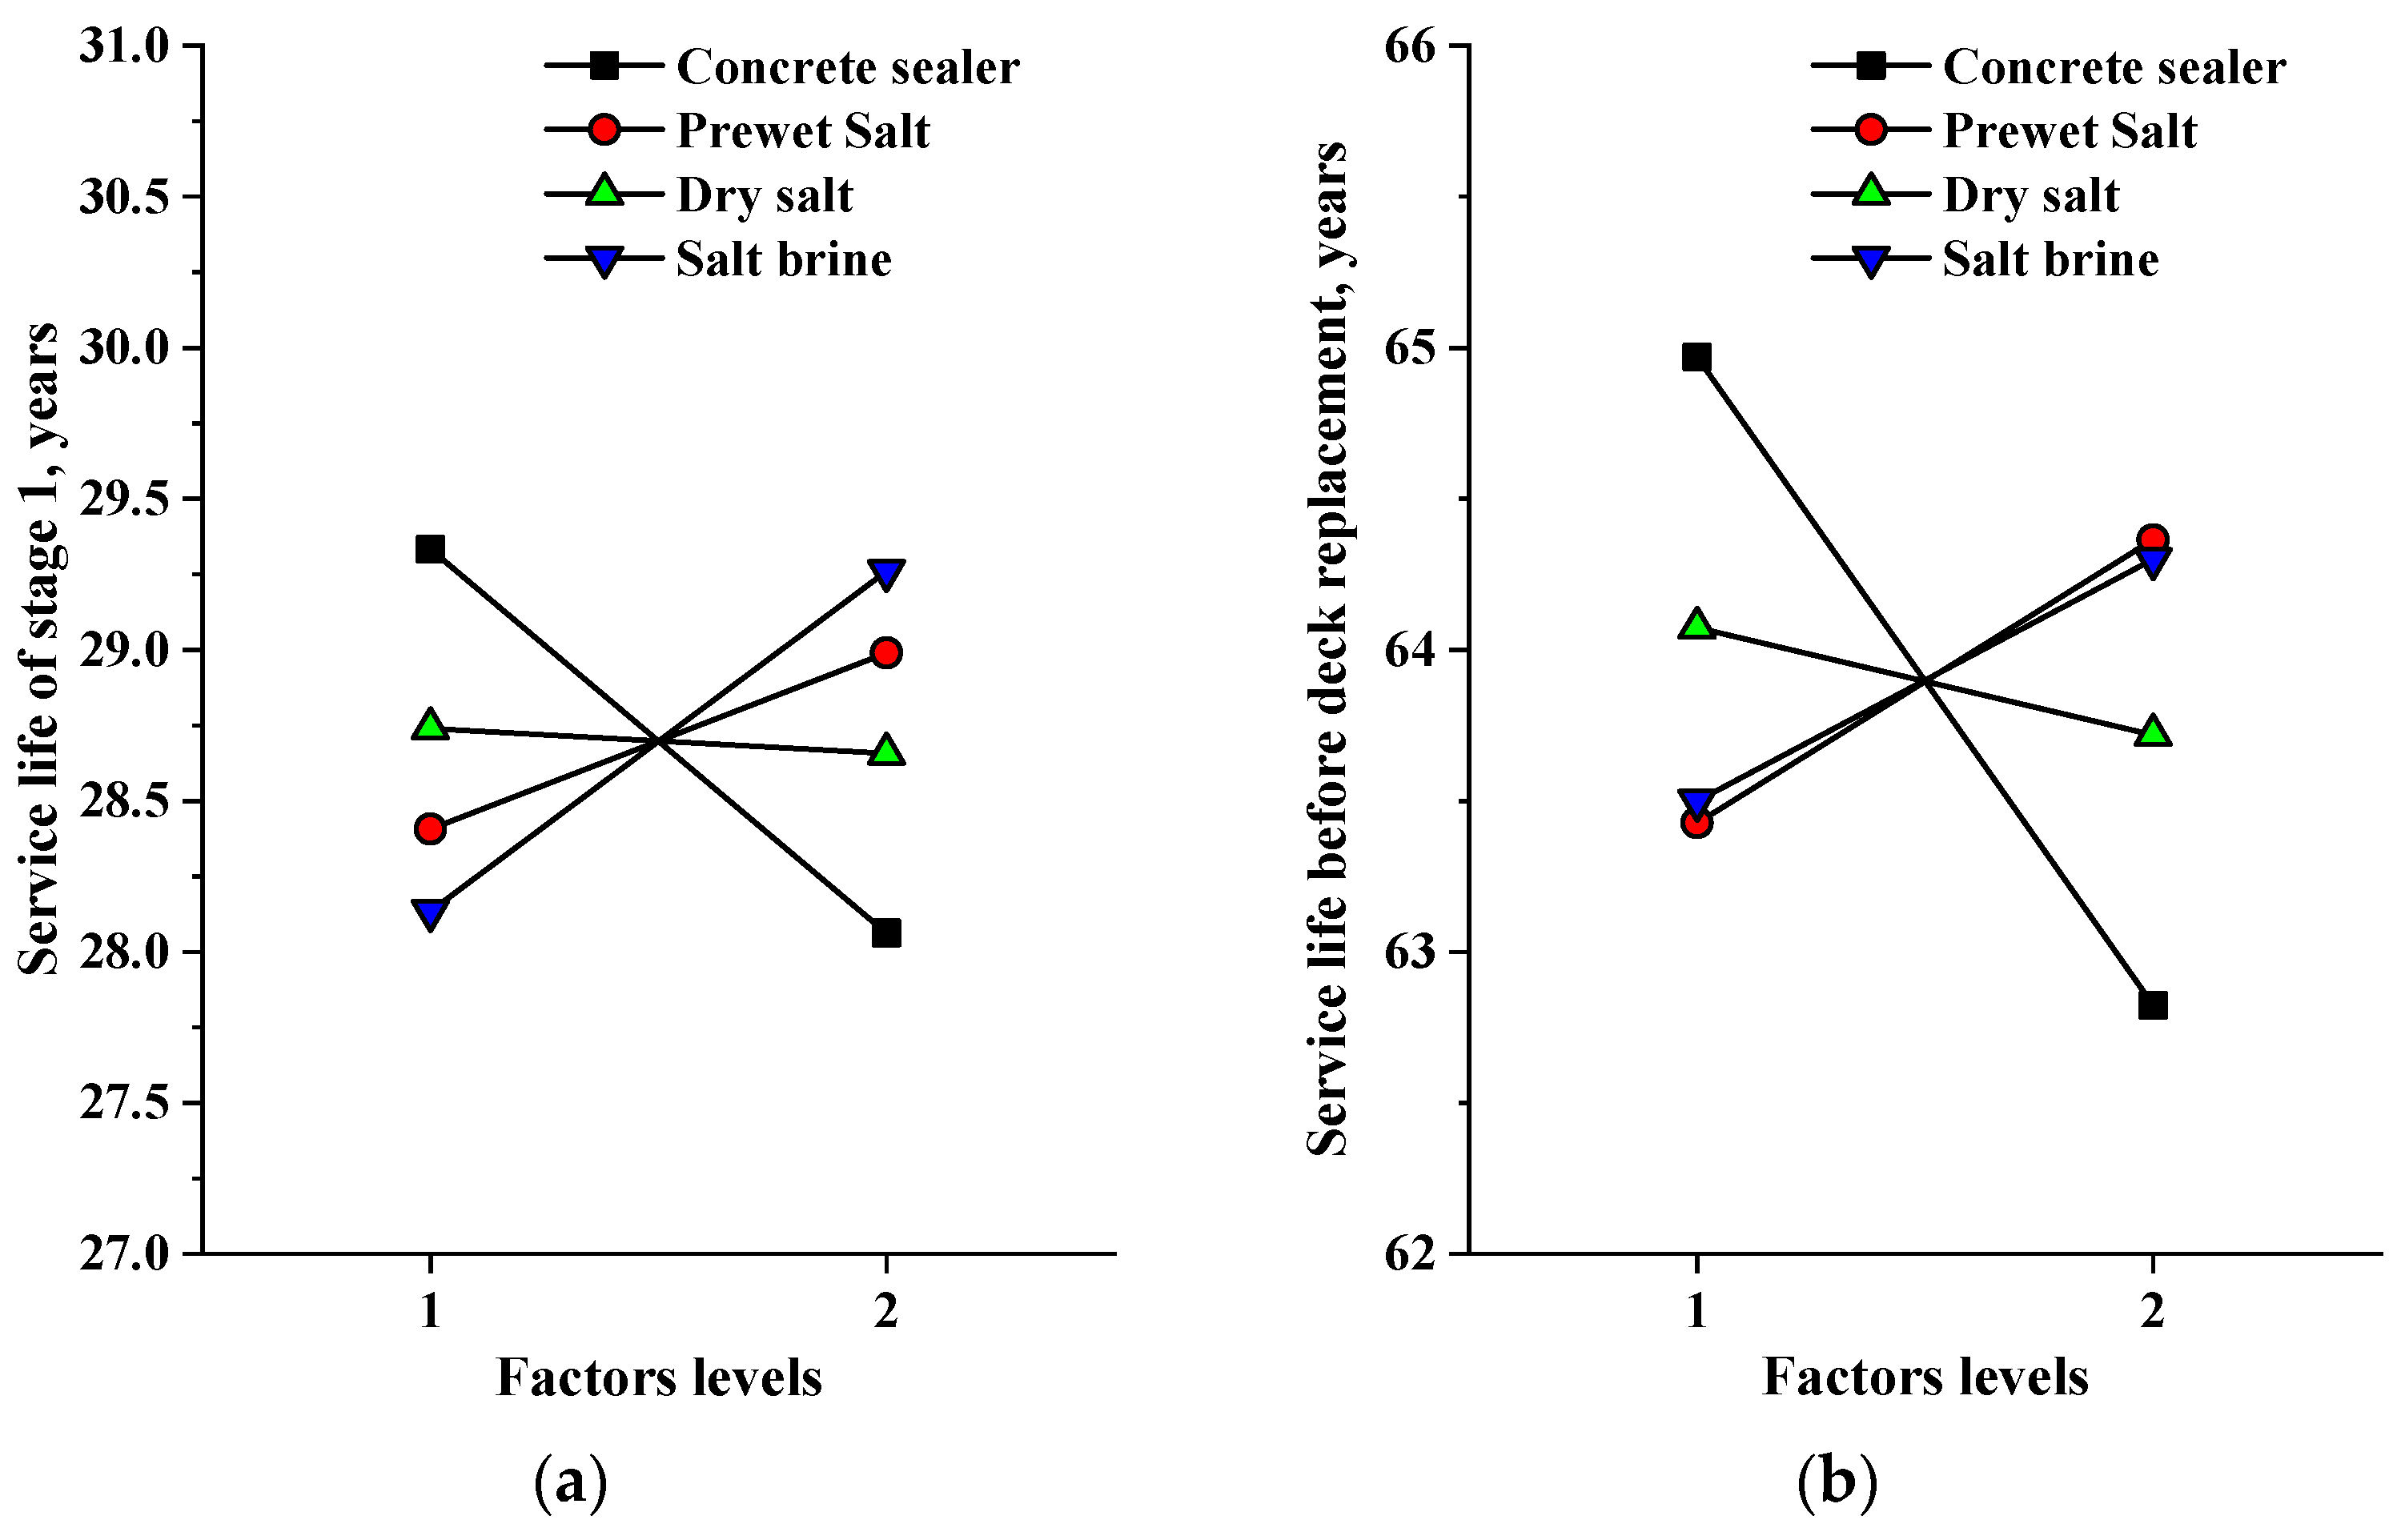
- The effect of concrete sealer on bridge deck condition is only observable at the stage before the first overlay. This indicates that concrete sealer may not be effective over the long term. More usages of prewet salt and salt brine result in slightly higher deck condition ratings, while more dry salt usage presents slightly lower deck condition ratings, indicating the benefits of salt brine over dry salt.
- Orthogonal analysis was conducted to further quantify the influence of concrete sealer and salt usage. When concrete sealer is applied every 2 or 4 years, results indicate that applying concrete sealers can help extend deck life by 1~2 years. Similarly, more usage of salt brine can extend service life by around 1~2 years.
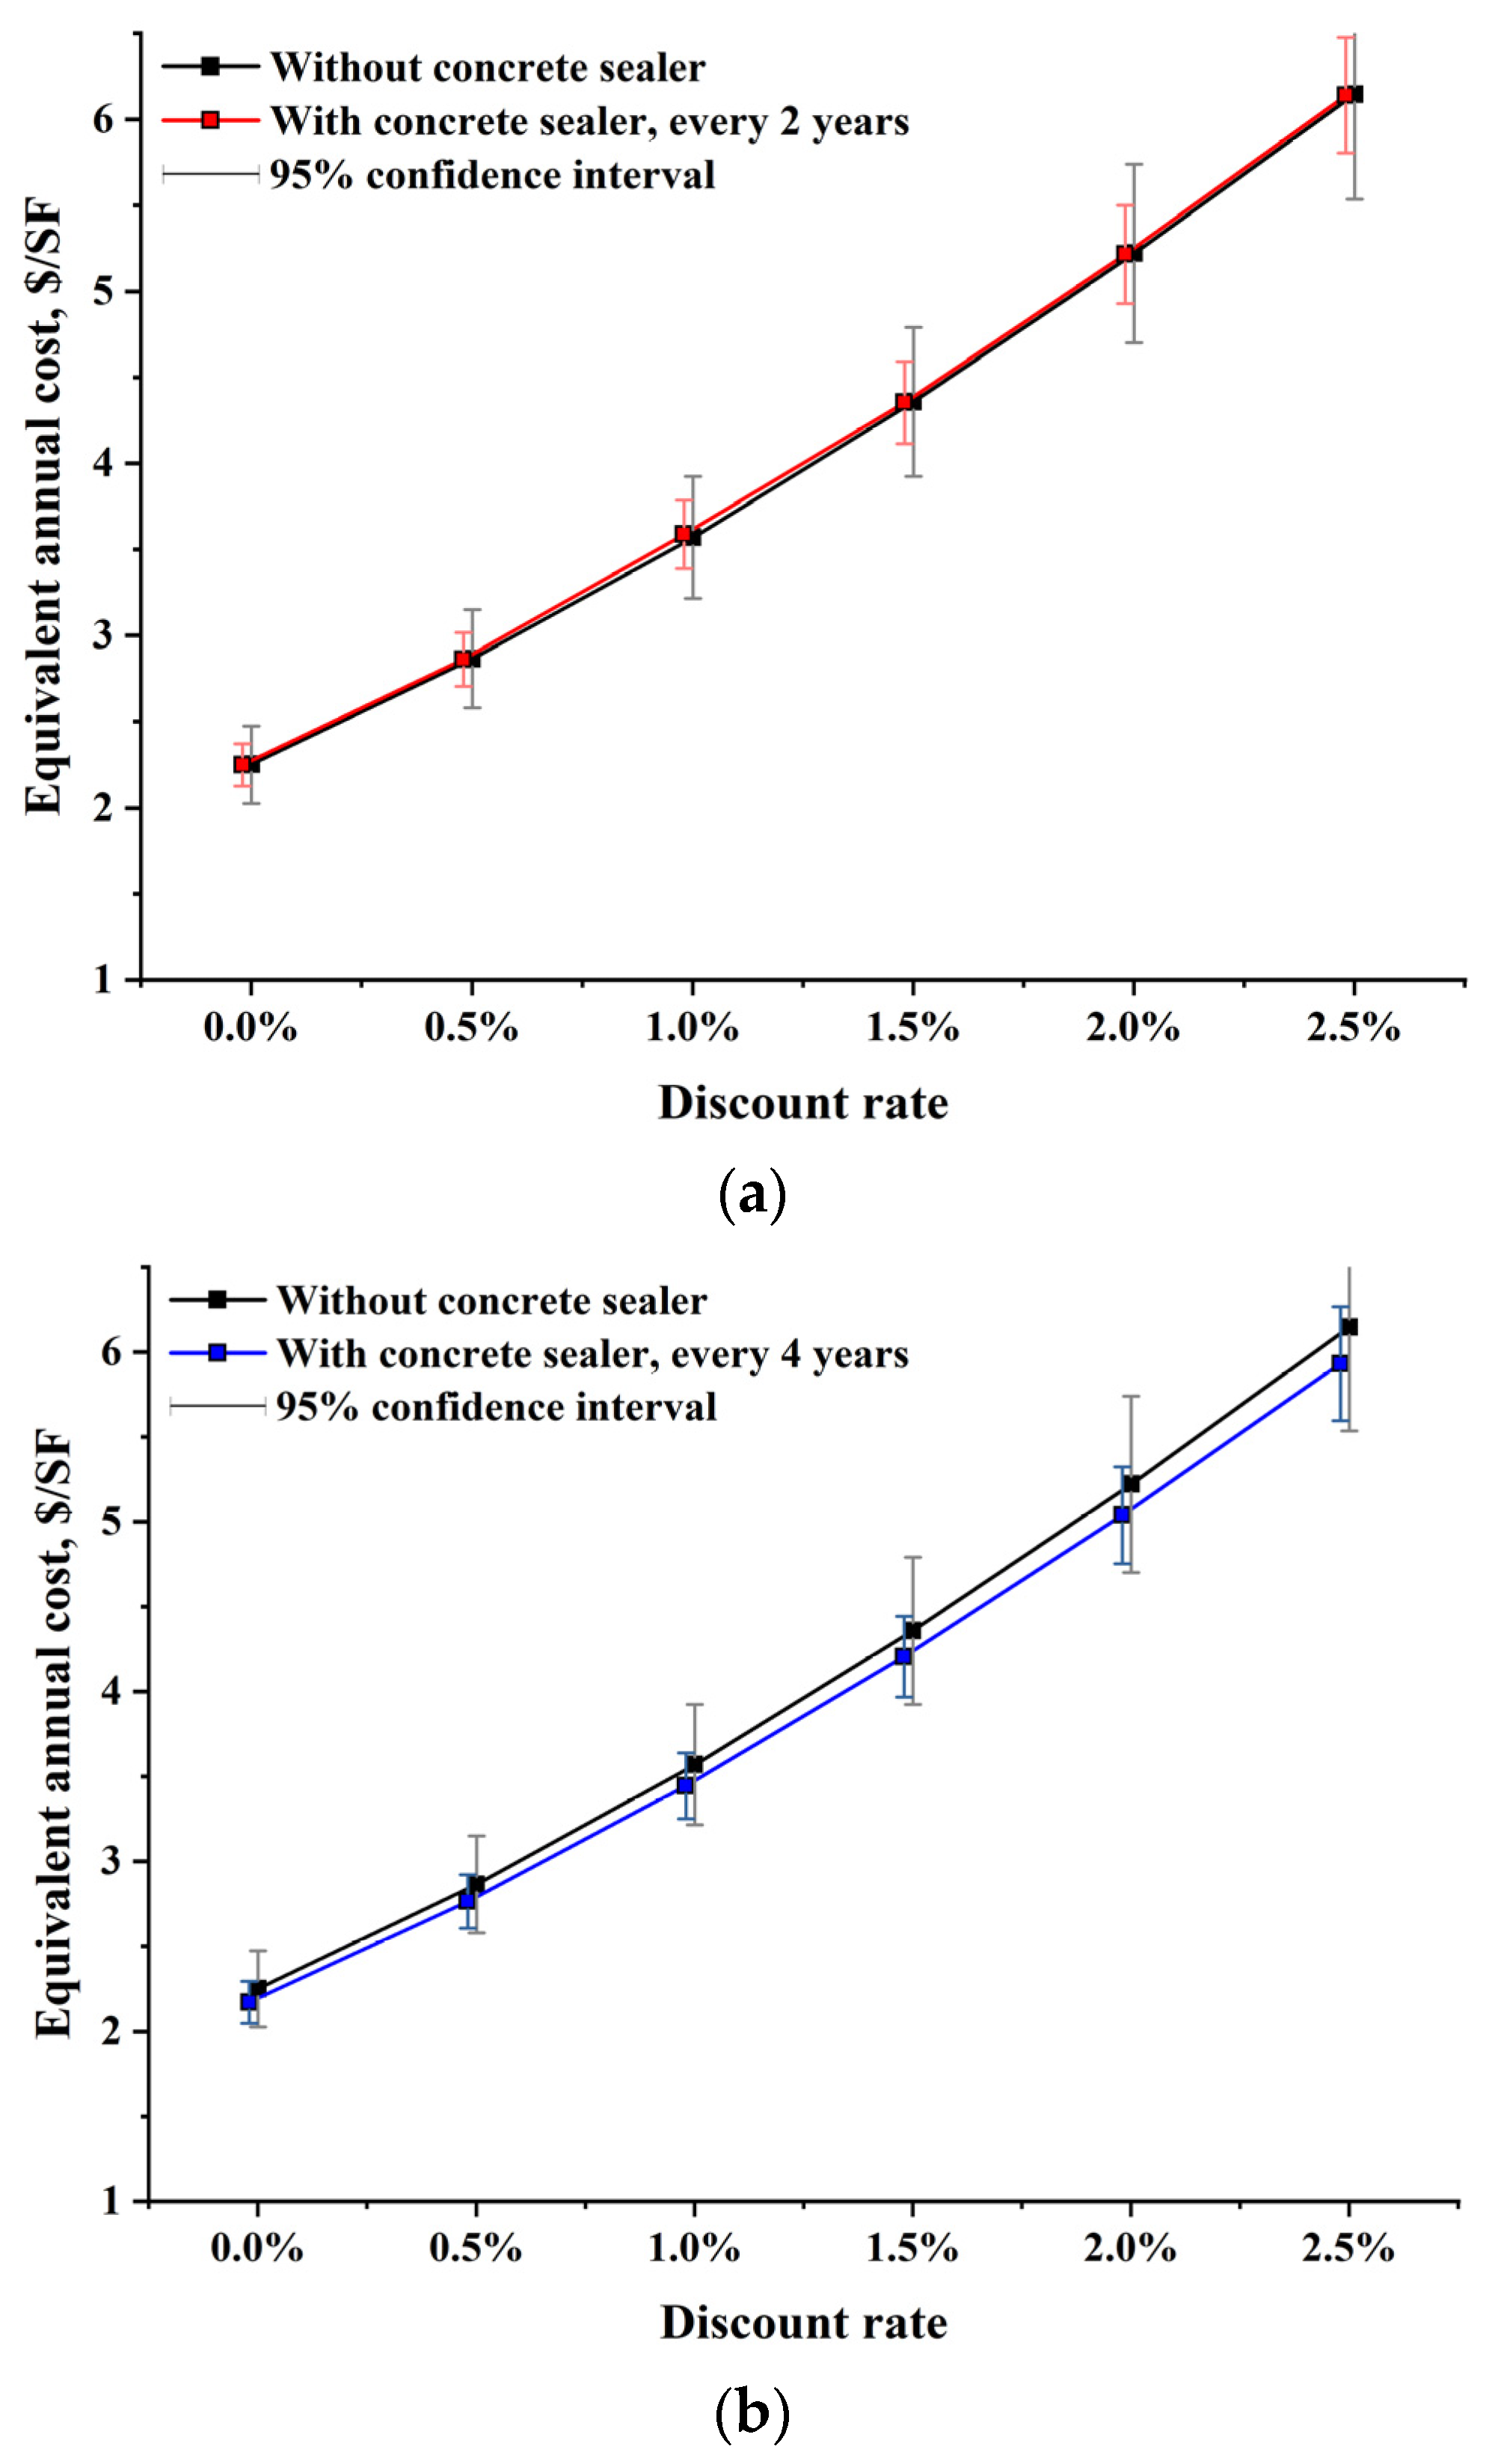
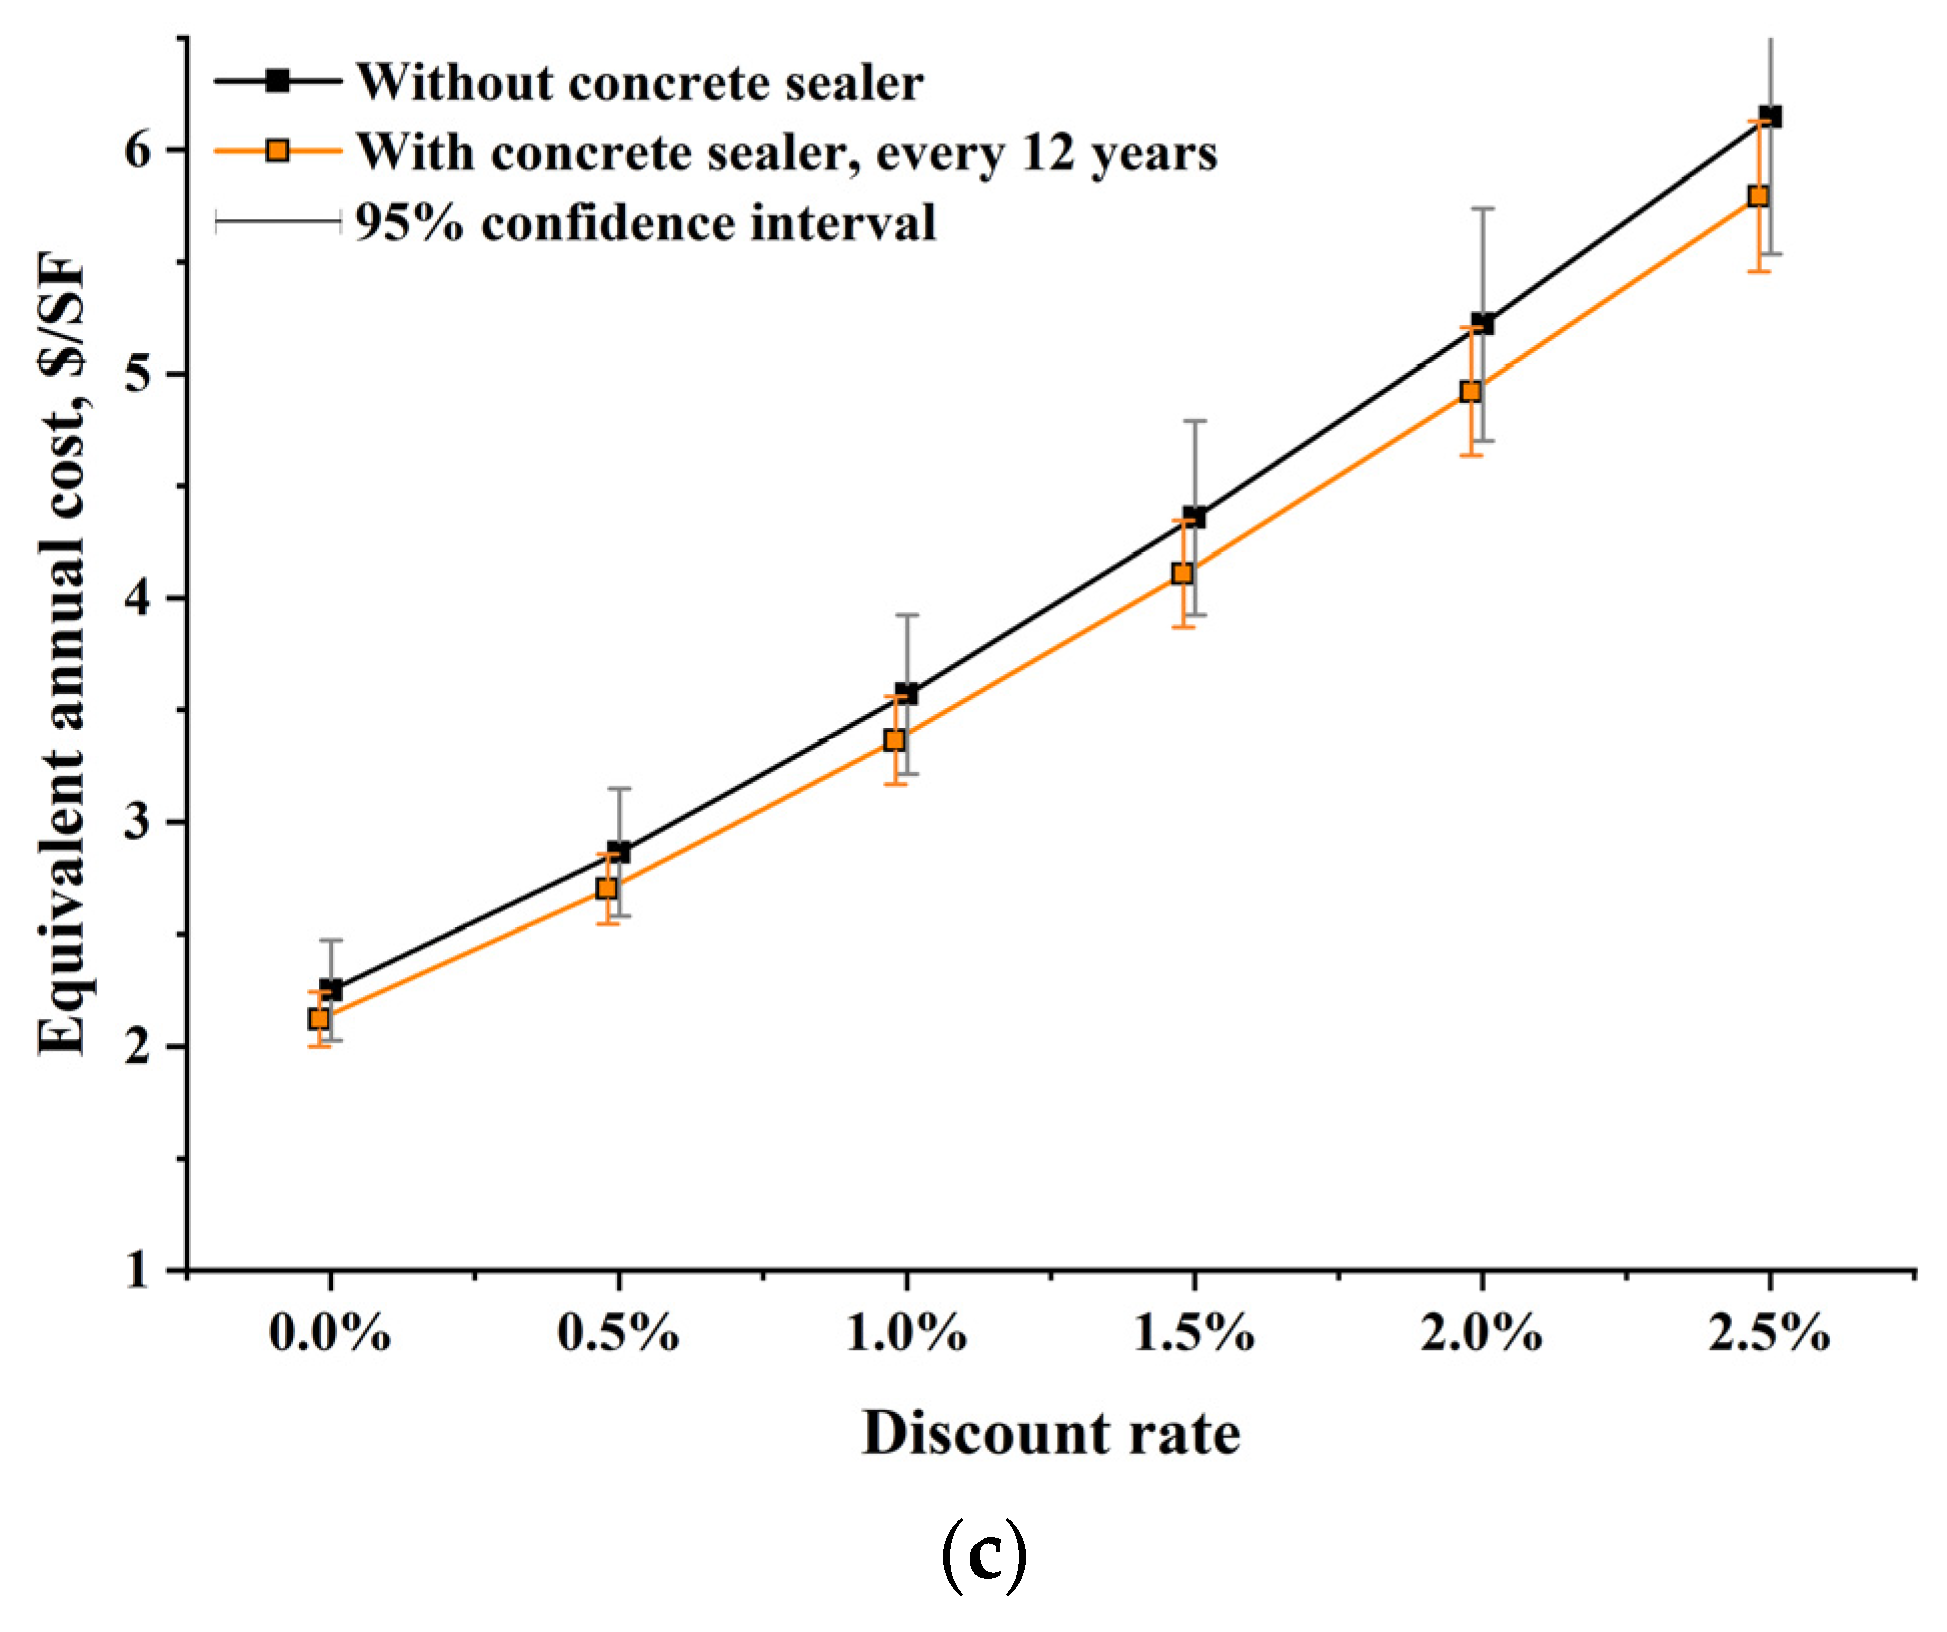
- LCCA results show that the cost of concrete sealer cannot be neglected in analyzing its cost–benefit. The life cycle cost is similar when concrete sealer is applied every 2 years. If concrete sealer is applied every 12 years, a 6% reduction in life cycle cost could be achieved.
Author Contributions
Funding
Data Availability Statement
Conflicts of Interest
References
- National Cooperative Highway Research Program (NCHRP). Guidelines for the Selection of Snow and Ice Control Materials to Mitigate Environmental Impacts (NCHRP Report 577); Transportation Research Board: Washington, DC, USA, 2007. [Google Scholar]
- Neumann, J.E.; Chinowsky, P.; Helman, J.; Black, M.; Fant, C.; Strzepek, K.; Martinich, J. Climate effects on US infrastructure: The economics of adaptation for rail, roads, and coastal development. Clim. Change 2021, 167, 44. [Google Scholar]
- Lee, H.; Cody, A.M.; Cody, R.D.; Spry, P.G. Effects of various deicing chemicals on pavement concrete deterioration. In Proceedings of the Mid-Continent Transportation Symposium, Ames, IA, USA, 15–16 May 2000; pp. 151–155. [Google Scholar]
- Sakr, M.R.; Bassuoni, M.T.; Hooton, R.D.; Drimalas, T.; Haynes, H.; Folliard, K.J. Physical salt attack on concrete: Mechanisms, influential factors, and protection. ACI Mater. J. 2020, 117, 253–268. [Google Scholar]
- Shi, X.; Fay, L.; Yang, Z.; Nguyen, T.A.; Liu, Y. Corrosion of deicers to metals in transportation infrastructure: Introduction and recent developments. Corros. Rev. 2009, 27, 23–52. [Google Scholar] [CrossRef]
- Wang, J.; Chen, J.; Chen, T.; Huang, Y.; Hou, T.; Chen, J. Damage development in cement paste exposed to magnesium ion corrosion. Constr. Build. Mater. 2024, 417, 135183. [Google Scholar] [CrossRef]
- Federal Highway Administration (FHWA). Bridge Preservation Guide: Maintaining a Resilient Infrastructure to Preserve Mobility (FHWA-HIF-18-022); U.S. Department of Transportation: Washington, DC, USA, 2018.
- National Cooperative Highway Research Program (NCHRP). Guide Specification for Service Life Design of Highway Bridges (NCHRP Project 12-108); Transportation Research Board: Washington, DC, USA, 2020. [Google Scholar]
- Ni, X.; Leon-Miquel, M.; Greiner, Q.R.; Paul, A.; Jin, Q. Crack sealers for the preservation of concrete bridge decks: A synthesis of a national survey and literature review. J. Infrastruct. Preserv. Resil. 2023, 4, 23. [Google Scholar] [CrossRef]
- Xia, H.; Lu, C.; Yang, H.; Song, L.; Geng, J.; Zihang, C.; Niu, Y.; Sun, Y. Preparation and performance of durable waterproof adhesive layer for steel bridge deck based on self-stratification effect. Constr. Build. Mater. 2023, 366, 130133. [Google Scholar]
- Tabatabai, H.; Nabizadeh, A. Evaluation of Thin Polymer Overlays for Bridge Decks (Report No. 0092-12-06); Wisconsin Highway Research Program: Madison, WI, USA, 2016.
- Bektas, B.; Albughdadi, A.; Freeseman, K.; Bazargani, B. Protocols for Concrete Bridge Deck Protections and Treatments (Report No. 0092-18-03); Wisconsin Department of Transportation: Madison, WI, USA, 2020.
- Cramer, S.D.; Covino, B.S., Jr.; Bullard, S.J.; Holcomb, G.R.; Russell, J.H.; Nelson, F.J.; Laylor, H.M.; Soltesz, S.M. Corrosion prevention and remediation strategies for reinforced concrete coastal bridges. Cem. Concr. Compos. 2002, 24, 101–117. [Google Scholar] [CrossRef]
- Assaad, R.; El-Adaway, I.H. Bridge infrastructure asset management system: Comparative computational machine learning approach for evaluating and predicting deck deterioration conditions. J. Infrastruct. Syst. 2020, 26, 04020032. [Google Scholar] [CrossRef]
- Brighenti, F.; Caspani, V.F.; Costa, G.; Giordano, P.F.; Limongelli, M.P.; Zonta, D. Bridge management systems: A review on current practice in a digitizing world. Eng. Struct. 2024, 321, 118971. [Google Scholar] [CrossRef]
- Alipour, A.; Shafei, B.; Mock, A.; Prajapat, K. Development of a Life-Cycle Cost Analysis Tool for Improved Maintenance and Management of Bridges; IHRB Project TR-737; Iowa Highway Research Board: Coralville, IA, USA, 2020.
- Wettach-Glosser, J. Concrete Bridge Deck Performance Data and Metrics for the State of Oregon; FHWA/IN/JTRP-2016/22; Portland State University, Joint Transportation Research Program Publication: Portland, OR, USA, 2019. [Google Scholar]
- Lu, P.; Wang, H.; Tolliver, D. Prediction of Bridge Component Ratings Using Ordinal Logistic Regression Model. Math. Probl. Eng. 2019, 2019, 979758. [Google Scholar]
- Frosch, R.J.; Kreger, M.E.; Byl, E.A.; Lyrenmann, J.P.; Pollastrini, A.S. Development of a Cost-Effective Concrete Bridge Deck Preservation Program; Purdue University: West Lafayette, IN, USA, 2016. [Google Scholar]
- Xiao, D.; Owusu-Ababio, S.; Schmitt, R. Evaluation of the Effects of Deicers on Concrete Durability (Report No. 0092-17-03); Wisconsin Department of Transportation: Madison, WI, USA, 2018.
- Hedayat, A.S.; Sloane NJ, A.; Stufken, J. Orthogonal Arrays: Theory and Applications; Springer Series in Statistics; Springer: Berlin/Heidelberg, Germany, 1999. [Google Scholar]
- Federal Highway Administration (FHWA). Life-Cycle Cost Analysis Primer; Office of Asset Management, U.S. Department of Transportation: Washington, DC, USA, 2002.
- Wisconsin Department of Transportation. Bureau of Structures Cost Estimate Calculations. 2023. Available online: https://wisconsindot.gov/Documents/doing-bus/local-gov/astnce-pgms/highway/tools/bos-cost.pdf (accessed on 3 June 2023).
- Cusson, D.; Lounis, Z.; Daigle, L. Benefits of internal curing on service life and life-cycle cost of high-performance concrete bridge decks: A case study. Cem. Concr. Compos. 2010, 32, 339–350. [Google Scholar] [CrossRef]
- Moradllo, M.; Sudbrink, B.; Ley, M. Determining the effective service life of silane treatments in concrete bridge decks. Constr. Build. Mater. 2016, 116, 121–127. [Google Scholar] [CrossRef]


| Stages | MAE | R-Square | RMSE | Accuracy | Data Number |
|---|---|---|---|---|---|
| 1 | 0.40 | 0.72 | 0.30 | 94.25 | 74,410 |
| 2 | 0.38 | 0.74 | 0.33 | 93.69 | 13,012 |
| 3 | 0.27 | 0.81 | 0.16 | 96.04 | 4717 |
| 4 | 0.18 | 0.93 | 0.06 | 97.15 | 152 |
| Prediction Scenario | Factor | Expected Output | Prediction Assumptions |
|---|---|---|---|
| 1 | Concrete sealer effect | No concrete sealer vs. concrete sealer | Predicted service life: 100 years Input data: bridges with random attributes based on the database. Preservation and maintenance schedule was analyzed based on the criteria below. Overlay is applied when the deck rate is below 6.3. Replacement is triggered when the deck rate is below 5.2. One overlay is applied before replacement and multiple overlays may be applied after replacement. |
| 2 | Salt effect (Prewet salt, dry salt, and salt brine) | Less vs. moderate vs. more salt (25th percentile vs. average vs. 75th percentile) |
| Factor | Sealer | Prewet Salt (lb) | Dry Salt (lb) | Salt brine (lb) |
|---|---|---|---|---|
| 1–1 | 1 (Yes) | 1 (562) | 1 (43, 146) | 1 (99) |
| 1–2 | 1 | 2 (44, 150) | 2 (224, 420) | 2 (1706) |
| 1–3 | 1 | 1 | 2 | 2 |
| 1–4 | 1 | 2 | 1 | 1 |
| 1–5 | 2 (No) | 2 | 1 | 2 |
| 1–6 | 2 | 1 | 2 | 1 |
| 1–7 | 2 | 2 | 2 | 1 |
| 1–8 | 2 | 1 | 1 | 2 |
| Cost Data Items | Cost, $/m2 | Cost, $/SF | |
|---|---|---|---|
| Major maintenance | New deck/Deck replacement | 1130 | 105.0 |
| Deck overlay | 495 | 46.0 | |
| Minor maintenance | Deck repair | 20 | 1.9 |
| Crack sealing | 15 | 1.4 | |
| Concrete sealer | 8 | 0.7 | |
| Routine inspection | 2 | 0.2 | |
| Preservation Activities | Application Intervals (Years) |
|---|---|
| Routine inspection | 2 |
| Deck clean, sweep, and drains | 2 |
| Deck crack sealing | 2~6 |
| Deck repair and patching | 2~6 |
Disclaimer/Publisher’s Note: The statements, opinions and data contained in all publications are solely those of the individual author(s) and contributor(s) and not of MDPI and/or the editor(s). MDPI and/or the editor(s) disclaim responsibility for any injury to people or property resulting from any ideas, methods, instructions or products referred to in the content. |
© 2025 by the authors. Licensee MDPI, Basel, Switzerland. This article is an open access article distributed under the terms and conditions of the Creative Commons Attribution (CC BY) license (https://creativecommons.org/licenses/by/4.0/).
Share and Cite
Huang, W.; Wang, H.; Xiao, D. Impact of Concrete Sealer and Salt Usage on Concrete Bridge Deck Condition and Life Cycle Cost. Infrastructures 2025, 10, 87. https://doi.org/10.3390/infrastructures10040087
Huang W, Wang H, Xiao D. Impact of Concrete Sealer and Salt Usage on Concrete Bridge Deck Condition and Life Cycle Cost. Infrastructures. 2025; 10(4):87. https://doi.org/10.3390/infrastructures10040087
Chicago/Turabian StyleHuang, Wei, Hao Wang, and Danny Xiao. 2025. "Impact of Concrete Sealer and Salt Usage on Concrete Bridge Deck Condition and Life Cycle Cost" Infrastructures 10, no. 4: 87. https://doi.org/10.3390/infrastructures10040087
APA StyleHuang, W., Wang, H., & Xiao, D. (2025). Impact of Concrete Sealer and Salt Usage on Concrete Bridge Deck Condition and Life Cycle Cost. Infrastructures, 10(4), 87. https://doi.org/10.3390/infrastructures10040087