Abstract
The infrastructure construction of bridges is growing rapidly, and the quality of concrete structures is becoming increasingly stringent. However, the issue of cracks in concrete structures remains prominent. In on-site bridge crack detection, the traditional crack identification techniques fail to meet demands due to their inefficiency, inaccuracy, and the challenges posed by high-altitude conditions. In response to this, this paper proposes a bridge crack multi-task integration algorithm based on YOLOv8 object detection and DeepLabv3+ semantic segmentation. This integrated approach offers advantages such as high precision and low inference time. Testing wall cracks using this method, compared to the original approach, resulted in a 10.18% improvement in IOU and a 9.64% improvement in the F1 score. Regarding the detection model, it was deployed on edge computing devices. By applying the TensorRT inference acceleration framework, the camera FPS increased to 9.66, a 59.97% improvement compared to the version without the acceleration framework. This enabled accurate, real-time bridge crack detection on the edge computing devices. Furthermore, the edge computing device was also applied in a self-developed drone, which was tested on-site at the Donghai Bridge, providing a new solution for safe and reliable structural inspection.
1. Introduction
Bridges, as a critical component of modern integrated transportation systems, directly influence the safety and continuity of traffic through their structural health. According to the latest industry statistics, China’s highway bridges number 1.03 million, with a total length of approximately 85.76 million linear meters. Notably, 40% of in-service bridges have exceeded 20 years of operation, and a significant portion has begun to exhibit various forms of deterioration, among which cracking poses one of the most potentially hazardous issues [1]. The formation of bridge cracks is multifaceted, primarily driven by the cracking force exceeding the tensile strength of concrete. Contributing factors include design flaws, external loads, environmental corrosion, and sudden accident-induced damage. Extensive engineering practices and theoretical analyses have demonstrated that most reinforced concrete components inherently develop cracks. Micro-cracks (width < 0.05 mm) generally pose minimal risk to structural functionality. However, excessively wide cracks compromise the protective concrete layer, accelerating internal steel corrosion and triggering secondary cracks, deformations, or even structural failure. Rapidly propagating load-bearing cracks may lead to the catastrophic loss of load-carrying capacity and potential collapse. Consequently, an intrinsic mechanical relationship exists between crack characteristics and structural service performance [2].
Current on-site bridge inspection methods, predominantly reliant on manual crack identification, suffer from limitations such as high subjectivity, susceptibility to omissions and errors, and insufficient accuracy [3]. Inspection outcomes heavily depend on personnel expertise, while manual detection proves inefficient and fails to comprehensively document crack details. Traditional crack identification techniques thus fall short of meeting the timeliness and precision demands of practical engineering applications. Advances in biology, swarm intelligence algorithms, and computational hardware have allowed digital image-based methods to emerge as effective tools for structural surface crack inspection, garnering extensive research and application. Compared to the conventional manual approaches, digital image processing offers objective and reliable crack identification, precise morphological and parametric documentation, reduced risks associated with elevated operations, and significantly enhanced detection efficiency, underscoring its practical advantages.
In the intelligent identification of bridge cracks using digital image processing, the tasks are primarily categorized into object detection and semantic segmentation. In the domain of bridge crack object detection, Zou et al. [4] proposed an improved YOLOv3 algorithm for bridge surface defect recognition, embedding a spatial pooling module in the detection layer to enhance semantic feature extraction, enabling the real-time detection of bridge defects. Wei et al. [5] introduced a lightweight, grid-based bridge crack detection technique using depthwise separable convolution and pruning techniques, significantly reducing model parameters. Peng et al. [6] developed YOLO-lump and YOLO-crack to improve multi-defect detection capabilities, forming a dual-network rapid-detection algorithm for bridge surface defects. Geng et al. [7] proposed an improved YOLOv8-based embedded road crack detection algorithm, achieving real-time and accurate detection on edge devices. Li et al. [8] implemented efficient concrete crack detection using the MobileNetV2 and adaptive thresholding techniques, precisely localizing cracks through sliding windows and non-maximum suppression (NMS). While current object detection algorithms demonstrate rapid and high-precision crack localization, their bounding boxes lack a detailed geometric characterization of cracks.
In this context, semantic segmentation algorithms address this limitation through pixel-level classification, enabling the precise delineation of crack contours and the direct measurement of geometric attributes (e.g., shape, size), thereby providing richer and more accurate data for detailed bridge damage assessments. This enhances the scientific rigor of structural integrity evaluations and mitigation strategies. In bridge crack semantic segmentation, Yu et al. [9] proposed a UAV-based Mask R-CNN algorithm for the remote, non-contact, and automated detection of cracks on tall bridge surfaces. Zhao et al. [10] improved DeeplabV3+ with transfer learning, achieving high accuracy on small datasets while reducing annotation costs. Liu et al. [11] developed a two-stage algorithm combining YOLOv5 and U-Net3+, although their detection results lacked effective integration with the segmentation outcomes. Hammouch et al. [12] employed a custom CNN and pre-trained VGG-19 model for crack classification on Moroccan pavements, offering new insights into the joint analysis of crack types and geometric features. Di Benedetto et al. [13] enhanced segmentation performance using a U-Net with ResNet50 encoder and data augmentation, validating crack width measurement accuracy via UAV imagery. Alfaro et al. [14] generated 3D bridge models integrated with CNN algorithms, achieving high-precision crack detection on Peru’s Villena Rey Bridge and accurately mapping the results to digital twins.
Our literature review revealed that the existing studies focus solely on either object detection or semantic segmentation, lacking effective synergy. To address this gap, this study proposes a multi-task integrated crack detection algorithm that combines object detection and semantic segmentation, achieving superior inference speed and accuracy. Furthermore, the crack detection model is successfully deployed on a low-cost edge device (NVIDIA Jetson Nano) and integrated into a custom-developed UAV. Field tests on Donghai Bridge demonstrate that both efficiency and accuracy meet practical application requirements.
2. Intelligent Recognition Technology for Bridge Cracks
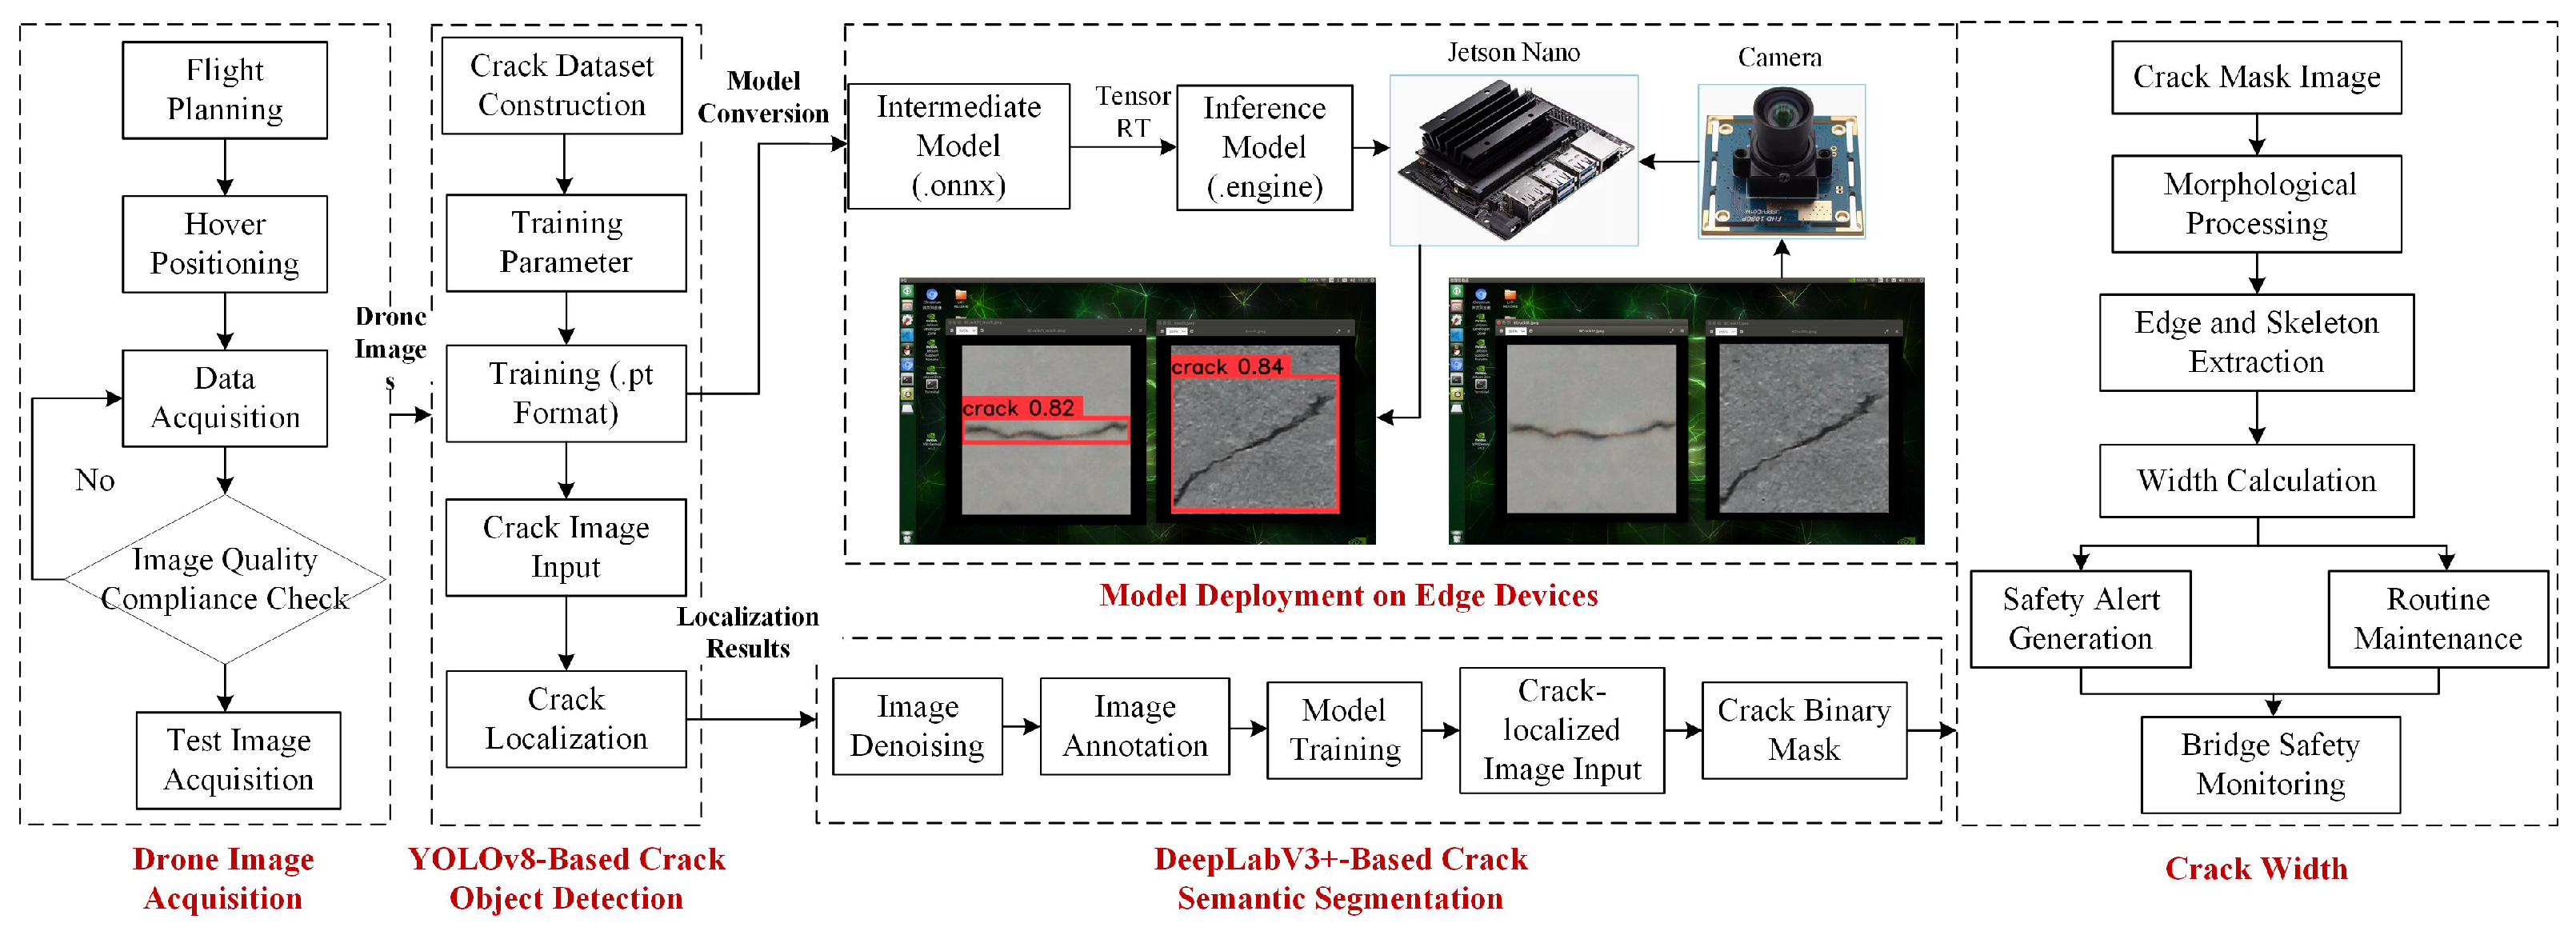
This study aims to advance bridge crack detection toward automation and digitization through digital imaging methods, systematically investigating intelligent crack identification technologies from multiple perspectives including dataset construction, object detection algorithms, semantic segmentation algorithms, and edge device deployment, as illustrated in the overall workflow diagram (Figure 1).
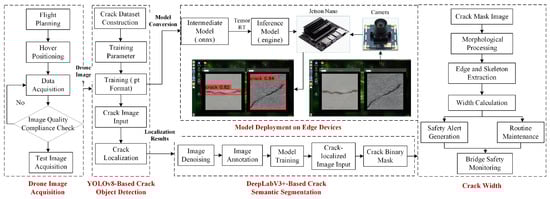
Figure 1.
Intelligent identification technology process for bridge cracks.
2.1. Dataset Construction
To verify the effectiveness of the proposed method, a dataset consisting of 2079 images of surface cracks on concrete bridges was constructed for the detection model. This dataset included 1040 images from the SDNET2018 dataset [15] (narrow crack images captured under good lighting conditions from the webs, bottom slabs, and bridge piers of concrete bridges), with a resolution of 256 × 256 pixels, and 1039 images from the Bridge Crack Library 2.0 (BCL2.0) dataset [16] (synthetic crack images generated using generative adversarial networks), with a resolution of 256 × 256 pixels. Some training sample images are shown in Figure 2. For the segmentation model, a dataset containing 21,025 images of surface cracks on concrete bridges was constructed, including 2025 images from the SDNET2018 dataset and 19,000 images from the BCL2.0 dataset. Some training sample images are shown in Figure 3. LabelImg was used for annotation, and the training and validation samples were randomly divided in an 8:2 ratio. The dataset covered various environmental disturbances, including cracks of different pixel widths, rough textures on concrete surfaces, holes, and other defects. These features closely resemble the actual field conditions of bridge cracks.

Figure 2.
YOLOv8 model training samples.
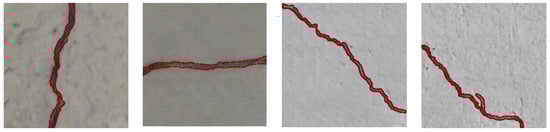
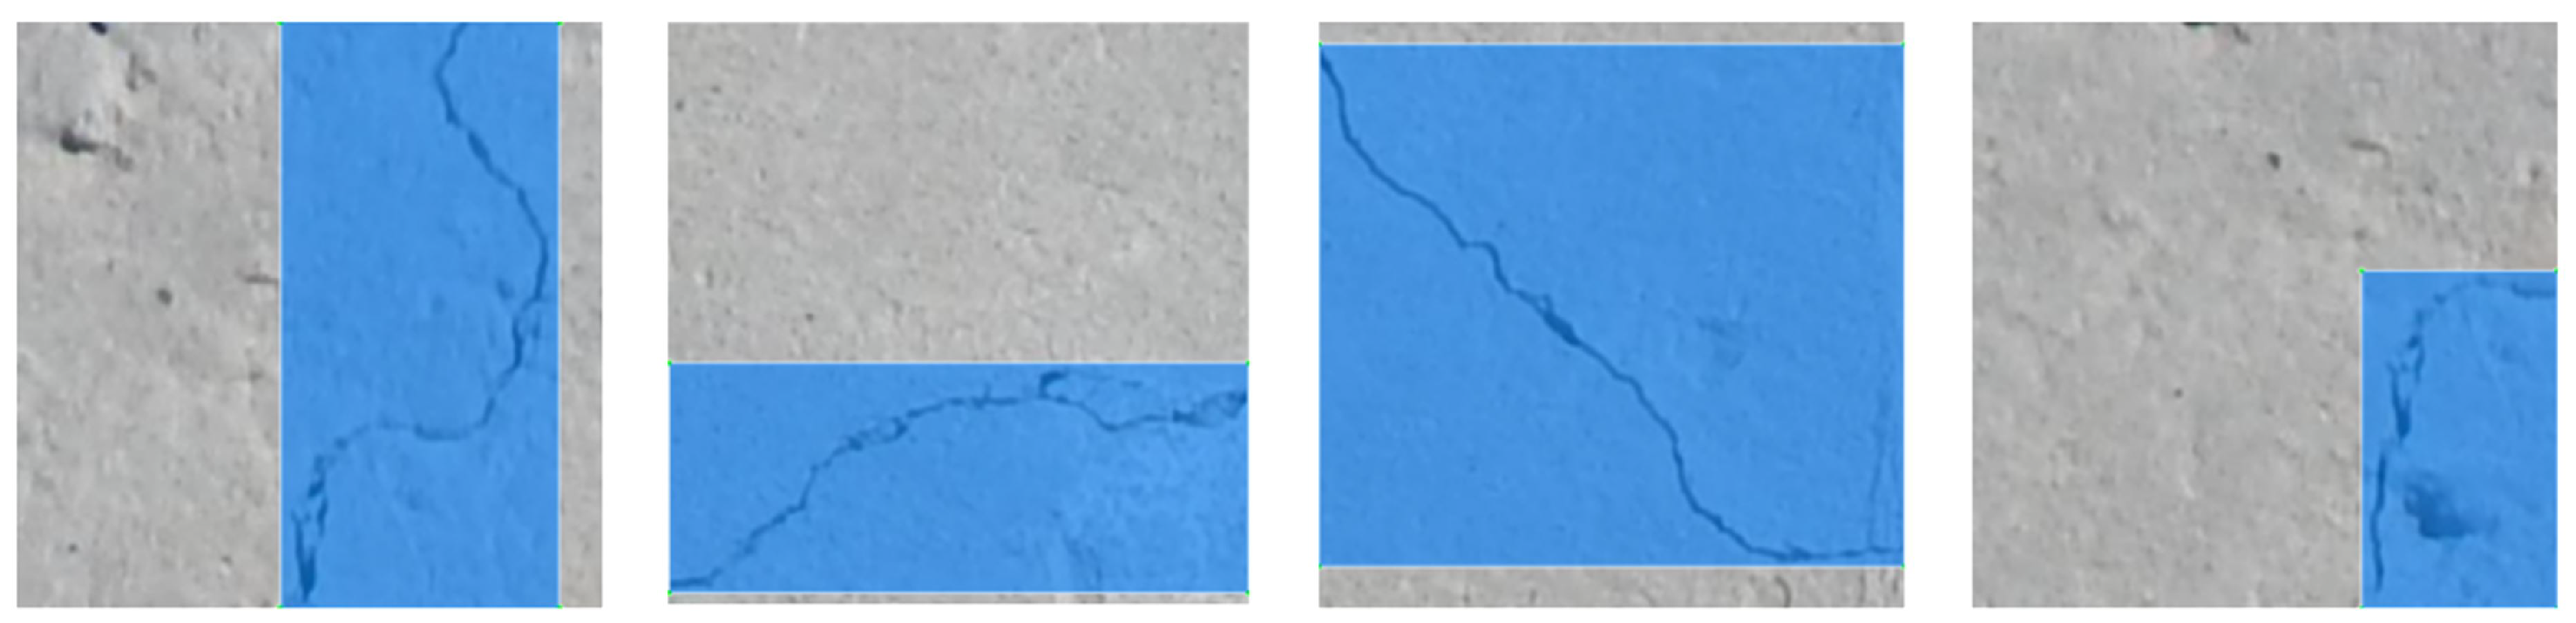
Figure 3.
DeepLabv3+ model training samples.
2.2. YOLOv8 Object Detection Algorithm
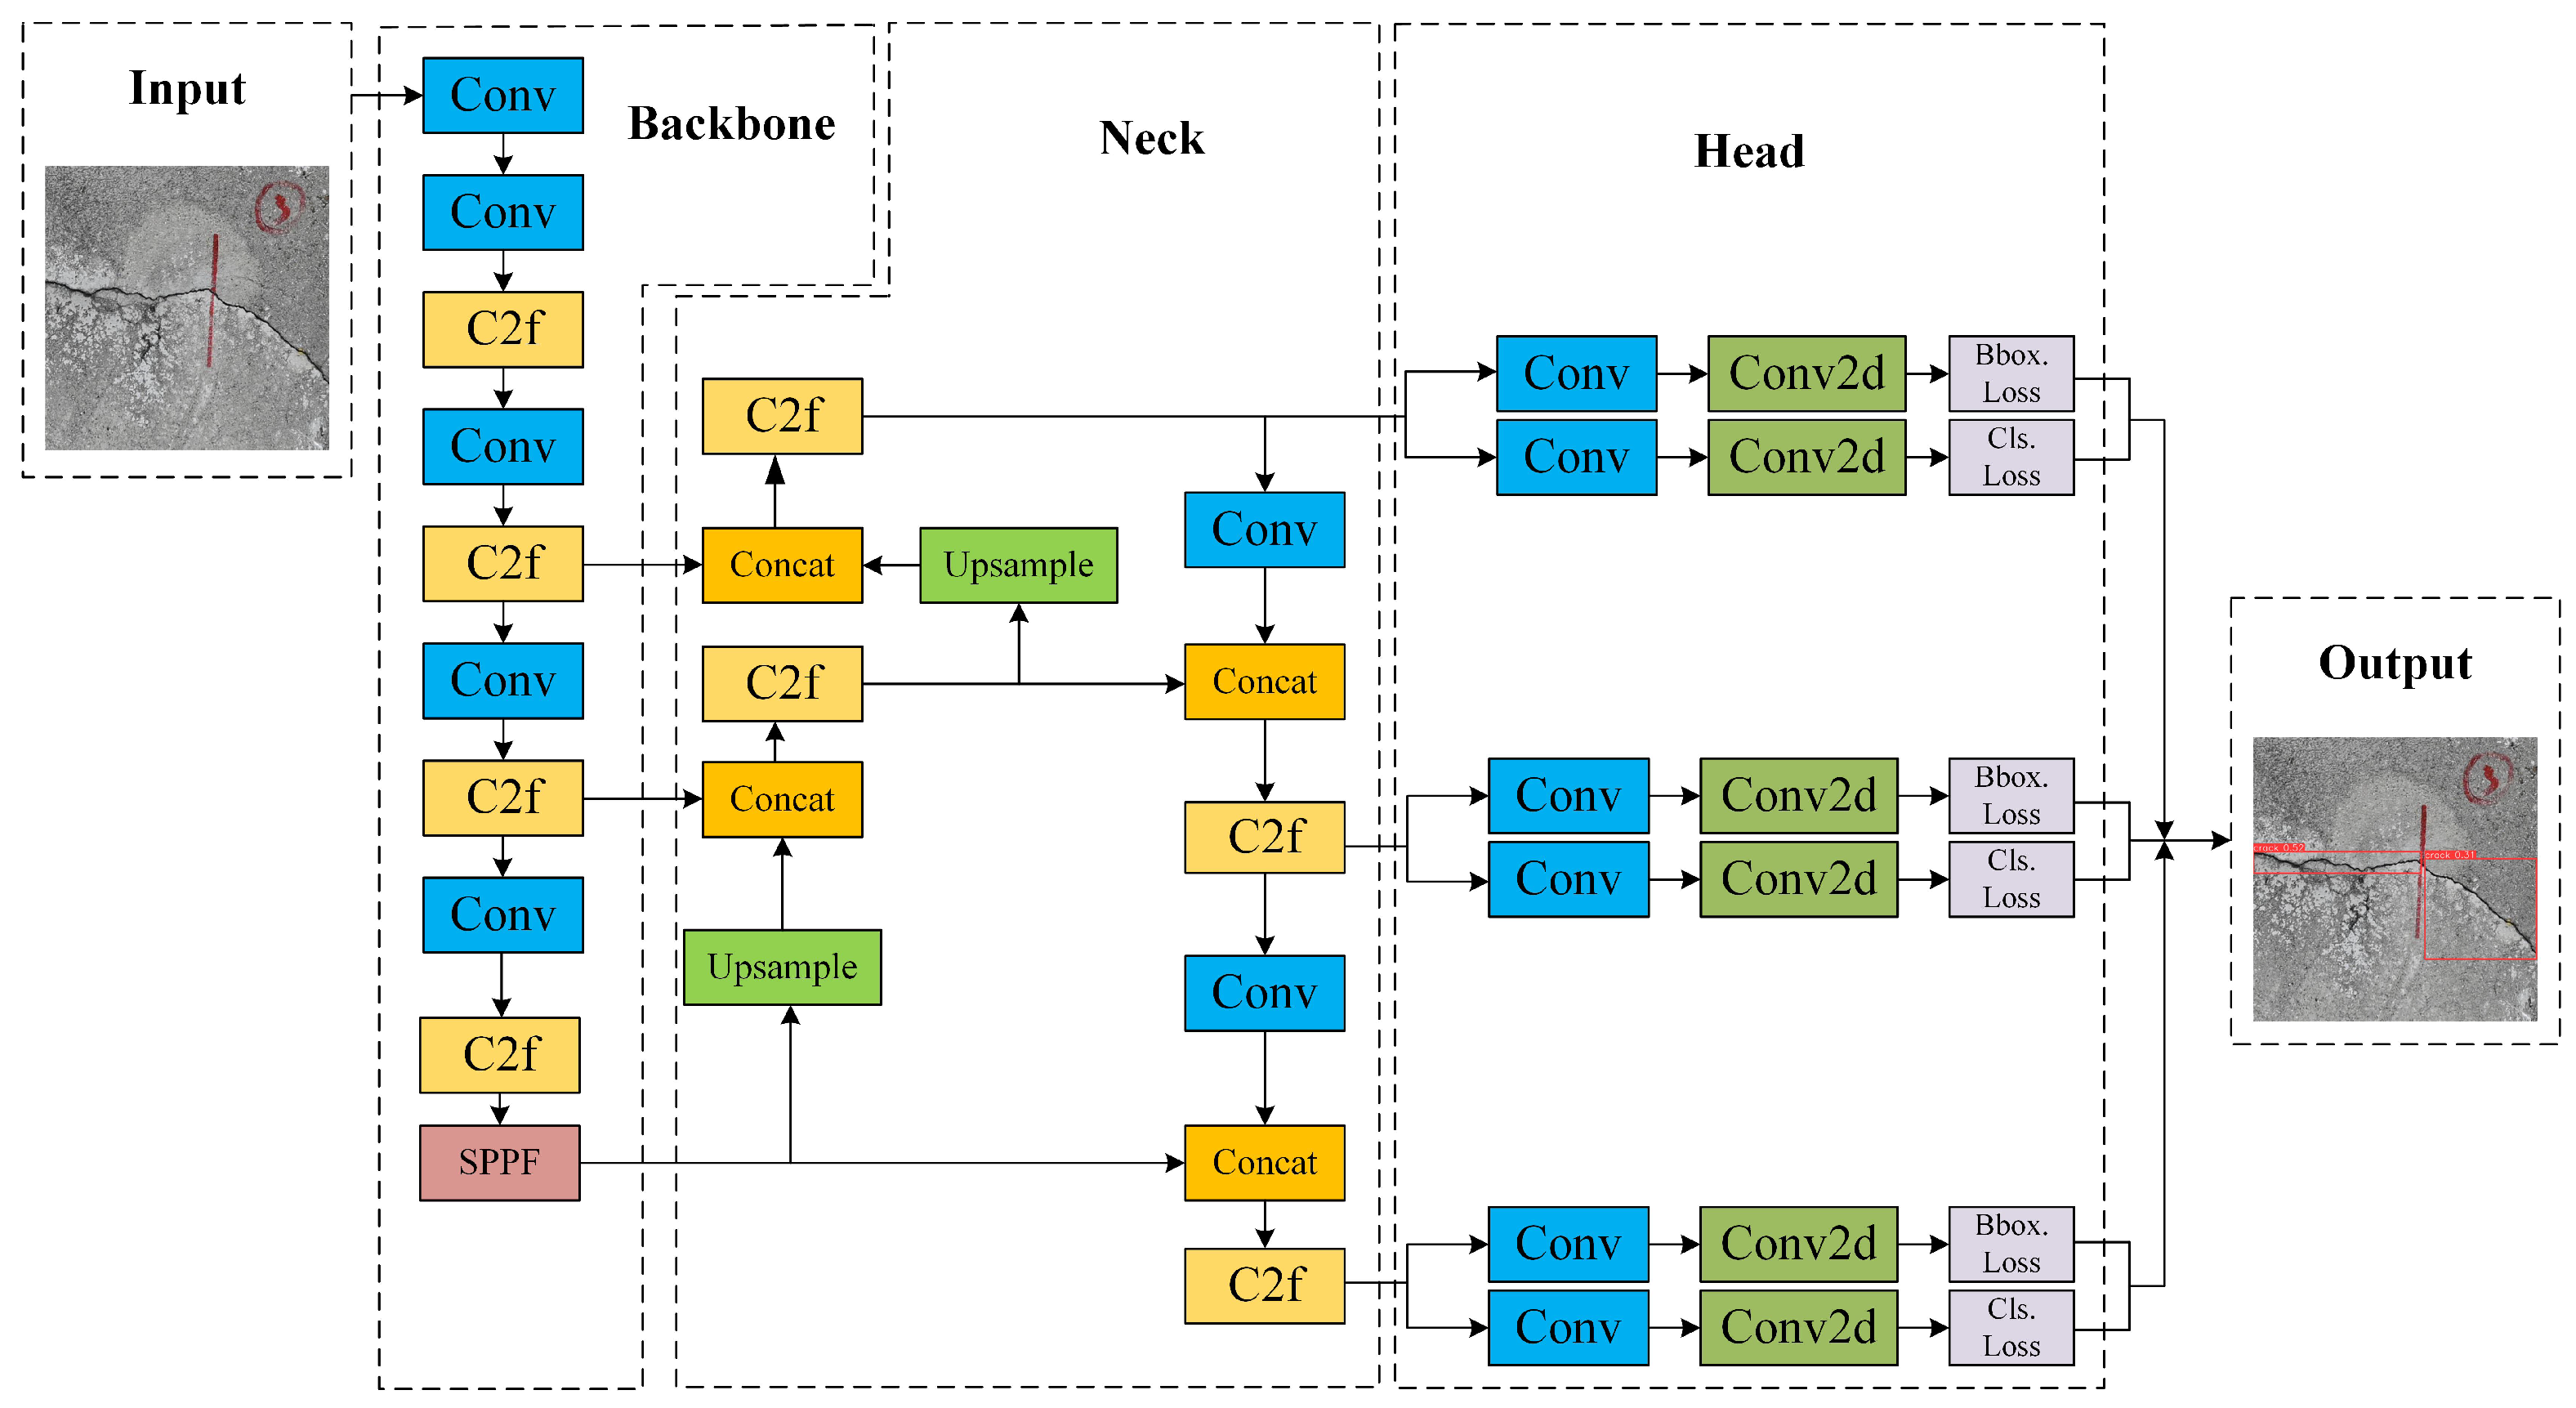
The YOLOv8 [14] architecture comprises the following four components: Input, Backbone, Neck, and Head. Key innovations in its network design include enhancements to the Backbone network through the integration of a Cross-Stage Partial Network (CSPNet) [17] and Spatial Pyramid Pooling (SPP) [18], which strengthen its multi-scale feature extraction capabilities. In the Neck section, the upsampling process is simplified, and lightweight structures are introduced to improve adaptability to deformable targets. The Head adopts a decoupled structure and an anchor-free approach, reducing complexity while enhancing efficiency and accuracy in target localization and size prediction. These improvements enable YOLOv8 to achieve superior performance and practicality in object detection. The network architecture is illustrated in Figure 4.
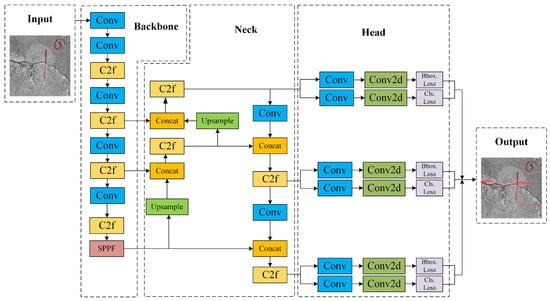
Figure 4.
YOLOv8 network architecture diagram.
2.3. DeepLabV3+ Semantic Segmentation Algorithm
DeepLabV3+ [19] is an end-to-end semantic segmentation model based on an encoder–decoder architecture. In this model, input images are first processed by a feature extraction Backbone network to generate the following two types of features: (1) shallow feature maps extracted in the early stages, and (2) deep feature maps obtained after passing through the entire Backbone. These deep features are fed into a spatial pyramid pooling module, where multi-scale fusion is achieved using dilated convolutions with rates of 6, 12, and 18, alongside 1 × 1 convolutions and global average pooling. This process produces highly integrated, deep-level feature maps, forming the encoder portion of DeepLabV3+.
During the decoding phase, shallow features are fused with the trained deep-level feature maps. To achieve effective integration, the deep features are upsampled and combined with shallow features, followed by a 3 × 3 convolution. Finally, the output is upsampled to match the original image resolution, yielding the final segmentation result. The network architecture is depicted in Figure 5.
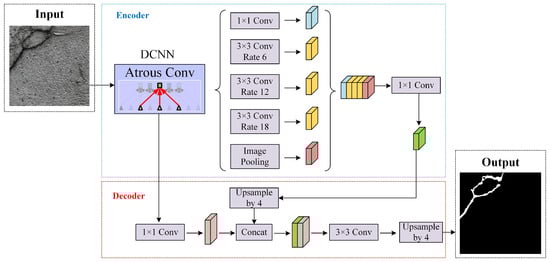
Figure 5.
DeepLabv3+ network architecture diagram.
2.4. Crack Multi-Task Integration Algorithm
The multi-task integrated crack algorithm achieves effective synergy between crack detection and segmentation. First, the object detection algorithm precisely localizes cracks in the input image, identifying their positional information and spatial extent. Following detection, the algorithm performs refined segmentation on these identified crack regions, generating binary masks based on crack morphology and edge characteristics. The workflow is illustrated in Figure 6.
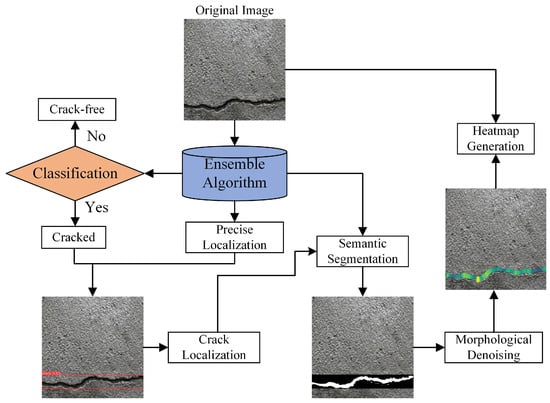
Figure 6.
Crack multi-task integration algorithm. The color gradient on the right represents the pixel-scale width distribution at skeleton points.
The strength of this multi-task integrated algorithm lies in its combination of detection and segmentation within an end-to-end processing framework. By directly feeding the detected crack regions into the segmentation model, the algorithm focuses computational resources on crack-specific areas, thereby minimizing redundant calculations and mitigating interference from background noise.
3. Train Model
3.1. Evaluation Metrics for Detection Model
The evaluation metrics for the detection model include Accuracy, Precision, Recall, and F1 score to assess model accuracy. Parameters, GFLOPs, and FPS are used to evaluate the model’s lightweight design and inference speed. For binary classification tasks, the confusion matrix is typically a 2 × 2 matrix comprising the following four elements: True Positive (TP), True Negative (TN), False Positive (FP), and False Negative (FN). The formulas for these metrics are defined as follows:
For the segmentation model, the selected metrics include mean Average Precision (mAP), mean Intersection over Union (mIoU), and Dice Coefficient. The corresponding formulas are as follows:
3.2. YOLOv8 Model Training
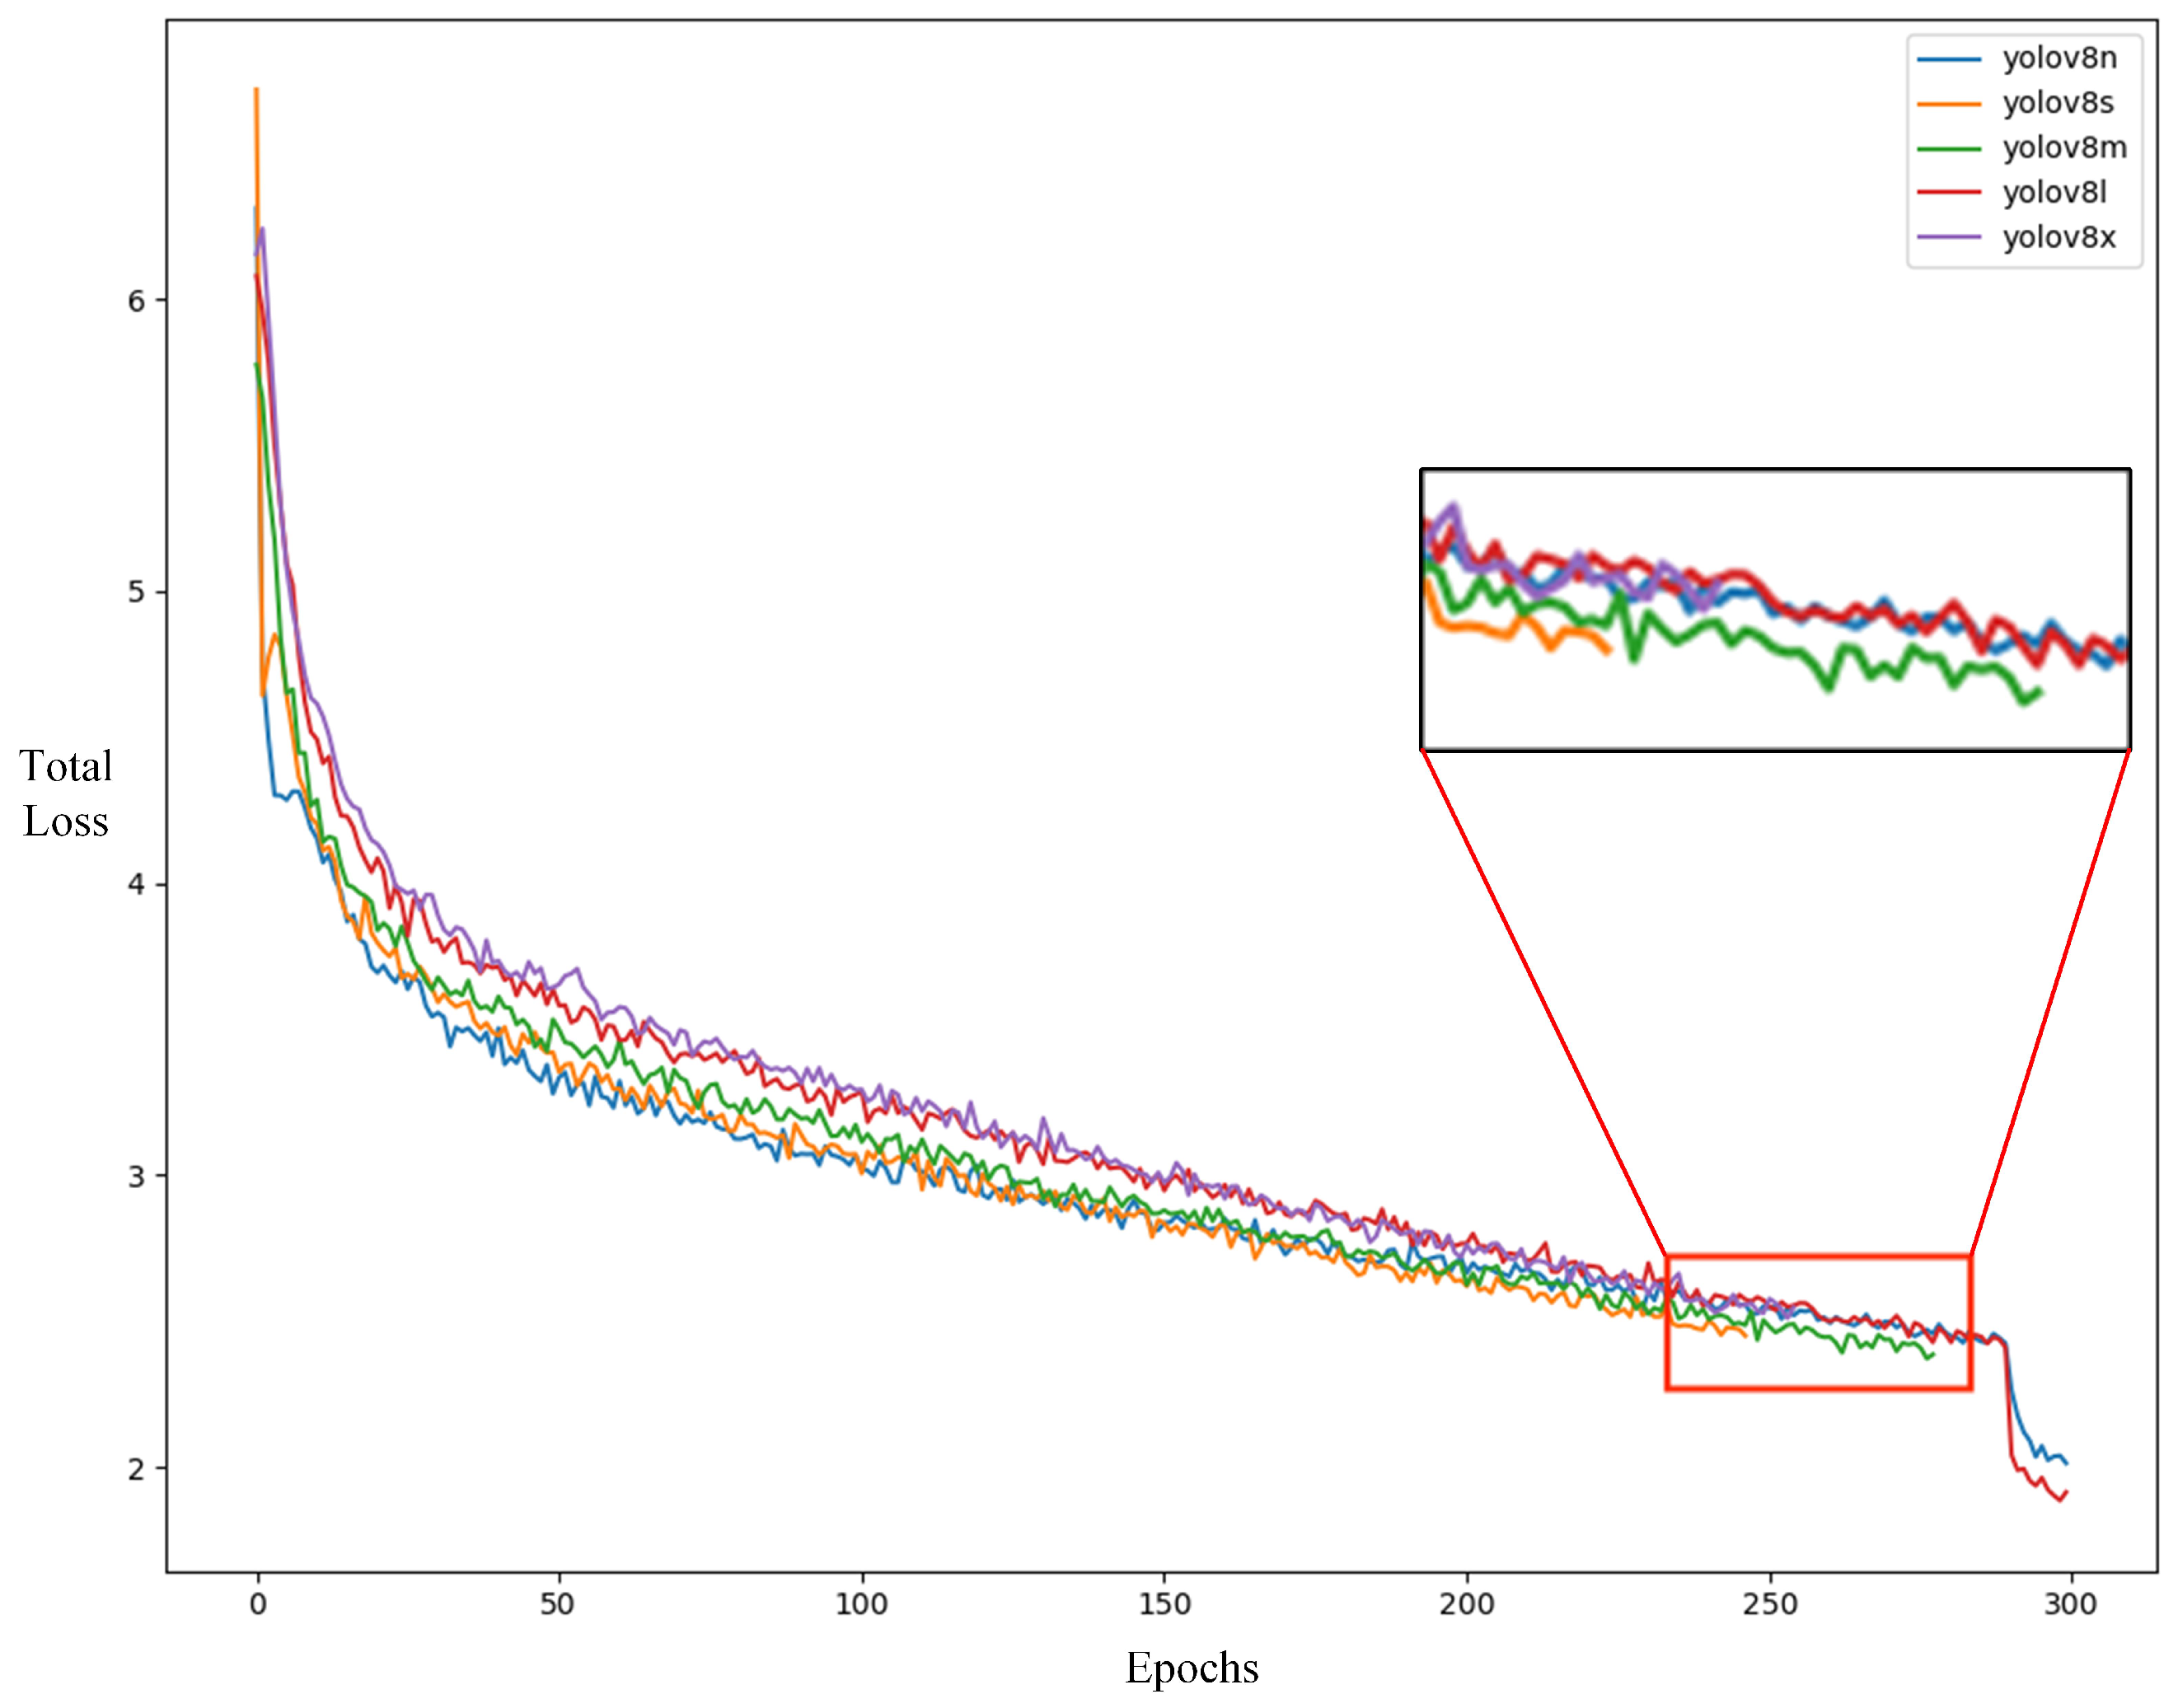
For the training of the YOLOv8 detection model, this study employed a transfer learning approach, using the pre-trained weights of the YOLOv8n, s, m, l, and x models, which were trained on the COCO dataset, as the initial weights. Default parameters were used, with 300 training epochs, and the best training weights were selected to construct the prediction model. The total loss during training included classification loss (Class loss) and bounding box loss (IOU loss, DFL loss). The model initialized with YOLOv8s, m, and x weights reached convergence around 260 epochs, as shown in Figure 7. According to Table 1, the dataset constructed in this study achieved superior F1 scores with the YOLOv8n and YOLOv8l models. However, YOLOv8n offered better performance in terms of detection speed and model size. Therefore, this model was chosen for the model experiments and for deployment on the edge devices in this study.

Figure 7.
Total loss during model training.

Table 1.
Performance comparison of YOLOv8 models.
3.3. DeepLabv3+ Model Training
To train the DeepLabv3+ segmentation model, we adopted the default hyperparameters and conducted 300 training epochs, utilizing the optimally trained weights to construct the segmentation model. Comparative experiments were performed with three Backbone networks—MobileNetV2 [20], ResNet-101 [21], and Xception-65 [22]—and two loss functions, namely Cross-Entropy Loss [23] and Focal Loss [24]. To validate the effectiveness of the synthetic crack images generated via generative adversarial networks (BCL 2.0), comparative tests were conducted against the original Bridge Crack Library (BCL) dataset [25], with the experimental results summarized in Table 2. During model validation, the configuration combining ResNet-101 as the Backbone network and Cross-Entropy Loss achieved the highest mean Intersection over Union (mIoU), which was subsequently selected for further analysis.
Table 2.
Algorithm Accuracy Comparison.
3.4. Crack Width Calculation
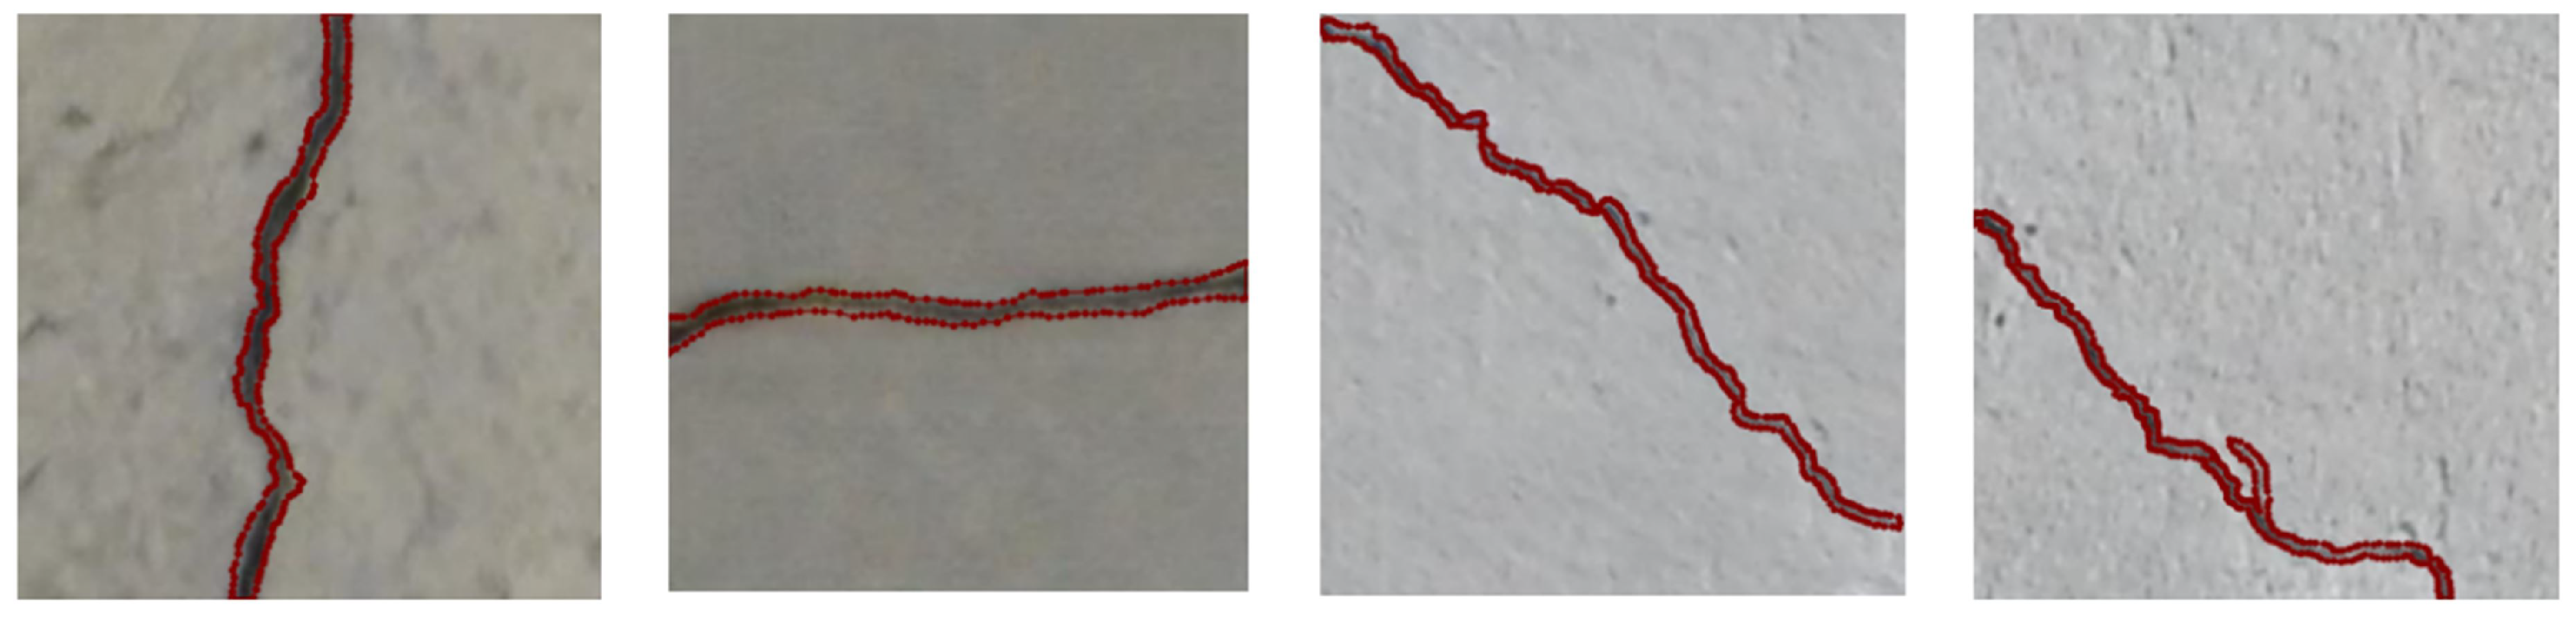
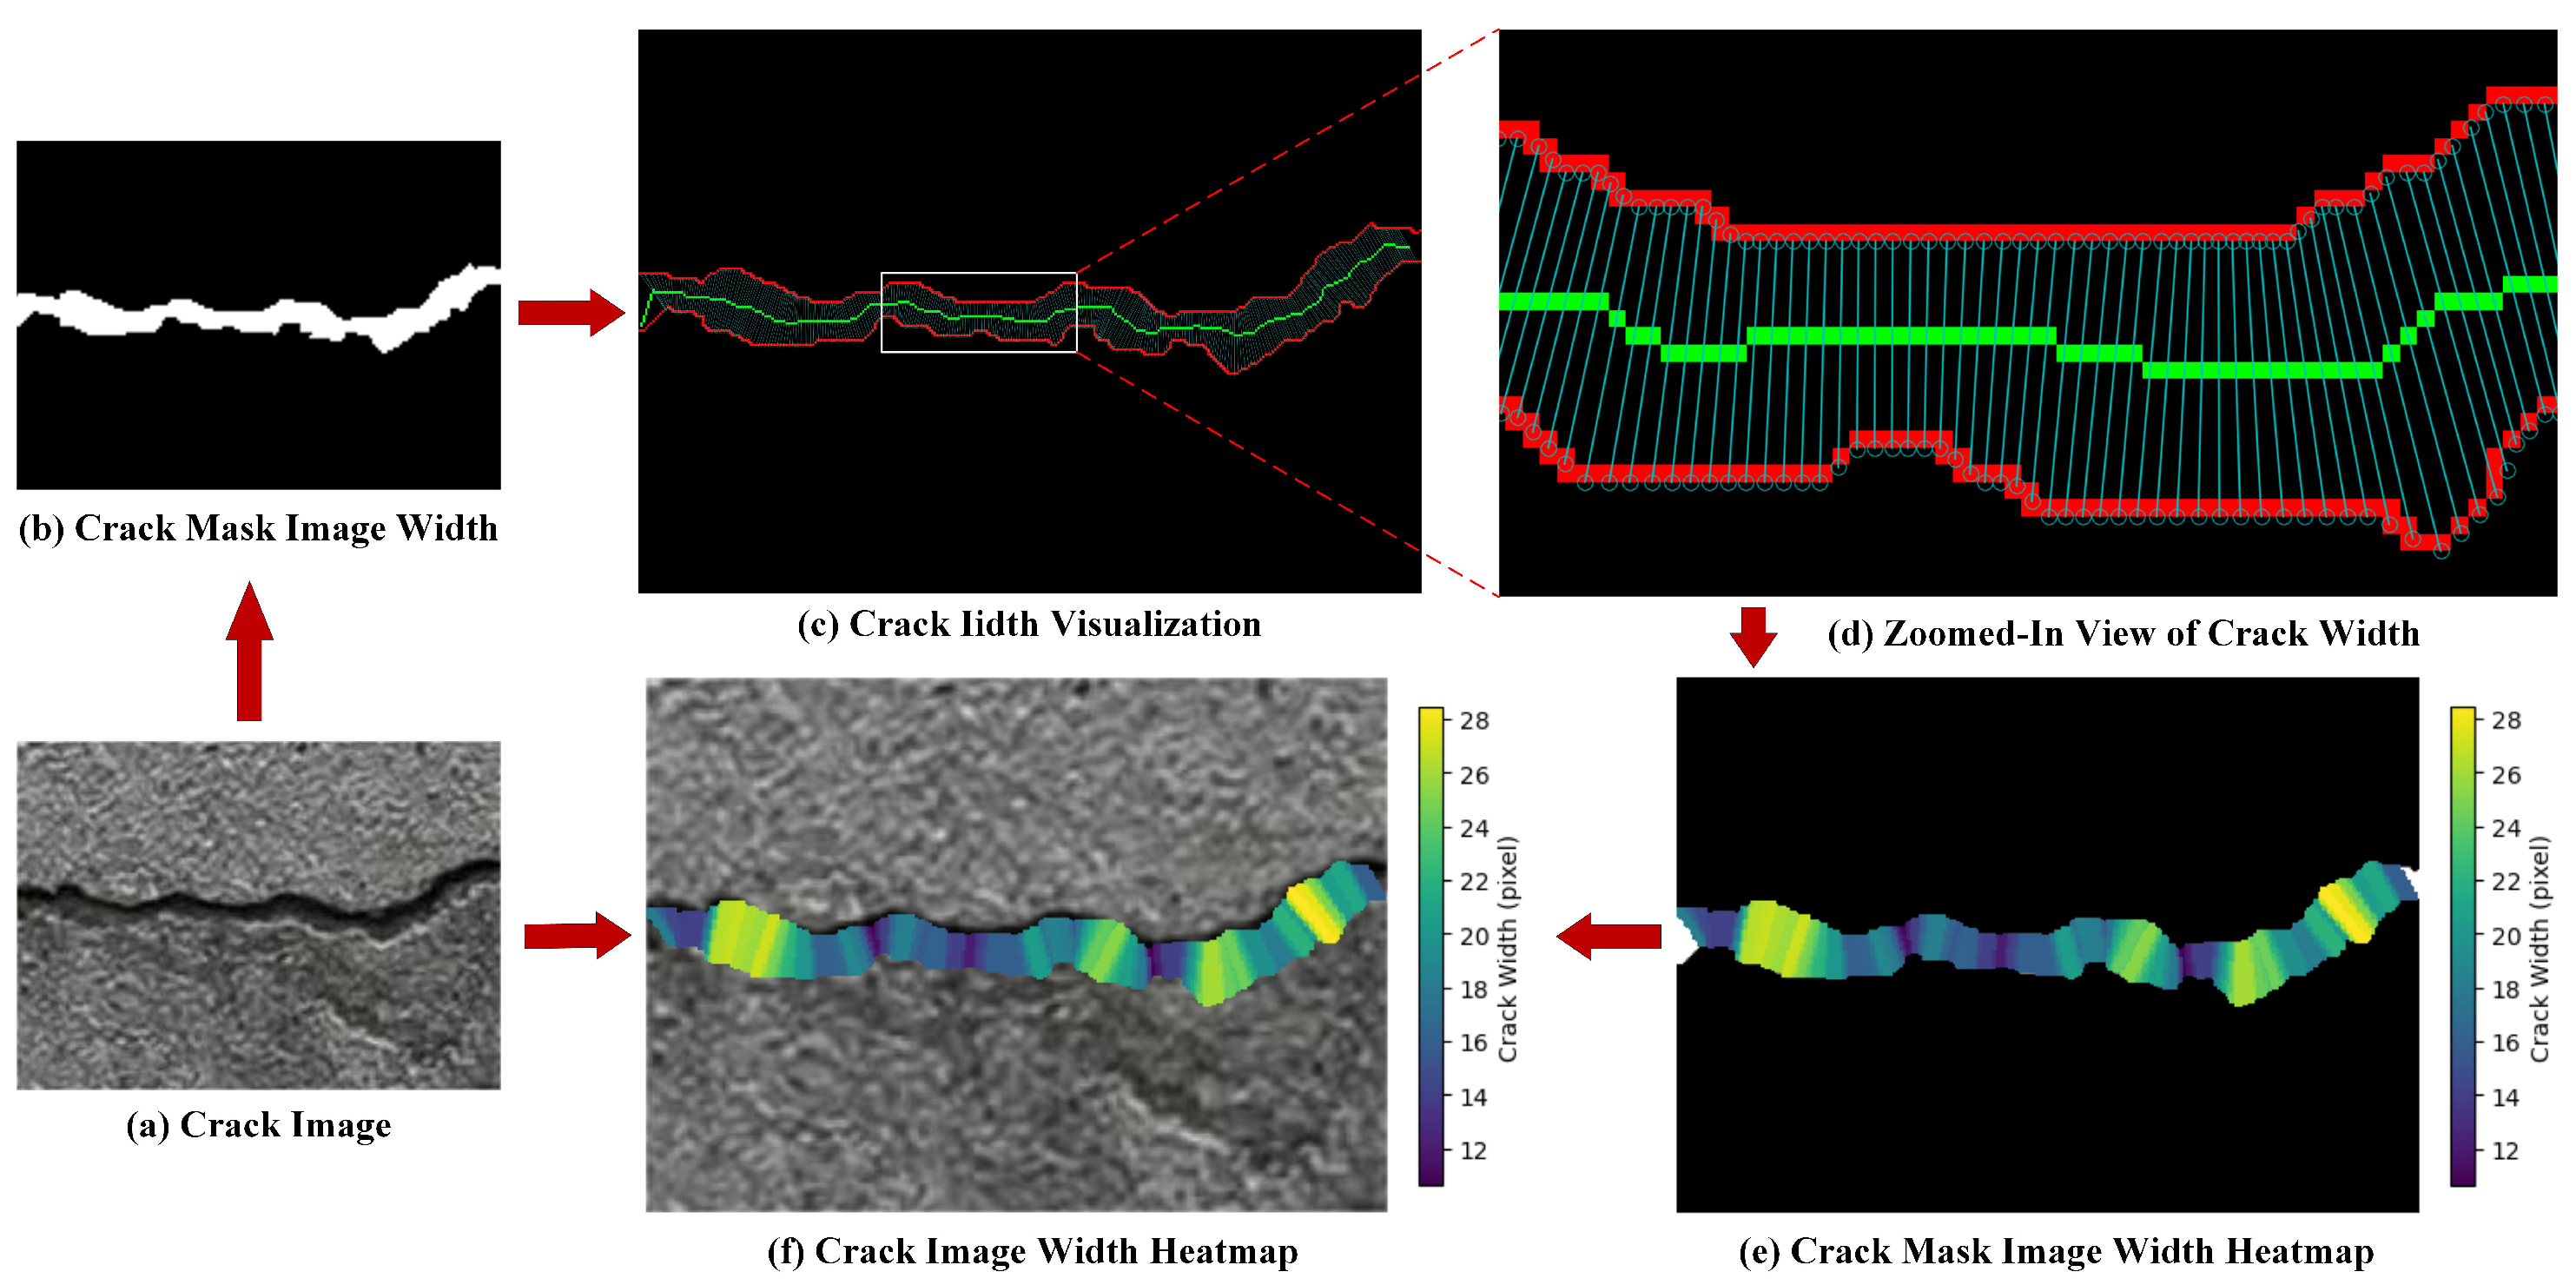
After obtaining the crack mask from the aforementioned process, the crack width parameters could be calculated. In pixel-based images, the crack width was defined as the distance between two intersection points of a perpendicular line (drawn from a skeleton point to the local central axis) with the crack edges, which represented the crack width at that specific point [26]. The crack width calculation involved the following four-step methodology: (1) Determine the tangential direction of the skeleton line at the width measurement point; (2) identify the perpendicular direction to the skeleton line at the width measurement point; (3) locate intersections between the perpendicular line and the two crack edges; (4) calculate the distance between these two intersections, which corresponds to the crack width at the measurement point.
Upon acquiring the crack width data, a width heatmap was generated based on the pixel-scale crack dimensions. The bounding box coordinates were extracted, and the width heatmap was mapped onto the original image using these coordinates to establish a spatial correspondence between the crack width information and the original image. The overall workflow is illustrated in Figure 8.
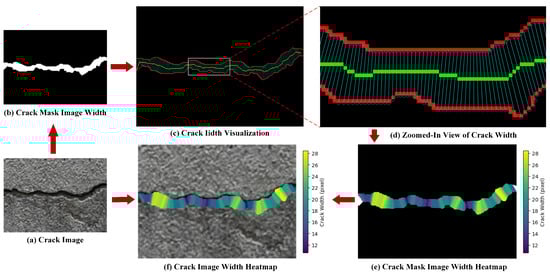
Figure 8.
Crack width calculation process. Red lines: crack boundaries; Green lines: crack skeleton lines.
4. Experimental Validation
4.1. Experimental Environment
The model training was conducted on a cloud server running Windows 10, with the following hardware configuration: Intel(R) Xeon(R) Gold 6226R CPU @ 2.90 GHz 2.89 GHz (2 processors), 64 GB of RAM, and two Nvidia GeForce RTX 3090 GPUs, each with 24 GB of video memory. The software environment consisted of the PyTorch 2.0.1 deep learning framework and the CUDA 11.7 parallel computing framework.
The trained model was then deployed to a Jetson Nano edge device, with hardware specifications as detailed in Table 3. An external USB camera was used to capture real-time video, with the frames per second (FPS) of the video serving as the primary performance evaluation metric. The detailed configuration of the USB camera is provided in Table 4.
Table 3.
Summary of hardware configuration for Jetson Nano.
Table 4.
Specifications of USB camera.
4.2. Model Validation
The above section outlined the main technologies and overall process of intelligent crack identification technology for bridges, as well as provided a study on the feasibility and advantages of the technologies used. To further validate its rationality and effectiveness, the following experimental research was conducted.
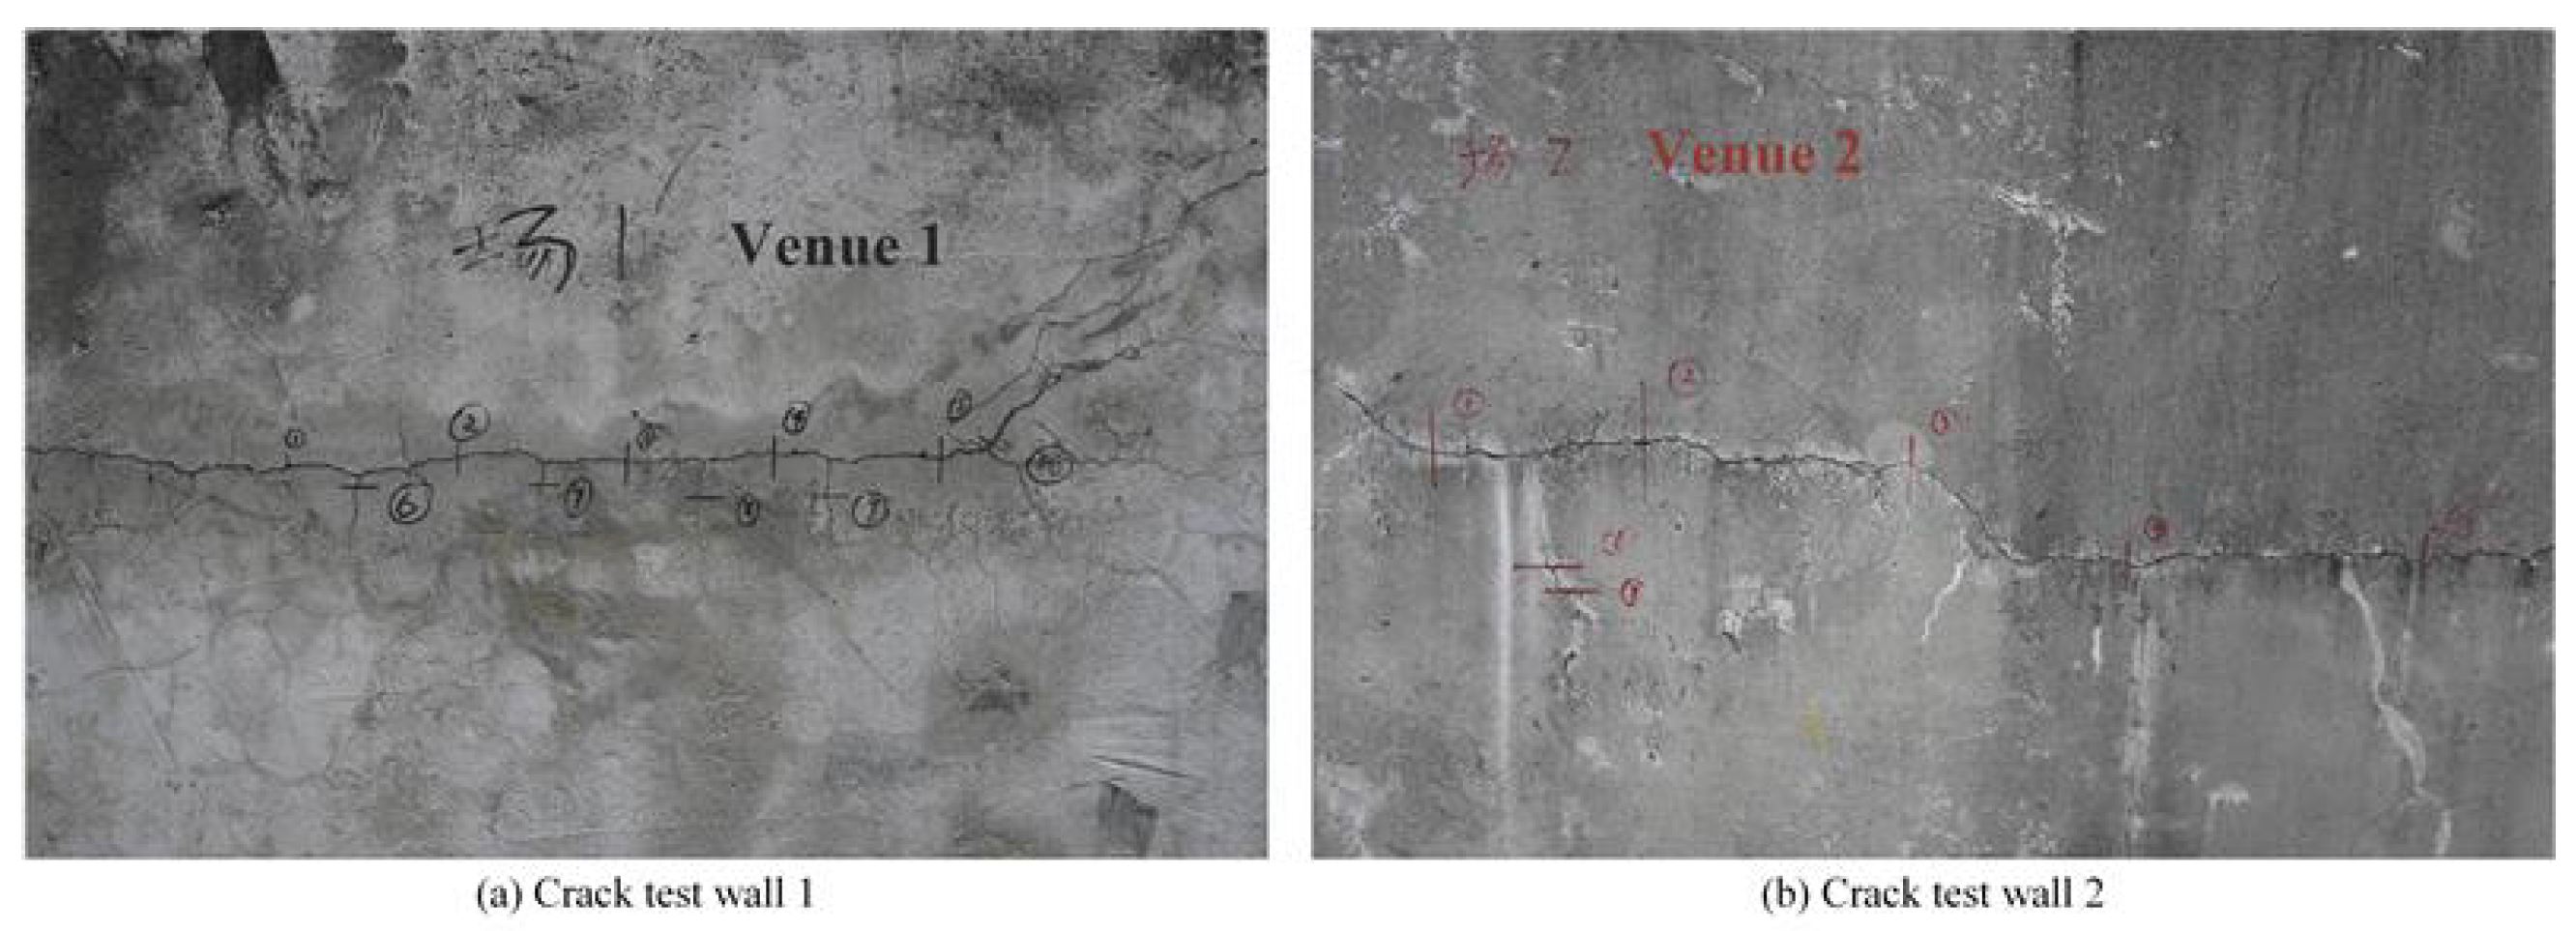
The experiment used the Nikon Z30 camera, with a sensor size of 23.5 × 15.7 mm, a focal length of 18.0 mm, and a maximum shooting resolution of 5568 × 3712 pixels. The experimental subject was a reinforced concrete bridge structural crack test wall from a university, with a shooting distance of 1 m, as shown in Figure 9. Since the cracks occupied only a small portion of the image, directly segmenting the entire original image would result in the inclusion of a large amount of background pixels in the computation, potentially leading to the misidentification of non-crack areas as cracks. To improve efficiency and reduce False Positives, this study employed a sliding window technique to pre-scan the original image, followed by the use of the YOLOv8 model for crack detection. The detected crack regions were then used as input into the DeepLabv3+ model for precise segmentation, significantly reducing the number of pixels processed and detection time while effectively eliminating most of the noise. Randomly selected images with crack targets from the sliding window were used for verification of the crack multi-task algorithm, with the overall process diagram shown in Figure 10.
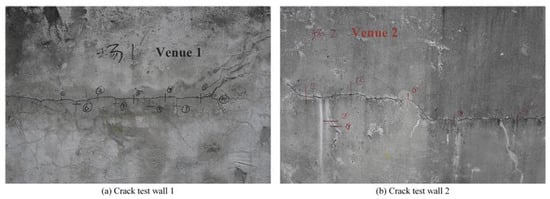
Figure 9.
Reinforced concrete structure test wall.
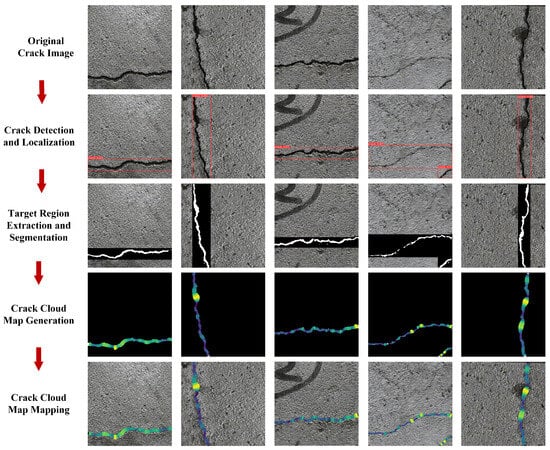
Figure 10.
Identification of cracks on surface of test wall. Color-encoded heatmap representing pixel-scale width distribution along crack skeleton points.
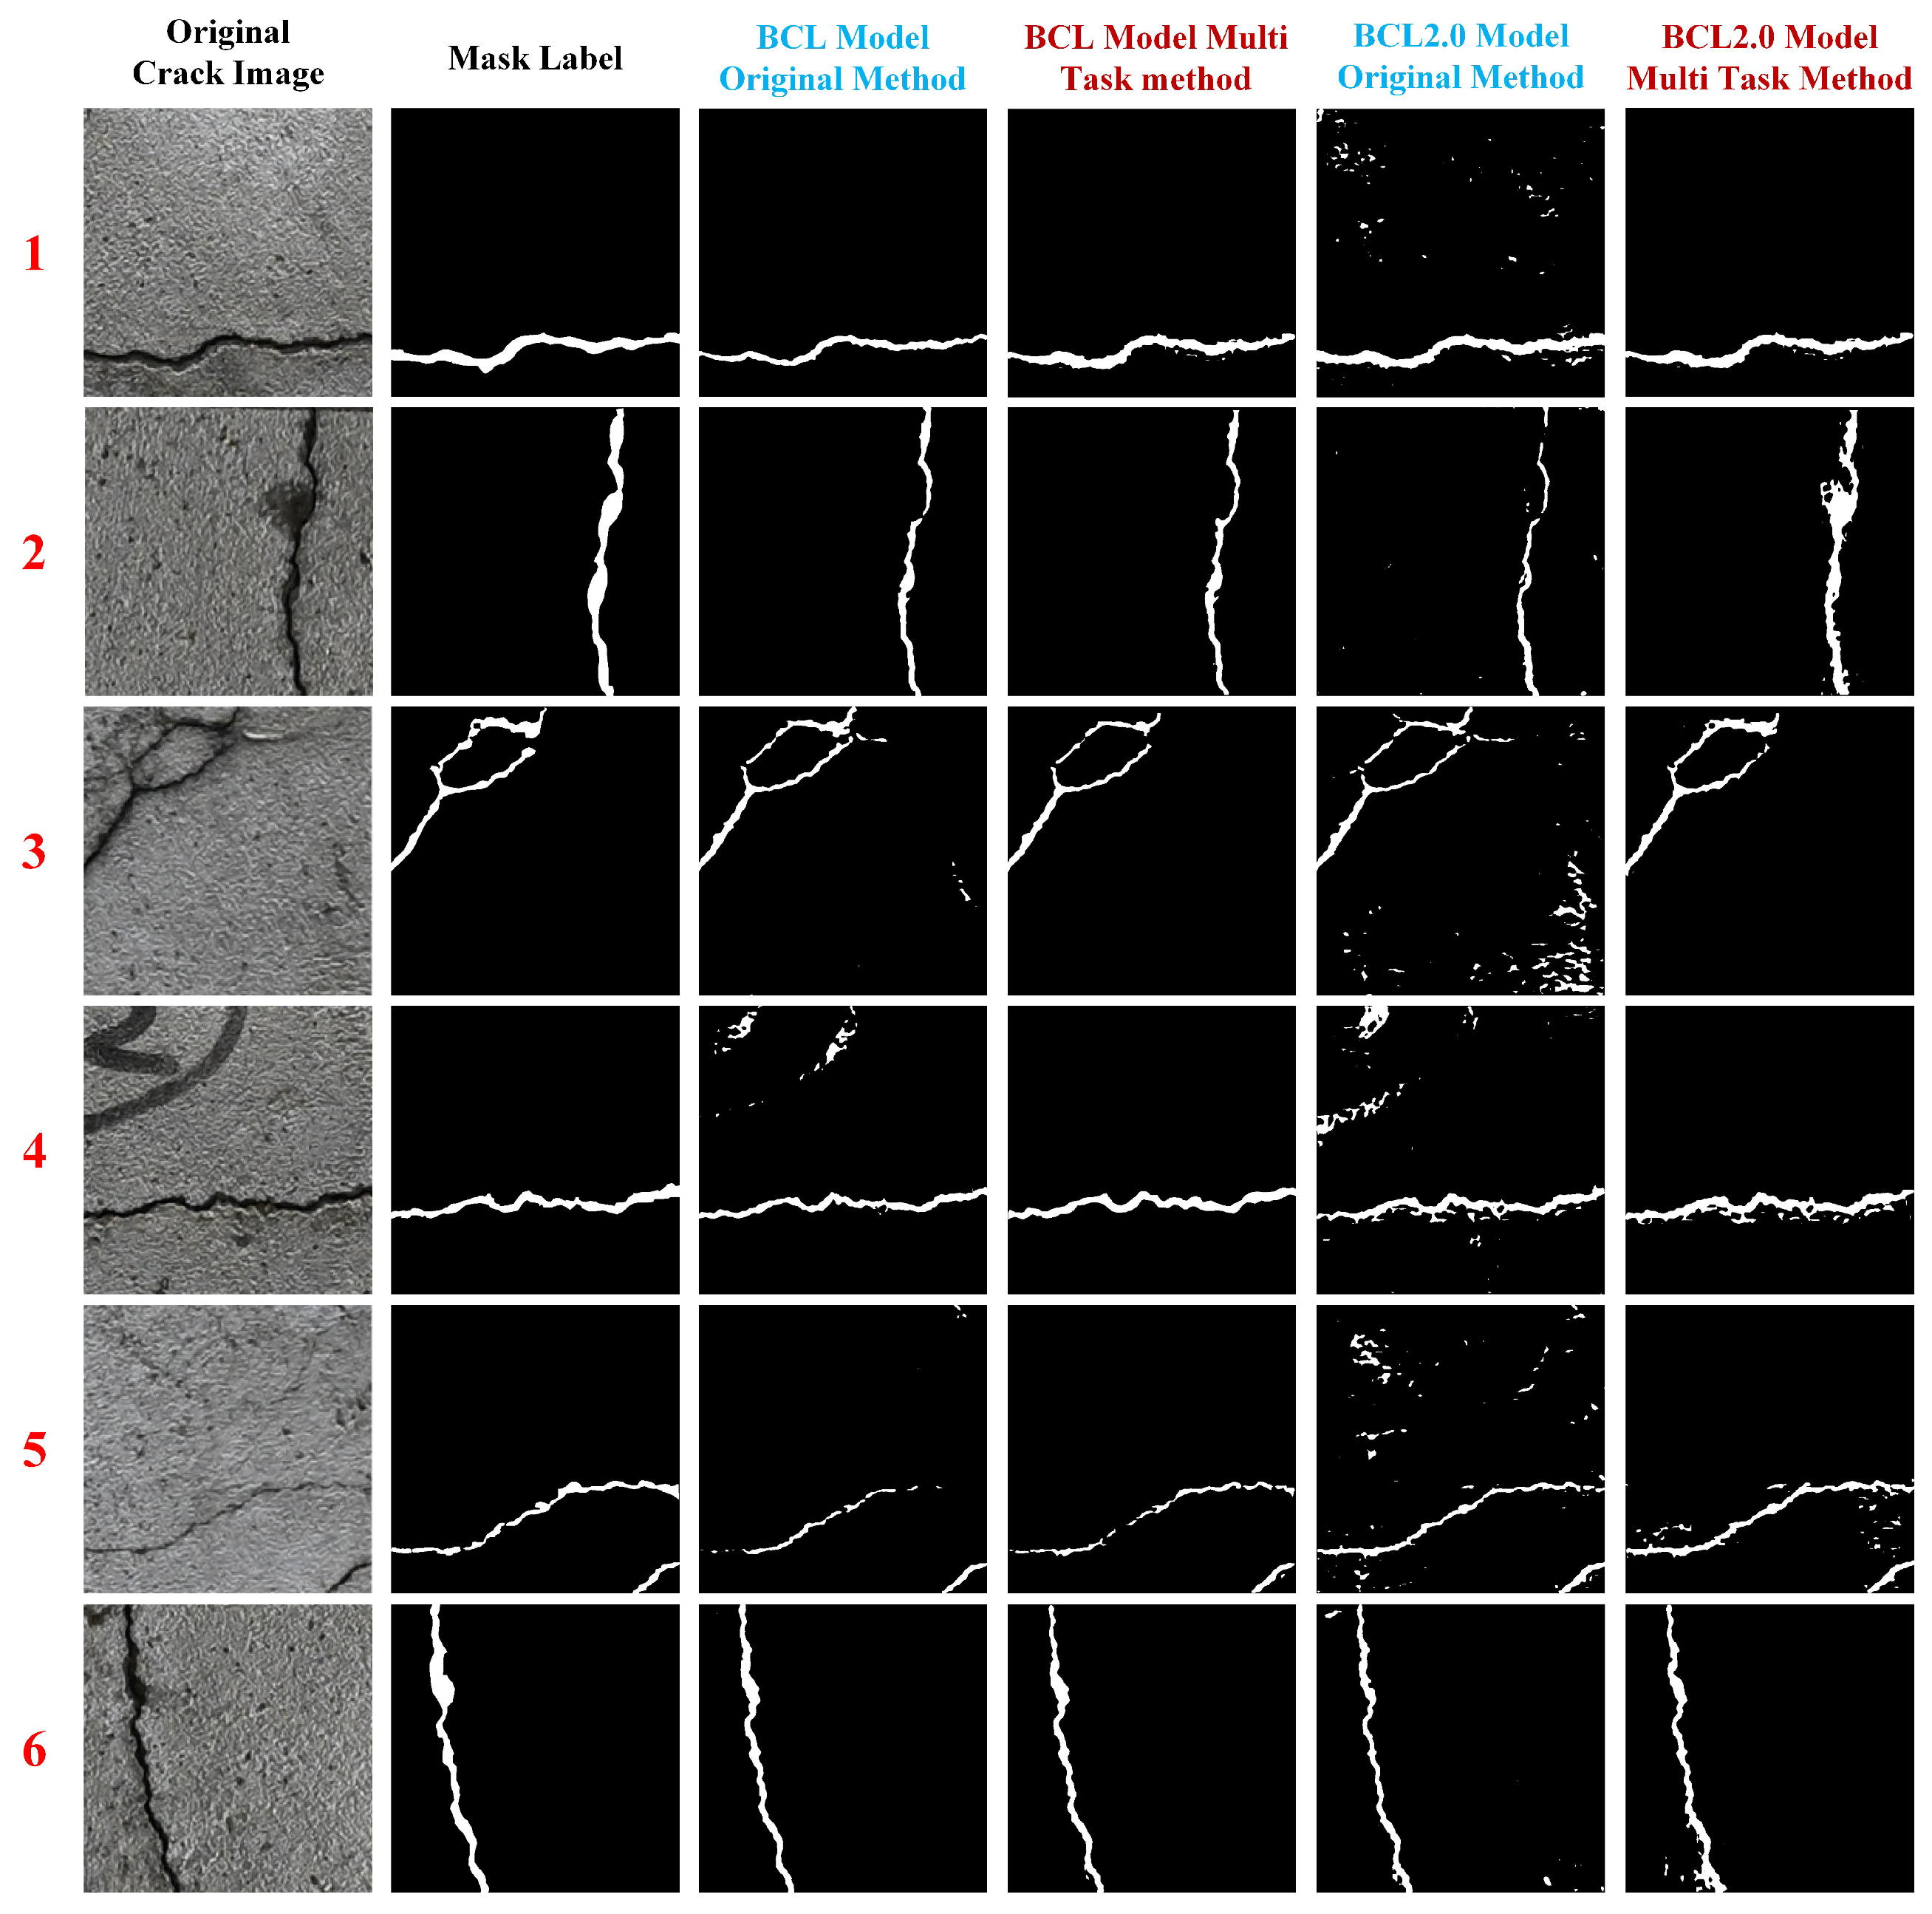
To validate the effectiveness of the crack multi-task integration algorithm proposed in this paper, comparative experiments were conducted on a standard crack test wall. Two benchmark models, BCL and BCL2.0, were used, and both their original methods and multi-task improved versions were tested. The experimental results are visualized in Figure 11, and the key metrics are presented in Table 5. Specifically, the average IOU of the multi-task methods for BCL and BCL2.0 reached 65.28% and 61.58%, respectively, showing improvements of 7.71% and 12.64% over the original methods. The average F1 scores were 77.11 and 79.29, respectively, increases of 4.55% and 14.73% compared to the original methods. The average inference times were 60ms and 64ms, respectively, representing a reduction of approximately 66% and 64% in inference time compared to the original methods. These results conclusively demonstrate the significant advantages of the crack multi-task algorithm in terms of both accuracy and efficiency.
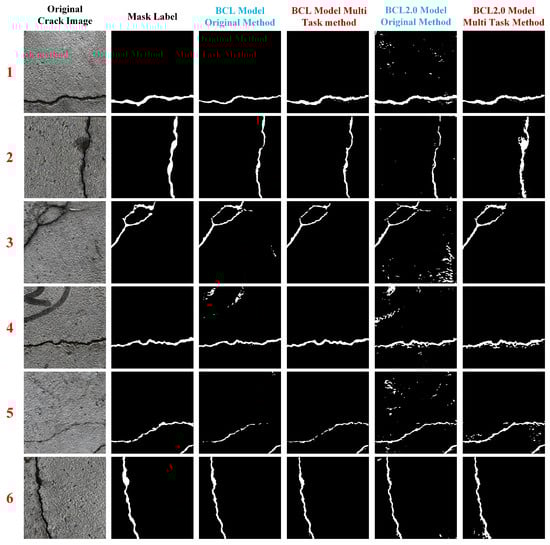
Figure 11.
The verification effect of different benchmark models and different methods on the test wall. Labels 1–6: crack image identifiers randomly sampled from the test wall.
Table 5.
Model performance comparison with optimized formatting.
4.3. Edge Device Deployment
Since the deployment target for this experiment was a low-cost edge device, which lacked sufficient computational power for real-time inference with the segmentation model, the edge device deployment in this study was limited to the detection model. Before model deployment, the .pt model file located on the server was first converted into an intermediate model in the Open Neural Network Exchange (ONNX) format. Then, NVIDIA’s TensorRT tool was used to optimize and accelerate the resulting .onnx model. TensorRT is a high-performance deep learning inference optimizer and runtime library that provides fast and efficient inference capabilities for deep learning models. With the aid of TensorRT, the corresponding .engine file for the model was generated. The core task of model deployment was to use the aforementioned .engine file to perform algorithm inference on various types of inputs (e.g., images, videos, or streams) on the target edge device and then output the detection results via a display device.
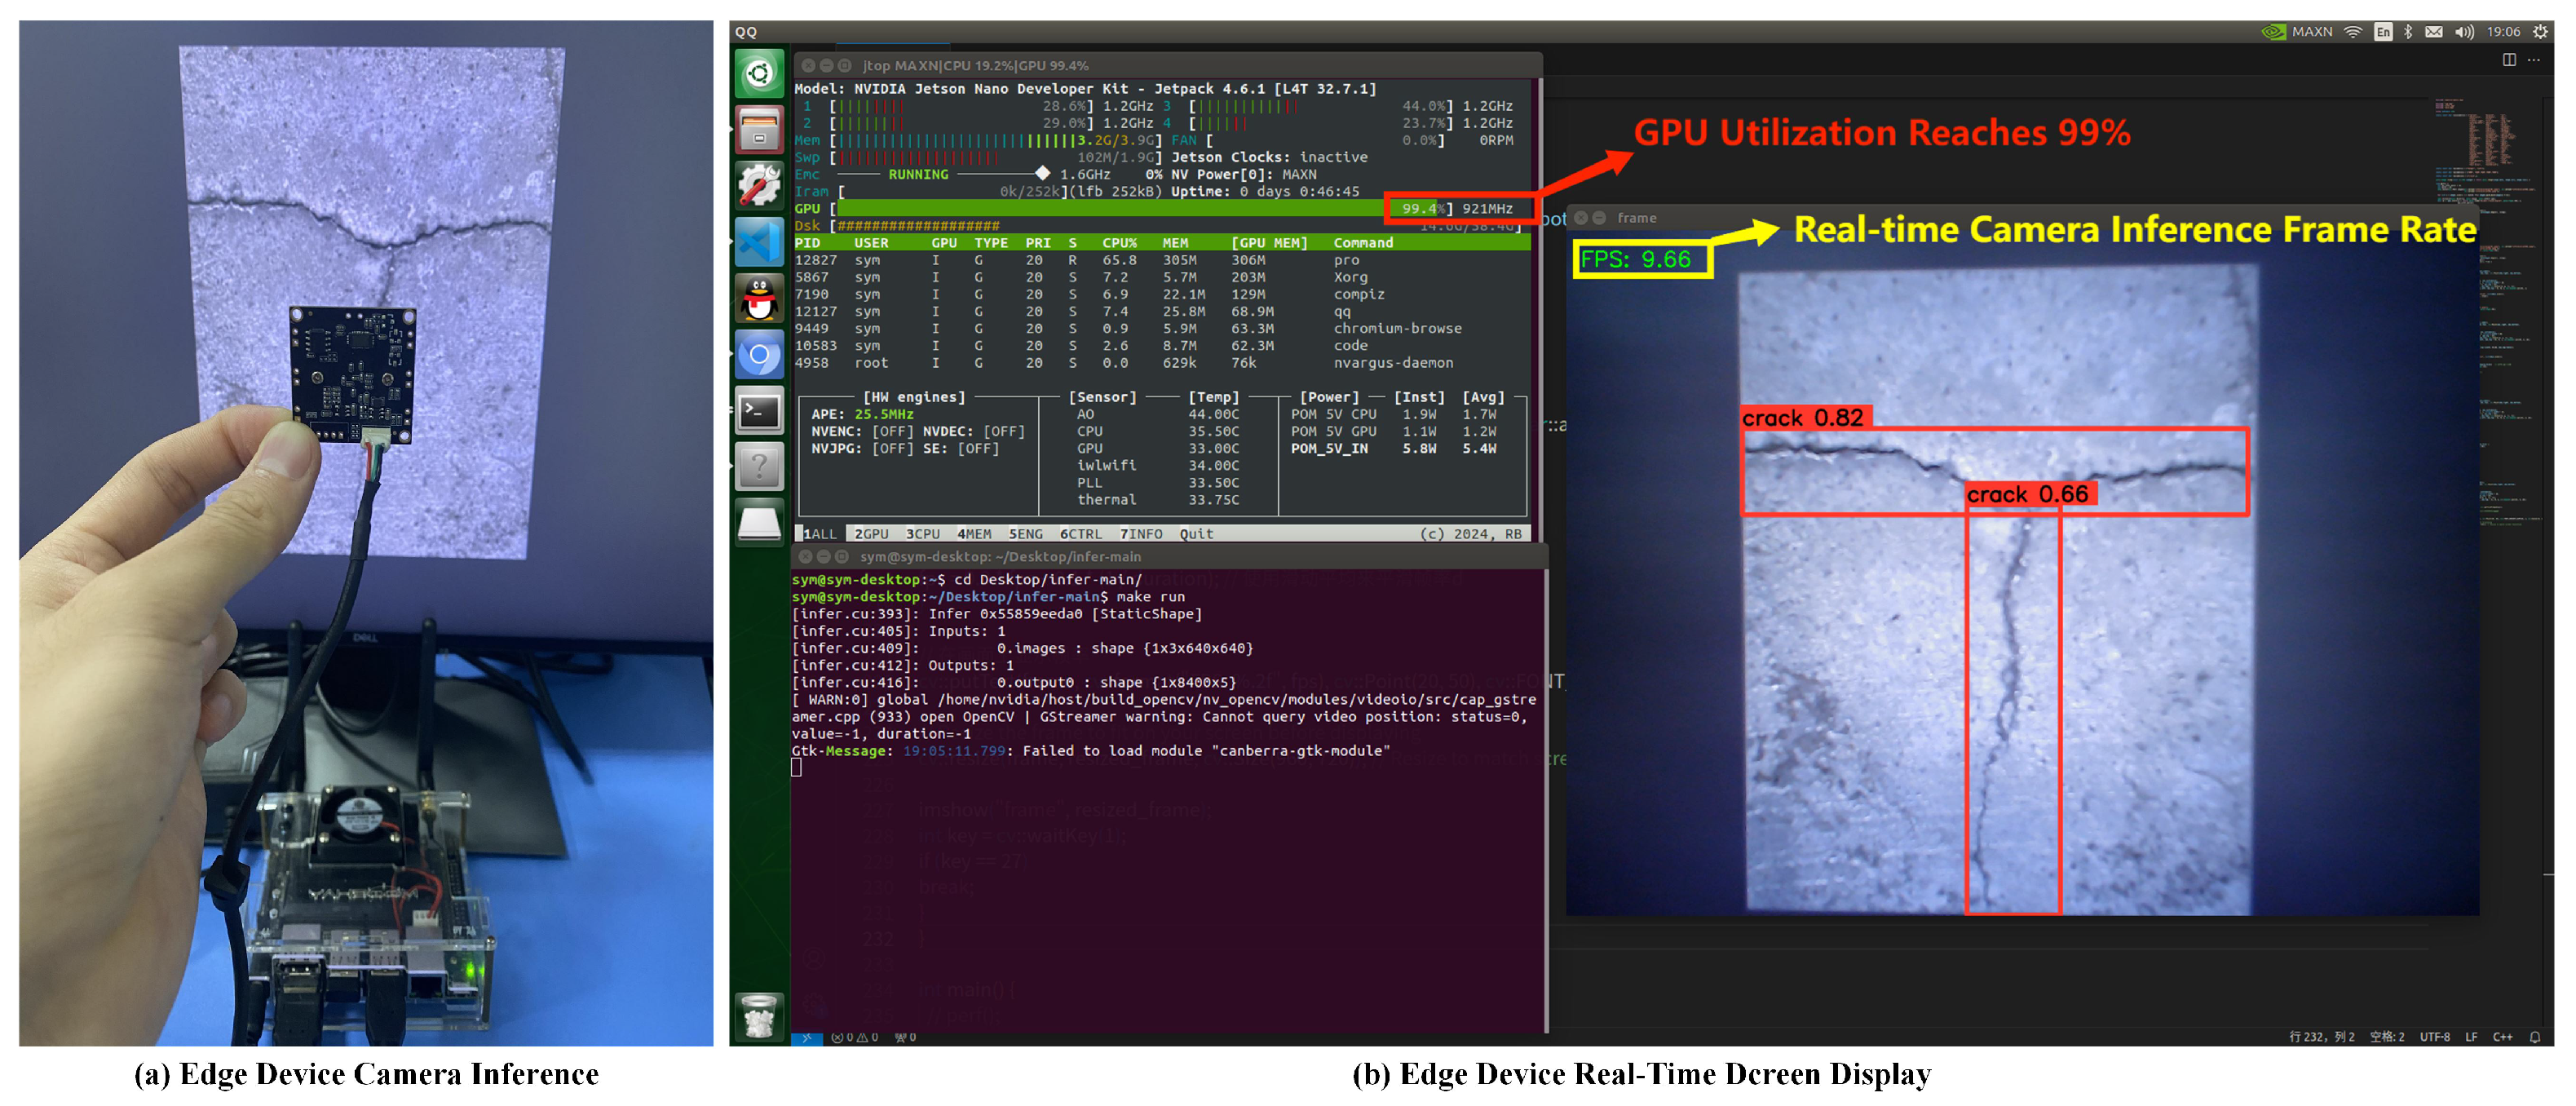
The YOLOv8 model was converted into the corresponding .engine file and deployed to the NVIDIA Jetson Nano edge device. Using the TensorRT inference acceleration framework, the camera FPS increased to 9.66, a 59.97% improvement compared to using the framework without acceleration, achieving the real-time and accurate detection of bridge cracks on the edge device. The deployment of the YOLOv8 model on the Jetson Nano is shown in Figure 12.
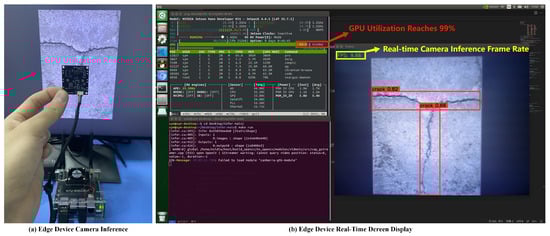
Figure 12.
YOLOv8 deployed on Jetson Nano performs well.
5. Practical Application
5.1. Overview
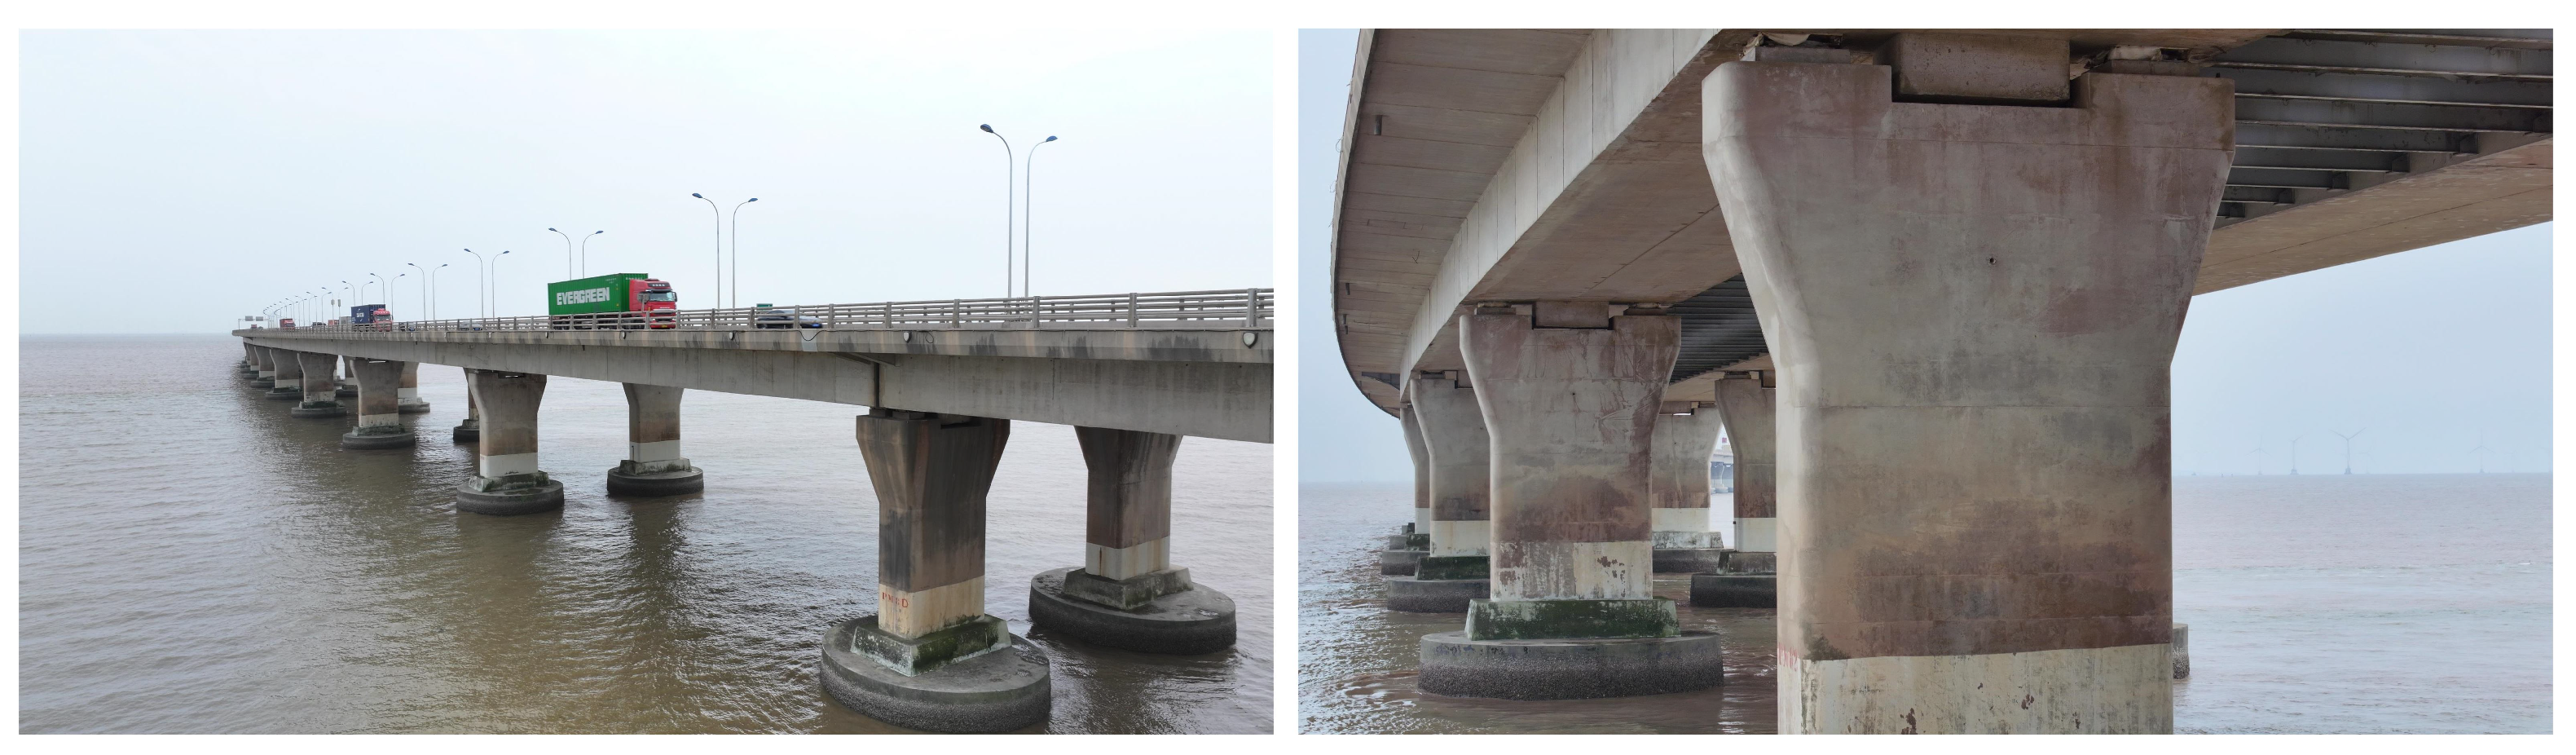
The Donghai Bridge, stretching north from the Luchaogang Port in Shanghai to the Yangshan Deep-Water Port in Zhejiang Province across the northeastern waters of the Hangzhou Bay, spans a total length of 32.5 km, with its main bridge extending 25.3 km. Constructed in 2005 and recognized as one of the longest cross-sea bridges globally at the time, it comprises numerous piers and cross-sea segments, with piers predominantly situated in shallow marine areas and designed using high-performance concrete structures. An actual photograph of DongHai Bridge is shown in Figure 13. Applying the aforementioned methodology, crack detection was conducted on select piers of the Donghai Bridge, particularly those near the northern estuary. Notable cracks were identified, providing actionable insights for bridge maintenance. This work establishes a feasible framework to guide subsequent repair and reinforcement efforts.
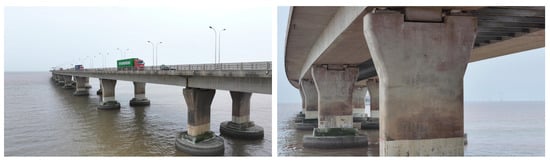
Figure 13.
Image acquisition of piers of DongHai Bridge.
5.2. Crack Detection on Donghai Bridge
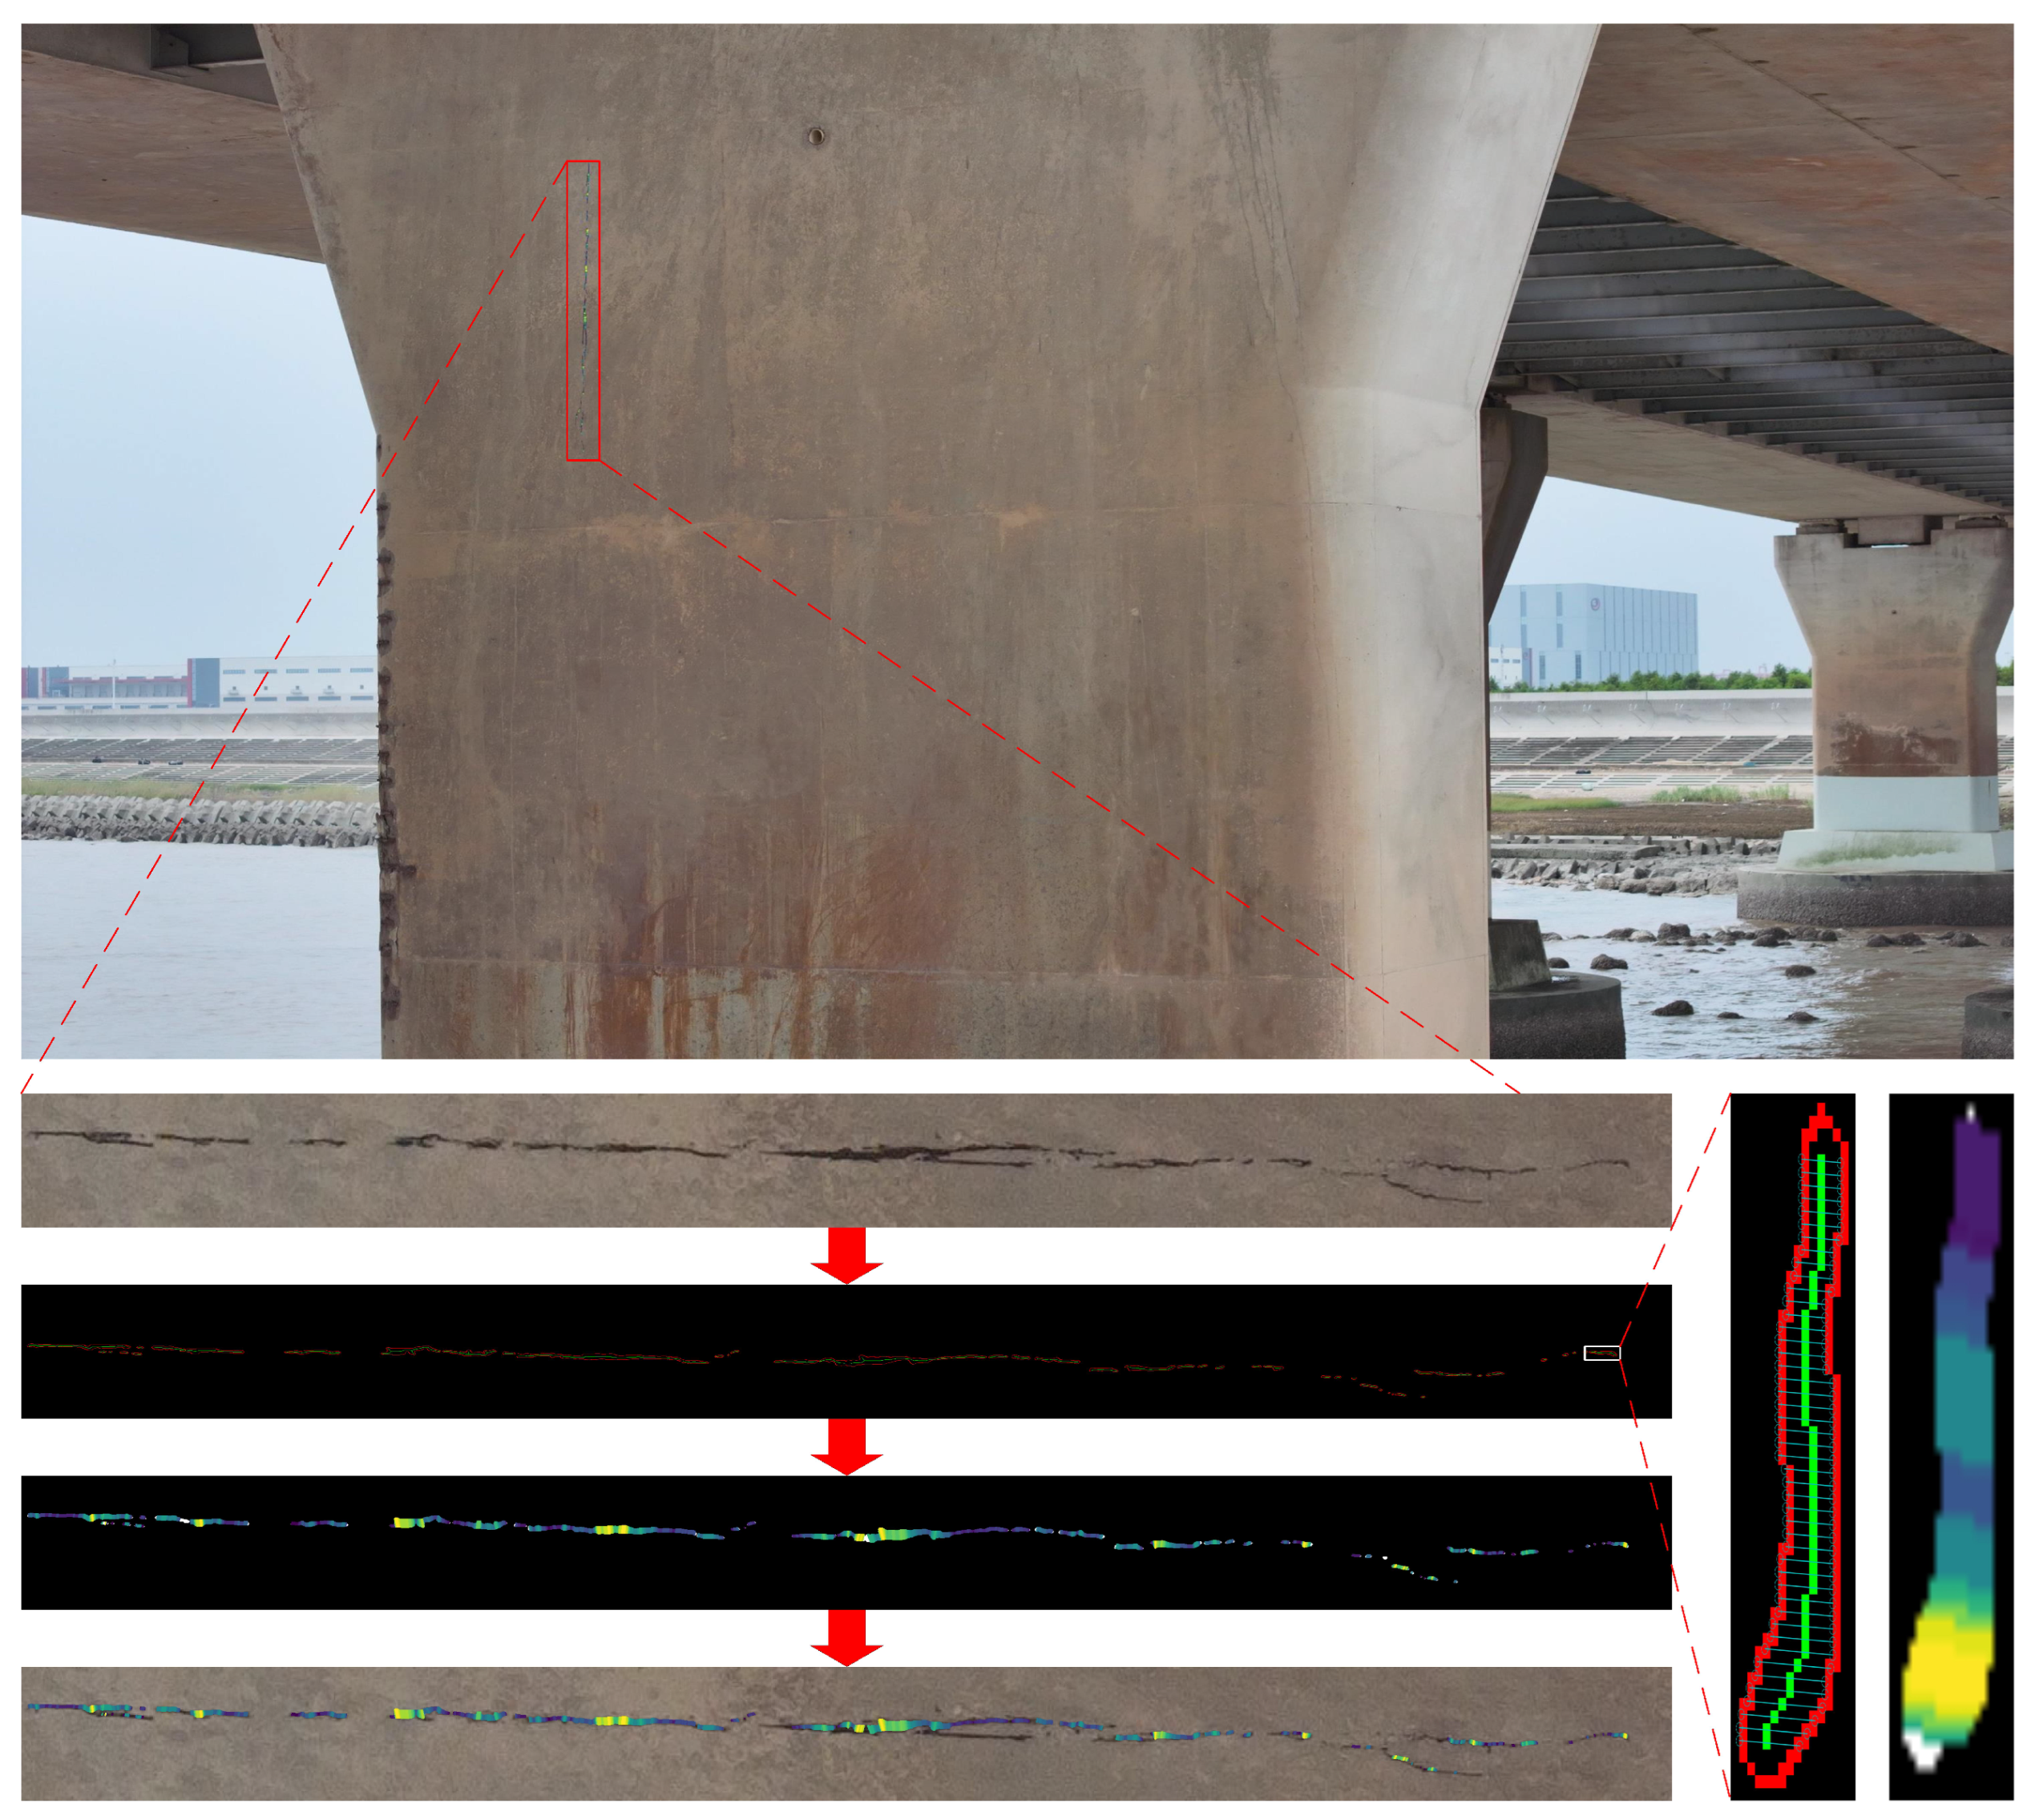
The experiment utilized a DJI Mavic 3 Pro drone equipped with a Hasselblad camera and an omnidirectional stereo vision system to perform circumferential imaging of target bridge piers. The drone maintained a strict distance of 2 m from the piers during data acquisition. A total of 20 piers were surveyed. Due to the completion of the Donghai Bridge protection project by the end of 2023, only a limited number of piers exhibited visible cracks. Crack identification results for piers with significant cracks, processed using the proposed algorithm, are illustrated in Figure 14.
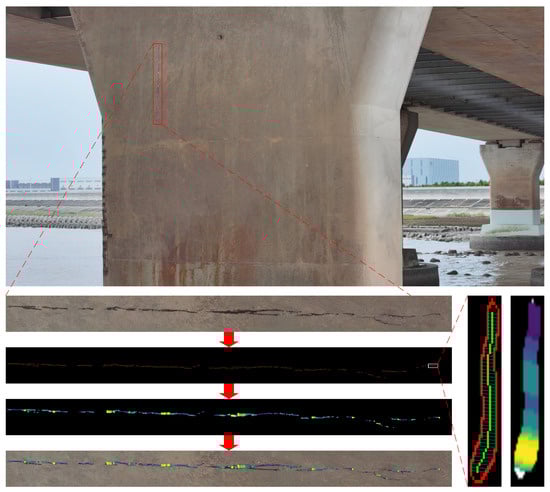
Figure 14.
Cloud map of cracks in piers of Donghai Bridge. Color-encoded heatmap representing pixel-scale width distribution along crack skeleton points; Red lines: crack boundaries; Green lines: crack skeleton lines.
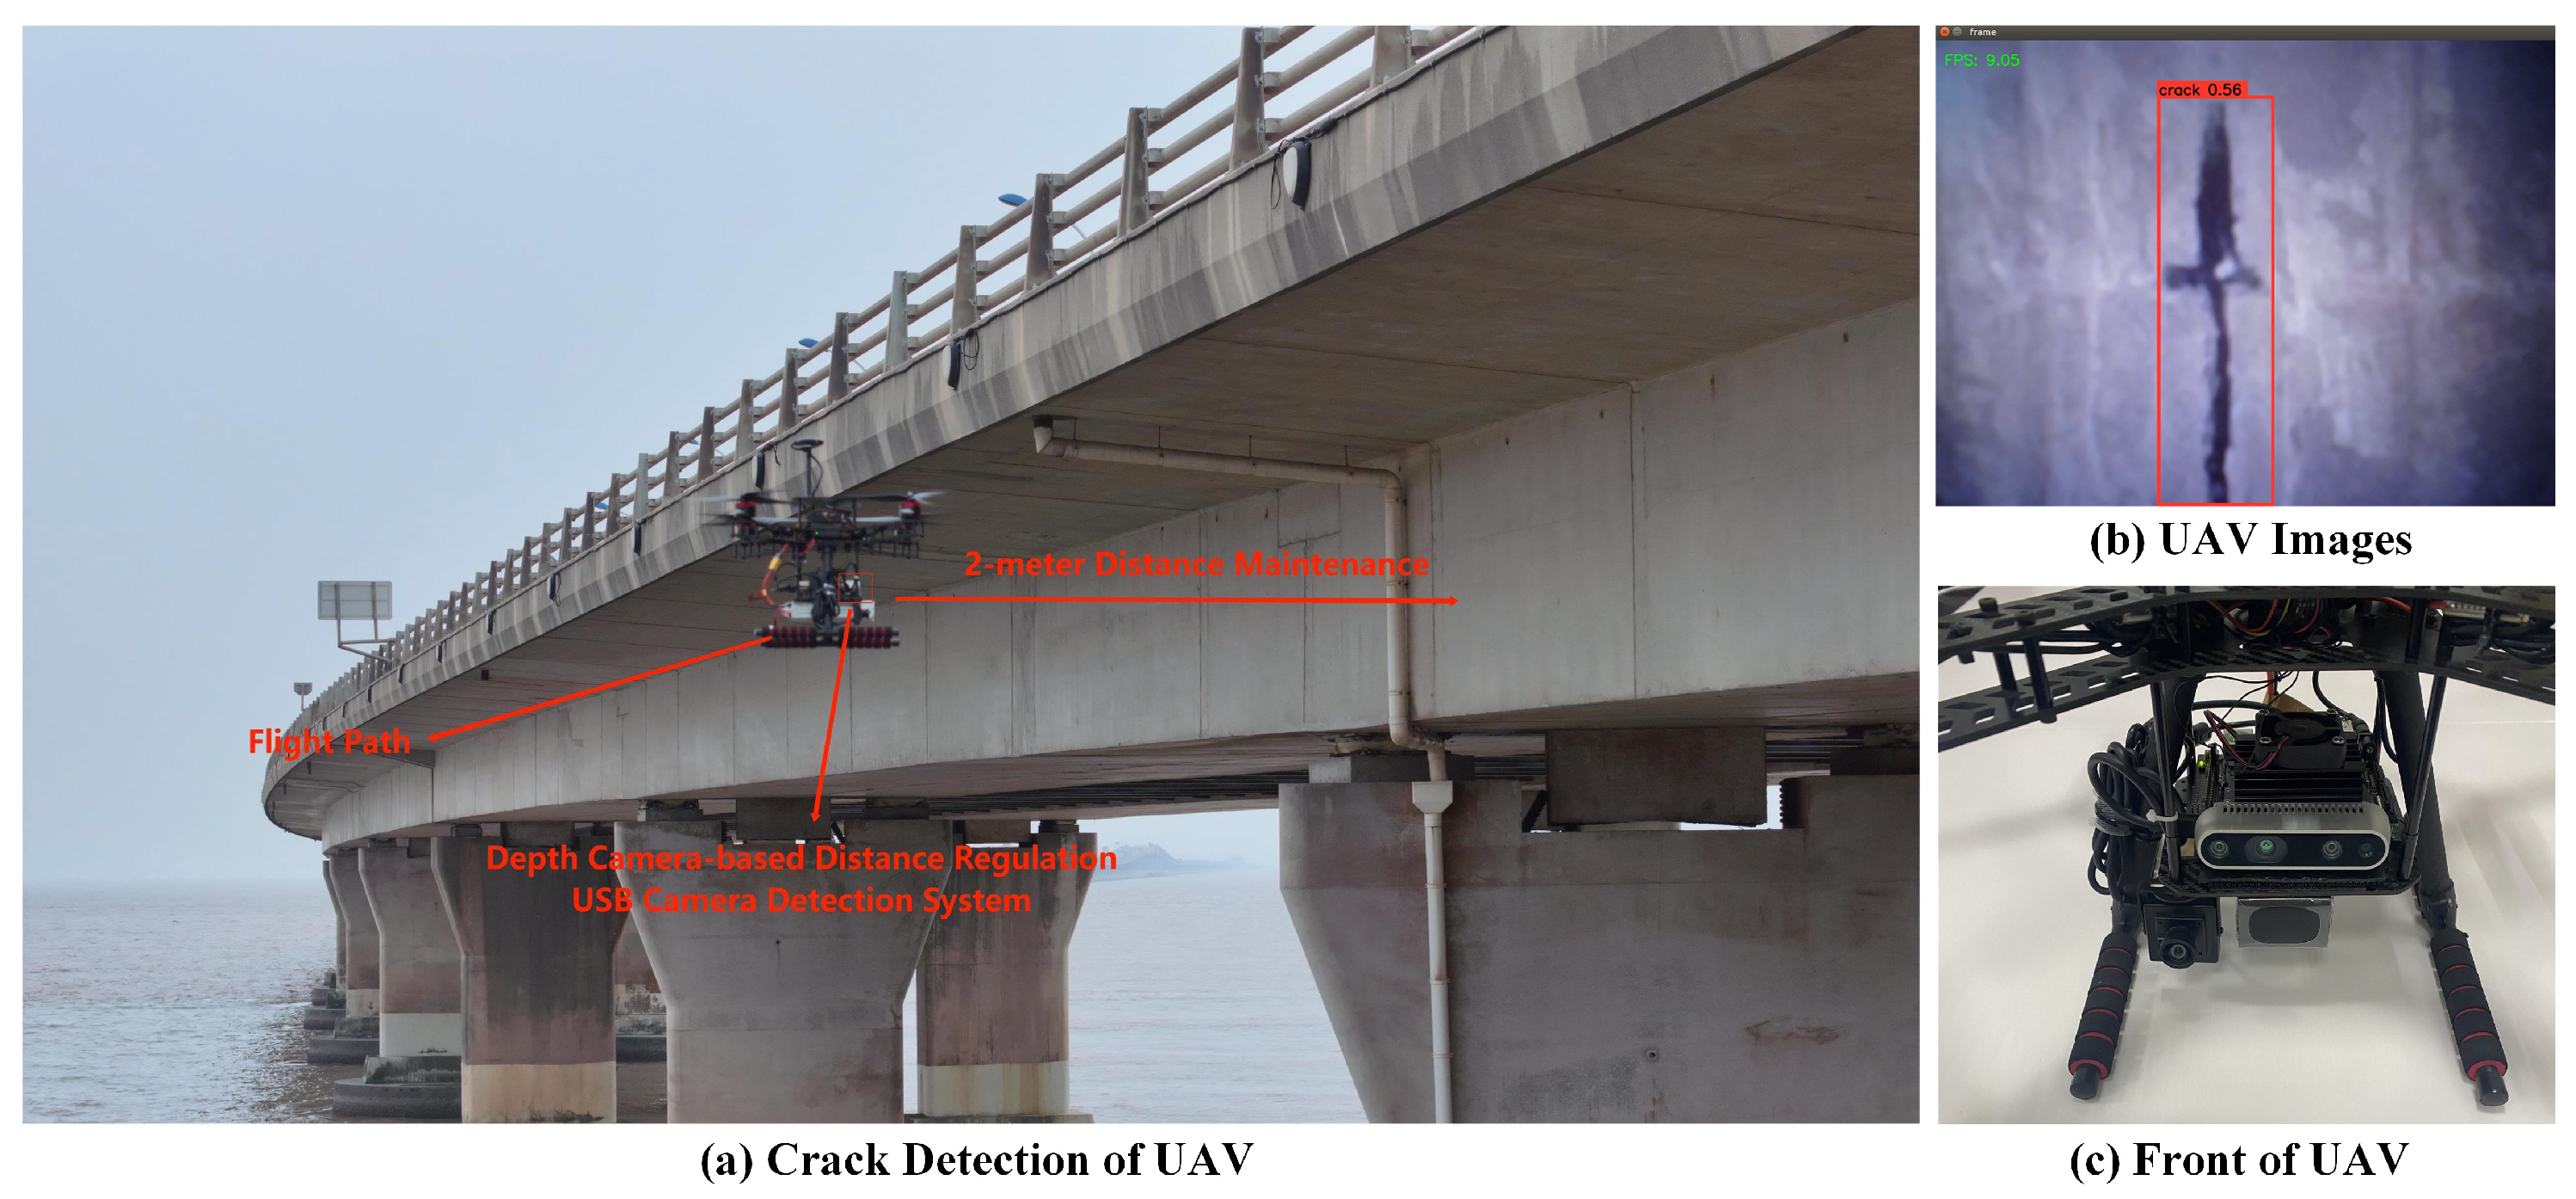
To further validate the system’s practicality, the edge device was integrated into a custom-developed drone system for field testing on the Donghai Bridge. The drone-mounted camera enabled real-time image transmission to the edge device for instantaneous crack detection, as shown in Figure 15. During testing, the drone demonstrated high-efficiency detection performance while maintaining robust accuracy under outdoor conditions (moderate lighting and wind speed). The real-time performance metrics are detailed in Section 3.3 (Edge Device Deployment), and the accuracy results are provided in Section 2.2 (YOLOv8 Model Training). The results confirm that the system’s real-time capability and accuracy sufficiently meet engineering requirements. This methodology significantly reduces reliance on manual inspections, enhancing both the safety and cost-effectiveness of monitoring operations.
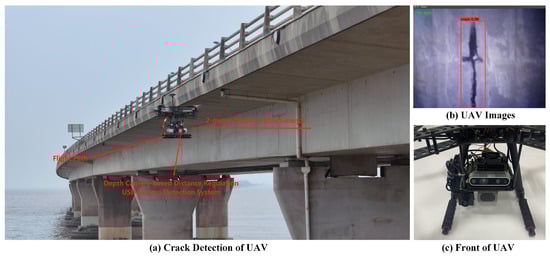
Figure 15.
Test site of DongHai Bridge.
6. Conclusions
This paper explores the automation and digitalization of bridge crack detection through digital image methods. It systematically investigates the intelligent crack recognition technology for bridges from multiple perspectives, including datasets, object detection algorithms, semantic segmentation algorithms, and edge device deployment. The main research conclusions are as follows:
(1) A crack multi-task ensemble algorithm was proposed, which first detected the location and extent of cracks in images, and then fed the crack regions into a segmentation model for detailed local segmentation. The ensemble algorithm significantly reduced the overall computational load and shortened the inference time of the model, making it particularly suitable for resource-constrained or real-time application scenarios. The algorithm was successfully applied to detect cracks in the pier of the Donghai Bridge, and the results were visualized.
(2) In crack detection on the test set, the recognition accuracy reached 78.79%, and the F1 score reached 88.14. The crack segmentation accuracy, on the BCL and BCL2.0 datasets, achieved mIOU values of 76.32% and 88.88%, respectively. The mAP and Dice scores also achieved significant results. Regarding the validation of the method on the crack test wall, the multi-task crack detection method showed an improvement in IOU by 7.71% and 12.64% compared to the original method, with inference times reduced by 66% and 64%, respectively.
(3) This paper integrated edge devices into a self-developed drone system for field testing on the Donghai Bridge. The camera mounted on the drone could transmit images in real time to the edge device for crack detection. The tests indicated that the real-time performance and accuracy of the detection were sufficient to meet engineering requirements. The use of the drone platform significantly reduced the risks associated with high-altitude operations, providing a new solution for safe and reliable structural inspection.
(4) Future work will explore a multi-modal sensing framework that integrates digital image processing, radar, and ultrasonic technologies to enhance the detection capabilities for crack depth and structural integrity. Additionally, by utilizing drone and inspection robot technologies, the automated crack monitoring of hard-to-reach areas will be conducted, while employing multi-view 3D reconstruction methods for accurately presenting and managing crack information to enable long-term monitoring.
Author Contributions
Y.S. (Yumeng Su) and Y.S. (Yunlong Song): The implementation of detection algorithms, segmentation algorithms, multi-task integration algorithms, width calculation and edge device deployment; Thesis writing, etc. Z.Z. and Z.B.: Conceptualization, thesis writing, resources, etc. Y.Y.: Conceptualization etc. B.Z. and Y.S. (Yanting Song): Data processing, thesis polishing, etc. All authors have read and agreed to the published version of the manuscript.
Funding
This research received no external funding.
Data Availability Statement
We are committed to open science and have constructed an open-source dataset containing over 200,000 structural surface crack images covering roads, bridges, tunnels, and steel materials. To address the scarcity of bridge crack samples in existing public datasets, we have additionally collected over 1000 real-world engineering fracture images through field investigations. Researchers interested in accessing the dataset may contact the author via email at symeng4442@163.com.
Conflicts of Interest
The authors declare no conflicts of interest.
References
- 2022 Transportation Industry Development Statistical Bulletin. China Waterw. Transp. 2023, 29–33. [CrossRef]
- Yue, Q.; Xu, G.; Liu, X. Crack Intelligent Recognition and Bridge Monitoring Methods. China J. Highw. Transp. 2024, 37, 16–28. [Google Scholar] [CrossRef]
- Liu, Y.F.; Fan, J.S.; Nie, J.G.; Kong, S.Y.; Qi, Y. Review and prospect of digital-image-based crack detection of structure surface. J. Civ. Eng. 2021, 54, 79–98. [Google Scholar] [CrossRef]
- Zou, J.; Yang, J.; Li, H.; Shuai, C.; Huang, D.; Jiang, S. Bridge apparent damage detection based on the improved YOLO v3 in complex background. J. Railw. Sci. Eng. 2021, 18, 3257–3266. [Google Scholar] [CrossRef]
- Wei, C.; Zhu, X.; Zhang, D. Light weight grid bridge crack detection technology based on depth classification. Comput. Eng. Des. 2022, 43, 2334–2341. [Google Scholar] [CrossRef]
- Peng, Y.; Liu, M.; Wan, Z.; Jiang, W.; He, W. A Dual Deep Network Based on the Improved YOLO for Fast Bridge Surface Defect Detection. Acta Autom. Sin. 2022, 48, 1018–1032. [Google Scholar] [CrossRef]
- Huantong, G.; Zhenyu, L.; Jun, J.; Zichen, F.; Jiaxing, L. Embedded road crack detection algorithm based on improved YOLOv8. Comput. Appl. 2024, 44, 1613–1618. [Google Scholar]
- Hui, L.; Ibrahim, A.; Hindi, R. Computer Vision-Based Concrete Crack Identification Using MobileNetV2 Neural Network and Adaptive Thresholding. Infrastructures 2025, 10, 42. [Google Scholar] [CrossRef]
- Yu, J.; Li, F.; Xue, X.; Zhu, P.; Wu, X. Intelligent Identification of Bridge Structural Cracks Based on Unmanned Aerial Vehicle and Mask R-CNN. J. China Highw. Transp. 2021, 34, 80–90. [Google Scholar] [CrossRef]
- Xuebing, Z.; Junjie, W. Bridge Crack Detection Based on Improved DeeplabV3+ and Migration Learning. Comput. Eng. Appl. 2023, 59, 262–269. [Google Scholar]
- Yu, J.; Liu, B.; Yin, D.; Gao, W.; Xie, Y. Intelligent Identification and Measurement of Bridge Cracks Based on YOLOv5 and U-Net3+. J. Hunan Univ. (Nat. Sci.) 2023, 50, 65–73. [Google Scholar] [CrossRef]
- Hammouch, W.; Chouiekh, C.; Khaissidi, G.; Mrabti, M. Crack Detection and Classification in Moroccan Pavement Using Convolutional Neural Network. Infrastructures 2022, 7. [Google Scholar] [CrossRef]
- Di Benedetto, A.; Fiani, M.; Gujski, L.M. U-Net-Based CNN Architecture for Road Crack Segmentation. Infrastructures 2023, 8, 90. [Google Scholar] [CrossRef]
- Jocher, G.; Chaurasia, A.; Qiu, J. Ultralytics YOLO; GitHub: San Francisco, CA, USA, 2023. [Google Scholar]
- Dorafshan, S.; Thomas, R.J.; Maguire, M. SDNET2018: An annotated image dataset for non-contact concrete crack detection using deep convolutional neural networks. Data Brief 2018, 21, 1664–1668. [Google Scholar] [CrossRef] [PubMed]
- Jin, T.; Ye, X.; Li, Z. Establishment and evaluation of conditional GAN-based image dataset for semantic segmentation of structural cracks. Eng. Struct. 2023, 285, 116058. [Google Scholar] [CrossRef]
- Wang, C.Y.; Mark Liao, H.Y.; Wu, Y.H.; Chen, P.Y.; Hsieh, J.W.; Yeh, I.H. CSPNet: A New Backbone that can Enhance Learning Capability of CNN. In Proceedings of the 2020 IEEE/CVF Conference on Computer Vision and Pattern Recognition Workshops (CVPRW), Seattle, WA, USA, 14–19 June 2020; pp. 1571–1580. [Google Scholar] [CrossRef]
- He, K.; Zhang, X.; Ren, S.; Sun, J. Spatial Pyramid Pooling in Deep Convolutional Networks for Visual Recognition. IEEE Trans. Pattern Anal. Mach. Intell. 2015, 37, 1904–1916. [Google Scholar] [CrossRef] [PubMed]
- Chen, L.; Zhu, Y.; Papandreou, G.; Schroff, F.; Adam, H. Encoder-Decoder with Atrous Separable Convolution for Semantic Image Segmentation. In Proceedings of the European conference on computer vision (ECCV), Munich, Germany, 8–14 September 2018. [Google Scholar]
- Sandler, M.; Howard, A.; Zhu, M.; Zhmoginov, A.; Chen, L.C. MobileNetV2: Inverted Residuals and Linear Bottlenecks. In Proceedings of the 2018 IEEE/CVF Conference on Computer Vision and Pattern Recognition, Salt Lake City, UT, USA, 18–22 June 2018; pp. 4510–4520. [Google Scholar] [CrossRef]
- He, K.; Zhang, X.; Ren, S.; Sun, J. Deep Residual Learning for Image Recognition. In Proceedings of the 2016 IEEE Conference on Computer Vision and Pattern Recognition (CVPR), Las Vegas, NV, USA, 27–30 June 2016; pp. 770–778. [Google Scholar] [CrossRef]
- Chollet, F. Xception: Deep Learning with Depthwise Separable Convolutions. In Proceedings of the 2017 IEEE Conference on Computer Vision and Pattern Recognition (CVPR), Honolulu, HI, USA, 21–26 July 2017; pp. 1800–1807. [Google Scholar] [CrossRef]
- Mao, A.; Mohri, M.; Zhong, Y. Cross-Entropy Loss Functions: Theoretical Analysis and Applications. In Proceedings of the International Conference on Machine Learning, Honolulu, HI, USA, 23–29 July 2023. [Google Scholar]
- Lin, T.Y.; Goyal, P.; Girshick, R.; He, K.; Dollár, P. Focal Loss for Dense Object Detection. In Proceedings of the 2017 IEEE International Conference on Computer Vision (ICCV), Venice, Italy, 22–29 October 2017; pp. 2999–3007. [Google Scholar] [CrossRef]
- Ye, X.W.; Jin, T.; Li, Z.X.; Ma, S.Y.; Ding, Y.; Ou, Y.H. Structural Crack Detection from Benchmark Data Sets Using Pruned Fully Convolutional Networks. J. Struct. Eng. 2021, 147, 04721008. [Google Scholar] [CrossRef]
- Yufei, L. Multi-Scale Structural Damage Assessment Based on Model Updating and Image Processing. Ph.D. Thesis, Tsinghua University, Beijing, China, 2015. [Google Scholar]


Disclaimer/Publisher’s Note: The statements, opinions and data contained in all publications are solely those of the individual author(s) and contributor(s) and not of MDPI and/or the editor(s). MDPI and/or the editor(s) disclaim responsibility for any injury to people or property resulting from any ideas, methods, instructions or products referred to in the content. |
© 2025 by the authors. Licensee MDPI, Basel, Switzerland. This article is an open access article distributed under the terms and conditions of the Creative Commons Attribution (CC BY) license (https://creativecommons.org/licenses/by/4.0/).