Abstract
Improving the resilience of infrastructures is key to reduce their risk vulnerability and mitigate impact from hazards at different levels (e.g., from increasing extreme events, driven by climate change); or from human-made events such as: accidents, vandalism or terrorist actions. One of the most relevant aspects of resilience is preparation. This is directly related to: (i) the risk prediction capability; (ii) the infrastructure monitoring; and (iii) the systems contributing to anticipate, prevent and prepare the infrastructure for potential damage. This work focuses on those methods and technologies that contribute to more efficient and automated infrastructure monitoring. Therefore, a review that summarizes the state of the art of LiDAR (Light Detection And Ranging)-based data processing is presented, giving a special emphasis to road and railway infrastructure. The most relevant applications related to monitoring and inventory transport infrastructures are discussed. Furthermore, different commercial LiDAR-based terrestrial systems are described and compared to offer a broad scope of the available sensors and tools to remote monitoring infrastructures based on terrestrial systems.
1. Introduction
Transport infrastructures are one of the most important assets for the global economy, as they support market growth while connecting and enabling social and economic cohesion across different territories. According to the European Commission, the transport and storage services sector accounts, in 2016, for about 5% of total gross value added (GVA) in the EU–28, employs around 11.5 million persons (i.e., 5.2% of the total workforce), and comprises about 13% of the total household expenditure (i.e., including vehicle purchase and usage, and transport services) [1].
Goods transport activities are estimated to amount to 3661 billion tonne-kilometre and passenger transport activities to 6802 billion passenger-kilometre in 2016, with road transport the most common transportation mode [1]. To ensure that the infrastructure supporting these figures keeps its efficiency, reliability and accessibility for all its users, the EU addresses several horizontal challenges in a recent report [2], which can be grouped as: (i) market functioning; (ii) negative externalities; and (iii) infrastructure. Regarding the first challenge, it is pointed out that the quality and potential of transport services are limited by the fragmentation of the transport market in terms of divergent national legislations and practices. This is of special relevance for rail transport, which lacks an effective competition. To address the negative externalities of transport is also necessary. Although the energy consumption in transport has decreased in the last decade, it accounts for about 24% of greenhouse gas emissions in the EU. Pollution, congestion, accidents or noise are other external costs that must be addressed.
The most relevant challenge is the one related to the assessment of infrastructure deficiencies, in the context of this publication. Currently, the effects of the economic crisis in the late 2000s still are the main reason for the low levels of investment in transport infrastructure, both at European and National levels, which are at their lowest level in the last 20 years in the EU [2]. This situation is related directly to a reduced investment in maintenance of the infrastructure, which accelerates its degradation, generating higher risks and reducing its quality and availability. A report from the European Road Federation emphasized the need to develop new methods and to employ new technologies to provide decision makers with the right tools for a more efficient and sustainable management of roads [3]. Asset management is defined in that report as a permanent and circular process that starts with establishing a complete inventory of all networks. Then, a clear picture of its current condition should be provided to predict the future demand, maintenance needs and costs of the infrastructure. Finally, a strategy that prioritizes the maintenance objectives (asset management plant) should be implemented. Therefore, finding the appropriate tools and technologies to tackle infrastructure maintenance needs, in the current low investment context, is essential to stop the negative impact it has on infrastructure availability and safety, among other indicators.
The European Commission has taken several initiatives in this context, under the Horizon 2020 Framework Programme, to foster research and development of new systems and decision tools that improve the maintainability of transportation networks. Some illustrative examples are: tCat [4], which develops a rail trolley with two laser distance meters, among other sensors, to automatically detect overhead lines and track geometry, allegedly reducing costs up to 80%; AutoScan [5] that developed an autonomous robotic evaluation system for the inspection of railway tracks, reducing inspection costs by at least 15%; and NeTIRail-INFRA [6], whose concept revolves around the design of infrastructure and monitoring, optimized for particular routes and track types, developing a decision support software for rail operators, and ensuring cost effective and sustainable solutions for different line types.
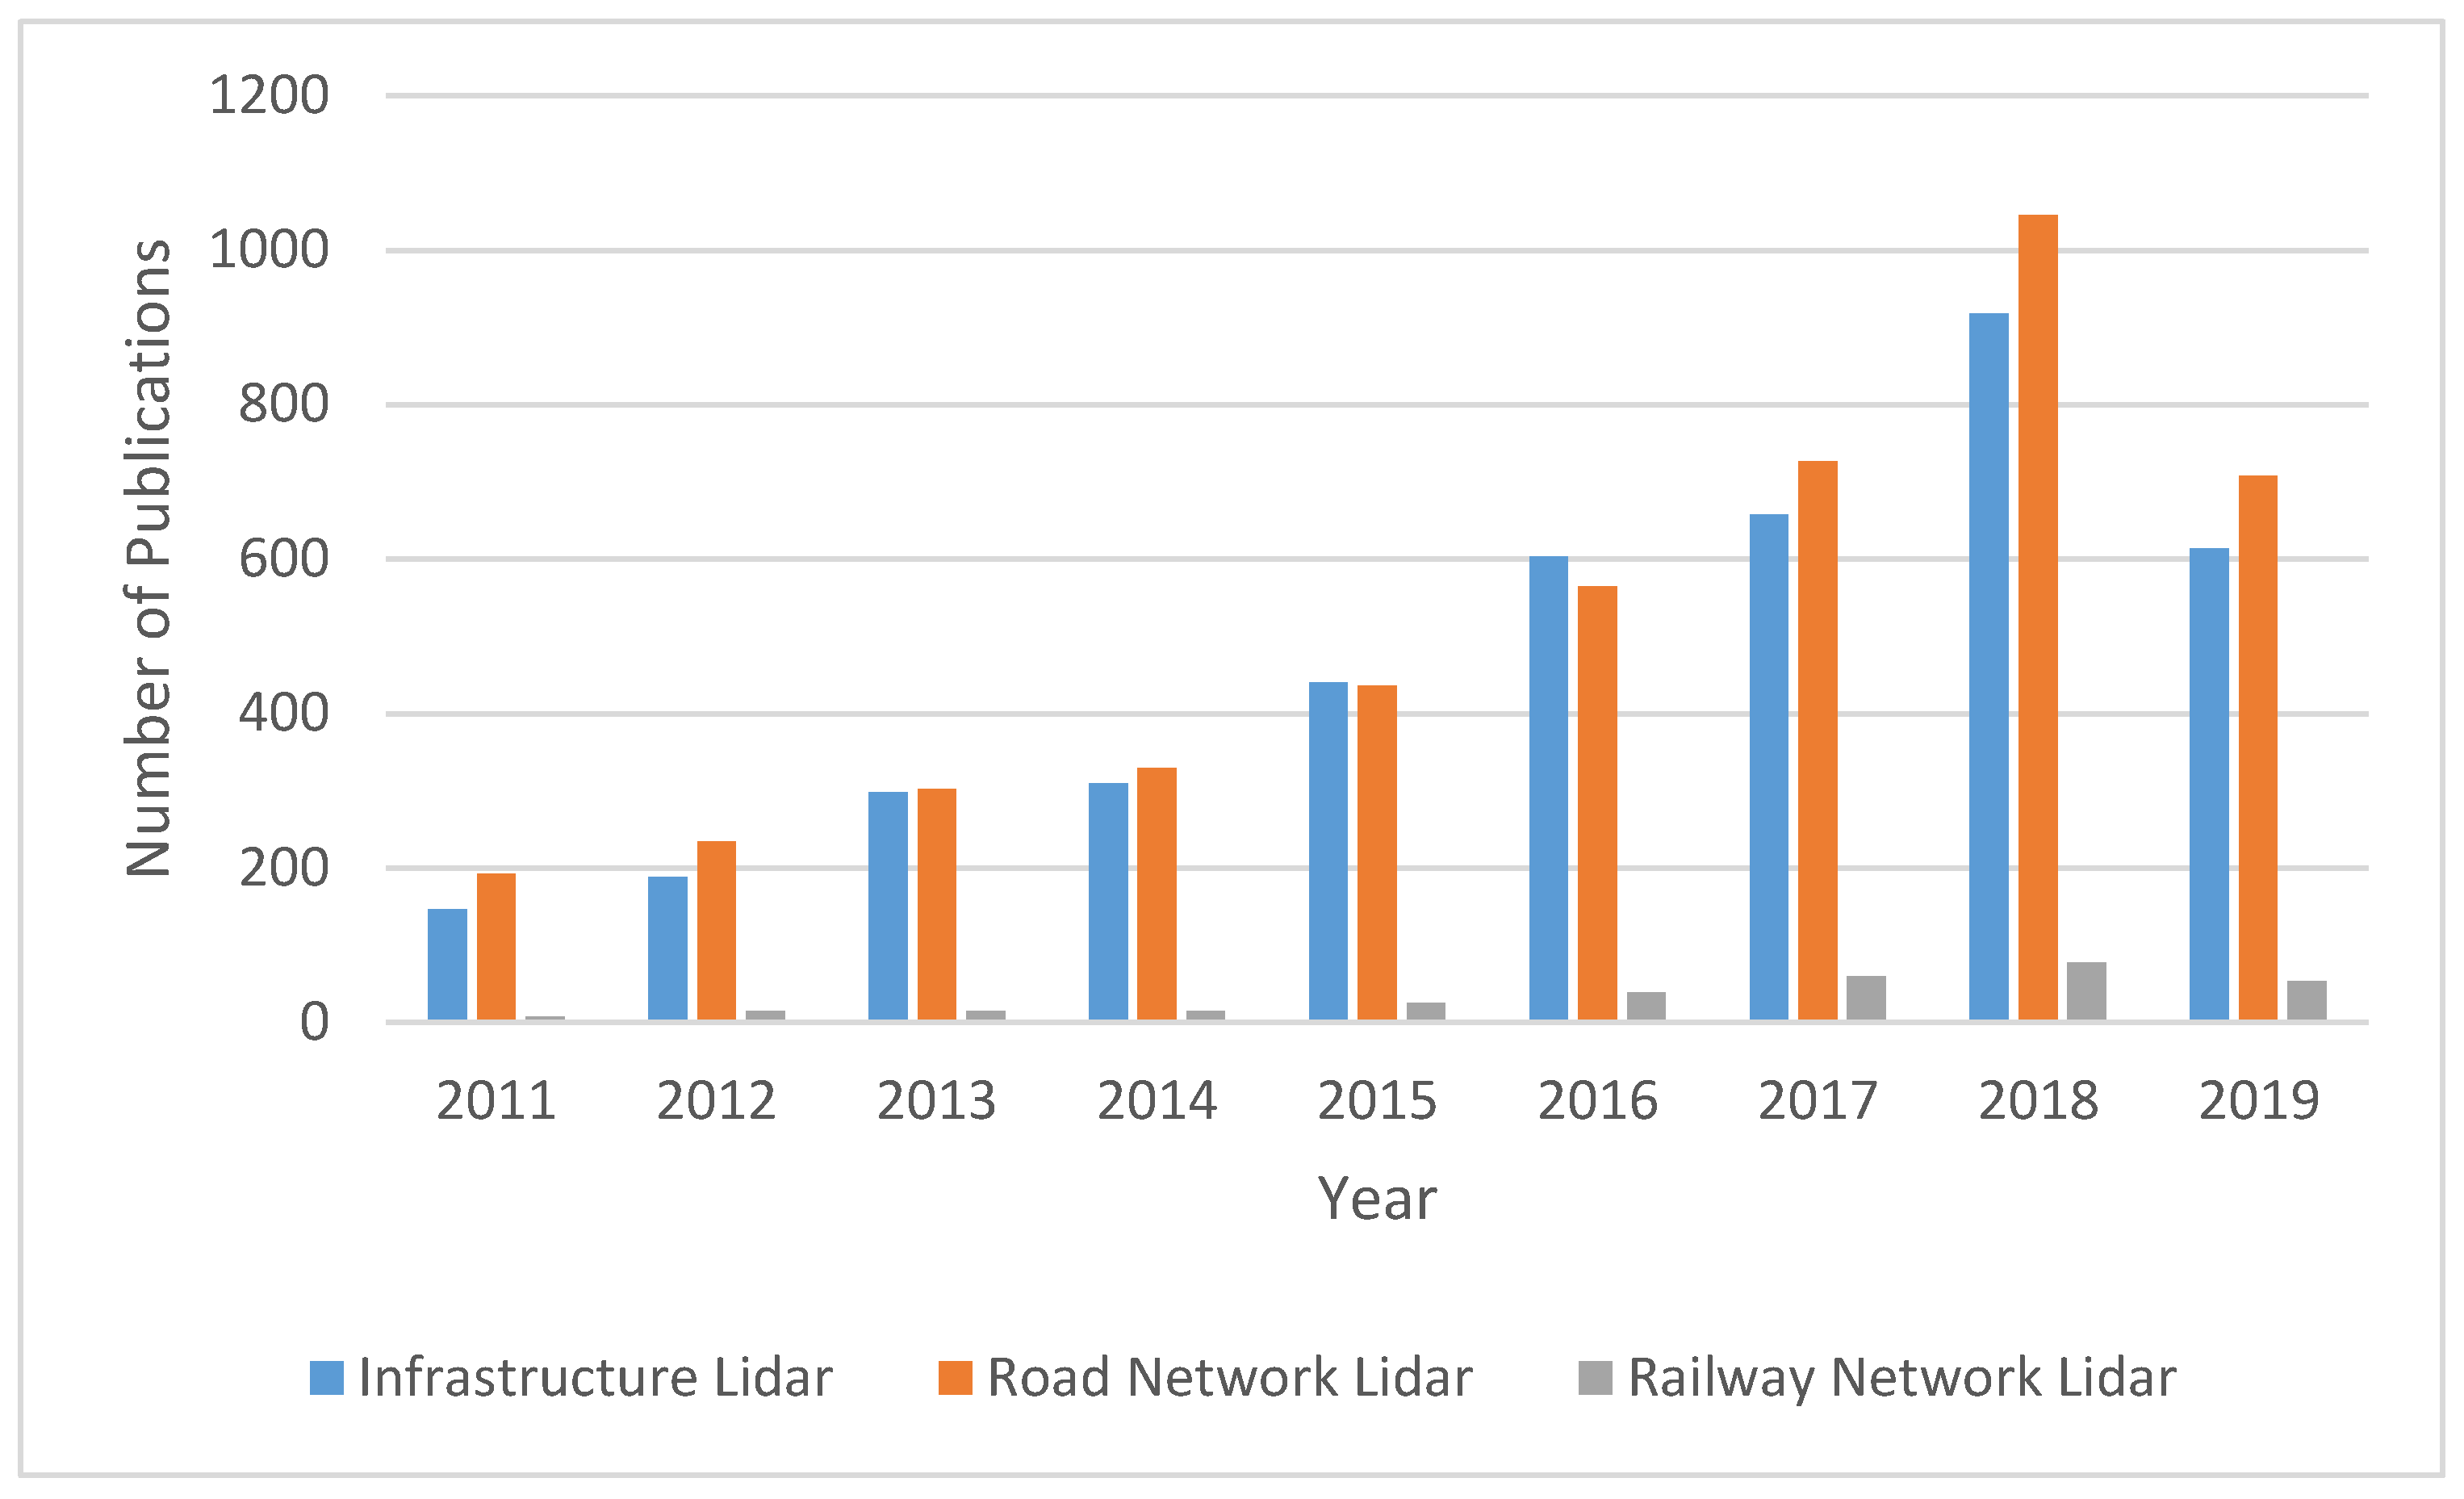
The usage of new technologies for data acquisition, and tools that improve the decision making use of those data, are key elements for the development of a more efficient monitoring and maintenance of infrastructures. One of the most promising technologies that is being developed is LiDAR (Light Detection And Ranging)-based mapping systems. In Figure 1 it can be appreciated that the research related to the usage of LiDAR technology for infrastructure management applications has been growing during the last decade. This technology is able to collect dense three-dimensional representations of the environment, making it relevant for several fields besides infrastructure management (e.g., cultural heritage [7], environmental monitoring [8]).
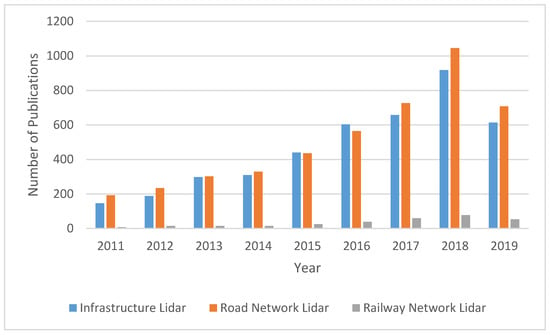
Figure 1.
Number of publications per year related with LiDAR technology and infrastructure management applications. The legend shows the keywords used for the publication search. Only seven months of year 2019 are considered in the search [16].
The recent advancements in LiDAR technology and applications in different fields have been reviewed in various works. Puente et al. [9] offer a review of land-based mobile laser scanning (MLS) systems, including an overview of the positioning, scanning and imaging devices integrated in them. The performance of MLS is analysed, comparing specifications of various commercial models. Williams et al. [10] focused on the applications of MLS in the transportation industry. Hardware and software components are detailed. The advantages, especially in terms of efficiency and safety, offered by these systems are emphasised, establishing a comparison with static and aerial systems. It is included as well in an overview of guidelines and quality control procedures for geospatial data. Addressing the challenges the industry is facing, an extensive documentation and dissemination process for future projects is suggested to improve the knowledge on the topic. Guan et al. [11] present an in-depth description of road information inventory: detection and extraction of road surfaces; small structures; and pole-like objects. The advancements in this area are highlighted, remarking how mobile LiDAR constitutes an efficient, safer and cost-effective solution. Gargoum and El–Basyouny [12] analyse the extraction of information from LiDAR images (on-road and roadside information, highway assessment, etc.), reviewing previous attempts and research on applications and algorithms for the extraction. Challenges and future research needs are underlined, including suggestions as to which aspects to investigate. Ma’s et al. [13] review of MLS literature includes an overview of commercial systems and an analysis of inventory methods, namely detection and extraction algorithms for on-road/off-road objects. The main contribution of the paper is stated to be the demonstration of the suitability of MLS for road asset inventories, ITS (Intelligent Transportation Systems) applications or high definition maps. Wang et al. [14] classify urban reconstruction algorithms used in photogrammetry, computer graphics and computer vision. The different categories are based on the object-type of the target: building roofs and façades; vegetation; urban utilities; and free-form urban objects. Future directions of research are suggested, like the development of more flexible reconstruction methods capable of offering better quality models or crowdsourcing solutions. Che et al. [15] summarise MLS data processing strategies for extraction, segmentation and object recognition and classification, as well as the available benchmark datasets. According to this work, future trends and opportunities in the field comprise the design of processing frameworks for specific applications, frameworks combining algorithms with user interaction and fusion of data from various sensors.
To put that research in perspective, this work aims to review LiDAR (Light detection and Ranging)-based monitoring systems and the most relevant applications toward the automation of infrastructure data processing and management, focusing on both road and railway transportation networks. Applications involving assets whose monitoring at a network level are not feasible with MLS, such as bridge health monitoring, are out of the scope of this review. Thus, the contributions of this review can be listed as follows:
- (1)
- An extensive literature review that describes different methods and applications for the monitoring of terrestrial transportation networks using data collected from Mobile Mapping Systems equipped with LiDAR sensors, with a focus on infrastructure assets whose analysis is relevant in the context of transport network resilience.
- (2)
- A descriptive summary of different laser scanner systems and their components, together with a comparison of commercial systems.
- (3)
- A special focus on railway network monitoring, which in this work is classified based on the application and extensively reviewed.
- (4)
- A remark on the most recent trends regarding methods and algorithms, with a focus on supervised learning and its most recent trend, deep learning.
- (5)
- A discussion on the main challenges and future trends for laser scanner technologies.
This work is structured as follows: Section 2 reviews different LiDAR-based technologies, focusing on those terrestrial systems that allow the most relevant applications. Then, Section 3 reviews the state-of-the-art on LiDAR-based monitoring systems for transport infrastructures. This section focuses on technologies that are best suited for road and railway networks and defines a wide range of data processing applications with an impact on the automatic monitoring of the infrastructure. Finally, Section 4 outlines the main conclusions that can be extracted from the review.
2. Laser Scanner Technology
A laser scanner is a survey and monitoring technology based on obtaining measurements of distance between a LiDAR sensor and its surroundings, that is, every object detected by the laser beams emitted by the sensor. The result of this process is a dataset in the form of a point cloud containing the position of every detection point on those objects relative to the sensor. To further reference point positions in a global frame, other positioning sensors can be included into the laser scanner platform, whether it is static or mobile. The contribution of each component of the platform to the data acquisition process is explained in this section.
2.1. Laser Scanner System Components
To determine the position of the points acquired with a laser scanner at a global level, it is necessary to reference them within an appropriate coordinate system. First, the points are referenced to the local coordinate system of the LiDAR. Then, the location of the platform in a global coordinate system, for instance WGS84, is determined using navigation and positioning systems [17]. Finally, the relative position and orientation of the LiDAR in the platform, regarding the navigation and positioning system, is determined for the correct geo-referencing of the point cloud. This distance, between the centre of the navigation system and the centre of other systems, is known as a lever arm or offset.
2.1.1. LiDAR
LiDAR technology is based on illuminating points of objects surrounding the scanner with a laser beam. The backscattered laser light is collected with a receiver and the distance to the point is then calculated either by time-of-flight (ToF) or continuous wave modulation (CW) range measurement techniques.
Regarding ToF (or pulse ranging) systems, the distance between the laser emitter and the scanned object is calculated based on the time that it takes the laser beam to travel since it is emitted until the backscattered pulse is received. Concerning a CW scanner (also known as phase difference ranging), a continuous signal is emitted and its travel time can be inferred considering the phase difference between the emitted and the received signal and the period of that signal. The range resolution in this case is directly proportional to the phase difference resolution. It also depends on the signal’s frequency; an increasing frequency reduces the minimum range interval that can be measured, so the resolution is higher. The maximum range (maximum measurable range [18]) is determined by the maximum measurable phase difference, equal to 360° (2π radians).
Laser scanners can provide further information in addition to geometric measurements of a scene. Intensity data of the backscattered light, for instance, provides information about the surface of scanned objects [19]. This is calculated based on the amplitude of the returned signal and depends primarily on the superficial properties of the object that reflects the laser pulse. The main superficial properties affecting how the laser pulse is backscattered are reflectance and roughness. A method for the detection of damage on the surface of historical buildings (e.g., superficial detachment and black crust development) can based on intensity data provided by laser scanners is presented by Armesto-González et al. [20], for instance.
Some laser scanner systems can record several echoes produced by the same emitted laser pulse when its path is interrupted by more than one target. According to Wagner et al., the number and timing of the recorded trigger-pulses are critically dependent on the employed detection algorithms [21]. Thus, the optimal solution would be to record the full-waveform, since it is formed by the sum of all echoes produced by distinct targets within the path of the laser pulse [22].
2.1.2. Positioning and Navigation Systems
The components or subsystems of the positioning and navigation system can be classified into two different groups. The first group is for systems with exteroceptive perception, meaning that they provide position and orientation with respect to a reference frame [23]. GNSS (global navigation satellite system) belongs to this group. The second one is for those systems having proprioceptive perception and providing time-derivative information of the position and orientation of the mobile. An initial state of the system must be defined in this case, and subsequent states are calculated upon it. This group includes INS (inertial navigation system) and DMI (distance measurement unit).
A combination of GNSS long-term accuracy and INS (as well as DMI) short-term accuracy makes it possible to improve position and velocity estimations. To integrate the data gathered by these components and estimate position and attitude of the system, a Kalman filter is applied. This filter consists of a set of mathematical equations and provides an efficient computational (recursive) solution of a least-square method to the discrete-data linear filtering problem [24].
2.2. Performance Of Laser Scanning Systems
There are various factors regarding the quality of the point cloud data acquired by a laser scanner. A methodology for establishing comparative analysis was developed by Yoo et al. in [25], being valid for both static and mobile systems. The factors evaluated according to this methodology are accuracy (and precision), resolution and completeness of the data.
Additional factors related to laser scanner performance are reflectivity, which can lead to measurement errors on objects with reflective surfaces, and scanner warm-up, which is a necessary step before starting data collection or drifting out of calibration [26]. Correct positioning and geo-referencing of points is influenced as well by the accuracy achieved by the navigation system and by the accuracy of the lever arm measurements.
Comparison of Monitoring Technologies
Laser scanning technology has certain characteristics that make it more suitable for some tasks than other MMS (mobile mapping system) technology. Regarding defect detection or alignment tasks [27], more accurate measurements are possible with a laser scanner compared to image-based solutions, for instance. It also has been proven to be suitable for 3D displacement measurements of particular points of a structure and to obtain its static deformed shape better than with linear variable displacement gauges (LVDTs), electric strain gauges and optic fibre sensors [28]. Moreover, it has the advantage that no direct contact is needed.
Although the mentioned MMS technologies have certain advantages over a laser scanner, image-based 3D reconstruction equipment has a lower cost, a higher portability and allows a faster data acquisition process. Image-based 3D reconstruction is based on triangulation by which “a target point in space is reconstructed from two mathematically converging lines from 2D locations of the target point in different images” [29]. Thus, it is necessary to take images from different perspectives of the object. This could be considered a drawback when comparing with laser scanning, as the later obtains directly a 3D point cloud with one single setup [30], but there are already existing systems, such as the Biris camera, which are capable of simultaneously obtaining two images on the same CCD (Charged-Coupled Device) camera [31]. Another advantage of images is the “visual value in understanding large amounts of information” [32]. During the cited study, daily progress images of a construction site are used to produce a 3D geometric representation of the site over time (“4D model”).
Nevertheless, and in addition to the aforementioned higher accuracy reached by laser scanners, these systems are not dependent on the illumination, as it is the case for cameras. However, image-based and laser scanning technologies can be combined to obtain a richly detailed representation of a scene by fusion of the acquired datasets. In Zhu et al. [33], MLS point clouds were used for geometric reconstruction of buildings and classification of the scanned points, while images of the buildings served for photorealistic texture mapping, for example.
2.3. Types of Laser Scanner Systems
There are, basically, three types of laser scanner system arrangements, namely TLS (terrestrial laser scanner), ALS (aerial laser scanner) and MLS (mobile laser scanner). This classification is based on the platform-type that is employed to install the system. Each type of laser scanner is further detailed in this section.
TLS are stationary systems, typically consisting of a LiDAR device mounted on a tripod or other type of stand, capable of obtaining high-resolution scans of complex environments, but with data acquisition times in the order of minutes for a single scan [34]. Regarding ALS, the laser scanner is installed on an aircraft (typically an airplane) combining the periodical oscillation of the laser emitting direction with the forward movement of the aircraft to obtain a dense point cloud. Due to the small scanning footprint achieved by the laser, spatial resolution is higher than that provided by radar [35]. ALS is employed, for instance, to obtain virtual city models or digital terrain models (DTM). Finally, an MLS is defined as a “vehicle-mounted mobile mapping system that is integrated with multiple on-board sensors, including LiDAR sensors” [13]. MLS allows for safer inspection routines, as operators can execute their job from the interior of the vehicle, rather than manually moving and placing the equipment, as in the TLS case. This translates to a faster and safer data acquisition process. Concurrently, MLS still allows for production of dense point clouds. However, data processing methods used in stationary terrestrial or airborne laser scanning cannot be applied directly, in some cases, to MLS due to differences in how the data are acquired, mainly the geometry of the scanning and point density [36]. Another benefit of MLS is the capability to capture discrete objects from various angles, or to be merged with images of the same scene to add more information to the data [9]. The combination of laser scanner and image-based data is discussed later in this document.
A Mobile Laser Scanner system can be adapted to various configurations, depending on the specific requirements of a certain survey process, or where the scanning is going to take place. The most usual configurations for MLS (in this particular case, for a ROAMER single-scanner Mobile Mapping System using a FARO Photon 120 scanner) are detailed in Kukko et al. [37]. The most broadly used is the vehicle configuration. This offers a fast surveying method, making it possible to scan urban areas at normal traffic speed. To obtain road surface points the scanner is adapted to a tilted position, which also produces scans that provide more information about the objects along the track direction than vertical scanning [37] since narrow structures along the survey path are hit multiple times by sequential scans, and vertical and horizontal edges are captured with equal angular resolution. Automated procedures for structure recognition can be applied to MLS point clouds, such as those introduced in Pu et al. [38] for ground and scene objects segmentation.
Another option is to install the equipment on top of a trolley for applications that are not suitable for a vehicle. Looking at the ROAMER case [37], this configuration was adopted to obtain a pedestrian point-of-view and point cloud data detailed enough to be used for personal navigation applications. When a certain scenario restricts the use of other solutions due to irregular terrain, difficult access etc., a valid alternative is to use a backpack configuration, like the Akhka solution introduced by Kukko et al. in [37]. This solution was proved to be a low-cost, compact and versatile alternative for Mobile Mapping Systems by Ellum and El-Sheimy [39], although, in this case, the employed mapping sensor was a megapixel digital camera rather than a laser scanner. Kukko et al. [37] also presented a MLS installed on a boat to obtain river topographical data.
2.4. Comparison of Commercial Laser Scanners
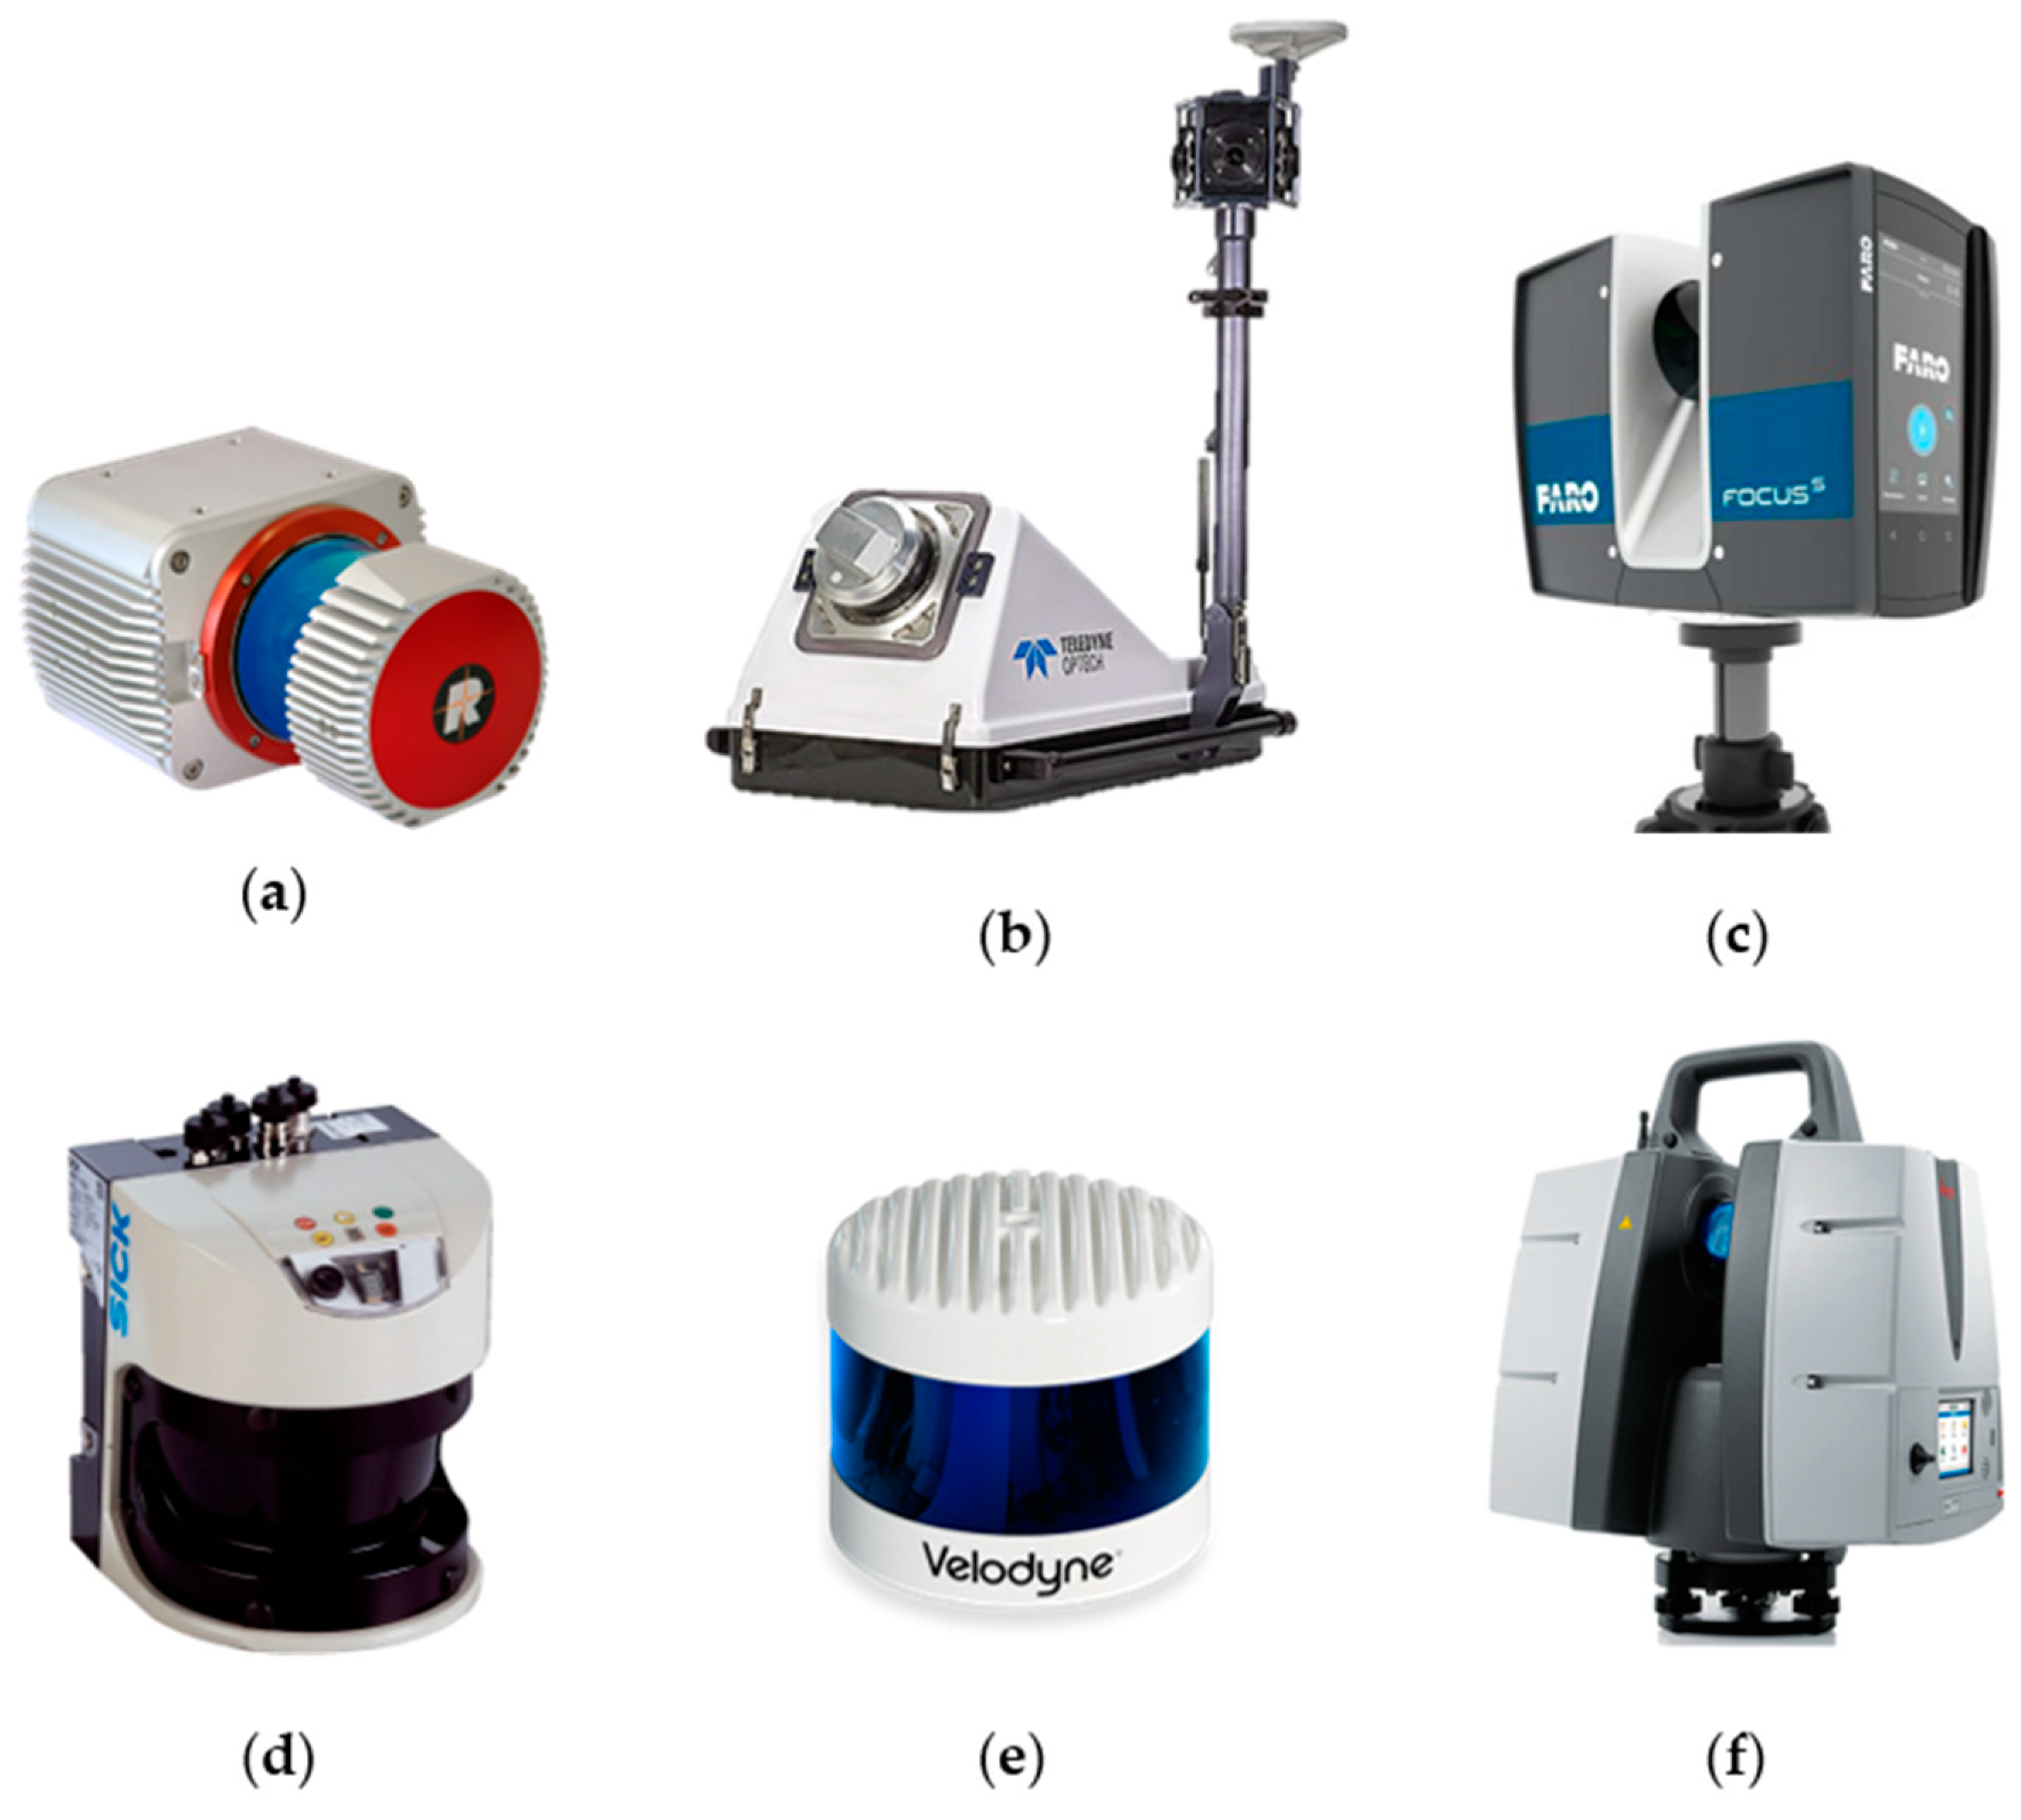
There are numerous laser scanners currently available on the market, offering different characteristics in terms of performance and possible applications. Regarding MLS, the most notable features to establish a comparison between models are the maximum acquisition range, accuracy and data acquisition rate. As an example, some models of LIDAR sensors from industry leading manufacturers are depicted in Figure 2. The specifications of these sensors are detailed in Table 1.
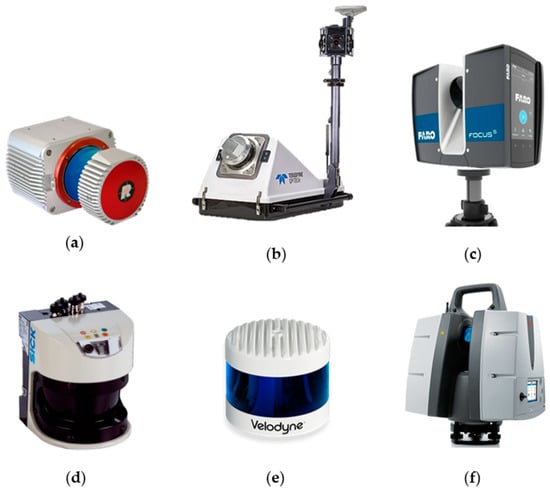
Figure 2.
Lidar sensors: (a) RIEGL VUX-1HA, (b) Teledyne-Optech Lynx HS300, (c) FARO Focus 350, (d) SICK LMS511, (e) Velodyne Alpha Puck and (f) Hexagon-Leica ScanStation P50.

Table 1.
Comparison of different commercial laser scanners.
3. State-of-the-Art regarding LiDAR-Based Monitoring of Transport Infrastructures
Even though LiDAR technology popularity has increased significantly during this decade, it has been in development since the second half of the past century. Its development started in the 1960s with several applications in geosciences. Years later, land surveying applications appeared in the picture thanks to the use of airborne profilometers. This equipment resulted in being useful for deriving vegetation height by evaluating the returned signal [46]. During the 1980s and 1990s, the use of laser scanning for environmental and land surveying applications increased. Civil engineering related applications started to arise in the second part of the 1990s, but it was not until the last part of the century and the beginning of the new one when the first terrestrial devices for 3D digitalization performance appeared. Numerous applications for different fields quickly arose from this point [47], and Terrestrial Laser Scanning (TLS) proved to be the appropriate technology to use when detailed 3D models were required. The resolution and quality of data given by laser scanning devices have improved with the evolution of technology. Consequently, recently, mobile mapping systems are beginning to perform high resolution surveys of large infrastructures (tunnels, roads, urban modelling etc.) in a short period of time.
Nowadays, the main bottleneck for LiDAR technology is processing the large amount of data acquired with laser scanning devices. Throughout the years, many tools have been developed for point cloud data processing. Most of these depend on manual or semi-automatic operations that must be performed by a specialist in the field of geomatics. The current challenge is to develop tools for an efficient automation of data processing using information provided by ALS, MLS or TLS.
Many companies and research groups investing in this technology have allowed for its fast development. The tedious and difficult processing tasks tend to have disappeared or be minimized with the appearance of machine learning algorithms. These tools allow for not only the development of advanced, efficient and intelligent processing but, also, the interpretation of data. One of the main objectives exploited is obtaining inventories for road, railway or urban management. Now, this has evolved, and the trend is to obtain spatial models of infrastructures based on the fusion of geometric and radiometric data and monitoring the infrastructure behaviour and changes through the years. These models have a notorious potential for BIM (building information modelling) and AIM (asset information modelling) applications, allowing to have not only as-design representations of the asset, but also as-built and as-operate models, which can be updated over time.
Throughout this section, the state-of-the-art regarding the monitoring of both road and railway networks using LiDAR-based technologies is described, focusing on the most recent trends, applications, and processing methodologies.
3.1. Road Network Monitoring
The successful integration of laser scanners, navigation sensors and imagery acquisition sensors on mobile platforms has led to the commercialization of Mobile Laser Scanning systems meant to be mounted on vehicles, such as regular vans or passenger cars, as seen in Section 2.2. Since these vehicles naturally operate along the road network, a large part of the existing research regarding the processing and understanding of the data collected by these systems has revolved around applications related to the monitoring of the road network.
This section of the review will focus on those applications, which will be divided into two main groups, Road surface monitoring and off-road surface monitoring. This conceptual division, which is considered by similar reviews in the field [11,13], will allow the reader to focus separately on different elements and features of the road network.
3.1.1. Road Surface Monitoring
The automatic definition of the ground has been one of the most common processes that is carried out using data from LiDAR-based sources. Although this application has been in the literature since the beginning of the century [48,49], there continuously has been research and improvement motivated by two main factors: The remarkable improvement of the LiDAR-based systems; the increased computational power available for research. Nowadays, LiDAR-based data has been used for automatically detecting and extracting not only the road surface, but also different elements and features on the road such as road markings and driving lanes, cracks, or manholes. Furthermore, an efficient extraction of the road surface is typically a preliminary processing step that allows the separation of ground and off-ground elements when using 3D point clouds as a main data source. Hence, it is a process that can be found in a large proportion of works focused on object detection and extraction from 3D point cloud data.
Road surface extraction:
Within the literature, different ways of organizing the existing knowledge of road surface extraction can be found. Ma et al. [13] define three main methodological groups based on the data structure: (1) 3D-point driven; (2) 2D Geo-reference feature image-driven; (3) Other data (ALS/TLS) driven. Differently, Guan et al. [11] define four groups based on the processing strategy, which can be summarized in two larger groups: (1) Processes based on previous knowledge of the road structure; (2) Processes based on the extraction of features for identification or classification of the road surface. The approach of Guan et al. [11] will be taken as reference for the following analysis of the state-of-the-art. Found in Table 2 is a summary that has considered both approaches (based on the data structure and on the processing strategy).

Table 2.
Summary of state-of-the-art works for road surface extraction.
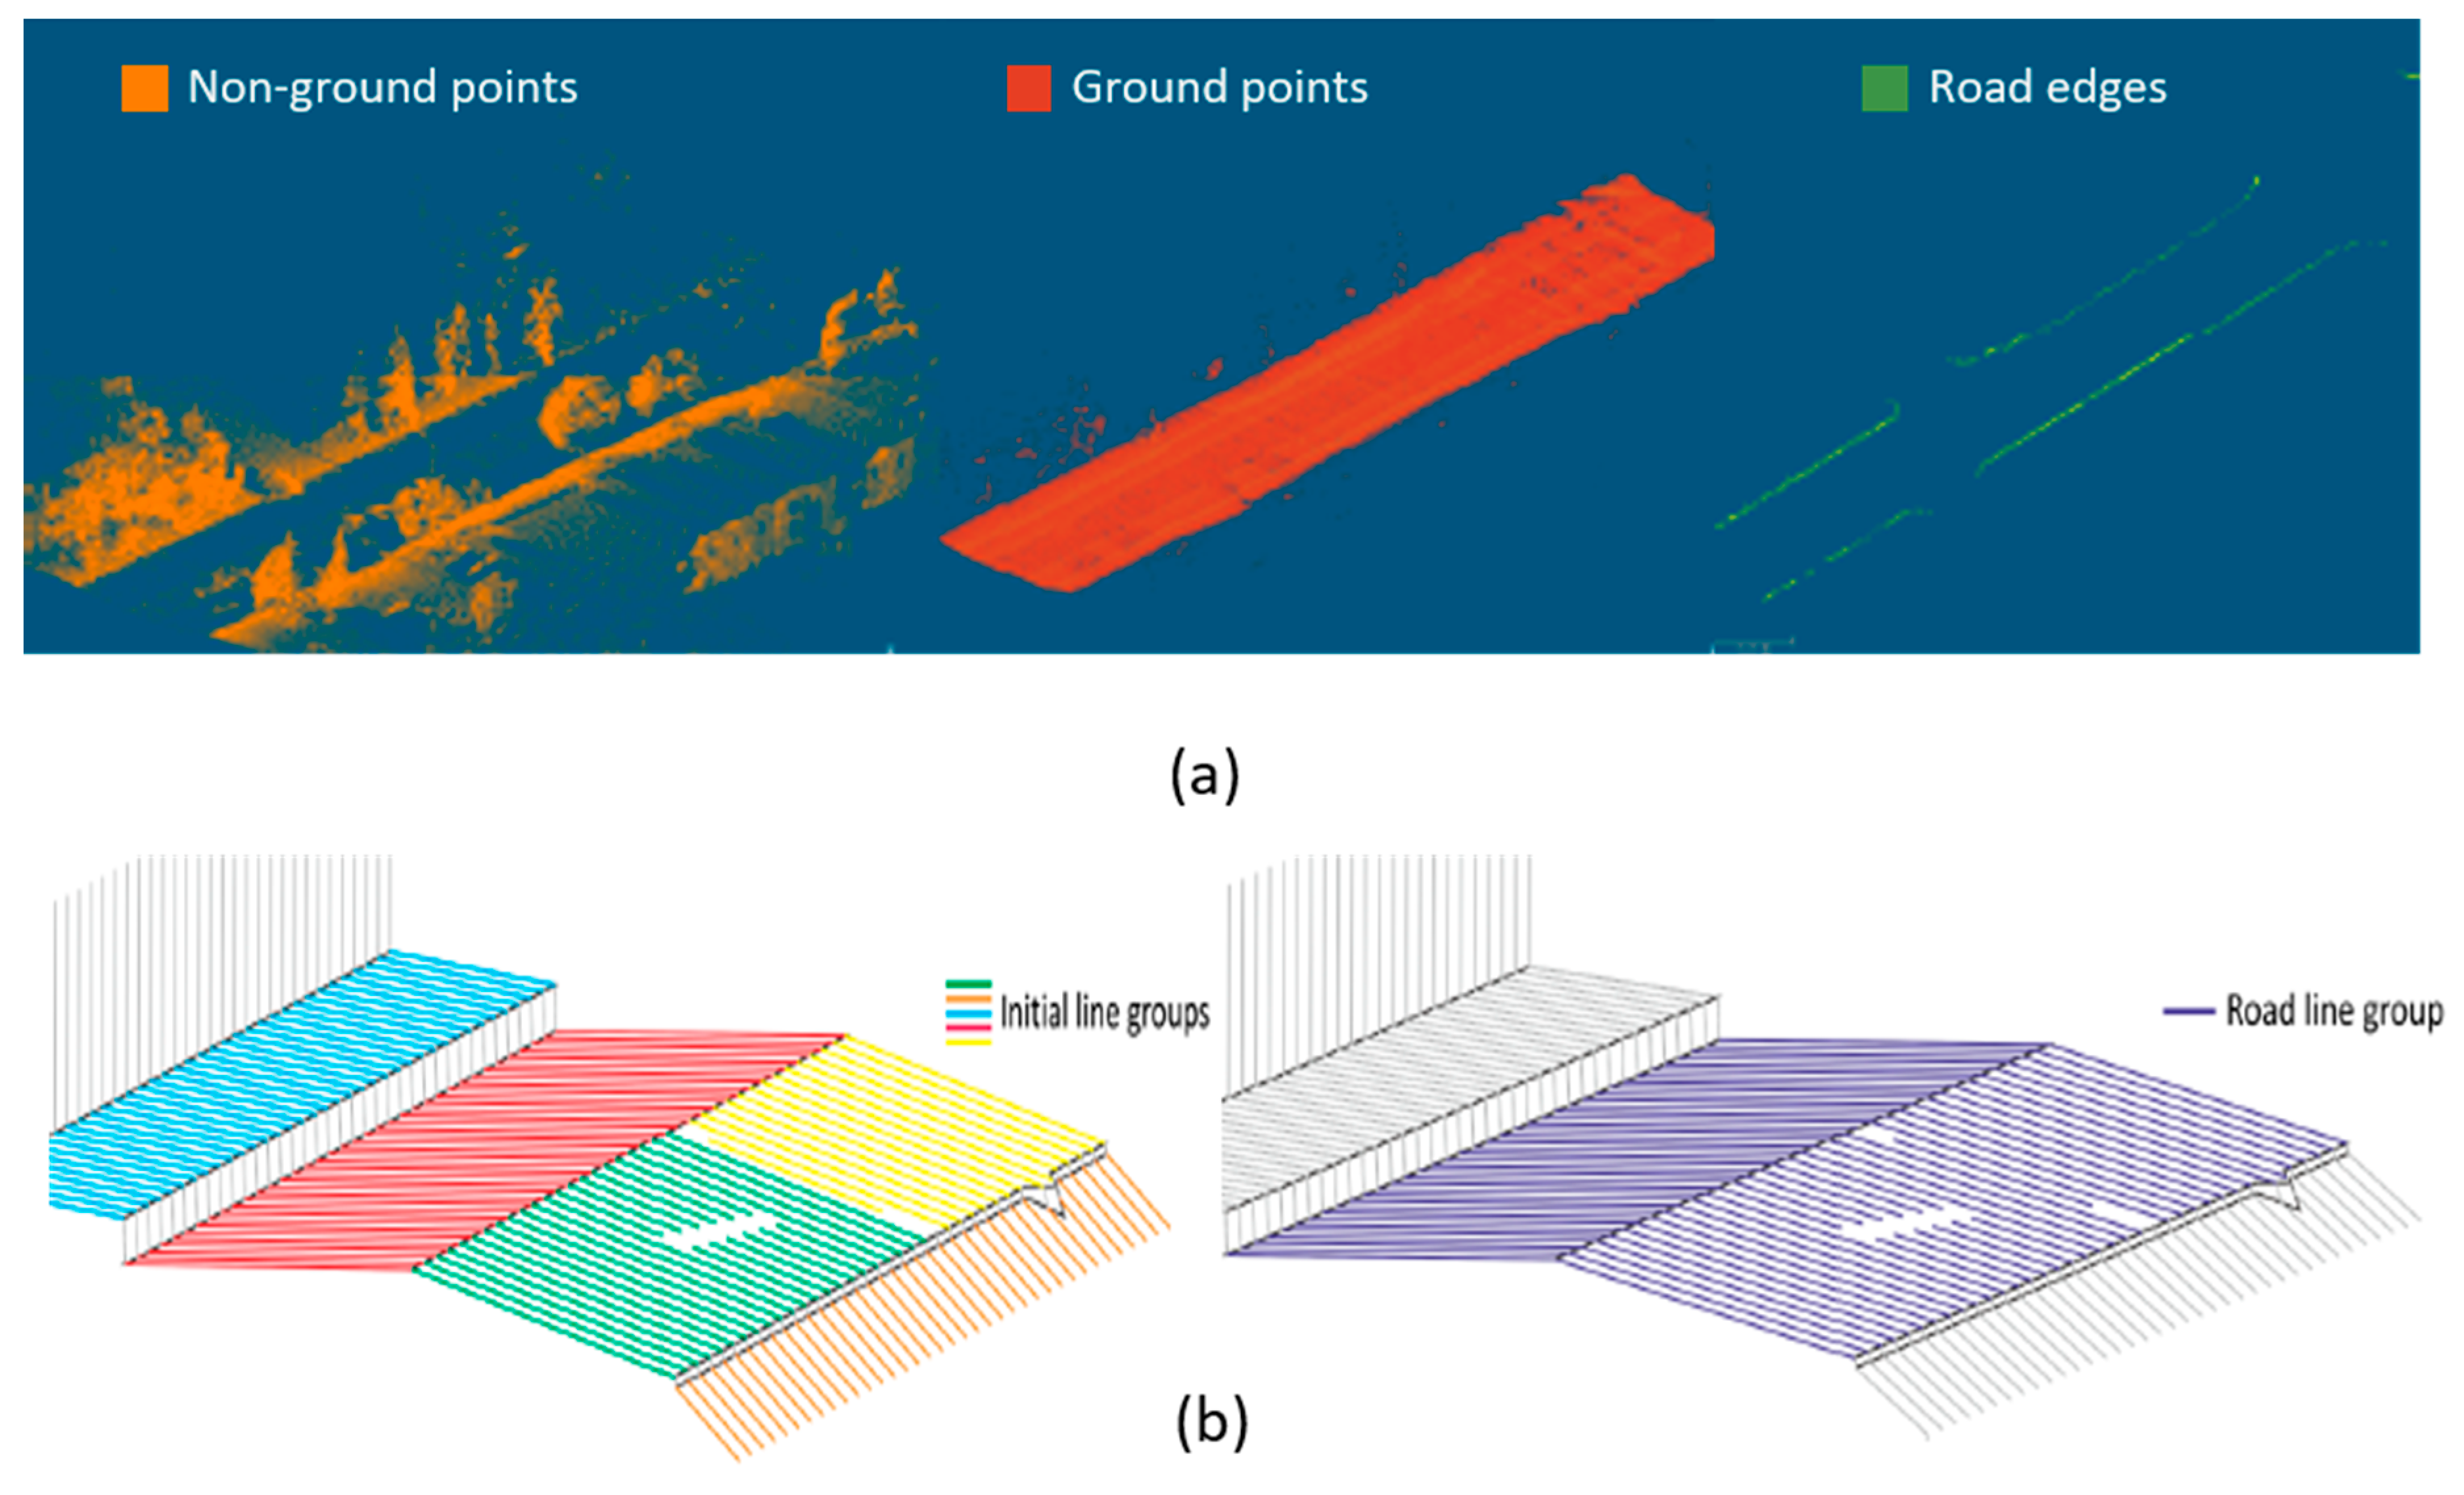
- Road surface extraction based on its structure: A common approach for road surface extraction relies on the definition of road edges that delineate its limits. This approach has been evolving since the beginning of this decade. Ibrahim and Lichti [50] propose a sequential analysis that segments the ground based on the point density and then using a Gaussian filtering to detect curbs and extract the road surface afterwards (Figure 3a). These steps are analogous in similar works, changing the curb detection method. Some works perform a rasterization (projection of the 3D point cloud in a gridded XY plane generating two dimensional geo-referenced feature (2D GRF) images) and detect curbs using image processing methods such as the parametric active contour or snake model [51,52] or image morphology [53,54]. Guan et al. [55] generate pseudo-scan lines in the plane perpendicular to the trajectory of the vehicle to detect curbs by measuring slope differences. Differently, a number of approaches have been developed for curb detection directly in 3D data using point cloud geometric properties such as density and elevation [56], or derived properties such as saliency, which measures the orientation of a point normal vector with respect to the ground plane normal vector [57] and has been successfully used to extract curbs or salient points in different works [58,59]. Xu et al. [60] use an energy function based on the elevation gradient of previously generated voxels (3D equivalent of pixels) to extract curbs, and a least cost path model to refine them. Using voxels allows one to define local information by defining parameters within each voxel and to reduce the computational load, so they are commonly used for road extraction [61,62]. Hata et al. [63] propose a robust regression method named Least Trimmed Squares (LTS) to deal with occlusions that may cause discontinuities on road edge detection. A different approach can be found in Cabo et al. [64], where the point cloud is transformed into a structured line cloud and lines are grouped to detect the edges (Figure 3b). Although good results can be found among these works, most of them rely on curbs to define road edges, hence the extraction of the road surface will not be robust when it is not delimited by curbs, as is the case in most non-urban roads.
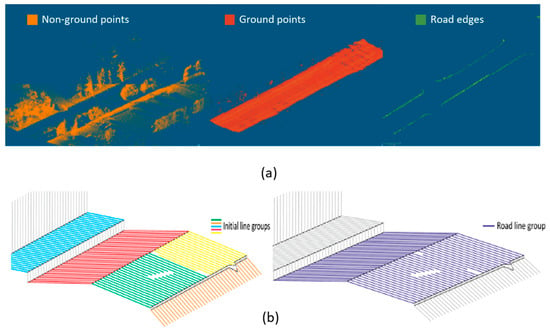 Figure 3. Road surface extraction. (a) Ibrahim and Lichti [50] segment non-ground (left) and ground (center) using a density-based filter. Then, a 3D edge detection algorithm based on local morphology and Gaussian filtering extracts road edges (right). (b) Cabo et al. [64] scan lines are grouped based on length, tilt angle and azimuth, and the initial groups (left) are joined following predefined rules using the vehicle trajectory to define the road surface (right).
 - Road surface extraction based on feature calculation: A different approach for road surface extraction is based on previous knowledge about its geometry and contextual features, which can be identified on the 3D point cloud data. Guo et al. [65] filter points based on their height with respect to the ground and then extract the road surface via TIN (Triangulated Irregular Network) filter refinement. Generally, the elevation coordinate of the point cloud is the key feature that is employed for road surface extraction: Serna and Marcotegui [66,67] defined the -flat zones algorithm, which analyses the local height difference of the point cloud projected on the XY plane. Additionally, Fan et al. [68] employ a height histogram for detecting ground points as a pre-processing step on an object detection application. Another feature that is commonly used is the roughness of the road surface. Díaz–Vilariño et al. [69] present an analysis of roughness descriptors that are able to classify different types of road pavements (stone, asphalt) with accuracy. Similarly, Yadav et al. [70] employ roughness, together with radiometric features (assuming uniform intensity as a property of the road) and 2D point density, to delineate road surfaces from non-road surfaces. As it was the case for curb detection methods, there are scan line-based methods that rely on the point topology [71] or density [72] across the scan line for extracting the road surface.
Viewing this analysis, it can be seen that there exist a large number of works focused on the extraction of the ground or the road surface but there still is not an established standard for this process and it is typically designed ad hoc for a more complex final application.
Road markings and driving lanes:
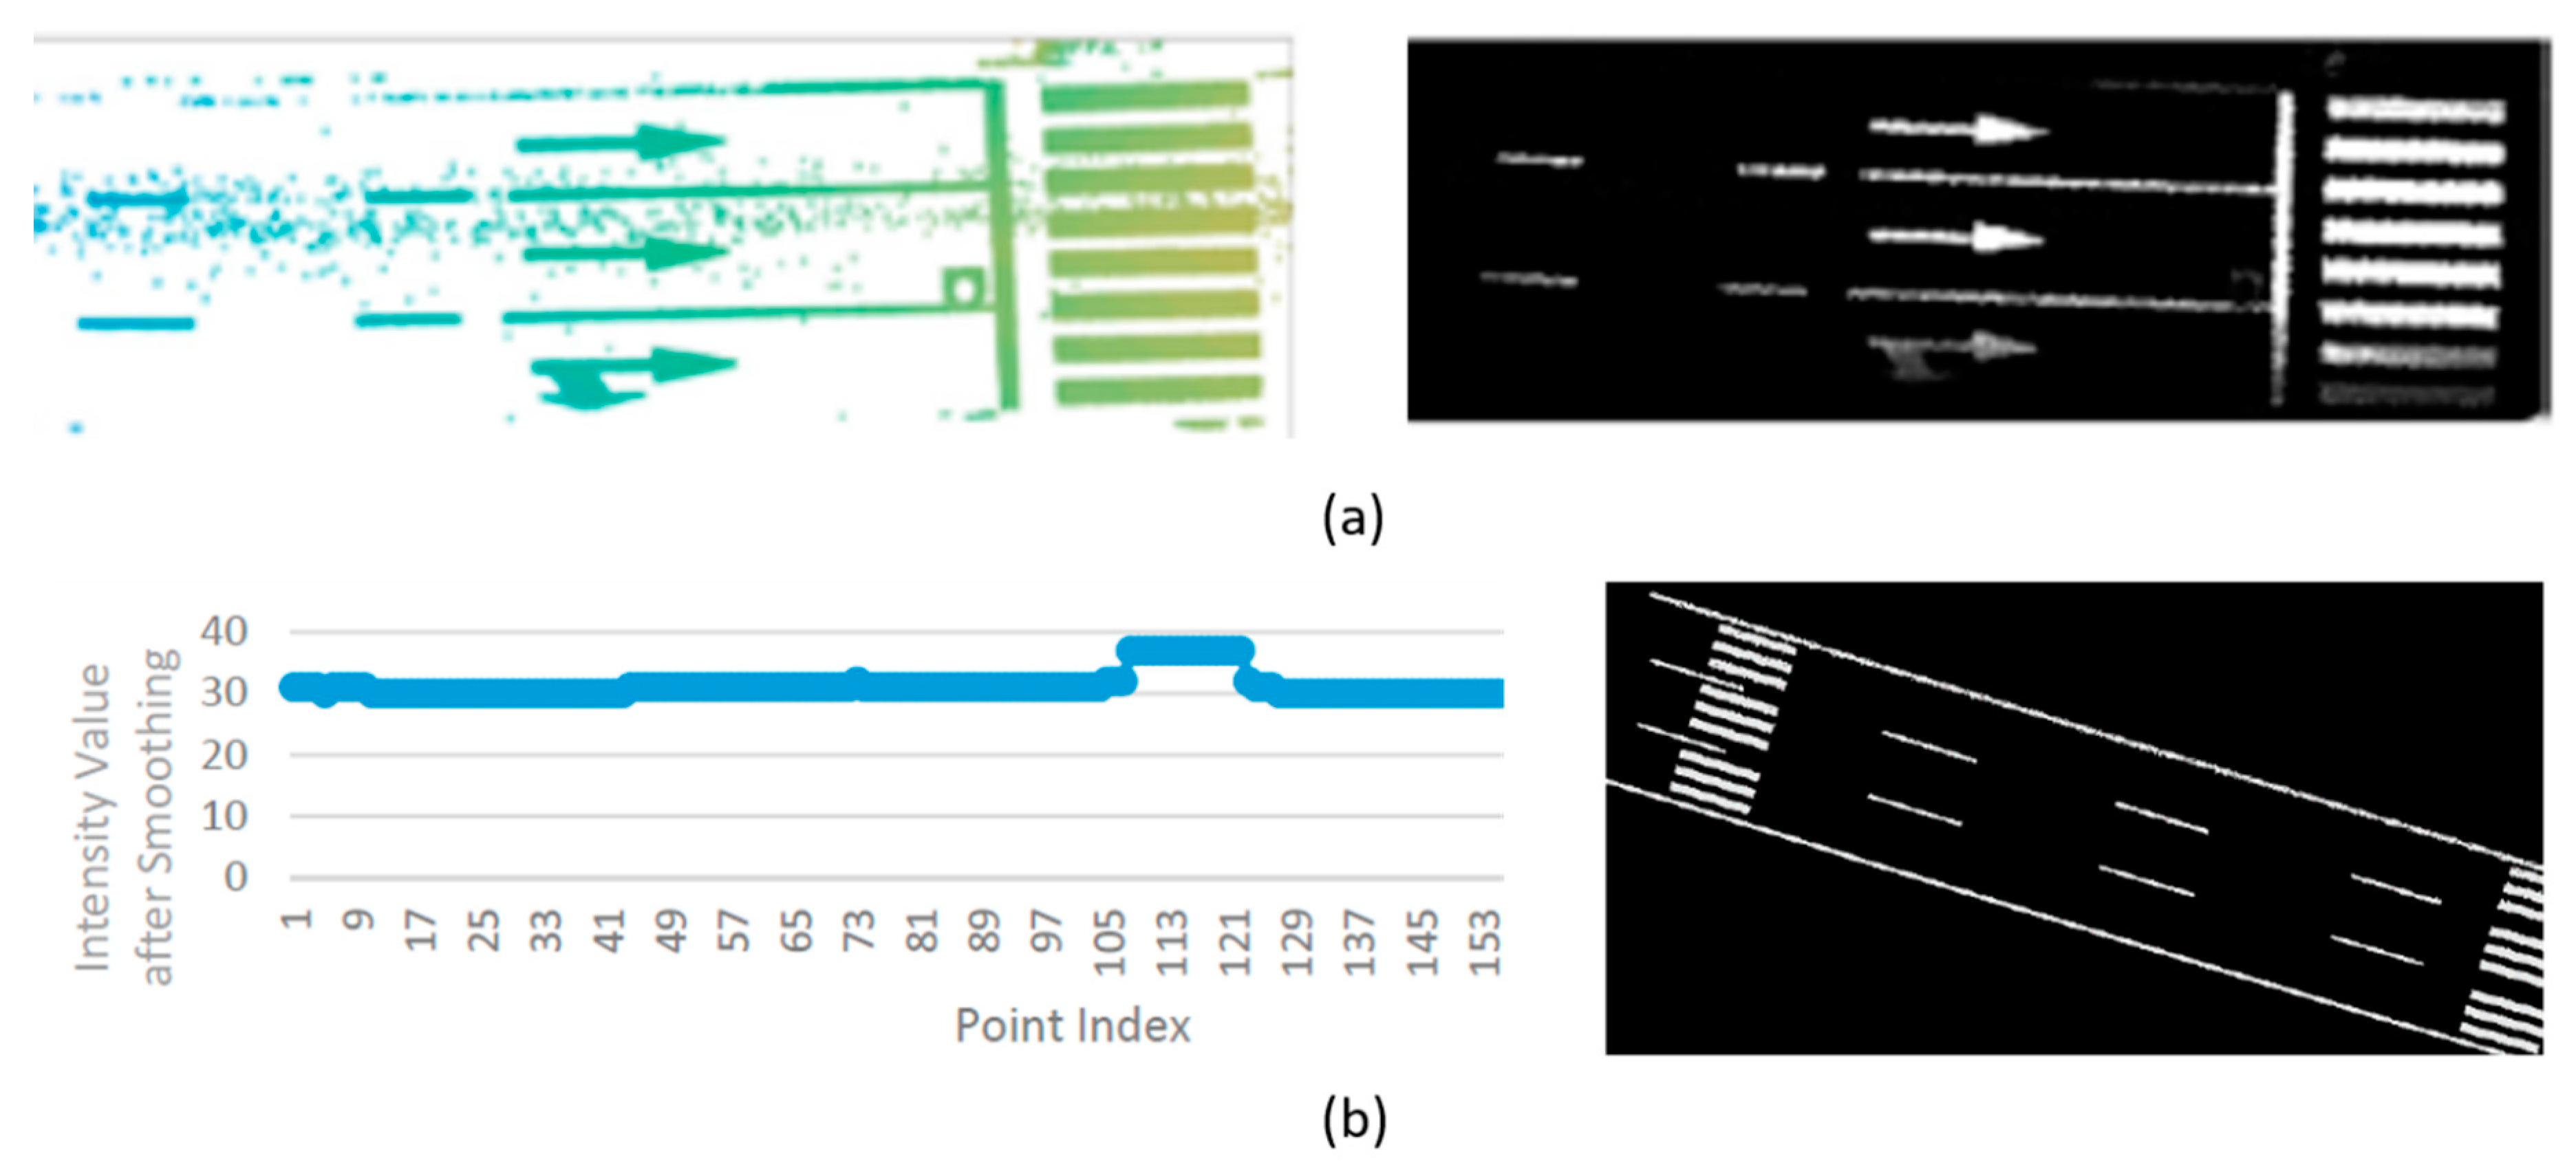
Derived from road extraction methods, there exists a vast literature focused on the automatic detection of road markings, which are highly important road elements as they are one of the main information sources for drivers and pedestrians. This automation may assist maintenance and inventory tasks, reducing both the cost of the process and the subjectivity of the inspection activities [73]. The main feature that allows the detection of road markings using 3D point clouds as its data source is its reflectivity, which is translated into larger radiometric attributes of the 3D data. Most road marking detection works to exploit this feature once the road pavement is extracted. Guo et al. [65], for example, generate raster binary images based on the intensity of the road points and extract different classes of road markings. As it can be seen in Figure 4, the generation of binary images based on point cloud intensity is a common approach [73,74,75,76,77,78], making the principal differences among these works the features employed for road marking detection and the classification methods employed: Some works rely on previous knowledge and heuristics to classify different road markings [79,80], while others follow a more recent trend based on machine learning [73] or deep learning [81]. A comprehensive summary of these methodological differences is shown in Table 3. As it can be seen, automatic road marking detection and classification using data from LiDAR scanners is more than feasible, and may be a standard data source not only for road marking inspection but for applications such as driving line generation [77,82,83]. Regarding other applications, such as autonomous driving where real-time information is required, road marking recognition is carried out using RGB images analysed by machine learning or deep learning classification models [84,85,86,87].
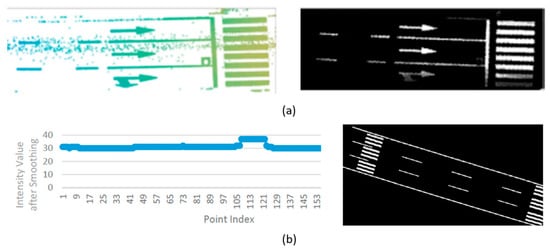
Figure 4.
Road markings and driving lanes. (a) Soilán et al. [73] apply an intensity filter on the point cloud (left) and generate a 2D GRF image representing the road markings (right). (b) Yan et al. [78] propose a scan line-based method using the gradient of point intensity to detect road marking points on each scan line (left) and generate a 2D GRF image representing the road markings (right).

Table 3.
Summary of state-of-the-art works for road marking extraction.
Road cracks and manhole covers:
Detecting and positioning road cracks is another relevant application that has been addressed by researchers using LiDAR-based technologies. Using 3D point clouds, Yu et al. [89] extract 3D crack skeletons using a sequential approach based on a preliminary intensity-based filtering, followed by a spatial density filtering, a Euclidean clustering, and an -median-based crack skeleton extraction method. However, 3D methods are not the most common approaches for crack detection, as the 3D point clouds are typically projected into 2D GRF images based on different features such as intensity [90] or minimum height [91], to detect road cracks. Guan et al. [90] define an Iterative Tensor Voting, while Chen et al. [91] perform convolutions with predefined kernels over their GRF images. Cracks also can be detected with other sensors that are typically mounted on MLS systems. There exist computer vision approaches that analyse images, as done by Gavilán et al. [92] using line scan cameras, and there also exist approaches using Ground Penetrating Radar (GPR) [93] and thermal imaging [94]. Another relevant road surface element, especially in urban environments, are manhole covers which also can be automatically detected using 3D point clouds. Guan et al. [95] use an analogous approach for detecting cracks [90], that is, generating a GRF image and applying multi-scale tensor voting and morphological operations to extract manhole covers. Yu et al. [96] generate GRF images as well, but detect manhole covers based on a multilayer feature generation model and a random forest model for classification.
3.1.2. Off-Road Surface Monitoring
The elements of interest are not the road surface or its elements in several infrastructure monitoring applications, rather different objects or infrastructure assets that play a relevant role on the correct performance of the network. This section will analyse the state-of-the-art regarding the monitoring of those elements and assets, namely: traffic signs, pole-like objects and roadside trees.
Traffic signs:
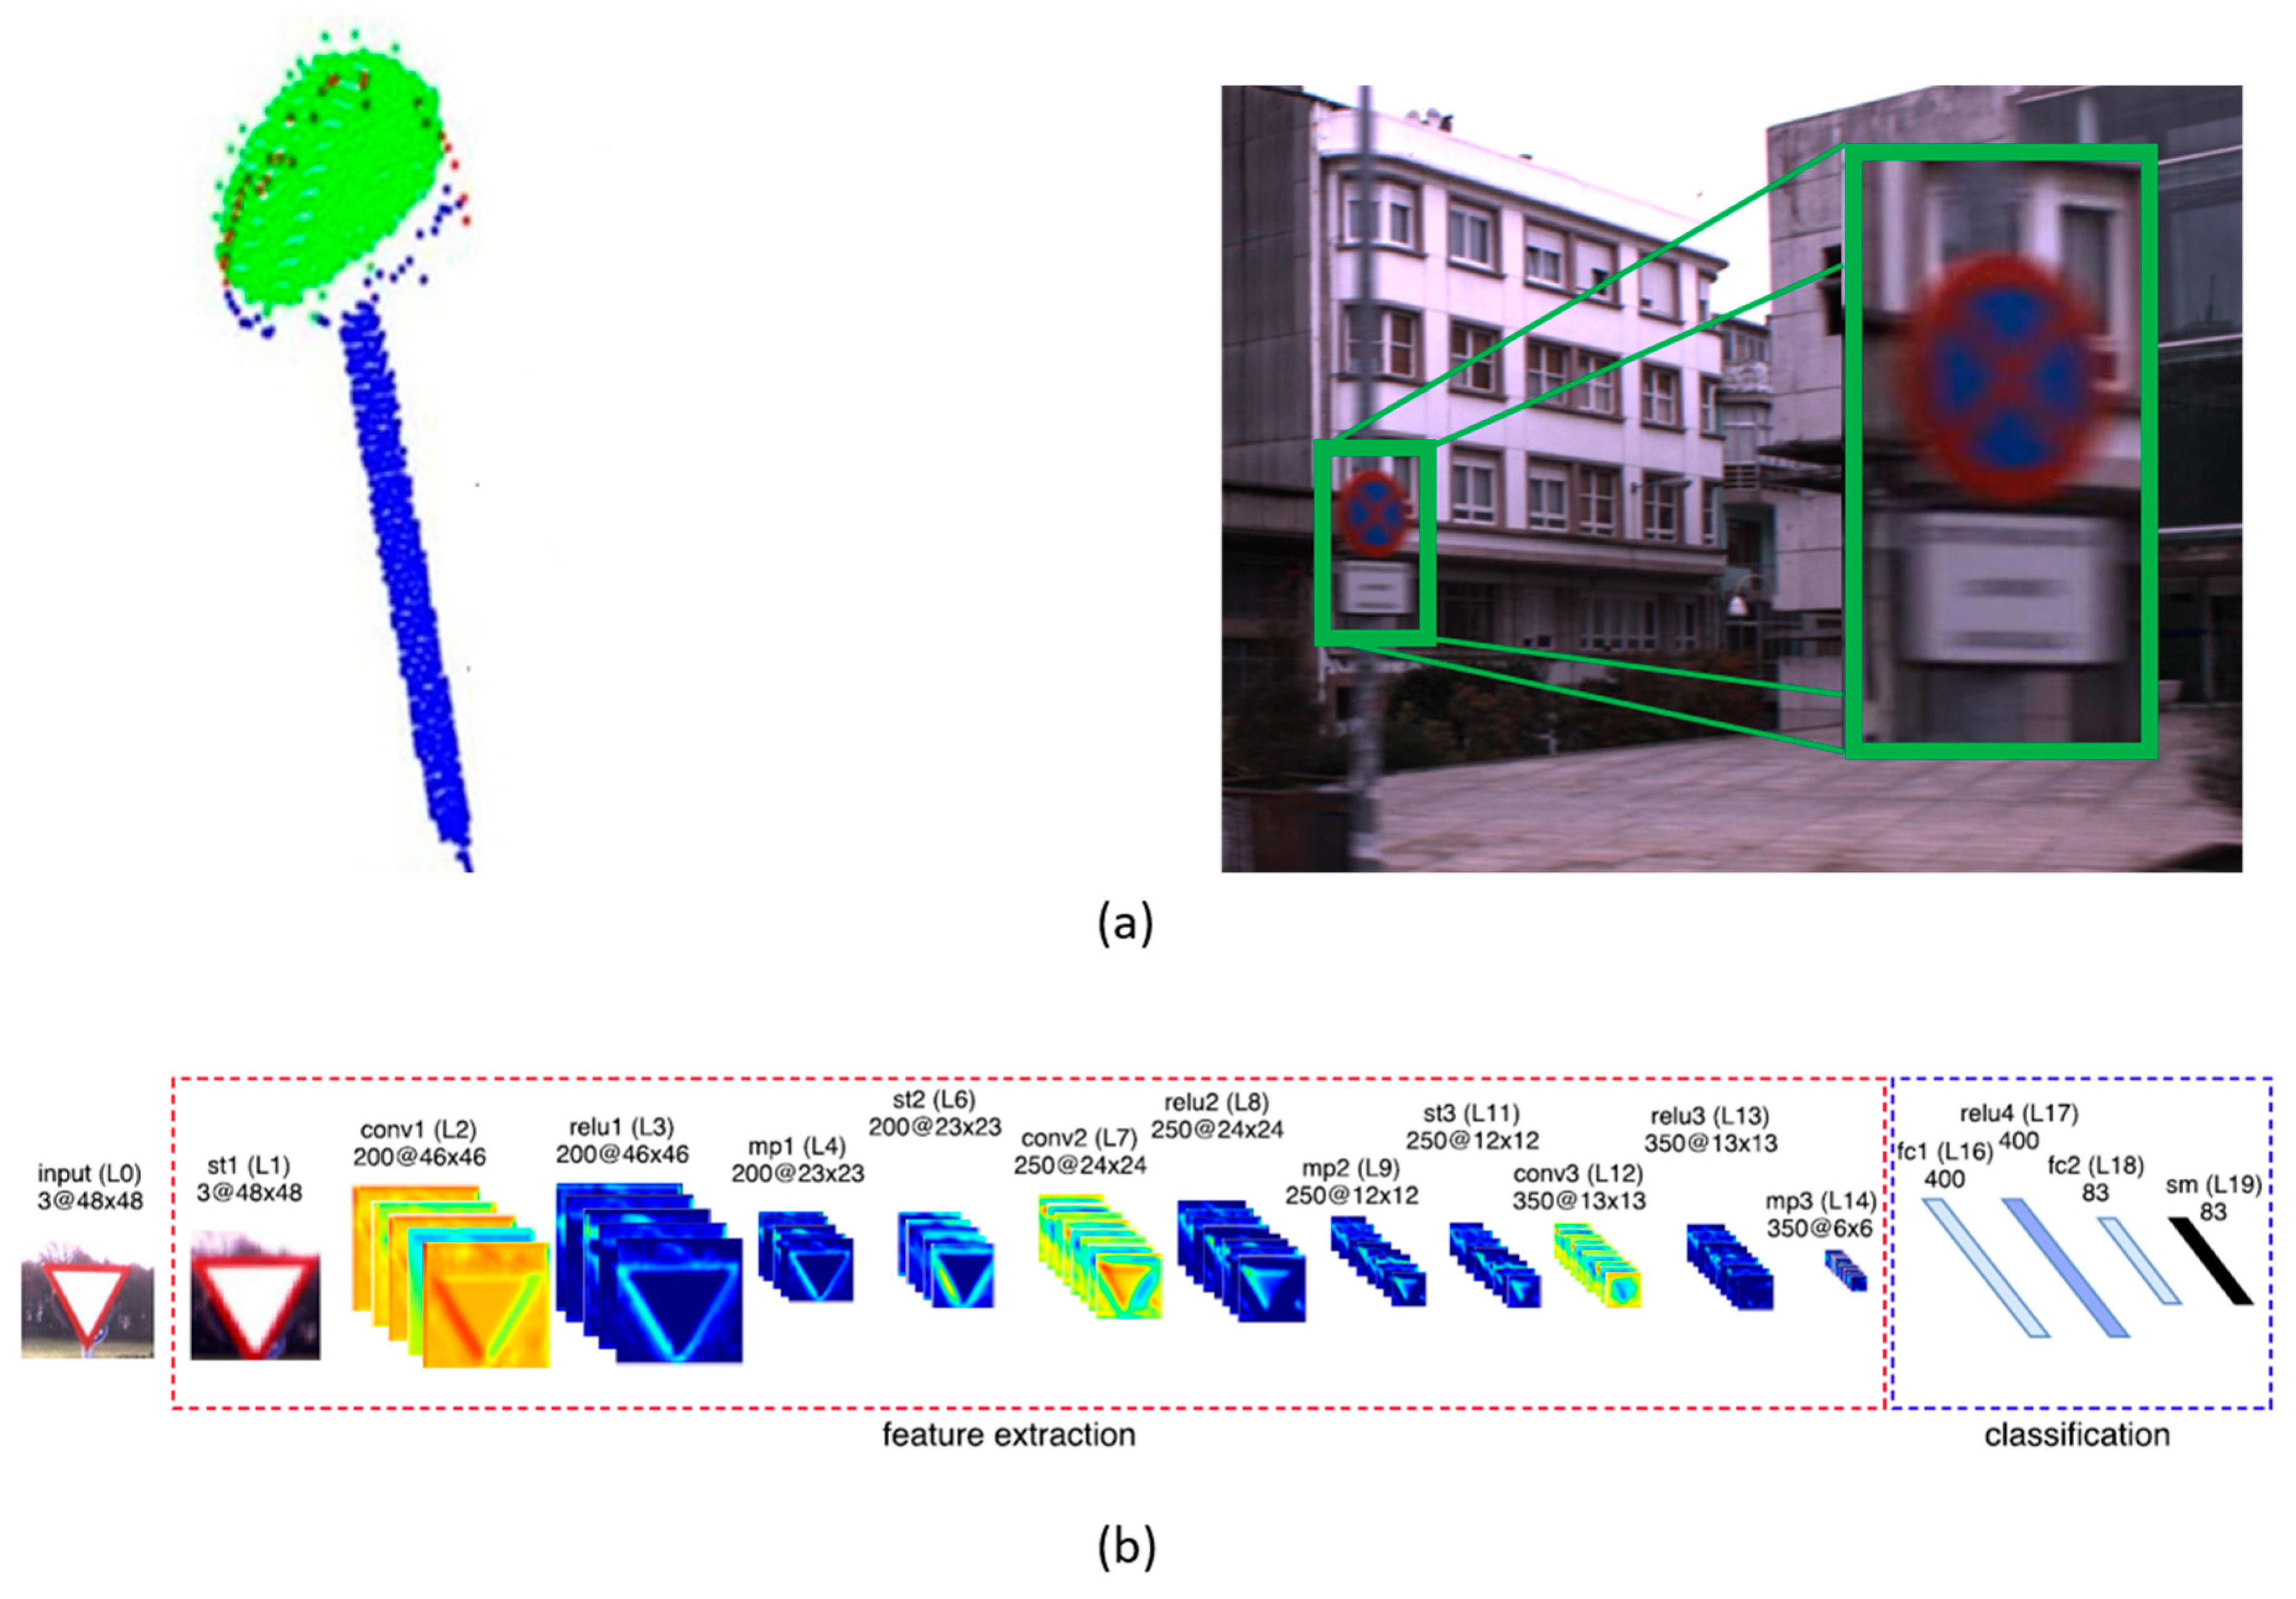
Traffic signs play a clearly important role in the transportation network as one of the main information sources for drivers, together with road markings. Their standardized geometry and reflective properties have encouraged researchers to develop different methods for the automatic detection and recognition of road markings from MLS systems data. Pu et al. [38] show that, based on a collection of characteristics such as size, shape or orientation, it is possible to recognize different objects, provided previous knowledge of their geometry. Not only geometry but the radiometric properties (high reflectance) of traffic sign panels have been used recurrently for traffic sign detection. Ai and Tsai propose a traffic sign detection process which filters a 3D point cloud based on intensity, elevation and lateral offset [97]. The method is able to evaluate the retroreflectivity condition of the traffic sign panels, which is directly related to the wear and tear of the material and is a relevant feature for traffic sign monitoring [98]. Unlike road markings, there are only a few works that rely on 2D GRF images for traffic sign detection. Riveiro et al. [99] filter the point cloud by generating a 2D raster based on point intensity values, simplifying the detection of traffic sign panels using a Gaussian Mixture Model afterwards. Furthermore, they generate raster images on the plane of the detected traffic signs to recognize their shape. However, 3D point cloud data resolution is still not enough to extract semantic information of the traffic signs [100], hence, that recognition is typically performed on RGB images from the cameras of the MLS system. Traffic sign panel detection primarily relies on an intensity-based filter of the 3D point clouds, followed by different filtering strategies based on geometric and dimensionality features [100,101,102,103,104] (Figure 5a). A different approach for traffic sign detection can be found in Yu et al. [105], where a supervoxel-based bag-of-visual-phrases is defined and traffic signs are detected based on their feature region description. Given that the 3D point clouds are spatio-temporally synchronized with 2D images in a MLS system, it is straightforward to extract images of the traffic sign panels and perform computer vision processes on them to extract semantic information: Some works rely on machine learning strategies such as Support Vector Machines using custom descriptors [100] or existing features such as a Histogram of Oriented Gradients (HOG) [106], while others rely on the more recent trend of Deep Learning—approaching an end-to-end recognition process using Deep Bolztmann Machines [104,105] or convolutional neural networks [107] (Figure 5b). These techniques also are employed using only imagery data [108,109]. All the mentioned work is summarized in Table 4.
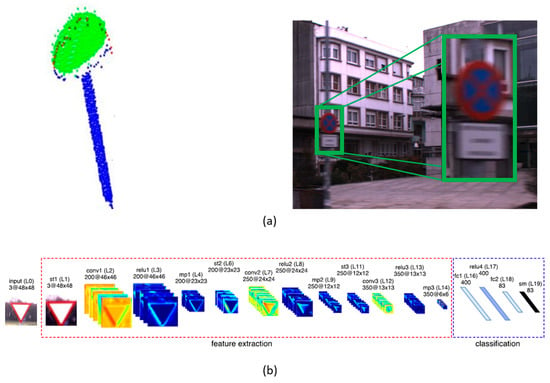
Figure 5.
Traffic signs. (a) Soilán et al. [100] detect traffic sign panels applying intensity filters on a previously segmented point cloud (left), define geometric parameters for each traffic sign and project the panel on georeferenced RGB images (right). (b) Arcos et al. [107] classify those RGB images applying a Deep Neural Network that comprises convolutional and spatial transformer layers.

Table 4.
Summary of state-of-the-art works for traffic sign detection.
Pole-like objects:
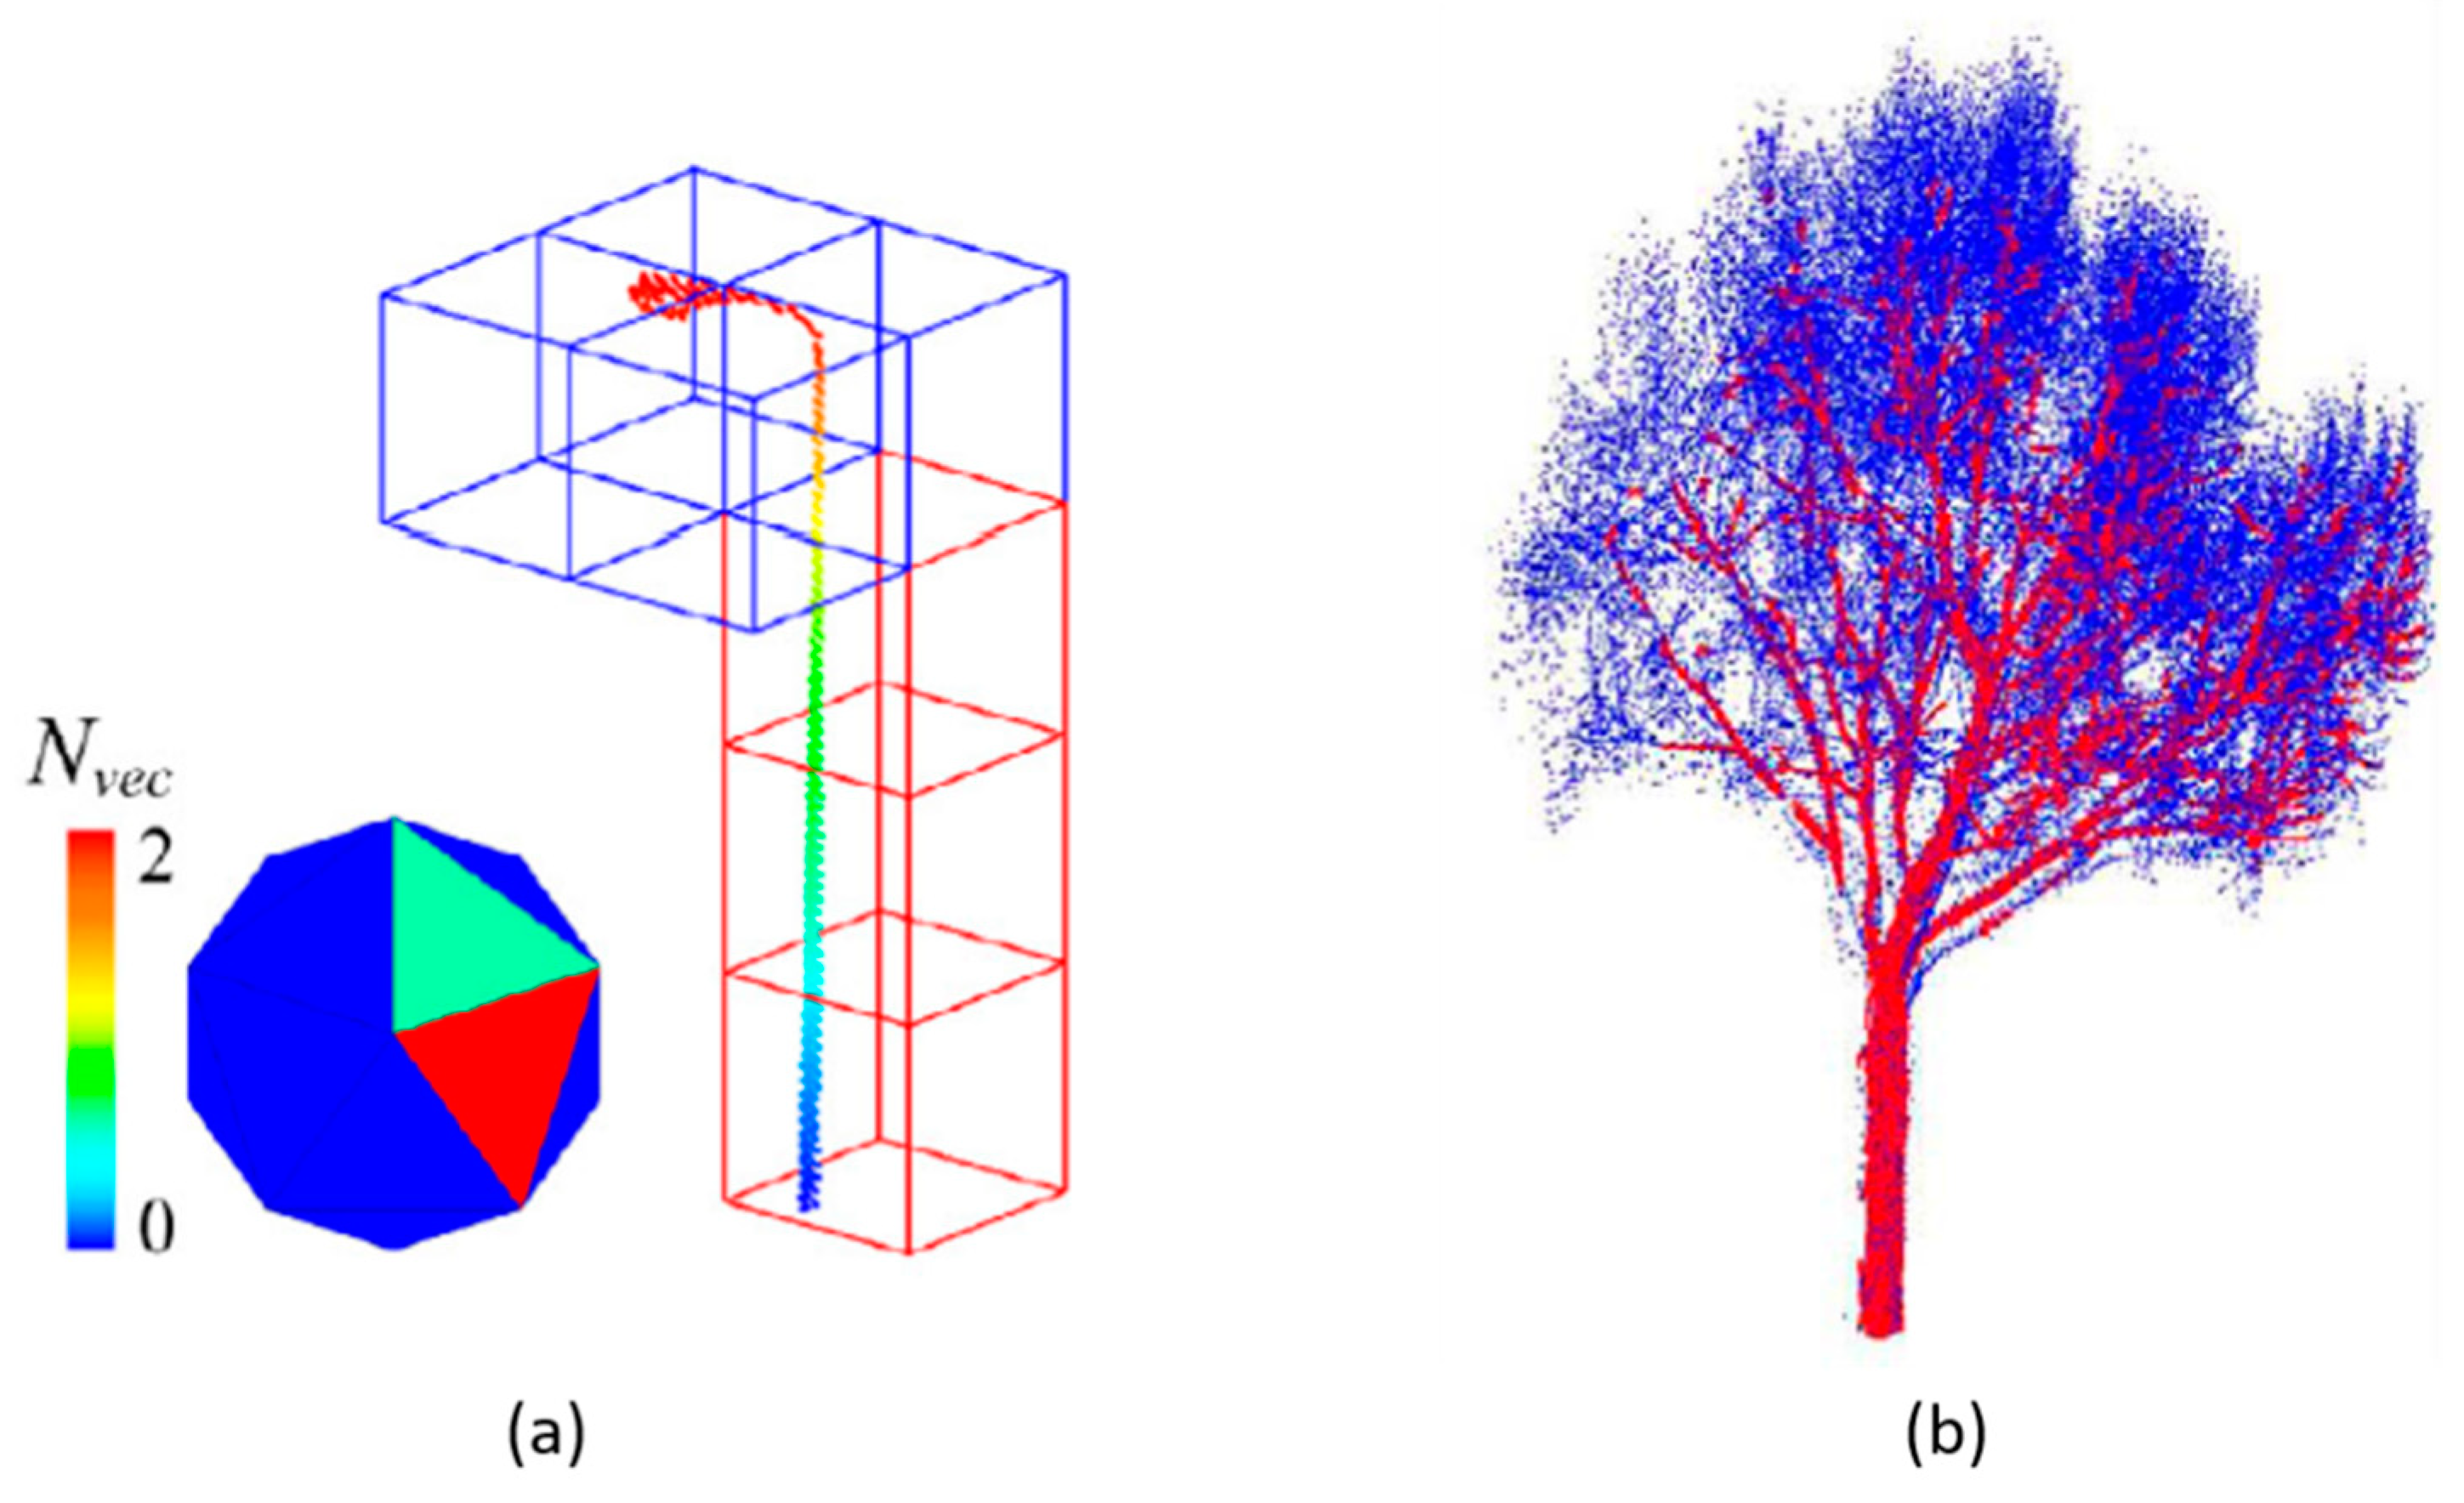
Detecting pole-like objects is a common objective in 3D point cloud processing works as their geometry is well defined and easily recognizable when monitored by a LiDAR-based system. They are typically used to detect street lights or power line poles [110]. Ground segmentation is usually a pre-processing step as ground removal leads to an isolation of off-road objects. Subsequently, there are many processing strategies to detect pole-like objects. Yu et al. [111] group 3D points with an Euclidean cluster, refine them with a Normalized Cut segmentation and then construct a Pairwise 3-D shape context to detect pole-like objects with a similarity measurement. A 3-D shape feature also is developed by Guan et al. [112] where each object is compared against a bag of contextual visual words [113]. Similarly, Wang et al. [114] develop a 3D descriptor (SigVox) using an Octree and principal component analysis (PCA) to get dimensional information at different levels of detail (Figure 6a). Other notable approaches include the application of anomaly detection algorithms [115], or the development of classification models such as Random Forests [116] or Support Vector Machines [117] for shape features. Seen in a second group of approaches, those that do not rely on ground segmentation as a preliminary step used to perform a voxelization of the 3D data, pole-like objects are detected based on the voxelized structure. Cabo et al. [118] perform a relatively simple study of the local structure of occupied voxels to define pole-like objects and Li et al. [119] define an adaptive radius cylinder model given previous knowledge regarding the geometrical structure of a pole-like object. Supervoxels also are exploited for detecting pole-like objects, obtaining structure, shape or reflectance descriptors [120,121].
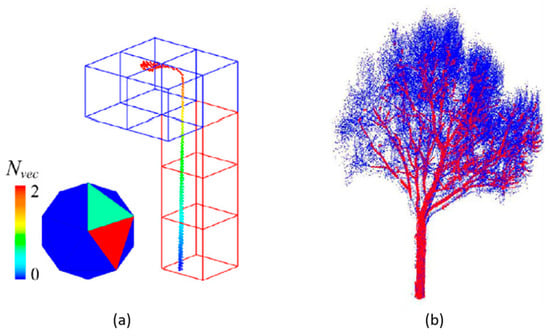
Figure 6.
Pole-like objects and roadside trees. (a) Wang et al. [114] recognize street objects using a voxel-based shape descriptor determined by the orientation of the significant eigenvectors of the object at several levels of an octree. Nvec represents the number of eigenvectors that intersect each triangle of the 3D descriptor (icosahedron) (b) Xu et al. [122] recognize trunks (red) and tree branches (blue) by optimally merging clusters of points.
Roadside trees:
Using a LiDAR-based mobile system, it is possible to map the presence of trees alongside the road network. Since there is a correlation between vegetation and fire risk in a road environment, roadside tree detection processes clearly are beneficial in road network monitoring applications. As seen for traffic sings and pole-like objects, ground segmentation is usually the first pre-processing step, isolating above ground objects. Xu et al. [122] propose an hierarchical clustering to extract trees’ nonphotosynthetic components (trunks and tree branches), formulating a proximity matrix to calculate cluster dissimilarity and solving the optimal combination to merge clusters (Figure 6b). Other clustering algorithms employed for tree extraction are the Euclidean Cluster [123,124] or, as in Li’s et al. work [125], a region growing-based clustering in a voxelized space to distinguish between trunk and crown in a tree. Machine and Deep Learning models also are developed for tree classification. Zou et al. [126] employ a Deep Belief Net (DBN) to classify different tree species from images obtained after a voxelization-rasterization process. Guan et al. [123] classify up to 10 tree species using waveform representations and Deep Boltzmann Machines. Dimensional features obtained from PCA analysis also are used for classification, with SVM [124] or Random Forests [127] as classification models.
3.1.3. Current and Future Trends
Throughout this section, different applications of LiDAR-based systems for road network monitoring have been reviewed. Most of the mentioned works have been developed in the last five years and the number of publications still is increasing yearly. As LiDAR technology continues its evolution, there are more robust solutions for specific road monitoring applications, however, there is a lack of standards in the industry to apply when LiDAR data is automatically processed. Recently, the performance of Deep Learning in 2D images has led researchers to develop Deep Learning models for 3D data [128,129,130,131] which are being developed to solve classification problems using 3D data acquired by MLS systems [81,132,133]. This paper presents an extensive literature review that describes different methods and applications for the monitoring of terrestrial transportation networks using data collected from Mobile Mapping Systems equipped with LiDAR sensors.
3.2. Railway Network Monitoring
Most of the works regarding railway infrastructure are developed using Mobile Laser Scanners, as previously presented in the introduction of this section. These are large infrastructures and the applications in which their point clouds are employed usually require a high resolution. This is why MLS is the most appropriate technology to be used for railway networks, although there are some works developed using ALS or TLS data [134,135,136].
A summary of the most relevant applications of LiDAR data concerning the railway network is shown in this section. One way of classifying the existing works in relation to railway infrastructure recognition and inspection may be by attending to the collection methods used to obtain the 3D point clouds. Likewise, Lou et al. [137] proposed a classification based on the methods followed for classifying points. Based on this, three main categories were proposed: (i) data-driven and model-driven methods, using point features and geometrical relationships; (ii) learning-based methods, which use imagery data and/or MLS point data; and (iii) multi-source data fusion methods [13,56,138,139,140,141]. Although other classification proposals also can be considered, the classification in this paper is made attending to the main goal, or application of each work (Figure 7), as proposed in Che et al. [15], where a review about object recognition, segmentation and classification using MLS point clouds in different environments, such as forest, railway and urban areas, is presented. Additionally, several figures (Figure 8, Figure 9, Figure 10, Figure 11 and Figure 12) provide extra context to some of the works cited throughout the subsequent sections.

Figure 7.
Classification of the railway network monitoring based on the application.
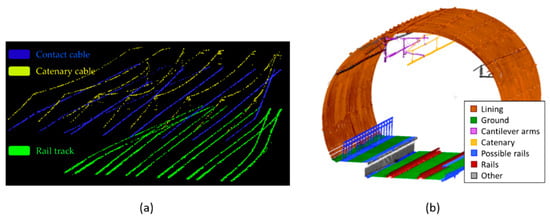
Figure 8.
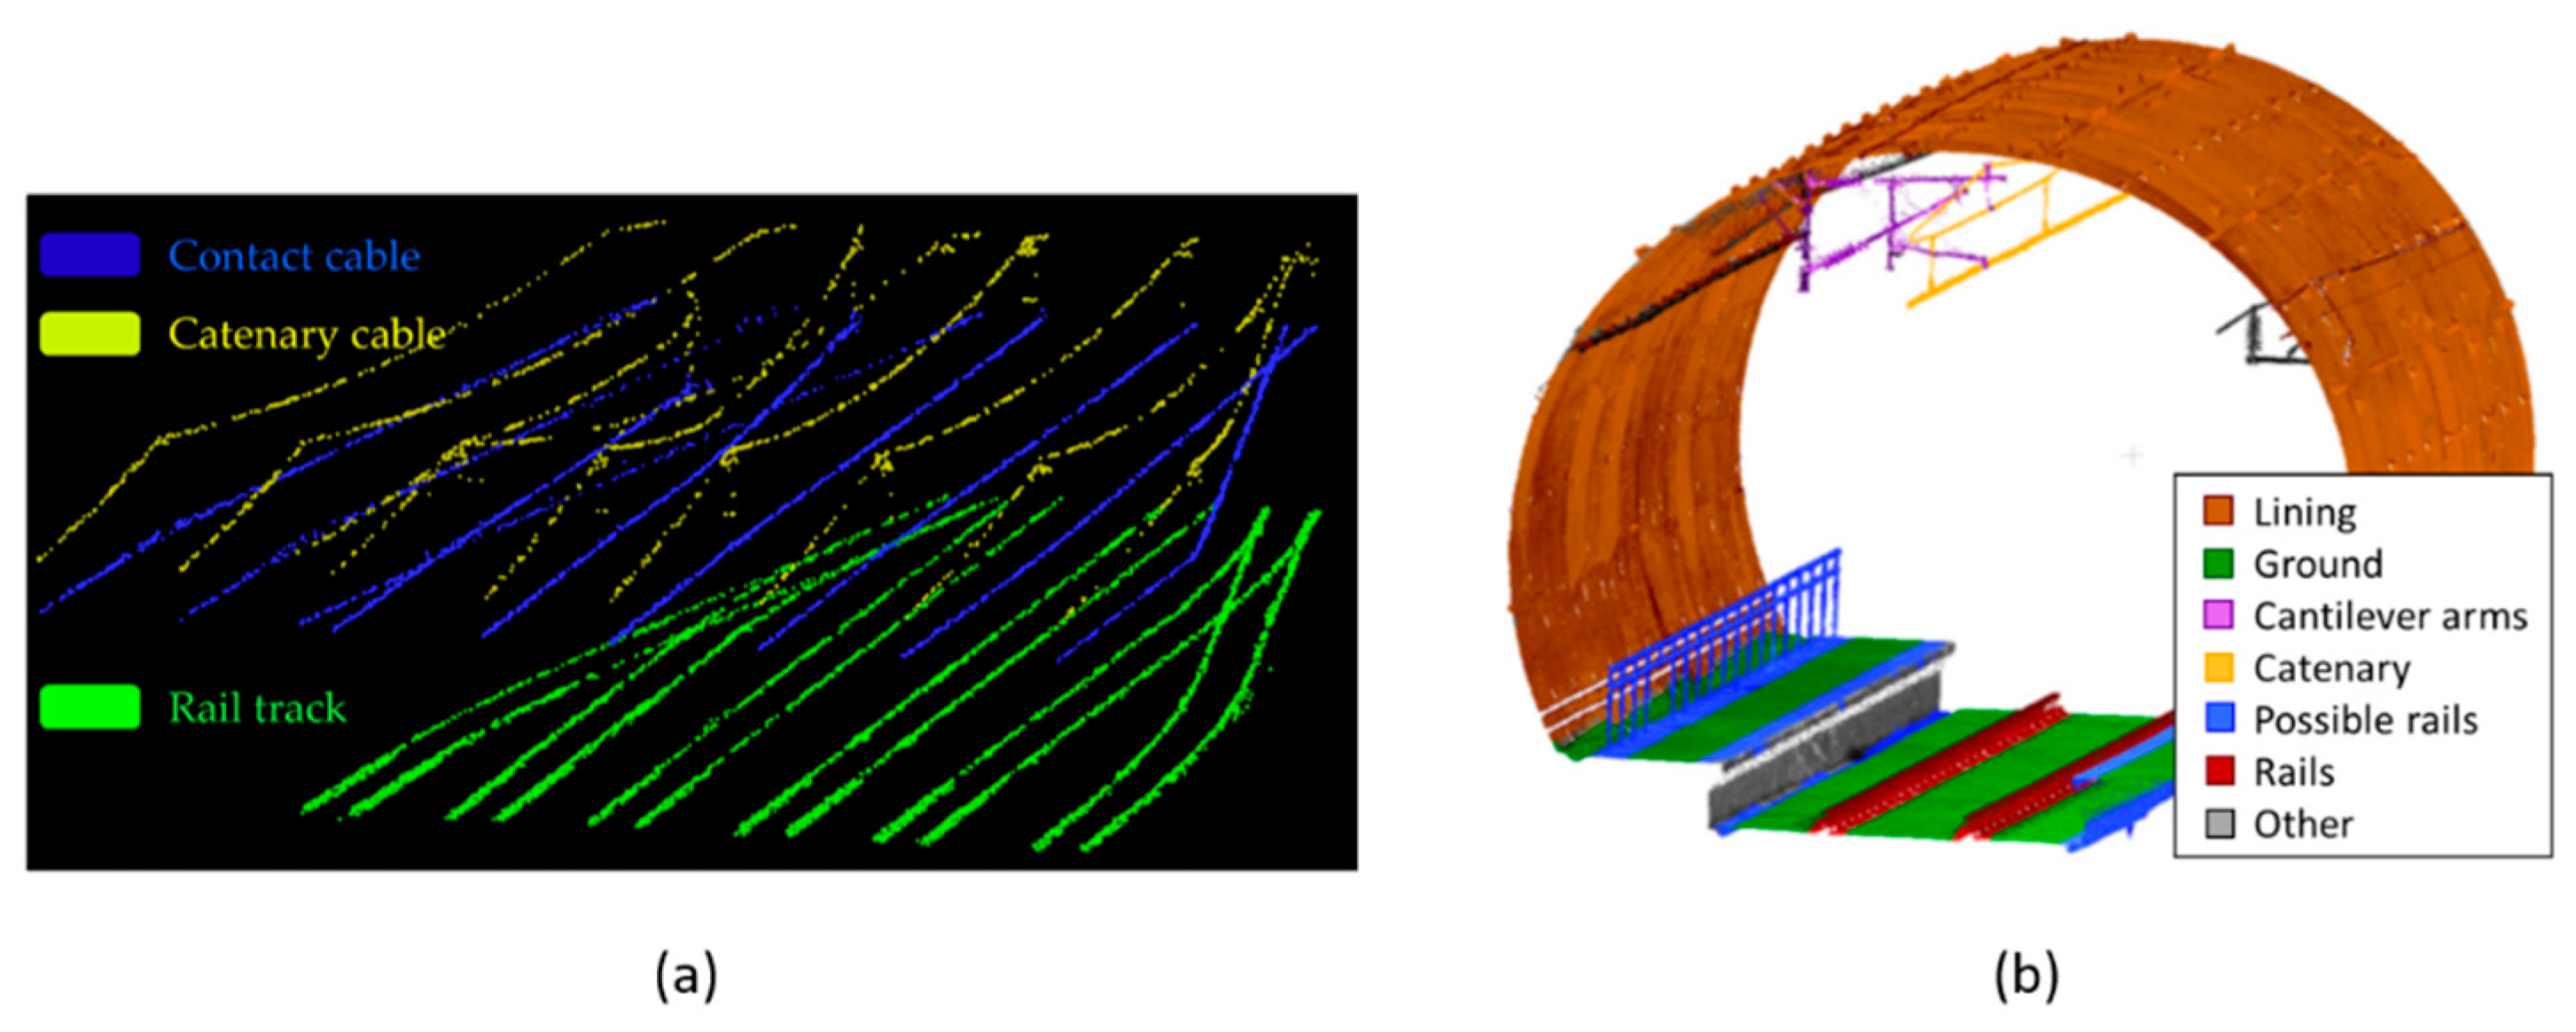
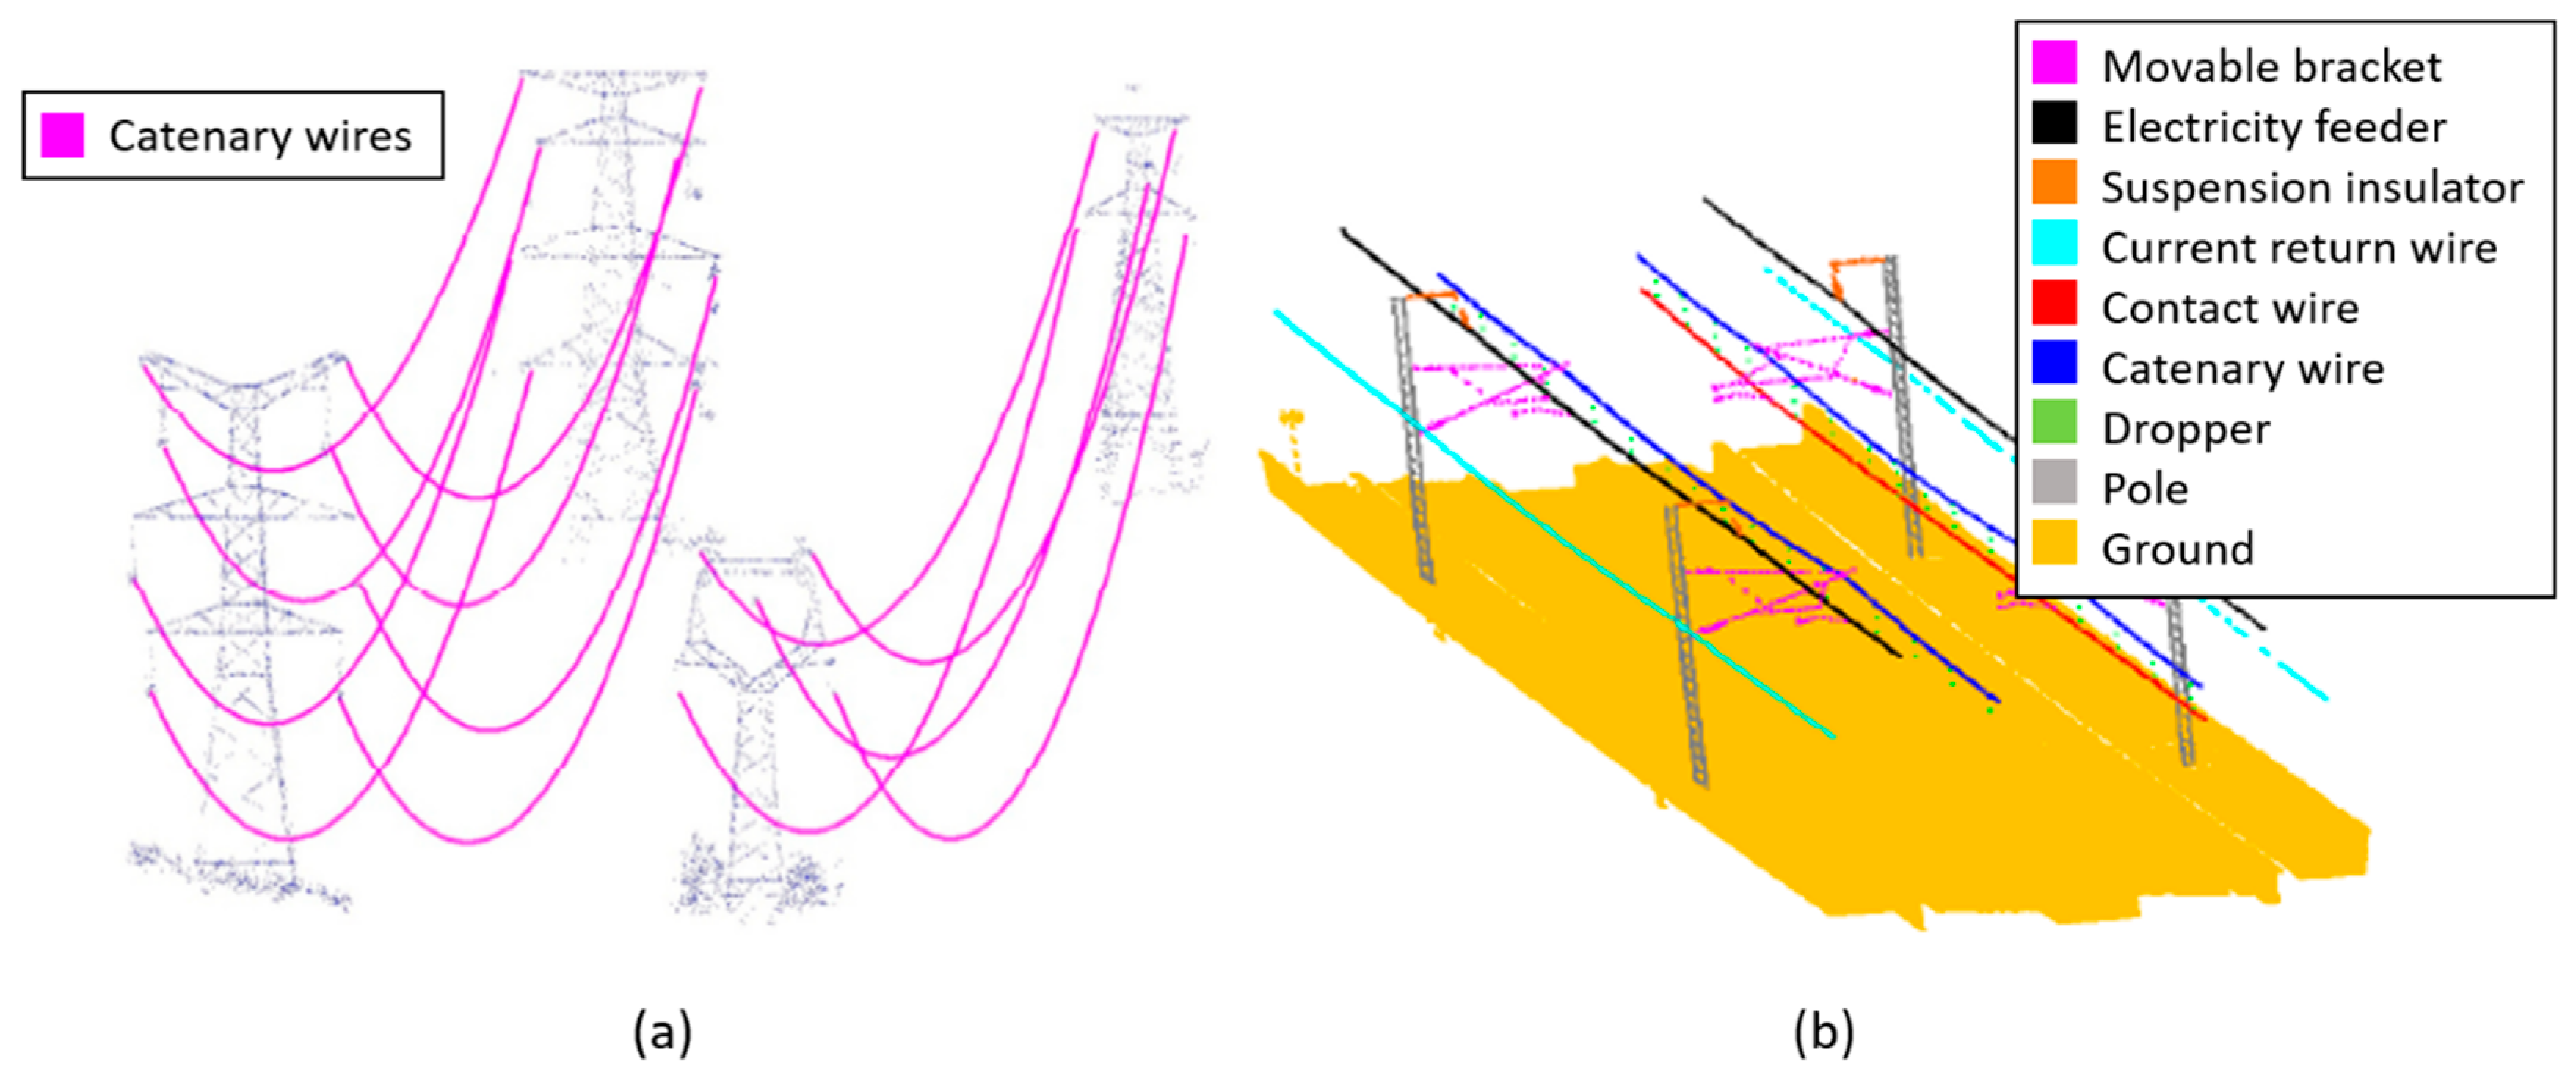
Inventory and 3D modelling.(a) Arastounia et al. [134] classified rail tracks and contact cables using an improved region growing algorithm. Then, the catenary cables’ points are classified as they are placed in the neighbourhood of the contact cables. (b) Sánchez–Rodríguez et al. [59] classified MLS data using dimensional analysis and RANSAC methods and validated the rails’ classification with SVM algorithms.
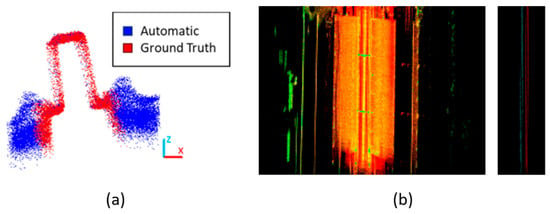
Figure 9.
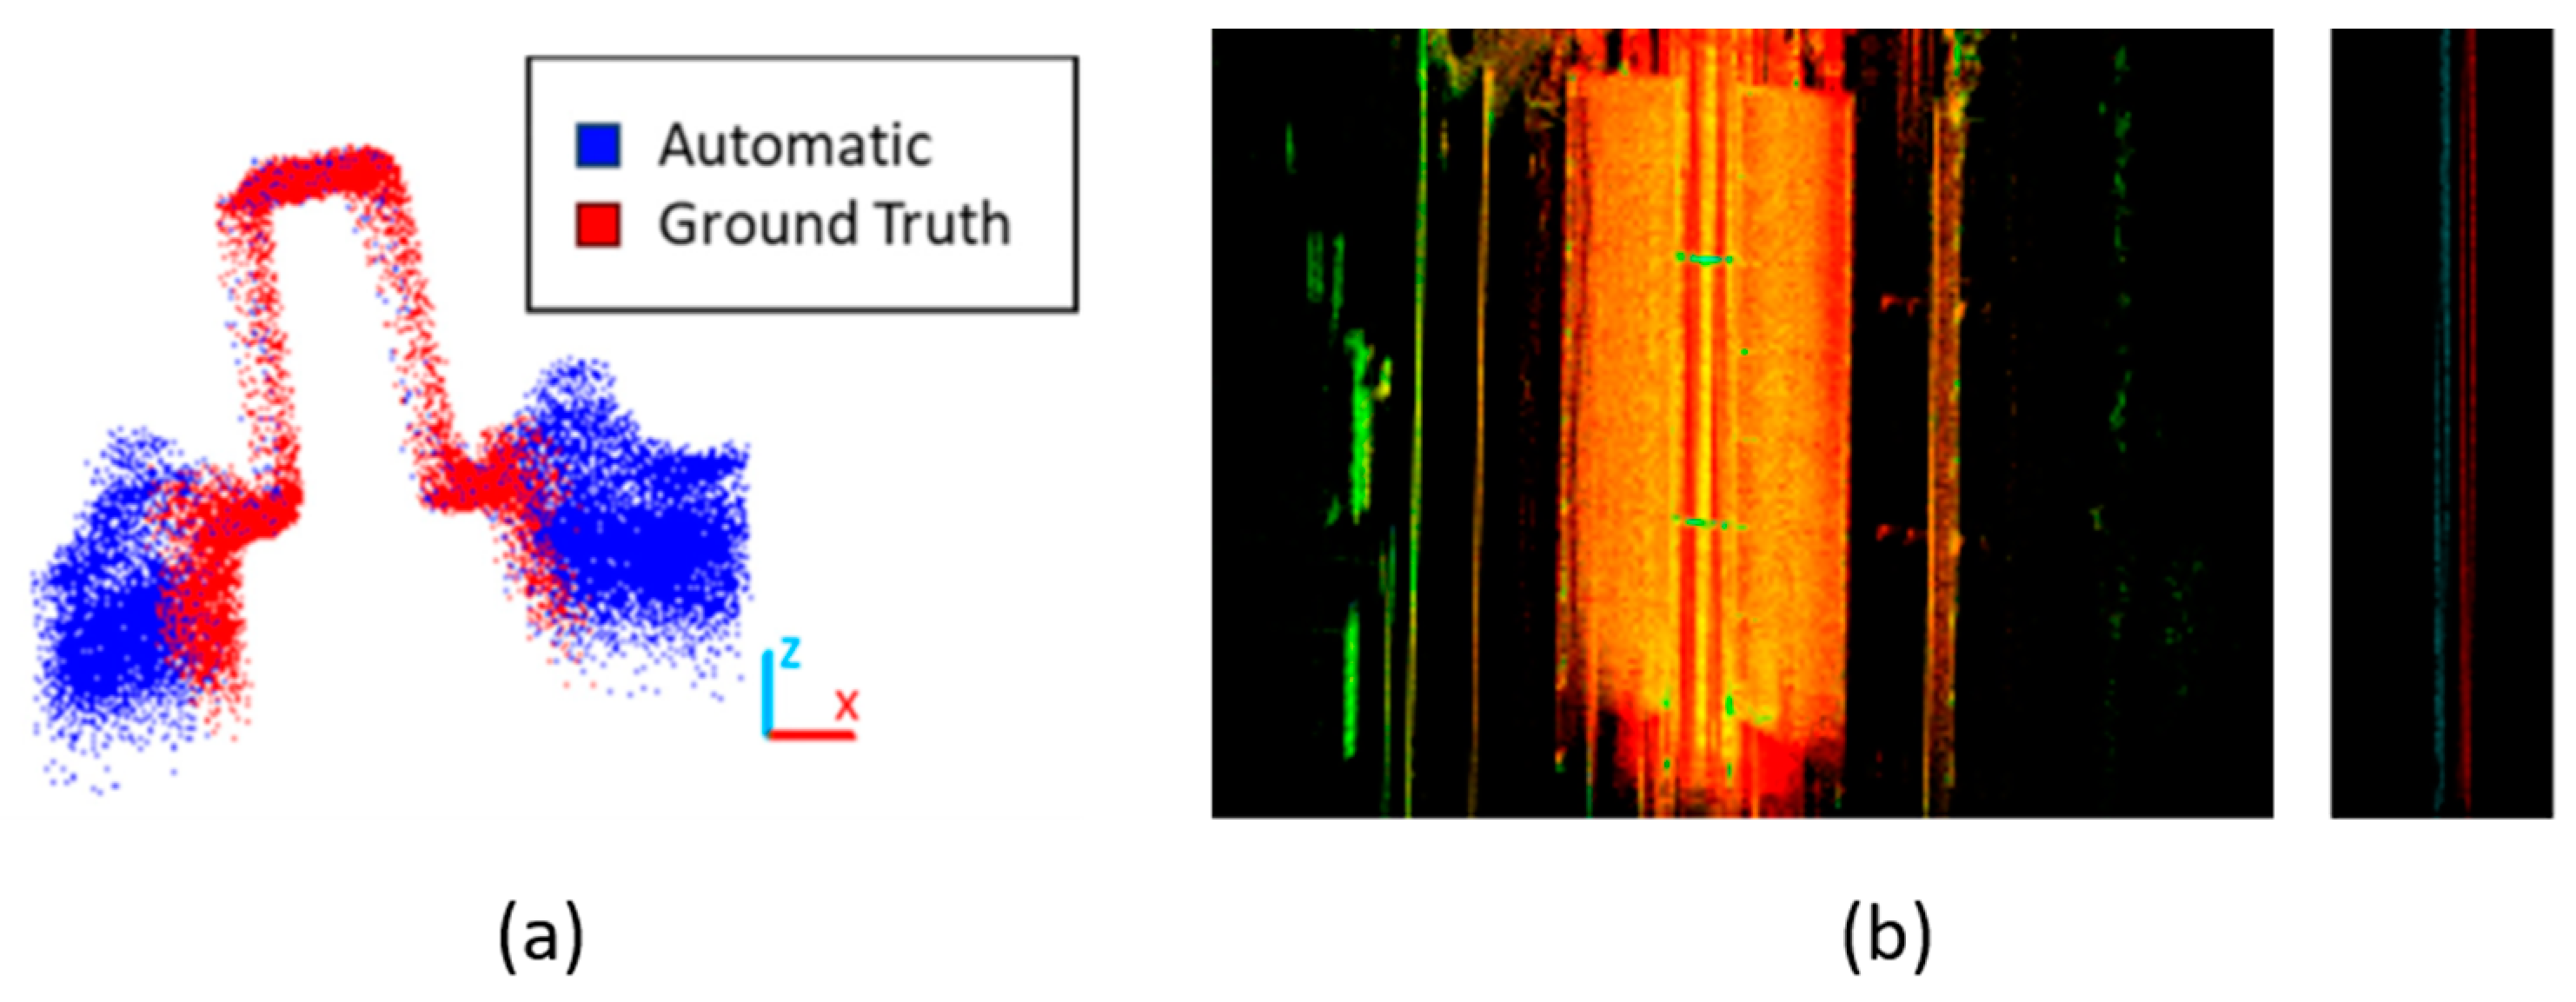
Rails. (a) Sánchez–Rodríguez et al. [59] classified them analysing the point cloud curvature (elevation difference) and validated the results applying SVM classifiers. (b) Lou et al. [137] detected rails based on their elevation difference together with their reflection characteristics. The figure is coloured by intensity.
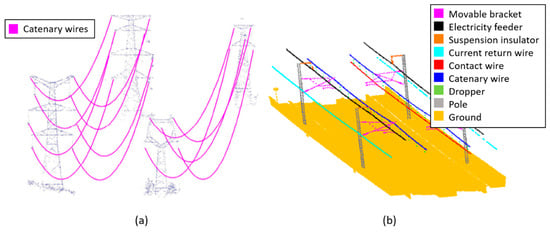
Figure 10.
Power line. (a) Guo et al. [159] classified ALS point clouds into power line cables using a JointBoost classifier and then used RANSAC to reconstruct the cables’ shapes. (b) Jung et al. [161] grouped points in MLS data using SVM classification results as inputs for the multi-range CRF model.
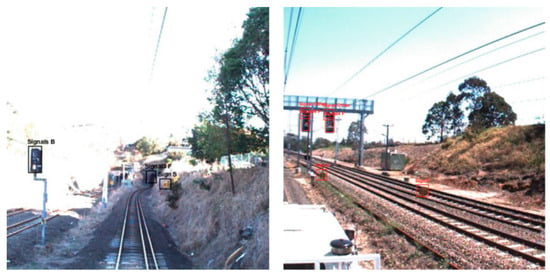
Figure 11.
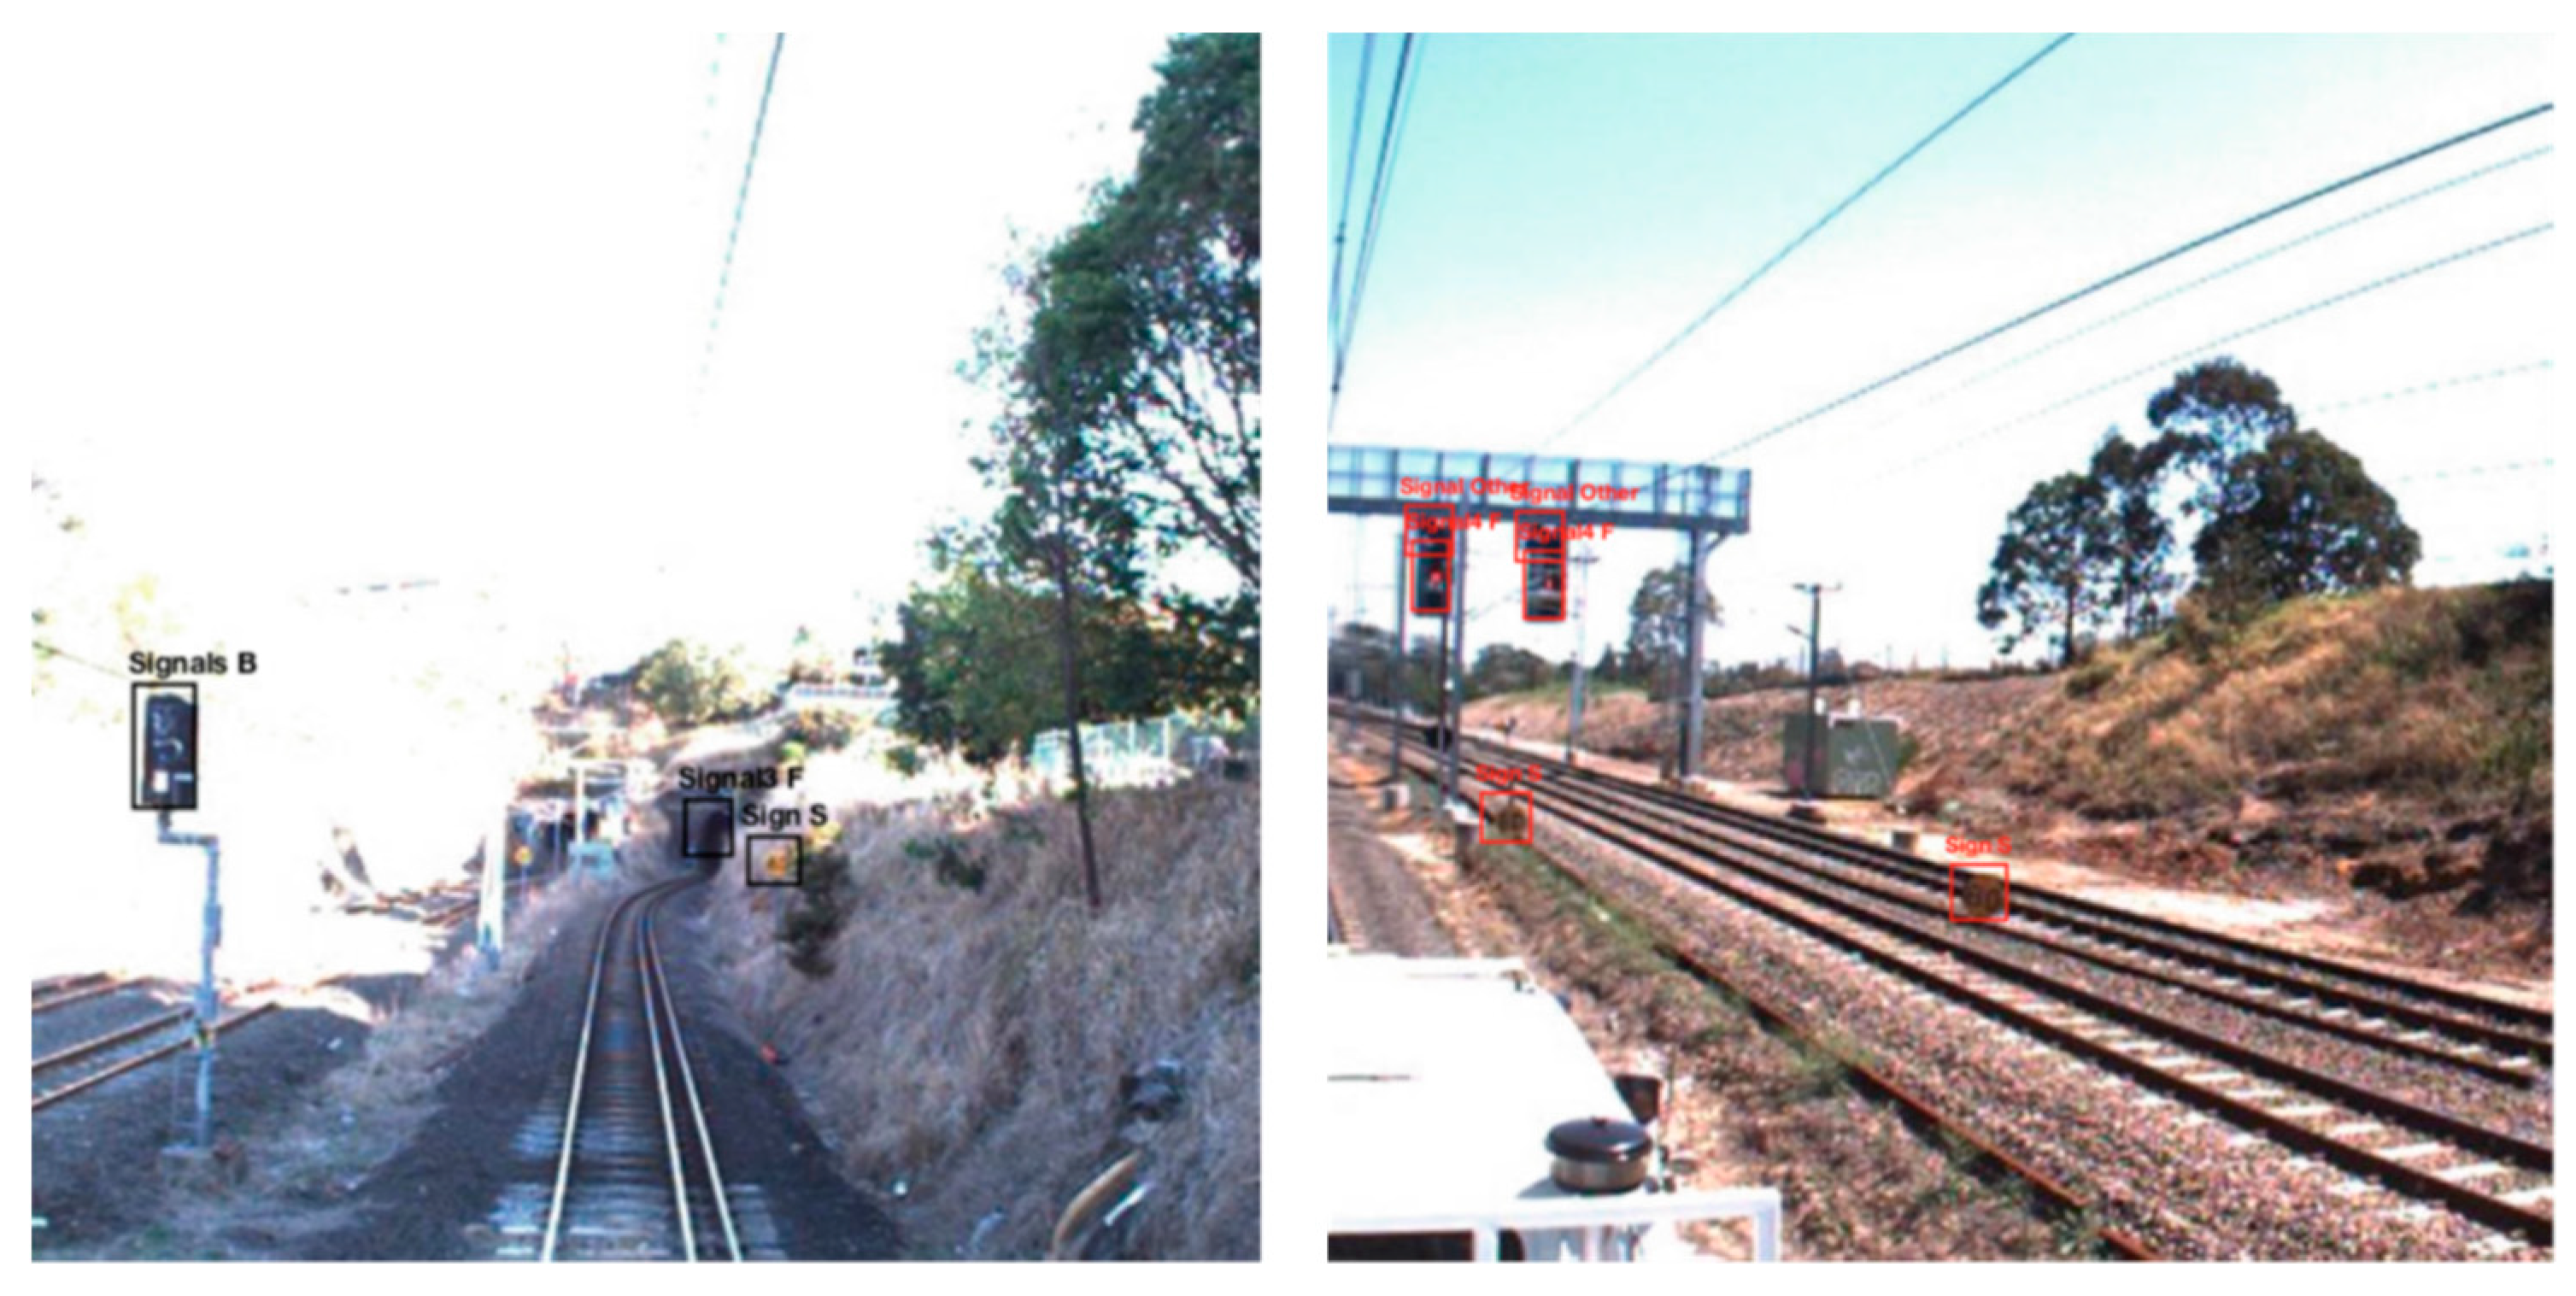
Signalization. Karagiannis et al. [163] implemented a R-CNN for sign detection using RGB images.
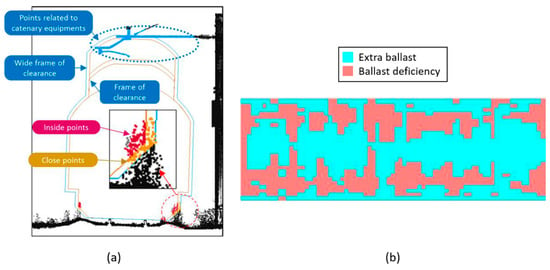
Figure 12.
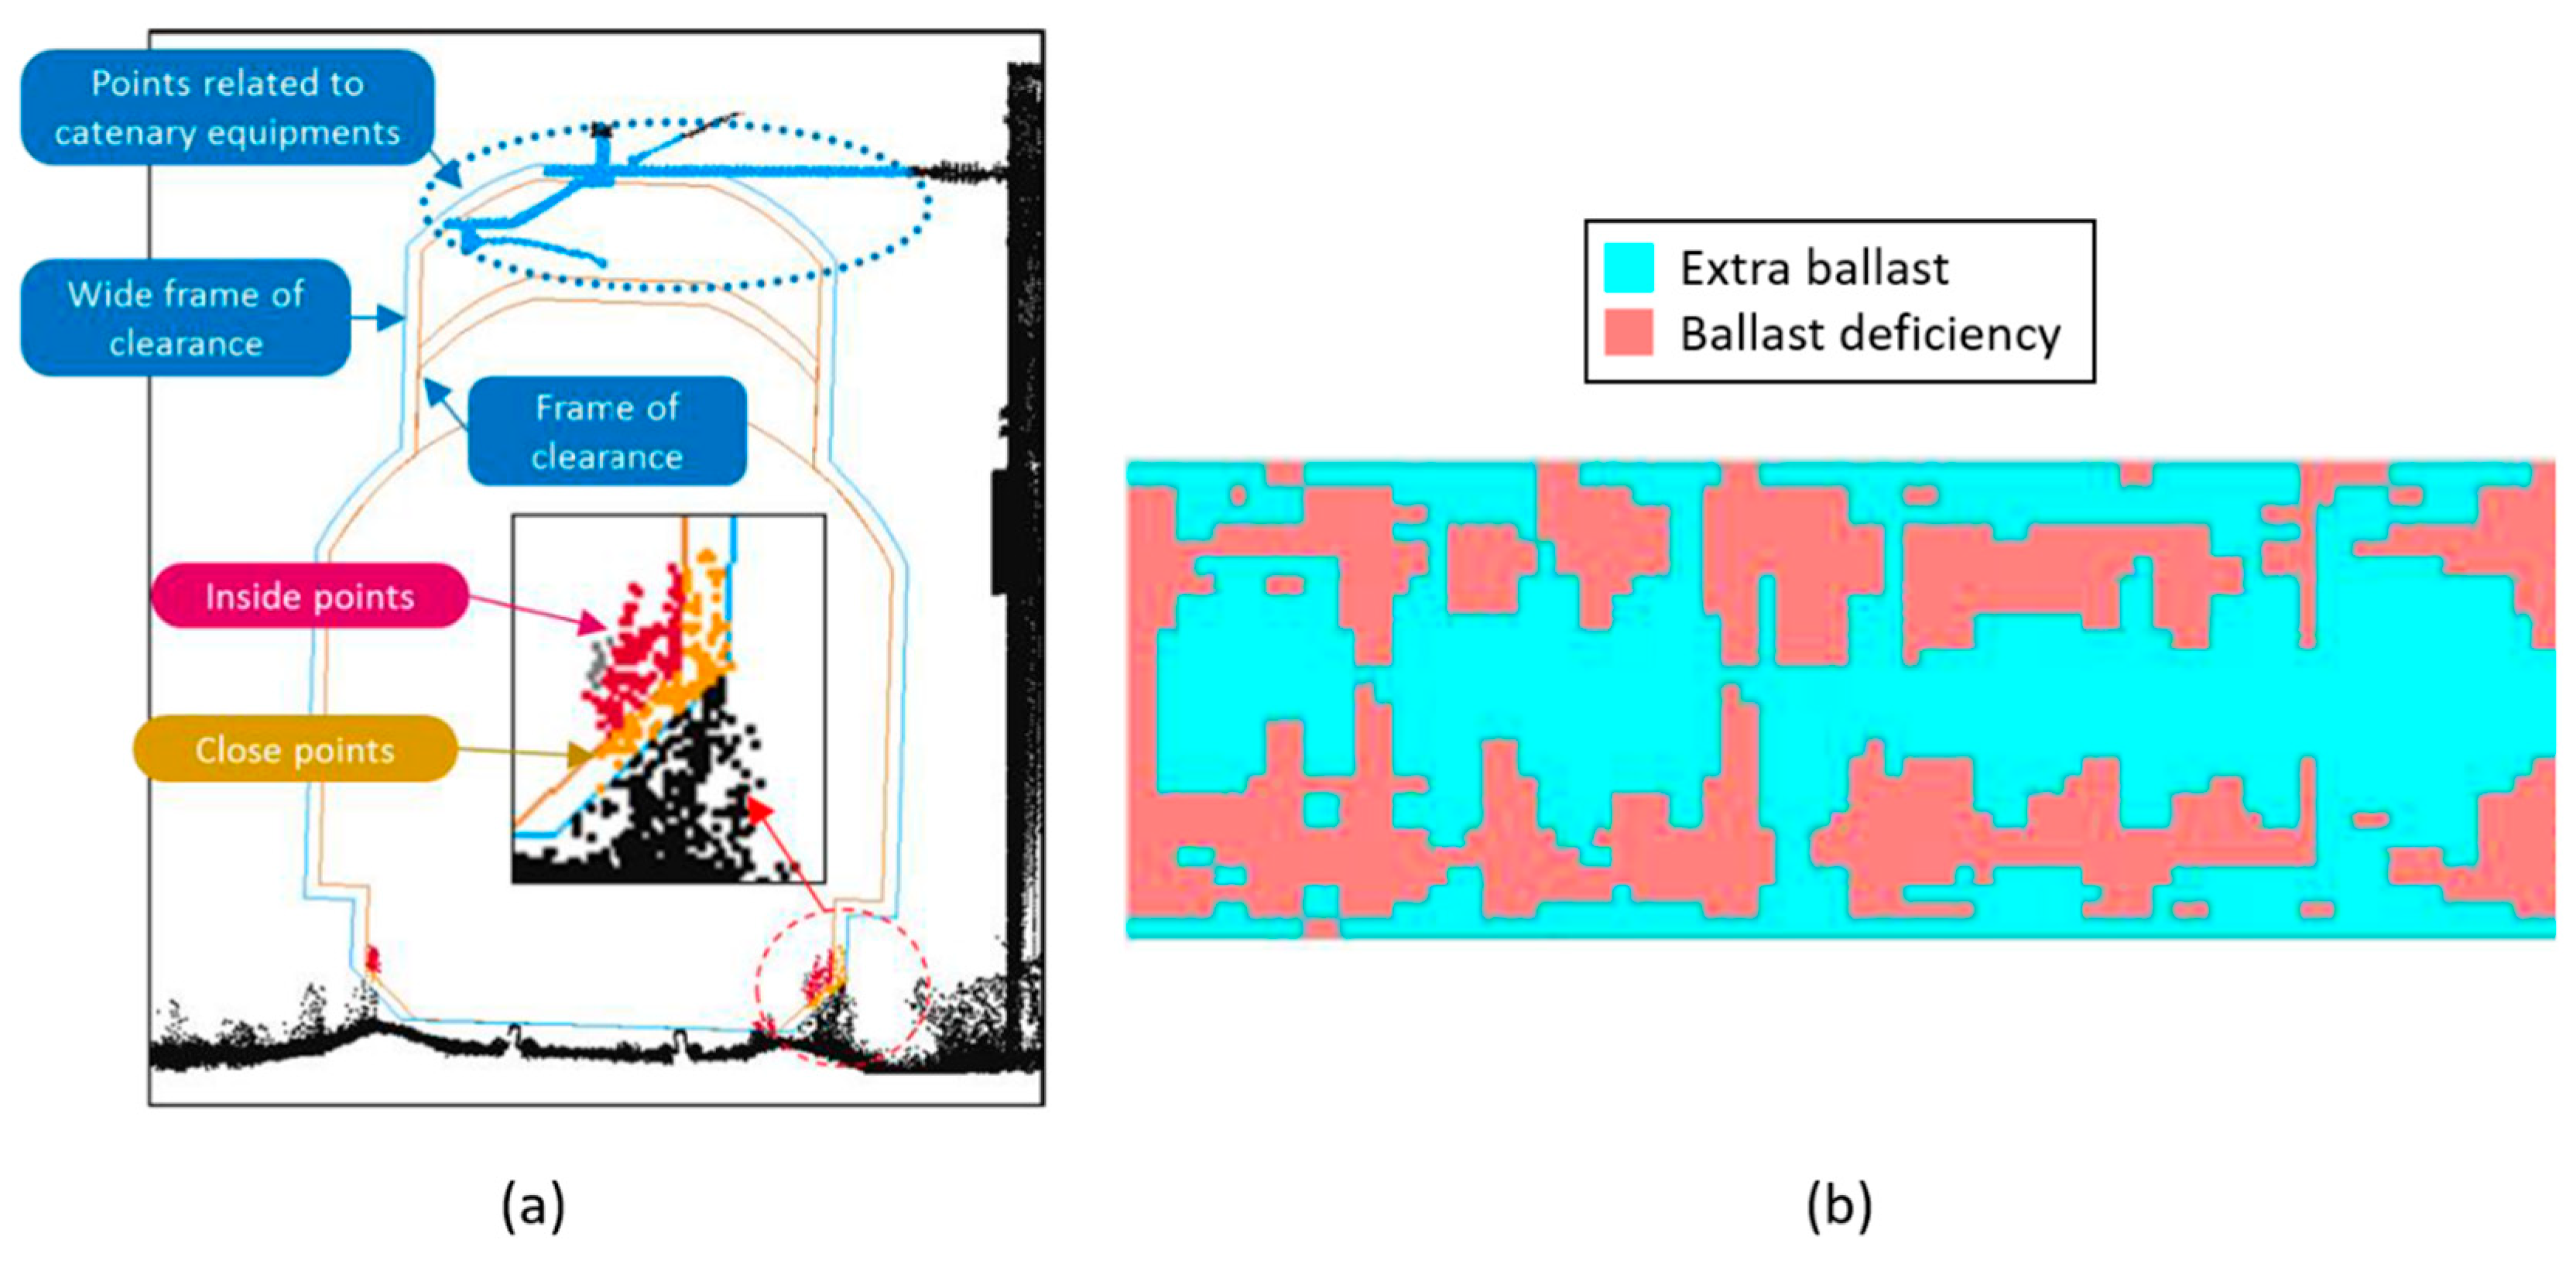
Inspection. (a) Niina et al. [170] extracted the rails’ top head to visually inspect the clearance gauge. (b) Sadeghi et al. [173] performed a ballast inspection based on a geometry index developed to this respect.
3.2.1. Railway Inventory and 3D Modelling
The automatic classification of points forming specific objects is one of the first tasks that needs to be developed in any area of study. Che et al. [15] made a review to this end, presenting different and broadly known techniques for object recognition and feature extraction from MLS 3D point clouds. Al–Bayari [142] has also presented a series of case studies in civil engineering projects using a mobile mapping system, but with specific programs for the post-processing of the extracted point clouds, as do Leslar et al. [143] in the railway field. They performed some preliminary classification of points in terms of the number of returns of each point and the remaining ones were manually selected and classified using external programs and semi-automatic methods.
Seen in the railway network, the works from Arastounia are relevant when applying heuristic methods to classify points from MLS point clouds. His algorithms follow a data-driven and model-driven approach [137], grouping points into railway objects’ classes [138,144,145]. Later on, he published a specific work regarding the automatic recognition of rail tracks and power line cables using TLS and ALS data, with better performance than the previous methodologies presented by the author [134]. Following these advances, Sánchez–Rodríguez et al. developed an algorithm for MLS tunnel point cloud classification [59]. They used not only heuristic methods, but also SVMs [146] for the classification of possible rails in the track. The results obtained in these two latter works are depicted in Figure 8. Regarding the use of classifiers, Luo et al. [147] used the Conditional Random Field (CRF) classifier to make a prediction with local coherence, also resulting in a context based classification of points into different railway objects.
Another option for LiDAR point cloud processing is converting them into 2D images. Zhu and Hyyppa [141] directly made this conversion and classified data using image processing techniques. Considering mixing images with point clouds, Neubert et al. [140] extracted railroad objects from very high resolution helicopter-borne LiDAR and ortho-image data. They also used LiDAR data fusion methods to classify rails. This opens up a new idea for the process of laser scanning data using deep learning techniques to classify points, and so, Rizaldy et al. [148] made a multi-class classification of aerial point clouds using Fully Convolutional Networks (FCN), which is a Convolutional Neural Network (CNN) designed for pixel-wise classification.
The next step should be the conversion of the classified points into 3D models. Regarding this, there is not much work in the last years but, with the appearance of BIM and Digital Twin, it will soon become a need. Some authors have been using specific programs for that conversion [149], while others directly convert the LiDAR point cloud data into 3D models. This application within the railway network still needs to be developed. Most authors in this field based their research on specific elements of the infrastructure and automatically detecting damage or pathologies in them. Looking at the subsequent sections, a summary of the most critical works concerning this matter is shown.
3.2.2. Rails
One of the most extended practices when working with point clouds in railway environments is the extraction of the tracks’ centreline. Beger et al. [139] used data fusion of extremely high-resolution ortho-imagery with ALS data to reconstruct railroad track centrelines. The images were used to obtain, first a railroad track mask and laser point classification, and then, a rail track centreline was approximated using an adapted RANdom SAmple Consensus (RANSAC) algorithm [150]. Continuing with centre line estimation, Elberink and Khoshelham [151] proposed two different data-driven approaches to automate this process. First, they extracted the tracks from MLS point clouds. Then, centre lines were generated directly using the detected rail track points or generating fitted 3D models and implicitly determining the mentioned centreline.
Railway track point clouds may be extracted automatically from MLS data. Sánchez–Rodríguez et al. [59] found possible rails according to the curvature of ground-points neighbourhood and, then, they used SVM classifiers to verify the results obtained (Figure 9a). Additionally, Lou et al. [137] developed a method to this end which processes data in real time. They exposed the validity of using a low-cost LiDAR sensor (Velodyne) for performing mobile mapping surveys (Figure 9b). Stein, D. [152] also used low-cost sensors, contributing with his thesis to the improvement of track-selective localization. He determined the railway network topology and branching direction on turnouts applying a multistage approach. More specifically, Stein et al. [153] proposed a model-based rail detection in 2D MLS data. They developed a spatial clustering to distinguish rails and tracks from other captured elements.
To create 3D models from rail point clouds, Soni et al. [135] first extracted rail track geometry from TLS point clouds. Then, models were created for monitoring purposes. Later on, Yang and Fang [154] also created railway track 3D models, but from MLS point clouds which first detect railway bed areas, then follow patterns and intensity data of rails to find tracks. Similarly, Hackel et al. [155] detected rails and other parts of the track applying template matching algorithms (model-based) as well as support vector machines (feature based). The results show that this methodology can be used for data from any laser scanner system.
Some authors go beyond railway track detection and propose methods, not only for classification, but also for the inspection of these elements, as described in Section 3.2.5.
3.2.3. Power Line
Most railway networks use aerial contact lines to provide an energy supply to trains during operation. Therefore, monitoring of their composite elements it is essential for railway companies. To this respect, Jeon et al. [156] proposed a method based on RANSAC algorithms to automatically detect railroad power lines in LiDAR data. Then, iterative RANSAC and least square adjustments were used to estimate the line parameters and build the 3D model of railroad wires. As exposed in Section 3.2.1, the work from Arastounia, M. [144] stands out since he proposed an heuristic methodology for classifying points in the railway environment. This calculates points neighbourhoods and recognises objects by their geometrical properties and topological relationships. Specifically, the recognition of overhead contact cables was developed applying PCA and region-growing algorithms. Catenary and return cables are detected attending to their distribution in the 3D space with respect to the contact cable. Related to this method, Pastucha, E. [157] used the MMS (Mobile Mapping System) trajectory to limit the search area vertically and horizontally for extracting the catenaries. Then, the method classifies points also by applying RANSAC algorithms and geometrical and topological relationships. This also provides the location of cantilevers and poles or structural beams supporting the wires. Zhang et al. [158] also used information from the MLS trajectory to extract significant data from it. They apply self-adaptive region growing methods to extract power lines and PCA combined with an information entropy theory method to detect junctions.
A different concept is presented by Guo et al. [159]. Working with ALS point clouds, they presented a method for power line reconstruction, analysing the distribution properties of power-lines for helping the RANSAC algorithms in the wires’ reconstruction (Figure 10a). Using both laser scanning and imaging data, Fu, L. et al. [160] automatically extracted the geometric parameters of the aerial power line without manual aiming. This later could be used as input information for the 3D modelling of the power line infrastructure.
The unsupervised classification of points is still under development. Like in any other field, there is not a standard to follow for the railway network when developing and applying these algorithms. Since the distribution of the electrification system in the space is quite regular, Jung et al. [161] proposed a classifier based on CRF. It takes into account both short and long range homogeneity of the cloud. To locally classify points, SVM are used and ten target classes are obtained, representing overhead wires, movable brackets and poles, as shown in Figure 10b. Wang et al. [162] also presented a power line classification method for detecting power line points and the power line corridor direction. They have based their investigation on the Hough transform, connectivity analyses and simplification algorithms.
3.2.4. Signalization
Although the detection and classification of signals has been developed deeply and successfully in the roadway network (Section 3.1.2), it is not so much in the railway field. Presumably, the same techniques can be used for detecting rail signage. As will be presented in 2020 by Karagiannis et al. [163], methods for detecting railway signs working with RGB or video images are being developed. They use image processing techniques and feature extraction [164,165] to locate the signage. Beyond these state-of-the-art results, they have implemented the Faster R-CNN (Convolutional Neural Network for object detection) for sign detection in RGB images (Figure 11).
3.2.5. Inspection
Inspections should be carried out using non-destructive techniques (NDT) in the railway environment, as in many other fields. These do not intervene with the structural condition of the elements being inspected, and allow to repeat the tests as many times as necessary without causing any damage. Nowadays, different techniques are used, as presented in Falamarzi et al. [166]. They made a review concerning the main sensors and techniques used in the railway environment to detect damage. Some sensors categorized as NDT are ultrasonic testing (UT), eddy current (EC), magnetic flux leakage (MFL), acoustic emission (AE), electromagnetic acoustic transducers (EMATs), alternate current field measurement (ACFM), radiography, microphone and thermal sensors, among others. These detect defects from the surface to the internal part of the element being studied. High resolution and thermographic cameras are also good examples of NDT. They are used widely when performing visual inspections and applying image processing techniques for damage detection [166,167]. Although, laser scanning is also a non-destructive technology that may be used for damage detection, there is not a defined technique for the inspection of the railway network.
The most common inspection developed in railway point clouds is the inspection of rail tracks and gauge clearance between them and the power line. Blug et al. [168], in 2004, had already developed a method for using laser scanning data from the CPS 201 scanner for clearance measurements. Years later, Mikrut et al. [169] determined the clearance gauge using MLS point clouds applying the 2D contours method. They use cross sections of the point clouds to create a 2D image and an operator reviews them to obtain suspicious areas. When using TLS data, Collin et al. [136] proposed the use of the Infra-Red information to extract distortions. They compared information from different campaigns and then visually extracted cracks, wear seepages and humid areas, among others. Continuing with this, and together with points classification, Niina et al. [170] performed a clearance check after the automatic extraction of rails matching their shape with an ideal rail head using the iterative closest point (ICP) algorithm [171]. The objects inside the clearance, and related to a contact line, are detected by visual confirmation, as explained in Figure 12a.
Concerning rail inspection, Chen et al. [172] developed a methodology for comparing laser scanning data with a point cloud reconstructed from CAD models to measure the existing rail wear. Related to this part of the infrastructure, the railway ballast is also an important asset to consider. The recent work from Sadeghi et al. [173] showed a method for the development of a geometry index for ballast inspection using automated measurement systems (Figure 12b).
4. Conclusions
This paper presents an extensive literature review that describes different methods and applications for the monitoring of terrestrial transportation networks, using data collected from Mobile Mapping Systems equipped with LiDAR sensors. Furthermore, it also describes and compares different commercial MMS that are employed to obtain those data, discussing specifications not only of the LiDAR sensors but also of other different sensors that can be mounted on MMS such as GNSS sensors or digital cameras.
The first conclusion that can be extracted is that 3D point cloud data is a feasible source for infrastructure monitoring applications. The number of publications and methodological approaches has been increasing since the last decade, with results that have been improving constantly. Actually, it can be seen that the potential that can be reached by these technologies is still uncertain. There are three factors that are in constant evolution and support this conclusion: (1) The LiDAR sensor technology is still evolving, with new systems that keep improving in terms of point cloud resolution, accuracy and size, among others; (2) The improvement of these new systems implies new necessities in terms of data storage and management, hence new strategies to handle geospatial big-data are appearing and enhancing the potential for better point cloud data; (3) The automation of data processing also is evolving, from heuristic methodologies to the implementation of artificial intelligence for the semantic interpretation of 3D and 2D data.
Notwithstanding, it also is clear that there is a lack of standardization in terms of data processing, showing that the application of LiDAR-based technologies for infrastructure monitoring and asset inventory is still at an early stage. Every application (e.g., traffic sign detection, railway power line detection…) has different approaches, typically validated using different (and mostly private) datasets where the scalability for different data acquisition parameters, such as point density, is rarely tested. Furthermore, new methods that outperform the state-of-the-art are frequent, therefore, tools that could be developed to process data acquired with MMS can be outdated rapidly. Other challenges that should be faced are the cost-effective management of the large amounts of data collected by these systems and, in the context of infrastructure monitoring, the accurate and reliable extraction of information of geotechnical assets (landslides, barriers, retaining walls).
Upcoming, it seems that new big-data and artificial intelligence techniques are going to produce a new step forward in terms of increasing the potential for the automatic interpretation of massive datasets. The automatic interpretation of information from the infrastructure should gradually replace manual inspections, especially if data fusion with other remote sensing sources is considered.
Author Contributions
Conceptualization, P.R.-B., A.S.-R., M.S. and C.P.-C.; formal analysis, P.d.R.-B., A.S.-R., and M.S.; resources, P.d.R.-B., A.S.-R., and M.S.; writing—original draft preparation, P.d.R.-B., A.S.-R., and M.S.; writing—review and editing, P.d.R.-B., A.S.-R., M.S., C.P.-C. and B.R.; supervision, C.P.-C., P.A. and B.R.; project administration, P.A. and B.R.; funding acquisition, P.A. and B.R.
Funding
This project has received funding from the European Union’s Horizon 2020 research and innovation programme under grant agreement No. 769255. This work has been partially supported by the Spanish Ministry of Science, Innovation and Universities through the project Ref. RTI2018-095893-B-C21.
Acknowledgments
This document reflects only the views of the authors. Neither the Innovation and Networks Executive Agency (INEA) nor the European Commission is in any way responsible for any use that may be made of the information it contains.
Conflicts of Interest
Authors declare no conflict of interest.
References
- European Commission EU Transport in Figures. Statistical Pocketbook; Publications Office of the European Union: Luxembourg, 2018. [Google Scholar]
- European Commission Transport in the European Union. Current Trends and Issues; European Commission, Directorate-General Mobility and Transport: Brussels, Belgium, 2019. [Google Scholar]
- European Union Road Federation (ERF). An ERF Position Paper for Maintaining and Improving a Sustainable and Efficient Road Network; ERF: Brussels, Belgium, 2015. [Google Scholar]
- tCat-Disrupting the Rail Maintenance Sector Thanks to the Most Cost-Efficient Solution to Auscultate Railways Overhead Lines Reducing Costs up to 80%. Available online: https://cordis.europa.eu/project/rcn/211356/factsheet/en (accessed on 20 June 2019).
- AutoScan. Available online: https://cordis.europa.eu/project/rcn/203338/factsheet/en (accessed on 20 June 2019).
- NeTIRail-INFRA. Available online: https://cordis.europa.eu/project/rcn/193387/factsheet/en (accessed on 20 June 2019).
- Fortunato, G.; Funari, M.F.; Lonetti, P. Survey and seismic vulnerability assessment of the Baptistery of San Giovanni in Tumba (Italy). J. Cult. Herit. 2017, 26, 64–78. [Google Scholar] [CrossRef]
- Rowlands, K.A.; Jones, L.D.; Whitworth, M. Landslide Laser Scanning: A new look at an old problem. Q. J. Eng. Geol. Hydrogeol. 2003, 36, 155–157. [Google Scholar] [CrossRef]
- Puente, I.; González-Jorge, H.; Martínez-Sánchez, J.; Arias, P. Review of mobile mapping and surveying technologies. Meas. J. Int. Meas. Confed. 2013, 46, 2127–2145. [Google Scholar] [CrossRef]
- Williams, K.; Olsen, M.J.; Roe, G.V.; Glennie, C. Synthesis of Transportation Applications of Mobile LIDAR. Remote Sens. 2013, 5, 4652–4692. [Google Scholar] [CrossRef]
- Guan, H.; Li, J.; Cao, S.; Yu, Y. Use of mobile LiDAR in road information inventory: A review. Int. J. Image Data Fusion 2016, 7, 219–242. [Google Scholar] [CrossRef]
- Gargoum, S.; El-Basyouny, K. Automated extraction of road features using LiDAR data: A review of LiDAR applications in transportation. In Proceedings of the 2017 4th International Conference on Transportation Information and Safety (ICTIS), Banff, AB, Canada, 8–10 August 2017; pp. 563–574. [Google Scholar]
- Ma, L.; Li, Y.; Li, J.; Wang, C.; Wang, R.; Chapman, M.A. Mobile laser scanned point-clouds for road object detection and extraction: A review. Remote Sens. 2018, 10, 1531. [Google Scholar] [CrossRef]
- Wang, R.; Peethambaran, J.; Chen, D. LiDAR Point Clouds to 3-D Urban Models: A Review. IEEE J. Sel. Top. Appl. Earth Obs. Remote Sens. 2018, 11, 606–627. [Google Scholar] [CrossRef]
- Che, E.; Jung, J.; Olsen, M.J. Object recognition, segmentation, and classification of mobile laser scanning point clouds: A state of the art review. Sensors 2019, 19, 810. [Google Scholar] [CrossRef] [PubMed]
- SCOPUS. Available online: http://www.scopus.com/ (accessed on 28 June 2019).
- Tao, C.V. Mobile mapping technology for road network data acquisition. J. Geospat. Eng. 2000, 2, 1–14. [Google Scholar]
- Wehr, A.; Lohr, U. Airborne laser scanning—An introduction and overview. ISPRS J. Photogramm. Remote Sens. 1999, 54, 68–82. [Google Scholar] [CrossRef]
- Kashani, A.G.; Olsen, M.J.; Parrish, C.E.; Wilson, N. A review of LIDAR radiometric processing: From ad hoc intensity correction to rigorous radiometric calibration. Sensors 2015, 15, 28099–28128. [Google Scholar] [CrossRef] [PubMed]
- Armesto-González, J.; Riveiro-Rodríguez, B.; González-Aguilera, D.; Rivas-Brea, M.T. Terrestrial laser scanning intensity data applied to damage detection for historical buildings. J. Archaeol. Sci. 2010, 37, 3037–3047. [Google Scholar] [CrossRef]
- Wagner, W.; Ullrich, A.; Melzer, T.; Briese, C.; Kraus, K. From single-pulse to full-waveform airborne laser scanners: Potential and practical challenges. Int. Arch. Photogramm. Remote Sens. Spat. Inf. Sci. 2004, XXXV, 201–206. [Google Scholar]
- Wagner, W.; Ullrich, A.; Ducic, V.; Melzer, T.; Studnicka, N. Gaussian decomposition and calibration of a novel small-footprint full-waveform digitising airborne laser scanner. ISPRS J. Photogramm. Remote Sens. 2006, 60, 100–112. [Google Scholar] [CrossRef]
- Kais, M.; Bonnifait, P.; Bétaille, D.; Peyret, F. Development of loosely-coupled FOG/DGPS and FOG/RTK systems for ADAS and a methodology to assess their real-time performances. In Proceedings of the IEEE Intelligent Vehicles Symposium, Las Vegas, NV, USA, 6–8 June 2005; pp. 358–363. [Google Scholar]
- Welch, G.; Bishop, G.; Hill, C. An Introduction to the Kalman Filter; Technical Report; Univresity of North Carolina: Chapel Hill, NC, USA, 2002. [Google Scholar]
- Yoo, H.J.; Goulette, F.; Senpauroca, J.; Lepère, G. Analysis and Improvement of Laser Terrestrial Mobile Mapping Systems Configurations. Int. Arch. Photogramm. Remote Sens. Spat. Inf. Sci. 2010, 38, 633–638. [Google Scholar]
- Kiziltas, S.; Akinci, B.; Ergen, E.; Tang, P.; Gordon, C. Technological assessment and process implications of field data capture technologies for construction and facility/infrastructure management. Electron. J. Inf. Technol. Constr. 2008, 13, 134–154. [Google Scholar]
- Golparvar-Fard, M.; Bohn, J.; Teizer, J.; Savarese, S.; Peña-Mora, F. Evaluation of image-based modeling and laser scanning accuracy for emerging automated performance monitoring techniques. Autom. Constr. 2011, 20, 1143–1155. [Google Scholar] [CrossRef]
- Park, H.S.; Lee, H.M.; Adeli, H.; Lee, I. A new approach for health monitoring of structures: Terrestrial laser scanning. Comput. Civ. Infrastruct. Eng. 2007, 22, 19–30. [Google Scholar] [CrossRef]
- Dai, F.; Rashidi, A.; Brilakis, I.; Vela, P. Comparison of Image-Based and Time-of-Flight-Based Technologies for Three-Dimensional Reconstruction of Infrastructure. J. Constr. Eng. Manag. 2012, 139, 69–79. [Google Scholar] [CrossRef]
- Ingensand, H. Metrological Aspects in Terrestrial Laser-Scanning Technology. In Proceedings of the 3rd IAG/12th FIG Symposium, Baden, Germany, 22–24 May 2006. [Google Scholar]
- Beraldin, J.A.; Blais, F.; Boulanger, P.; Cournoyer, L.; Domey, J.; El-Hakim, S.F.; Godin, G.; Rioux, M.; Taylor, J. Real world modelling through high resolution digital 3D imaging of objects and structures. ISPRS J. Photogramm. Remote Sens. 2000, 55, 230–250. [Google Scholar] [CrossRef]
- Golparvar-Fard, M.; Peña-Mora, F.; Savarese, S. D 4 AR—A 4-Dimensional augmented reality model for automating construction progress data collection, processing and communication. J. Inf. Technol. Constr. 2009, 14, 129–153. [Google Scholar]
- Zhu, L.; Hyyppä, J.; Kukko, A.; Kaartinen, H.; Chen, R. Photorealistic building reconstruction from mobile laser scanning data. Remote Sens. 2011, 3, 1406–1426. [Google Scholar] [CrossRef]
- Olsen, M.J.; Asce, M.; Kuester, F.; Chang, B.J.; Asce, S.M.; Hutchinson, T.C.; Asce, M. Terrestrial Laser Scanned-Based Structural Damage Assessment. J. Comput. Civ. Eng. 2010, 24. [Google Scholar] [CrossRef]
- Kobler, A.; Pfeifer, N.; Ogrinc, P.; Todorovski, L.; Oštir, K.; Džeroski, S. Repetitive interpolation: A robust algorithm for DTM generation from Aerial Laser Scanner Data in forested terrain. Remote Sens. Environ. 2007, 108, 9–23. [Google Scholar] [CrossRef]
- Jaakkola, A.; Hyyppä, J.; Hyyppä, H.; Kukko, A. Retrieval algorithms for road surface modelling using laser-based mobile mapping. Sensors 2008, 8, 5238–5249. [Google Scholar] [CrossRef] [PubMed]
- Kukko, A.; Kaartinen, H.; Hyyppä, J.; Chen, Y. Multiplatform mobile laser scanning: Usability and performance. Sensors 2012, 12, 11712–11733. [Google Scholar] [CrossRef]
- Pu, S.; Rutzinger, M.; Vosselman, G.; Oude Elberink, S. Recognizing basic structures from mobile laser scanning data for road inventory studies. ISPRS J. Photogramm. Remote Sens. 2011, 66, S28–S39. [Google Scholar] [CrossRef]
- Ellum, C.; El-sheimy, N. The development of a backpack mobile mapping system. Archives 2000, 33, 184–191. [Google Scholar]
- RIEGL—Homepage of the Company RIEGL Laser Measurement Systems GmbH. Available online: http://www.riegl.com/ (accessed on 28 June 2019).
- Teledyne Optech. Available online: https://www.teledyneoptech.com/en/home/ (accessed on 28 June 2019).
- FARO—Homepage of the Company Faro Technologies, Inc. Available online: https://velodynelidar.com/ (accessed on 28 June 2019).
- VELODYNE—Homepage of the Company Velodyne Lidar, Inc. Available online: https://velodynelidar.com/ (accessed on 28 June 2019).
- SICK—Homepage of the Company Sick AG. Available online: https://www.sick.com/gb/en (accessed on 28 June 2019).
- LEICA HEXAGON-Homepage of the company Leica Geosystems AG. Available online: https://leica-geosystems.com/ (accessed on 28 June 2019).
- Link, L.E.; Collins, J.G. Airborne laser systems use in terrain mapping. In Proceedings of the 15th International Symposium on Remote Sensing of Environment, Ann Arbor, MI, USA, 11–15 May 1981; pp. 95–110. [Google Scholar]
- Riveiro, B.; González-Jorge, H.; Conde, B.; Puente, I. Laser Scanning Technology: Fundamentals, Principles and Applications in Infrastructure. In Non-Destructive Techniques for the Reverse Engineering of Structures and Infrastructure; CRC Press: London, UK, 2016; Volume 11, pp. 7–33. [Google Scholar]
- Lohr, U. Digital elevation models by laser scanning. Photogramm. Rec. 1998, 16, 105–109. [Google Scholar] [CrossRef]
- Sithole, G. Filtering of Laser Altimetry Data Using a Slope Adaptive Filter. Int. Arch. Photogramm. Remote Sens. Spat. Inf. Sci. 2001, 34, 203–210. [Google Scholar]
- Ibrahim, S.; Lichti, D. Curb-based street floor extraction from mobile terrestrial lidar point cloud. ISPRS-Int. Arch. Photogramm. Remote Sens. Spat. Inf. Sci. 2012, 39, B5. [Google Scholar] [CrossRef]
- Kumar, P.; McElhinney, C.P.; Lewis, P.; McCarthy, T. An automated algorithm for extracting road edges from terrestrial mobile LiDAR data. ISPRS J. Photogramm. Remote Sens. 2013, 85, 44–55. [Google Scholar] [CrossRef]
- Kumar, P.; Lewis, P.; McCarthy, T. The Potential of Active Contour Models in Extracting Road Edges from Mobile Laser Scanning Data. Infrastructures 2017, 2, 9. [Google Scholar] [CrossRef]
- Rodríguez-Cuenca, B.; García-Cortés, S.; Ordóñez, C.; Alonso, M.C. An approach to detect and delineate street curbs from MLS 3D point cloud data. Autom. Constr. 2015, 51, 103–112. [Google Scholar] [CrossRef]
- Rodríguez-Cuenca, B.; García-Cortés, S.; Ordóñez, C.; Alonso, M. Morphological Operations to Extract Urban Curbs in 3D MLS Point Clouds. ISPRS Int. J. Geo-Inf. 2016, 5, 93. [Google Scholar] [CrossRef]
- Guan, H.; Li, J.; Yu, Y.; Wang, C.; Chapman, M.; Yang, B. Using mobile laser scanning data for automated extraction of road markings. ISPRS J. Photogramm. Remote Sens. 2014, 87, 93–107. [Google Scholar] [CrossRef]
- Yang, B.; Fang, L.; Li, J. Semi-automated extraction and delineation of 3D roads of street scene from mobile laser scanning point clouds. ISPRS J. Photogramm. Remote Sens. 2013, 79, 80–93. [Google Scholar] [CrossRef]
- Wang, H.; Luo, H.; Wen, C.; Cheng, J.; Li, P.; Chen, Y.; Wang, C.; Li, J. Road Boundaries Detection Based on Local Normal Saliency From Mobile Laser Scanning Data. IEEE Geosci. Remote Sens. Lett. 2015, 12, 2085–2089. [Google Scholar] [CrossRef]
- Soilán, M.; Riveiro, B.; Sánchez-Rodríguez, A.; Arias, P. Safety assessment on pedestrian crossing environments using MLS data. Accid. Anal. Prev. 2018, 111, 328–337. [Google Scholar] [CrossRef]
- Sánchez-Rodríguez, A.; Riveiro, B.; Soilán, M.; González-deSantos, L.M. Automated detection and decomposition of railway tunnels from Mobile Laser Scanning Datasets. Autom. Constr. 2018, 96, 171–179. [Google Scholar] [CrossRef]
- Xu, S.; Wang, R.; Zheng, H. Road curb extraction from mobile LiDAR point clouds. IEEE Trans. Geosci. Remote Sens. 2017, 55, 996–1009. [Google Scholar] [CrossRef]
- Douillard, B.; Underwood, J.; Kuntz, N.; Vlaskine, V.; Quadros, A.; Morton, P.; Frenkel, A. On the segmentation of 3D lidar point clouds. In Proceedings of the IEEE International Conference on Robotics and Automation, Shanghai, China, 9–13 May 2011; pp. 2798–2805. [Google Scholar]
- Zai, D.; Li, J.; Guo, Y.; Cheng, M.; Lin, Y.; Luo, H.; Wang, C. 3-D Road Boundary Extraction from Mobile Laser Scanning Data via Supervoxels and Graph Cuts. IEEE Trans. Intell. Transp. Syst. 2018, 19, 802–813. [Google Scholar] [CrossRef]
- Hata, A.Y.; Osorio, F.S.; Wolf, D.F. Robust curb detection and vehicle localization in urban environments. In Proceedings of the IEEE Intelligent Vehicles Symposium Proceedings, Dearborn, MI, USA, 8–11 June 2014; pp. 1257–1262. [Google Scholar]
- Cabo, C.; Kukko, A.; García-Cortés, S.; Kaartinen, H.; Hyyppä, J.; Ordoñez, C. An algorithm for automatic road asphalt edge delineation from mobile laser scanner data using the line clouds concept. Remote Sens. 2016, 8, 740. [Google Scholar] [CrossRef]
- Guo, J.; Tsai, M.-J.; Han, J.-Y. Automatic reconstruction of road surface features by using terrestrial mobile lidar. Autom. Constr. 2015, 58, 165–175. [Google Scholar] [CrossRef]
- Serna, A.; Marcotegui, B. Urban accessibility diagnosis from mobile laser scanning data. ISPRS J. Photogramm. Remote Sens. 2013, 84, 23–32. [Google Scholar] [CrossRef]
- Serna, A.; Marcotegui, B. Detection, segmentation and classification of 3D urban objects using mathematical morphology and supervised learning. ISPRS J. Photogramm. Remote Sens. 2014, 93, 243–255. [Google Scholar] [CrossRef]
- Fan, H.; Yao, W.; Tang, L. Identifying man-made objects along urban road corridors from mobile lidar data. IEEE Geosci. Remote Sens. Lett. 2013, 11, 950–954. [Google Scholar] [CrossRef]
- Díaz-Vilariño, L.; González-Jorge, H.; Bueno, M.; Arias, P.; Puente, I. Automatic classification of urban pavements using mobile LiDAR data and roughness descriptors. Constr. Build. Mater. 2016, 102, 208–215. [Google Scholar] [CrossRef]
- Yadav, M.; Singh, A.K.; Lohani, B. Extraction of road surface from mobile LiDAR data of complex road environment. Int. J. Remote Sens. 2017, 38, 4645–4672. [Google Scholar] [CrossRef]
- Ying Zhou; Dan Wang; Xiang Xie; Yiyi Ren; Guolin Li; Yangdong Deng; Zhihua Wang A Fast and Accurate Segmentation Method for Ordered LiDAR Point Cloud of Large-Scale Scenes. IEEE Geosci. Remote Sens. Lett. 2014, 11, 1981–1985. [CrossRef]
- Che, E.; Olsen, M.J. Fast ground filtering for TLS data via Scanline Density Analysis. ISPRS J. Photogramm. Remote Sens. 2017, 129, 226–240. [Google Scholar] [CrossRef]
- Soilán, M.; Riveiro, B.; Martínez-Sánchez, J.; Arias, P. Segmentation and classification of road markings using MLS data. ISPRS J. Photogramm. Remote Sens. 2017, 123, 94–103. [Google Scholar] [CrossRef]
- Riveiro, B.; González-Jorge, H.; Martínez-Sánchez, J.; Díaz-Vilariño, L.; Arias, P. Automatic detection of zebra crossings from mobile LiDAR data. Opt. Laser Technol. 2015, 70, 63–70. [Google Scholar] [CrossRef]
- Arias, P.; Riveiro, B.; Soilán, M.; Díaz-Vilariño, L.; Martínez-Sánchez, J. Simple Approaches To Improve the Automatic Inventory of Zebra Crossing From Mls Data. ISPRS Int. Arch. Photogramm. Remote Sens. Spat. Inf. Sci. 2015, 40, 103–108. [Google Scholar] [CrossRef]
- Guan, H.; Li, J.; Member, S.; Yu, Y.; Ji, Z.; Wang, C. Using Mobile LiDAR Data for Rapidly Updating Road Markings. IEEE Trans. Intell. Transp. Syst. 2015, 16, 2457–2466. [Google Scholar] [CrossRef]
- Ma, L.; Li, Y.; Li, J.; Zhong, Z.; Chapman, M.A. Generation of Horizontally Curved Driving Lines in HD Maps Using Mobile Laser Scanning Point Clouds. IEEE J. Sel. Top. Appl. Earth Obs. Remote Sens. 2019, 12, 1572–1586. [Google Scholar] [CrossRef]
- Yan, L.; Liu, H.; Tan, J.; Li, Z.; Xie, H.; Chen, C. Scan line based road marking extraction from mobile LiDAR point clouds. Sensors 2016, 16, 903. [Google Scholar] [CrossRef] [PubMed]
- Yu, Y.; Li, J.; Guan, H.; Jia, F.; Wang, C. Learning Hierarchical Features for Automated Extraction of Road Markings From 3-D Mobile LiDAR Point Clouds. IEEE J. Sel. Top. Appl. Earth Obs. Remote Sens. 2015, 8, 709–726. [Google Scholar] [CrossRef]
- Jung, J.; Che, E.; Olsen, M.J.; Parrish, C. Efficient and robust lane marking extraction from mobile lidar point clouds. ISPRS J. Photogramm. Remote Sens. 2019, 147, 1–18. [Google Scholar] [CrossRef]
- Wen, C.; Sun, X.; Li, J.; Wang, C.; Guo, Y.; Habib, A. A deep learning framework for road marking extraction, classification and completion from mobile laser scanning point clouds. ISPRS J. Photogramm. Remote Sens. 2019, 147, 178–192. [Google Scholar] [CrossRef]
- Zhao, H. Recognizing Features in Mobile Laser Scanning Point Clouds Towards 3D High-Definition Road Maps for Autonomous Vehicles. Master’s Thesis, University of Waterloo, Waterloo, Belgium, 2017. [Google Scholar]
- Ye, C.; Li, J.; Member, S.; Jiang, H. Semi-Automated Generation of Road Transition Lines Using Mobile Laser Scanning Data. IEEE Trans. Intell. Transp. Syst. 2019, 1–14. [Google Scholar] [CrossRef]
- Ding, L.; Zhang, H.; Li, B.; Xiao, J.; Lu, S.; Klette, R. Improved road marking detection and recognition. In Proceedings of the 15th International Symposium on Pervasive Systems, Algorithms and Networks (I-SPAN), Yichang, China, 16–18 October 2018. [Google Scholar]
- Li, J.; Mei, X.; Prokhorov, D.; Tao, D. Deep Neural Network for Structural Prediction and Lane Detection in Traffic Scene. IEEE Trans. Neural Netw. Learn. Syst. 2016, 28, 690–713. [Google Scholar] [CrossRef] [PubMed]
- Jia, H.; Wei, Z.; He, X.; Lv, Y.; He, D.; Li, M. Biologically Visual Perceptual Model and Discriminative Model for Road Markings Detection and Recognition. Math. Probl. Eng. 2018, 2018, 6062081. [Google Scholar] [CrossRef]
- Tian, Y.; Gelernter, J.; Wang, X.; Chen, W.; Gao, J.; Zhang, Y.; Li, X. Lane marking detection via deep convolutional neural network. Neurocomputing 2018, 280, 46–55. [Google Scholar] [CrossRef] [PubMed]
- Kim, H.; Liu, B.; Myung, H. Road-feature extraction using point cloud and 3D LiDAR sensor for vehicle localization. In Proceedings of the 14th International Conference on Ubiquitous Robots and Ambient Intelligence (URAI), Jeju, Korea, 28 June–1 July 2017; Volume 2, pp. 891–892. [Google Scholar]
- Yu, Y.; Li, J.; Guan, H.; Wang, C. 3D crack skeleton extraction from mobile LiDAR point clouds. In Proceedings of the Geoscience and Remote Sensing Symposium, Quebec, QC, Canada, 13–18 July 2014; pp. 914–917. [Google Scholar] [CrossRef]
- Guan, H.; Li, J.; Yu, Y.; Chapman, M.; Wang, H.; Wang, C.; Zhai, R. Iterative tensor voting for pavement crack extraction using mobile laser scanning data. IEEE Trans. Geosci. Remote Sens. 2015, 53, 1527–1537. [Google Scholar] [CrossRef]
- Chen, X.; Li, J.; Cloud, P.; Crack, P.; Detection, A.; Road, U.; Canada, I. A feasibility study on use of generic mobile laser scanning system. Proc. Int. Arch. Photogramm. Remote Sens. Spat. Inf. Sci. 2016, XLI, 545–549. [Google Scholar] [CrossRef]
- Gavilán, M.; Balcones, D.; Marcos, O.; Llorca, D.F.; Sotelo, M.A. Adaptive Road Crack Detection System by Pavement Classification. Sensors 2011, 11, 9628–9657. [Google Scholar] [CrossRef]
- Venmans, A.A.M.; Van De Ven, R.; Kollen, J. Rapid and Non-intrusive Measurements of Moisture in Road Constructions Using Passive Microwave Radiometry and GPR-Full Scale Test. Procedia Eng. 2016, 143, 1244–1251. [Google Scholar] [CrossRef]
- Aparna; Bhatia, Y.; Rai, R.; Gupta, V.; Aggarwal, N.; Akula, A. Convolutional neural networks based potholes detection using thermal imaging. J. King Saud Univ.-Comput. Inf. Sci. 2019, in press. [Google Scholar] [CrossRef]
- Guan, H.; Yu, Y.; Li, J.; Liu, P.; Zhao, H.; Wang, C. Automated extraction of manhole covers using mobile LiDAR data. Remote Sens. Lett. 2014, 5, 1042–1050. [Google Scholar] [CrossRef]
- Yu, Y.; Guan, H.; Ji, Z. Automated Detection of Urban Road Manhole Covers Using Mobile Laser Scanning Data. IEEE Trans. Intell. Transp. Syst. 2015, 16, 3258–3269. [Google Scholar] [CrossRef]
- Ai, C.; Tsai, Y.J. An automated sign retroreflectivity condition evaluation methodology using mobile LIDAR and computer vision. Transp. Res. Part C Emerg. Technol. 2016, 63, 96–113. [Google Scholar] [CrossRef]
- Ai, C.; Tsai, Y.-C.J. Critical Assessment of an Enhanced Traffic Sign Detection Method Using Mobile LiDAR and INS Technologies. J. Transp. Eng. 2014, 141, 04014096. [Google Scholar] [CrossRef]
- Riveiro, B.; Diaz-Vilariño, L.; Conde, B.; Soilán, M.; Arias, P. Automatic Segmentation and Shape-Based Classification of Retro-Reflective Traffic Signs from Mobile LiDAR Data. IEEE J. Sel. Top. Appl. Earth Obs. Remote Sens. 2016, 9, 295–303. [Google Scholar] [CrossRef]
- Soilán, M.; Riveiro, B.; Martínez-Sánchez, J.; Arias, P. Traffic sign detection in MLS acquired point clouds for geometric and image-based semantic inventory. ISPRS J. Photogramm. Remote Sens. 2016, 114, 92–101. [Google Scholar] [CrossRef]
- Soilán, M.; Riveiro, B.; Martínez-Sánchez, J.; Arias, P. Automatic road sign inventory using mobile mapping systems. Int. Arch. Photogramm. Remote Sens. Spat. Inf. Sci. 2016, 41, 717–723. [Google Scholar] [CrossRef]
- Huang, P.; Cheng, M.; Chen, Y.; Luo, H.; Wang, C.; Member, S.; Li, J.; Member, S. Traffic Sign Occlusion Detection Using Mobile Laser Scanning Point Clouds. IEEE Trans. Intell. Transp. Syst. 2017, 18, 2364–2376. [Google Scholar] [CrossRef]
- Wen, C.; Li, J.; Member, S.; Luo, H.; Yu, Y.; Cai, Z.; Wang, H.; Wang, C. Spatial-Related Traffic Sign Inspection for Inventory Purposes Using Mobile Laser Scanning Data. IEEE Trans. Intell. Transp. Syst. 2015, 17, 27–37. [Google Scholar] [CrossRef]
- Guan, H.; Yan, W.; Yu, Y.; Zhong, L.; Li, D. Robust Traffic-Sign Detection and Classification Using Mobile LiDAR Data with Digital Images. IEEE J. Sel. Top. Appl. Earth Obs. Remote Sens. 2018, 11, 1715–1724. [Google Scholar] [CrossRef]
- Yu, Y.; Li, J.; Wen, C.; Guan, H.; Luo, H.; Wang, C. Bag-of-visual-phrases and hierarchical deep models for traffic sign detection and recognition in mobile laser scanning data. ISPRS J. Photogramm. Remote Sens. 2016, 113, 106–123. [Google Scholar] [CrossRef]
- Tan, M.; Wang, B.; Wu, Z.; Member, S.; Wang, J.; Pan, G. Weakly Supervised Metric Learning for Traffic Sign Recognition in a LIDAR-Equipped Vehicle. IEEE Trans. Intell. Transp. Syst. 2016, 17, 1415–1427. [Google Scholar] [CrossRef]
- Arcos-García, A.; Soilán, M.; Alvarez-García, J.A.; Belén, R. Exploiting synergies of mobile mapping sensors and deep learning for traffic sign recognition systems. Expert Syst. Appl. 2017, 89, 286–295. [Google Scholar] [CrossRef]
- Jain, A.; Mishra, A.; Shukla, A.; Tiwari, R. A Novel Genetically Optimized Convolutional Neural Network for Traffic Sign Recognition: A New Benchmark on Belgium and Chinese Traffic Sign Datasets. Neural Process. Lett. 2019. [Google Scholar] [CrossRef]
- Gudigar, A.; Chokkadi, S.; Raghavendra, U.; Acharya, U.R. An efficient traffic sign recognition based on graph embedding features. Neural Comput. Appl. 2019, 31, 395–407. [Google Scholar] [CrossRef]
- Cheng, L.; Tong, L.; Wang, Y.; Li, M. Extraction of Urban Power Lines from Vehicle-Borne LiDAR Data. Remote Sens. 2014, 6, 3302–3320. [Google Scholar] [CrossRef]
- Yu, Y.; Li, J.; Guan, H.; Wang, C.; Yu, J. Semiautomated Extraction of Street Light Poles From Mobile LiDAR Point-Clouds. IEEE Trans. Geosci. Remote Sens. 2015, 53, 1374–1386. [Google Scholar] [CrossRef]
- Guan, H.; Yu, Y.; Li, J.; Liu, P. Pole-Like Road Object Detection in Mobile LiDAR Data via Supervoxel and Bag-of-Contextual-Visual-Words Representation. IEEE Geosci. Remote Sens. Lett. 2016, 13, 520–524. [Google Scholar] [CrossRef]
- Yu, Y.; Li, J.; Guan, H.; Wang, C.; Wen, C. Bag of contextual-visual words for road scene object detection from mobile laser scanning data. IEEE Trans. Intell. Transp. Syst. 2016, 17, 3391–3406. [Google Scholar] [CrossRef]
- Wang, J.; Lindenbergh, R.; Menenti, M. SigVox—A 3D feature matching algorithm for automatic street object recognition in mobile laser scanning point clouds. ISPRS J. Photogramm. Remote Sens. 2017, 128, 111–129. [Google Scholar] [CrossRef]
- Rodríguez-Cuenca, B.; García-Cortés, S.; Ordóñez, C.; Alonso, M.C. Automatic detection and classification of pole-like objects in urban point cloud data using an anomaly detection algorithm. Remote Sens. 2015, 7, 12680–12703. [Google Scholar] [CrossRef]
- Yan, L.; Li, Z.; Liu, H.; Tan, J.; Zhao, S.; Chen, C. Detection and classification of pole-like road objects from mobile LiDAR data in motorway environment. Opt. Laser Technol. 2017, 97, 272–283. [Google Scholar] [CrossRef]
- Wu, F.; Wen, C.; Guo, Y.; Wang, J.; Yu, Y.; Wang, C.; Li, J. Rapid localization and extraction of street light poles in mobile LiDAR point clouds: A supervoxel-based approach. IEEE Trans. Intell. Transp. Syst. 2016, 18, 292–305. [Google Scholar] [CrossRef]
- Cabo, C.; Ordoñez, C.; García-Cortés, S.; Martínez, J. An algorithm for automatic detection of pole-like street furniture objects from Mobile Laser Scanner point clouds. ISPRS J. Photogramm. Remote Sens. 2014, 87, 47–56. [Google Scholar] [CrossRef]
- Li, L.; Li, Y.; Li, D. A method based on an adaptive radius cylinder model for detecting pole-like objects in mobile laser scanning data. Remote Sens. Lett. 2016, 7, 249–258. [Google Scholar] [CrossRef]
- Wang, H.; Wang, C.; Luo, H.; Li, P.; Chen, Y.; Li, J. 3-D Point Cloud Object Detection Based on Supervoxel Neighborhood With Hough Forest Framework. IEEE J. Sel. Top. Appl. Earth Obs. Remote Sens. 2015, 8, 1570–1581. [Google Scholar] [CrossRef]
- Teo, T.A.; Chiu, C.M. Pole-Like Road Object Detection from Mobile Lidar System Using a Coarse-to-Fine Approach. IEEE J. Sel. Top. Appl. Earth Obs. Remote Sens. 2015, 8, 4805–4818. [Google Scholar] [CrossRef]
- Xu, S.; Xu, S.; Ye, N.; Zhu, F. Automatic extraction of street trees’ nonphotosynthetic components from MLS data. Int. J. Appl. Earth Obs. Geoinf. 2018, 69, 64–77. [Google Scholar] [CrossRef]
- Guan, H.; Yu, Y.; Ji, Z.; Li, J.; Zhang, Q. Deep learning-based tree classification using mobile LiDAR data. Remote Sens. Lett. 2015, 6, 864–873. [Google Scholar] [CrossRef]
- Huang, P.; Chen, Y.; Li, J.; Yu, Y.; Wang, C.; Nie, H. Extraction of street trees from mobile laser scanning point clouds based on subdivided dimensional features. In Proceedings of the International Geoscience and Remote Sensing Symposium (IGARSS), Milan, Italy, 26–31 July 2015. [Google Scholar]
- Li, L.; Li, D.; Zhu, H.; Li, Y. A dual growing method for the automatic extraction of individual trees from mobile laser scanning data. ISPRS J. Photogramm. Remote Sens. 2016, 120, 37–52. [Google Scholar] [CrossRef]
- Zou, X.; Cheng, M.; Wang, C.; Xia, Y.; Li, J. Tree Classification in Complex Forest Point Clouds Based on Deep Learning. IEEE Geosci. Remote Sens. Lett. 2017, 14, 2360–2364. [Google Scholar] [CrossRef]
- Weinmann, M.; Weinmann, M.; Mallet, C.; Brédif, M. A classification-segmentation framework for the detection of individual trees in dense MMS point cloud data acquired in urban areas. Remote Sens. 2017, 9, 277. [Google Scholar] [CrossRef]
- Qi, C.R.; Su, H.; Mo, K.; Guibas, L.J. PointNet: Deep Learning on Point Sets for 3D Classification and Segmentation. In Proceedings of the IEEE Conference on Computer Vision and Pattern Recognition (CVPR), Honolulu, HI, USA, 21–26 July 2016; pp. 601–610. [Google Scholar] [CrossRef]
- Qi, C.R.; Yi, L.; Su, H.; Guibas, L.J. PointNet++: Deep Hierarchical Feature Learning on Point Sets in a Metric Space. In Proceedings of the 31st Conference on Neural Information Processing Systems, Long Beach, CA, USA, 4–9 December 2017. [Google Scholar]
- Tatarchenko, M.; Dosovitskiy, A.; Brox, T. Octree Generating Networks: Efficient Convolutional Architectures for High-resolution 3D Outputs. In Proceedings of the 2017 IEEE International Conference on Computer Vision (ICCV), Venice, Italy, 22–29 October 2017. [Google Scholar]
- Su, H.; Jampani, V.; Sun, D.; Maji, S.; Kalogerakis, E.; Yang, M.H.; Kautz, J. SPLATNet: Sparse Lattice Networks for Point Cloud Processing. In Proceedings of the IEEE Computer Society Conference on Computer Vision and Pattern Recognition, Salt Lake City, UT, USA, 18–23 June 2018. [Google Scholar]
- Luo, Z.; Li, J.; Xiao, Z.; Mou, Z.G.; Cai, X.; Wang, C. Learning high-level features by fusing multi-view representation of MLS point clouds for 3D object recognition in road environments. ISPRS J. Photogramm. Remote Sens. 2019, 150, 44–58. [Google Scholar] [CrossRef]
- Kumar, B.; Pandey, G.; Lohani, B.; Misra, S.C. A multi-faceted CNN architecture for automatic classification of mobile LiDAR data and an algorithm to reproduce point cloud samples for enhanced training. ISPRS J. Photogramm. Remote Sens. 2019, 147, 80–89. [Google Scholar] [CrossRef]
- Arastounia, M. An Enhanced Algorithm for Concurrent Recognition of Rail Tracks and Power Cables from Terrestrial and Airborne LiDAR Point Clouds. Infrastructures 2017, 2, 8. [Google Scholar] [CrossRef]
- Soni, A.; Robson, S.; Gleeson, B. Extracting Rail Track Geometry from Static Terrestrial Laser Scans for Monitoring Purposes. ISPRS-Int. Arch. Photogramm. Remote Sens. Spat. Inf. Sci. 2014, XL-5, 553–557. [Google Scholar] [CrossRef]
- Collin, B.; Carreaud, P.; Lançon, H. High Efficiency Techniques for the Assessment of Railways Infrastructures and Buildings. Transp. Res. Procedia 2016, 14, 1865–1874. [Google Scholar] [CrossRef][Green Version]
- Lou, Y.; Zhang, T.; Tang, J.; Song, W.; Zhang, Y.; Chen, L. A Fast Algorithm for Rail Extraction Using Mobile Laser Scanning Data. Remote Sens. 2018, 10, 1998. [Google Scholar] [CrossRef]
- Arastounia, M. Automatic Classification of LiDAR Point Clouds in A Railway Environment. Master’s Thesis, University of Twente, Faculty of Geo-Information and Earth Observation, Enschede, The Netherlands, 2012. [Google Scholar]
- Beger, R.; Gedrange, C.; Hecht, R.; Neubert, M. Data fusion of extremely high resolution aerial imagery and LiDAR data for automated railroad centre line reconstruction. ISPRS J. Photogramm. Remote Sens. 2011, 66, S40–S51. [Google Scholar] [CrossRef]
- Neubert, M.; Hecht, R.; Gedrange, C.; Trommler, M.; Herold, H.; Kruger, T.; Brimmer, F. Extraction of Railroad Objects From Very High Resolution Helicopter-Borne Lidar and Ortho-Image Data. ISPRS Int. Arch. Photogramm. Remote Sens. Spat. Inf. Sci 2008, 38, 25–30. [Google Scholar]
- Zhu, L.; Hyyppa, J. The Use of Airborne and Mobile Laser Scanning for Modeling Railway Environments in 3D. Remote Sens. 2014, 6, 3075–3100. [Google Scholar] [CrossRef]
- Al-Bayari, O. Mobile mapping systems in civil engineering projects (case studies). Appl. Geomat. 2019, 11, 1–13. [Google Scholar] [CrossRef]
- Leslar, M.; Perry, G.; McNease, K. Using mobile lidar to survey a railway line for asset inventory. In Proceedings of the American Society for Photogrammetry and Remote Sensing Annual Conference, San Diego, CA, USA, 13 July 2010; pp. 526–533. [Google Scholar]
- Arastounia, M. Automated Recognition of Railroad Infrastructure in Rural Areas from LIDAR Data. Remote Sens. 2015, 7, 14916–14938. [Google Scholar] [CrossRef]
- Arastounia, M.; Elberink, S.O. Application of Template Matching for Improving Classification of Urban Railroad Point Clouds. Sensors 2016, 16, 2112. [Google Scholar] [CrossRef] [PubMed]
- Géron, A. Hands-On Machine Learning with Scikit-Learn; O’Reilly Media, Inc.: Newton, MA, USA, 2017; ISBN 9781491962299. [Google Scholar]
- Luo, C.; Jwa, Y.; Sohn, G. Context based multiple railway object recognition from mobile laser scanning data. In Proceedings of the IEEE Geoscience and Remote Sensing Symposium, Quebec, QC, Canada, 13–18 July 2014; pp. 3602–3605. [Google Scholar] [CrossRef]
- Rizaldy, A.; Persello, C.; Gevaert, C.; Elberink, S.O.; Vosselman, G. Ground and multi-class classification of Airborne Laser Scanner point clouds using Fully Convolutional Networks. Remote Sens. 2018, 10, 1723. [Google Scholar] [CrossRef]
- Kwoczynska, B.; Sagan, W.; Dziura, K. Elaboration and Modeling of the Railway Infrastructure Using Data from Airborne and Mobile Laser Scanning. In Proceedings of the Baltic Geodetic Congress (BGC Geomatics), Gdansk, Poland, 2–4 June 2016; pp. 106–115. [Google Scholar]
- Fischler, M.A.; Bolles, R.C. Random sample consensus: A paradigm for model fitting with applications to image analysis and automated cartography. Commun. ACM 1981, 24, 381–395. [Google Scholar] [CrossRef]
- Elberink, S.; Khoshelham, K. Automatic Extraction of Railroad Centerlines from Mobile Laser Scanning Data. Remote Sens. 2015, 7, 5565–5583. [Google Scholar] [CrossRef]
- Stein, D. Mobile Laser Scanning Based Determination of Railway Network Topology and Branching Direction on Turnouts; KIT Scientific Publishing: Karlsruhe, Germany, 2018. [Google Scholar]
- Stein, D.; Spindler, M.; Lauer, M. Model-based rail detection in mobile laser scanning data. In Proceedings of the IEEE Intelligent Vehicles Symposium, Gothenburg, Sweden, 19–22 June 2016; pp. 654–661. [Google Scholar] [CrossRef]
- Yang, B.; Fang, L. Automated extraction of 3-D railway tracks from mobile laser scanning point clouds. IEEE J. Sel. Top. Appl. Earth Obs. Remote Sens. 2014, 7, 4750–4761. [Google Scholar] [CrossRef]
- Hackel, T.; Stein, D.; Maindorfer, I.; Lauer, M.; Reiterer, A. Track detection in 3D laser scanning data of railway infrastructure. In Proceedings of the 2015 IEEE International Instrumentation and Measurement Technology Conference (I2MTC), Pisa, Italy, 11–14 May 2015; pp. 693–698. [Google Scholar]
- Jeon, W.G.; Choi, B.G. A Study on the Automatic Detection of Railroad Power Lines Using LiDAR Data and RANSAC Algorithm. J. Korean Soc. Surv. Geod. Photogramm. Cartogr. 2013, 31, 331–339. [Google Scholar] [CrossRef][Green Version]
- Pastucha, E. Catenary System Detection, Localization and Classification Using Mobile Scanning Data. Remote Sens. 2016, 8, 801. [Google Scholar] [CrossRef]
- Zhang, S.; Wang, C.; Yang, Z.; Chen, Y.; Li, J. Automatic railway power line extraction using mobile laser scanning data. Int. Arch. Photogramm. Remote Sens. Spat. Inf. Sci. 2016, 41, 615–619. [Google Scholar] [CrossRef]
- Guo, B.; Li, Q.; Huang, X.; Wang, C. An Improved Method for Power-Line Reconstruction from Point Cloud Data. Remote Sens. 2016, 8, 36. [Google Scholar] [CrossRef]
- Fu, L.; Chang, S.; Liu, C. Automatic measuring method of catenary geometric parameters based on laser scanning and imaging. In Proceedings of the 2017 International Conference on Optical Instruments and Technology: Optoelectronic Measurement Technology and Systems, Beijing, China, 28–30 October 2017. [Google Scholar]
- Jung, J.; Chen, L.; Sohn, G.; Luo, C.; Won, J.-U. Multi-Range Conditional Random Field for Classifying Railway Electrification System Objects Using Mobile Laser Scanning Data. Remote Sens. 2016, 8, 1008. [Google Scholar] [CrossRef]
- Wang, Y.; Chen, Q.; Liu, L.; Li, K. A Hierarchical unsupervised method for power line classification from airborne LiDAR data. Int. J. Digit. Earth 2018, 1–17. [Google Scholar] [CrossRef]
- Karagiannis, G.; Olsen, S.; Pedersen, K. Deep Learning for Detection of Railway Signs and Signals. In Science and Information Conference; Springer: Berlin/Heidelberg, Germany, 2019; pp. 1–15. [Google Scholar]
- Marmo, R.; Lombardi, L.; Gagliardi, N. Railway Sign Detection and Classification. In Proceedings of the IEEE Intelligent transportation Systems Conference, Toronto, ON, Canada, 17–20 September 2006. [Google Scholar]
- Agudo, D.; Sánchez, Á.; Vélez, J.F.; Belén Moreno, A. Real-time railway speed limit sign recognition from video sequences. In Proceedings of the International Conference on Systems, Signals, and Image Processing, Bratislava, Slovakia, 23–25 May 2016. [Google Scholar]
- Falamarzi, A.; Moridpour, S.; Nazem, M. A Review on Existing Sensors and Devices for Inspecting Railway Infrastructure. J. Kejuruter. 2019, 31, 1–10. [Google Scholar]
- Minbashi, N.; Bagheri, M.; Golroo, A.; Arasteh Khouy, I.; Ahmadi, A. Turnout Degradation Modelling Using New Inspection Technologies: A Literature Review. Lect. Notes Mech. Eng. 2016, 49–63. [Google Scholar] [CrossRef]
- Blug, A.; Baulig, C.; Wolfelschneider, H.; Hofler, H. Fast fiber coupled clearance profile scanner using real time 3D data processing with automatic rail detection. In Proceedings of the IEEE Intelligent Vehicles Symposium, Parma, Italy, 14–17 June 2004; pp. 658–663. [Google Scholar]
- Mikrut, S.; Kohut, P.; Pyka, K.; Tokarczyk, R.; Barszcz, T.; Uhl, T. Mobile Laser Scanning Systems for Measuring the Clearance Gauge of Railways: State of Play, Testing and Outlook. Sensors 2016, 16, 683. [Google Scholar] [CrossRef]
- Niina, Y.; Honma, R.; Honma, Y.; Kondo, K.; Tsuji, K.; Hiramatsu, T.; Oketani, E. Automatic rail extraction and celarance check with a point cloud captured by MLS in a Railway. Int. Arch. Photogramm. Remote Sens. Spat. Inf. Sci. 2018, 42, 767–771. [Google Scholar] [CrossRef]
- Besl, P.J.; McKay, N.D. A Method for Registration of 3-D Shapes. IEEE Trans. Pattern Anal. Mach. Intell. 1992, 1611, 586–606. [Google Scholar] [CrossRef]
- Chen, P.; Wang, P.; Lauer, M.; Tang, X.; Wang, J. A rail wear measurement method based on structured light scanning. In Proceedings of the 2016 International Conference on Robotics and Machine Vision, Moscow, Russia, 14–16 September 2016. [Google Scholar]
- Sadeghi, J.; Motieyan Najar, M.E.; Zakeri, J.A.; Kuttelwascher, C. Development of railway ballast geometry index using automated measurement system. Measurement 2019, 138, 132–142. [Google Scholar] [CrossRef]
© 2019 by the authors. Licensee MDPI, Basel, Switzerland. This article is an open access article distributed under the terms and conditions of the Creative Commons Attribution (CC BY) license (http://creativecommons.org/licenses/by/4.0/).

