3.1. Brief History, Geology and Geotechnical Investigation
The idea of building an English-French tunnel was initially proposed in 1802. In 1878, the French side started two shafts and a small tunnel [
39]. During the same period in the UK, under the supervision of Edward Watkins, two tunnels were excavated, the first at Abbott, 728 m long and the second at Shakespeare, 1884 m long [
40]. The geology between the two sides of the Strait of Dover is a stratigraphic continuation, and there are two basic continuous structural units identified in the region of the project:
The extension of the Kent basin in the UK part, which is relative undisturbed.
The Sangatte-Quenocs anticline, which consists of significant faults in the French part.
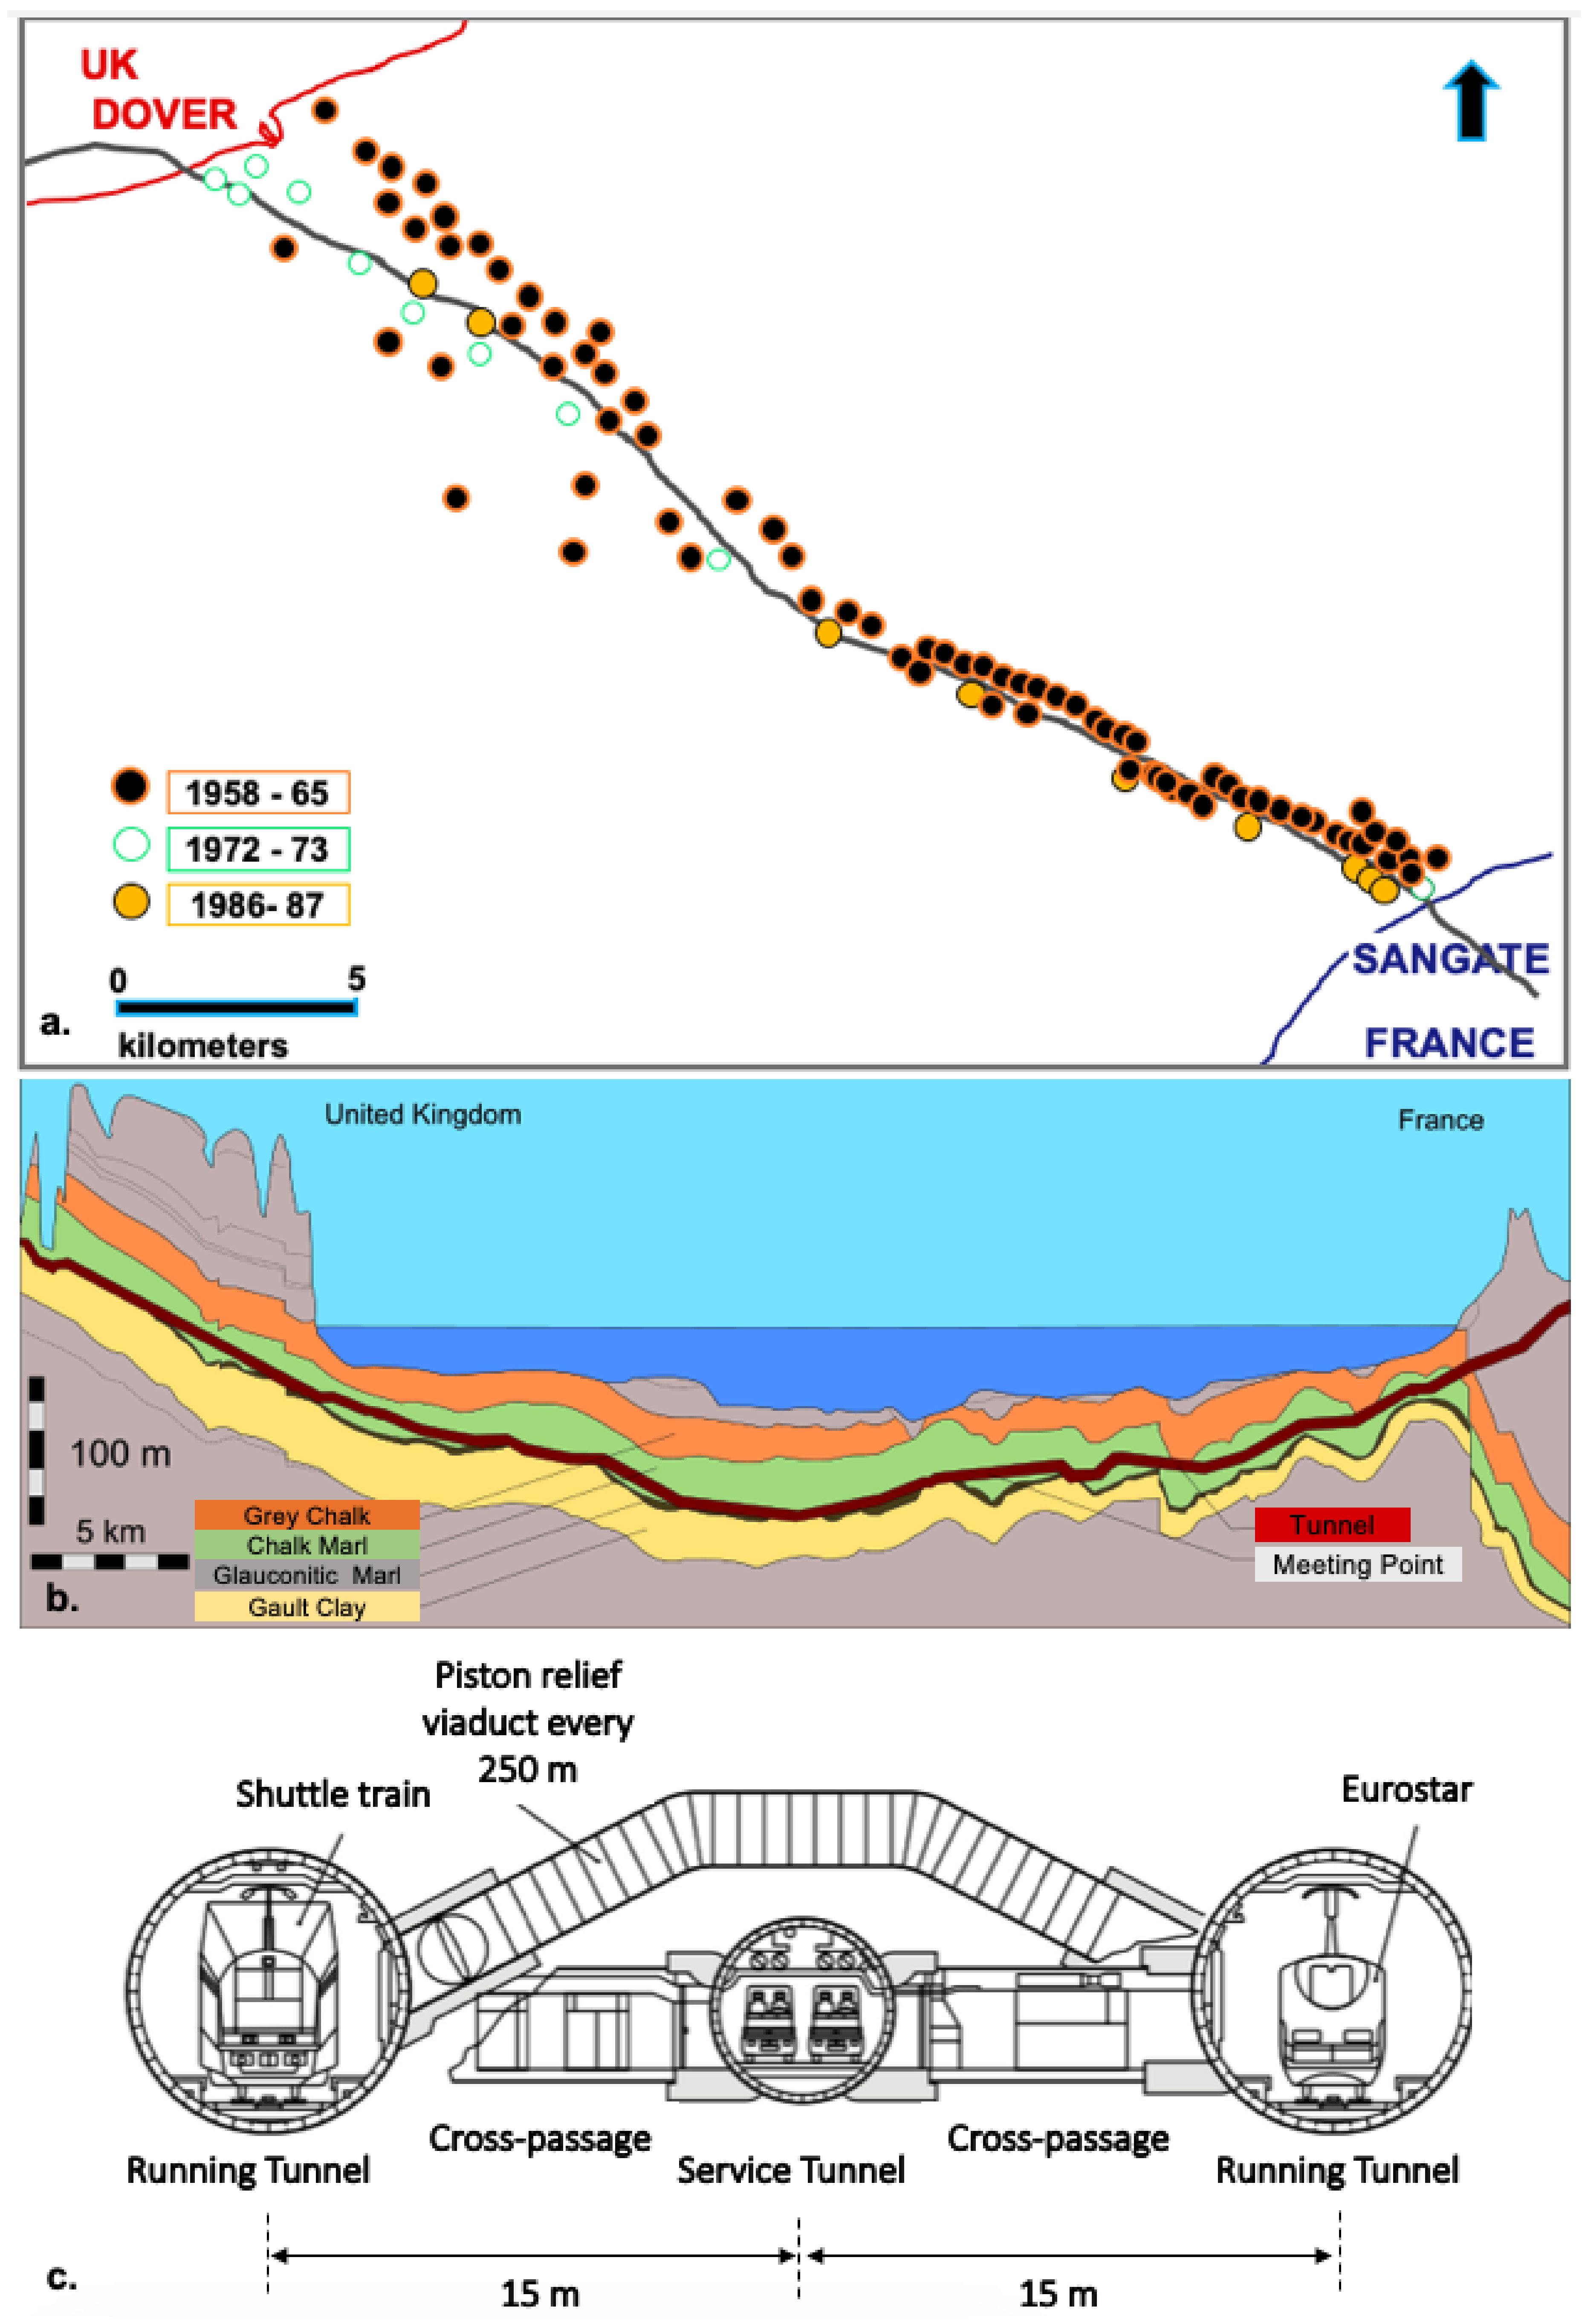
Many geotechnical investigation campaigns took place in the Channel route during a 100-year period. It should be noted that the area between Dove and Sangatte (
Figure 5a) is one of the most detailed investigated areas throughout the history. In total, 116 marine and 70 land boreholes drilled and 4000 km of geophysical surveys took place [
41]. On average, boreholes were drilled per 1 km of the route under the clearly identified geological conditions. In areas with a complex geological structure including faulting, folding and in the absence of outcrops on land, deeper boreholes were drilled reaching the depth of the tunnel [
41]. Deep boreholes were drilled mainly in areas were unfavourable geological conditions were observed. On average, deep exploration boreholes were drilled on the selected route of the Channel tunnel. Down-the-hole logging methods were performed in several of the boreholes drilled in the Channel. In situ testing performed included Verticality (inclinometer) tests, Calliper tests and Packer permeability tests [
41].
The geotechnical investigations campaigns are shown in
Table 2. Four geophysical survey campaigns were also conducted during each period. Seismic profiling produced between 1958 and 1959. Additional surveys were performed in 1964–1965 and in 1972.
In 1974 the excavation of a 2 km pilot tunnel in Shakespeare Cliff was planned to be part of the service tunnel. The project aimed to provide data for the performance of the tunnelling machine and the construction methods that would be used. Unfortunately, the project was aborted, but not before 290 m of access tunnel, 490 m of conveyor adit, 110 m of marshalling tunnel and 260 m of long service tunnel were excavated [
42]. Two large channels infilled of alluvium were also recorded. In Dover, a highly weathered area was investigated. The new era of investigations started in 1986–1988, with the then most updated technology. The last campaign of 1986–1988 improved the already existing data focusing on specific areas of interest such as the top of the Gault Clay, the thickness and permeability of Chalk Marl and its weathering grade. This campaign consists of two exploration phases. Phase I exploration with seismic methods determined the geology at depths between 150 m to 800 m below sea bed. Phase II targeted possible faulted areas [
43]. In Phase II, a seven-borehole program took place in order to minimise the risk in areas of high uncertainty such as Fosse Dangeard, an ancient valley infilled with sediments reaching depths of 80 m below the sea-bed [
42].
According to the authors of reference [
38], three major lithostratigraphic units were identified (
Figure 5b):
The Gault Clay: weak clayey calcareous mudstone susceptible to softening and swelling.
The Glauconitic Marl: due to the sharp contact the unit was easily identified from the underline unit.
The Chalk Marl: a weak grey calcareous mudstone. Chalk Marl was cyclically bedded with material varying from moderately strong (UCS < 50 MPa) in the sponge beds to weak (UCS < 5 MPa) in clay-rich layers. The overlaying Grey Chalk had similar cycles of carbonate-rich and clay-rich beds.
It should be stated that the tunnel was excavated mainly in the Chalk Marl formation. Ground investigations for the Channel tunnel have a long history, and therefore, most of the geological factors were investigated in detail during the various ground investigation campaigns, but especially the last campaign. Despite this extensive work, the Tunnel Boring Machines (TBMs) still ran into adverse, wet and blocky ground, shortly after the Marine Service Tunnel (MST) had commenced. The tunnel design (
Figure 5c) was set up for essentially ’dry conditions’, whereas localised discrete sections of wet, faulted and broken ground was only anticipated on 5% of the total drive length. This required major changes in the design of the TBM system [
44]. More specifically, water inflow was one of the major problems during the tunnel construction. Waterflow ranged from 0 to 100 L/m. Most of the problems faced between 19 to 23 km, with the vicinity of this area recording an inflow of around 20 L/m. Grouting proved a very successful tactic, eliminating the problem in most of the cases. In addition to the water inflows, water salinity (chloride concentrations) was encountered in the face tunnel, mainly in the running tunnels. The importance of high salinity water lies on the effect of lowering the volume of Marl Chalk and was encountered between 20 to 23 km. Shrinkage could lead in reducing of the in-situ stress and end up in opening the discontinuities [
45]. The areas where the most adverse ground conditions encountered were from chainage 20.28 to 23.75 km and the area with chainage from 27.3 to 28.4 km, respectively. In the first area, extensive faulting was present, while in the second, water inflow and overbreak due to the Glauconitic Marl presence was encountered. An anticlinal structure bounded by faults was also recorded from 28.2 to 28.4 km.
In conclusion, according to [
46], the investigations:
Substantially underestimated the length of tunnel which was subject to overbreak.
Did not identify those areas where significant overbreak occurred.
Did not identify the area of consistently high-water inflow between 20 and 24 km, especially in the vicinity of 23 km.
Did not identify the various structural zones along the tunnel route.
Did not identify the effect of minor folding on tunnel stability.
3.2. Data Collection
The dataset developed and further analysed herein have been based on published available data. More specifically, the following key references have been used are shown in
Table 3.
In the above publications, detailed cost and cost breakdown figures for several periods of the Channel tunnel project are presented from the tender phase until the end of construction and during the operation period. In most of the cases, these cost figures are not identical but similar. It should be noted that mainly data presented by [
49] was chosen, since the cost breakdown presented was the most detailed with cost figures taken from pre-construction period (1978) to mid-construction (1990) followed by the end of construction in 1994 until 1998, the fourth year of operation. The summarised financial data was taken from Eurotunnel Rights Issue Document report [
52], as this source was considered the most reliable.
It should also be noted that the geological geotechnical data (i.e., geology, ground investigation campaigns, history, unforeseen ground conditions and construction methods) were taken from data presented by reference [
46].
For the purpose of this research, three types of cost are used and analysed: The Tunnel Cost, the Construction Cost and the Total Cost.
Tunnel Cost (TuC) includes the Target Works cost that covers all tunnelling and related equipment costs including the tunnel boring machines expenditure.
Construction Cost (CC) covers the tunnel cost (TuC), the terminals, rolling stock, bonuses/contingency and the direct cost.
Total Cost (ToC) covers the construction cost (CC) plus the finance related cost, owners cost, finance fees, capital expenditure, net cash flow, inflation and interest reserves.
Detailed cost figures are available for four calendar years: 1987, 1991, 1994 and 1998.
The first, dating from 1987, is the pre-construction cost based on the tender in 1985. This cost is considered an estimate, as in most cases it is a representative percentage of the total cost (ToC) due to the shortage of information and data available at the preliminary design stages. The latter is more evident in tunnelling projects where the uncertainty of the geological medium is the most significant factor that leads in significant deviations from the total cost.
The second cost figure, dating from 1991, is based on the mid-construction year. During this year, the last ground investigation was already conducted along with a considerable percentage of the tunnel construction, in other words cost overruns were running already at this stage of the project. An example of cost overrun for the tunnel construction can be found in the following (Equation (2)):
The third cost figure dates from 1994, during which the construction was finished and the project was operational while the tunnelling cost and construction costs figures were considered to be the final. An example of cost overrun for the total construction can be found in the following (Equation (3)):
In 1998, after four years of the project’s operation, the final cost overrun revealed. An example of cost overrun for the project can be found in the following (Equation (4)):
Pricing figures for these four calendar years were adjusted and revised to 2019 values as described extensively below. The revision to 2019 price figures contributes towards a more realistic comparison under a common reference year (i.e., 2019). The methodology used in this analysis is based on the Case Based Reasoning (CBR) Method. CBR is formed in experience gained by cases, data and information of the past. In this method, it is important to find accurate and precise similarities between a new case and an older one [
54].
Calculating of Inflation Rate and Cost Adjustment in 2019 Price
The cost revision to 2019 pricing also involved calculating effect of inflation. For this purpose, the inflation estimation was made based on the Bank of England estimator. A formula (Equation (5)) is provided below showing how pricing in 1987 is revised and adjusted to 2019 figures. It should be stated that the cost cannot be adjusted to the 2020 price, since the inflation rate is not yet finalised for the current year.
Equation (5) is applicable for costs ranging from £1 to £1 trillion. Equation (6) calculates the Average Inflation (AI) rate between two years (i.e., 1987 and 2019) and takes into consideration deflation as a negative inflation, which can imply that comparisons of price further back in time and over long periods are less accurate than comparisons over short periods in recent years. The average (annual) inflation from 1987 to 2019 was estimated as 3.3% [
55]:
3.3. Cost Analysis
In this section primarily the data from: (a) reference [
49] is used as released from the Eurotunnel for the period from 1987 to 1998 (
Table 4) and (b) reference [
44], regarding the English and French TBM performance shown in
Table 5.
The above data have been further investigated in detail and the following parameters are analysed:
Cost per tunnel diameter.
Cost per excavated distance/length (m).
Cost per cubic meter of excavated material.
Excavation method as a percentage of the total excavated length.
Total cost overrun.
Construction cost overrun.
Tunnelling cost overrun.
Cost overrun adjusted to the 2019 price.
Tunnelling cost as a percentage of the total cost and construction cost.
Ground investigation cost as a percentage of the total cost, construction cost and tunnelling cost both for pre-construction and final price.
Estimation of the impact of higher expenditure of ground investigation in the total cost and in the tunnelling cost, respectively.
These parameters provide a good understanding for the project and in combination with the previous geological investigation campaigns, add value in developing a further understanding on what could have been improved in the planning and execution of this complex project.
In total, 12 TBMs were used to excavate both the English and the French side of the Channel tunnel. The English TBMs excavated 81,924 m, while the French TBMs excavated 63,729 m. In addition to the mechanised excavation methods, conventional methods were used. New Austrian Tunnelling Method (NATM) was used in both sides of the tunnel with the English excavating 2716 m. Approximately the same length was excavated by the French using NATM method. For both sides of the tunnel, multiple TBM diameters were used, ranging from 5.38 m to 8.78 m (
Table 5). The average excavated diameter is 7.59 m. In total, more than 8,167,243 m
3 of material had been excavated from both sides of the Channel tunnel, as shown in
Table 6.
The cost per meter of excavation converted to the 1994 price is £22,052. The average diameter, combining the British and French tunnels, was 7.59 m. After converting this cost to the 2019 price and taking into consideration an average inflation of 3.3% [
54], this amount becomes 43,500 £/m. Compared to the price provided in the literature for other tunnels constructed in the UK (from Case Study: Benchmarking tunnelling costs and production rates in the UK, 2018), the Channel tunnel is more expensive. The average Construction Cost (CC) per tunnel length in the UK is estimated at 32,000 £/m, which is still within the typical range based on published data by the Project Authority shown in
Figure 6a.
The cost per cubic meter of excavated material for this case is estimated at £393.2 as per 1994 and £775.6 as per 2019 (
Table 6). Other tunnels constructed in the UK (Case study: Benchmarking tunnelling cost and production rates in the UK) have a cost that ranges from £274 to £3525 per m
3 (
Figure 6b). Although the cost of excavation per cubic meter has a wide range of values, the Channel tunnel lies in the lower bound of this list. This correlation has a significant limitation, since the comparable projects have a notably lower size than the Channel tunnel project.
According to reference [
56], the NATM method was used in several occasions: in the Shakespeare Underground development, Castle Hill tunnels and UK Crossover, along with other auxiliary works such as pump stations, cross passages, drainage tunnels etc. Thousands of meters were excavated using the NATM method, but the most important was in the Shakespeare Underground development, which served as the-starting point of the tunnel boring machines with a length of 2716 m of tunnels and adits and an additional 2500 m for the French side.
Figure 7a shows that the 96.5% of the tunnel construction was made with TBM, while the rest was completed with the NATM method.
Cost figures from
Table 4 are used to calculate the cost overrun. At this point, it should be noted that the 1987 cost figures are referring to the pre-construction cost as calculated for the tender phase and before the completion of the last ground investigation campaign (1986–1988), while the construction of the tunnels started in 1988 and the project became operational in 1994. The timeline of the project with the important dates is summarised in
Figure 7b.
The Tunnel Construction (TuC) cost is calculated for the period from 1987 to 1994 including the period from tender to completion and operation of the project. For the Total Cost (ToC) of the project, a longer period was required for the overrun calculation since the financial data includes the period from 1994 to 1998, where capital expenditure, finance fees and owner’s costs are taken into consideration. The ToC overrun is calculated at 78%, the CC overrun at 66% and the TuC overrun at 77%, as presented in
Table 4 and shown in
Figure 8. These cost overruns provided an overall notion about the cost of the project. A major part of the overrun is due to the inflation from year to year that raise the cost of the project in an excessive amount. In order to get a better understanding about the “net” cost overrun of the project, the cost figures are adjusted to 2019 price units and the cost overrun are calculated as shown in
Table 7.
The revised ToC overrun plunges to 13%, while the CC overruns at 17% and the TuC at 26%. The cost overruns and the way the cost escalates throughout the years is provided in
Figure 8 (dashed lines). It is important to mention that the ToC cost and the TuC adjustment are made only for the period from 1987 to 1994, since after the completion of the construction these figures did not change in contrast to the overall cost, which continued increasing up to 1998.
In
Figure 9, the TuC is presented as a percentage of the CC and the ToC and it considers both the tender and final costs (1987 and 1994). It is evident that the tunnelling cost increased by almost 3%, both as part of the overall cost and the construction cost after the completion of the project. This is almost £1.4 billion (cost overrun from 1987 to 1994) due to the unforeseen ground conditions. Furthermore, regarding the amount spent on ground investigation, the cost was £17 million as per reference [
38], previously presented in
Table 4. It should be noted that this amount represents only the fourth and final ground investigation campaign. No detailed cost figures were found for the cost of the previous ground investigation campaigns, but an estimation was made based on the data available, which calculates the overall ground investigation campaigns cost to be around £80 million. This amount results from the estimation that each marine borehole costs £0.5 million and each land borehole costs £20,000 based on the 1987 price. For the geophysical surveys, an additional £20 million is estimated to be part of the ToC.
As a percentage of the tunnel construction, the fourth ground investigation accounts for 0.94%, more specifically, it is 0.4% of the ToC and 0.24% of the overall budget (
Figure 10a). The aforementioned rates are calculated as a percentage of the cost of the tender price in 1987. For the 1994 price, these rates become even lower with the ground investigation, covering 0.75% of the TuC, 0.34% of the ToC and 0.21% of the overall project cost (
Figure 10a). As for the overall ground investigation expenditure, this covers 1.13%, 1.87% and 4.4% of the final CC, ToC and TuC, respectively, with the 1987 price (
Figure 10b). For the 1994 price, these percentages decrease to 1%, 1.59% and 3.5%, respectively (
Figure 10b). No calculation was made for the final price of 1998 since the construction had finished in 1994.
In regards to the impact that a higher expenditure would cause to the cost of the project, the analysis was based on Clayton’s data [
57]. In his research, results derived from 51 case studies articulate that cost overruns are common even in areas with uniform geological conditions. This is despite the fact that in most of the cases, the ground investigation is conducted by both consultants and contractors who are familiar with the area of the project and are able to obtain any information potentially needed. Clayton [
57] highlights the fact that designers and contractors never or seldom exploit the geological investigation possibilities, failing thus to produce a sound geological model which leads to unsound tunnel designs and ultimately to cost overruns. Ground investigations expenditure typically covers 1% or even less of the total project cost in the case studies analysed. These percentages, according to reference [
57], lead to overruns of more than 77%.
Figure 11 shows that an optimum expenditure allocated to Ground Investigation (GI) ranges between 5–6% of the total budget and contributes to achieving an overall cost overrun of less than 10%. In the Channel tunnel case, the ToC overrun is estimated to be 66%, shown in
Figure 11, in which the GI is only 1.87% in the tender process as previously observed. The upper bound of the cost overrun is shown in
Figure 11. The case study of Channel tunnel lies on this line with 66% overrun in the ToC. The best fit for the mean trend of this population can be expressed with a logarithmic equation (Equation (7)):
In this trend line, it is also observed that for an expenditure of 1.87% the average cost overrun is 22%. While the upper bound line can be expressed with the (Equation (8)):
The projection of this trend line provides also an estimation of the overruns with higher expenditure on GI based on Clayton’s case studies. Consequently, the Channel tunnel project has a cost overrun above the average trend recorded.
In
Table 8, an estimation of how the additional expenditure in GI would have impacted the CC is presented along with the actual figures of overruns. It is inferred that more than 11% of GI would lead to no difference in the cost overrun.


